Dynamic mutation selection balance as an evolutionary attractor Sidhartha Goyal † , Daniel J. Balick * , Elizabeth R. Jerison ‡ , Richard A. Neher § , Boris I. Shraiman †* , Michael M. Desai ‡ † Kavli Institute for Theoretical Physics, University of California, Santa Barbara, CA * Department of Physics, University of California, Santa Barbara, CA ‡ Departments of Organismic and Evolutionary Biology and of Physics, and FAS Center for Systems Biology, Harvard University, Cambridge MA § Max Planck Institute for Developmental Biology, T¨ ubingen, Germany May 30, 2012 key words: Muller’s ratchet, asexual evolution, dynamic equilibrium running title: Rare beneficial mutations halt Muller’s ratchet Corresponding author: Boris I. Shraiman Kavli Institute for Theoretical Physics University of California Santa Barbara, CA USA, 93106 Tel: 1 805 893 2835 email: [email protected]1 Genetics: Published Articles Ahead of Print, published on June 1, 2012 as 10.1534/genetics.112.141291 Copyright 2012.
Transcript
Dynamic mutation selection balanceas an evolutionary attractor
Sidhartha Goyal†, Daniel J. Balick∗, Elizabeth R. Jerison‡,Richard A. Neher§, Boris I. Shraiman†∗, Michael M. Desai‡
† Kavli Institute for Theoretical Physics,University of California, Santa Barbara, CA
∗ Department of Physics, University of California, Santa Barbara, CA‡ Departments of Organismic and Evolutionary Biology and of Physics,
and FAS Center for Systems Biology, Harvard University, Cambridge MA§ Max Planck Institute for Developmental Biology, Tubingen, Germany
Corresponding author:Boris I. ShraimanKavli Institute for Theoretical PhysicsUniversity of CaliforniaSanta Barbara, CAUSA, 93106Tel: 1 805 893 2835email: [email protected]
1
Genetics: Published Articles Ahead of Print, published on June 1, 2012 as 10.1534/genetics.112.141291
Copyright 2012.
Abstract
The vast majority of mutations are deleterious, and are eliminated by purifying selection. Yet
in finite asexual populations, purifying selection cannot completely prevent the accumulation
of deleterious mutations due to Muller’s ratchet: once lost by stochastic drift, the most-fit
class of genotypes is lost forever. If deleterious mutations are weakly selected, Muller’s ratchet
can lead to a rapid degradation of population fitness. Evidently, the long term stability of an
asexual population requires an influx of beneficial mutations that continuously compensate
for the accumulation of the weakly deleterious ones. Hence any stable evolutionary state
of a population in a static environment must involve a dynamic mutation-selection balance,
where accumulation of deleterious mutations is on average offset by the influx of beneficial
mutations. We argue that such a state can exist for any population size N and mutation rate
U , and calculate the fraction of beneficial mutations, ε, that maintains the balanced state.
We find that a surprisingly low ε suffices to achieve stability, even in small populations in
the face of high mutation rates and weak selection, maintaining a well adaptive population
in spite of Muller’s ratchet. This may explain the maintenance of mitochondria and other
asexual genomes.
2
Introduction
Purifying selection maintains well-adapted genotypes in the face of deleterious mutations
(Haigh, 1978). Yet in asexual populations, random genetic drift in the most-fit class of indi-
viduals will occasionally lead to its irreversible extinction, a process known as Muller’s ratchet
(Muller, 1964; Felsenstein, 1974). The repetitive action of the ratchet leads to the ac-
cumulation of deleterious mutations, despite the action of purifying selection. This ratchet
effect has been extensively analyzed (Gordo and Charlesworth, 2000a,b; Stephan and
Kim, 2002; Charlesworth and Charlesworth, 1997; Gessler, 1995; Jain, 2008) and
has been observed in experiments (Chao., 1990; Duarte et al., 1992; Andersson and
Hughes, 1996; Zeyl et al., 2001) and in nature (Rice, 1994; Lynch, 1996; Howe and
Denver, 2008). In small populations when deleterious mutation rates are high or selection
pressures are weak, the ratchet can proceed quickly, causing rapid degradation of asexual
genomes (Lynch et al., 1993; Gabriel and Burger, 1993; Lynch et al., 1995). Hence
Muller’s ratchet has been described as a central problem for the maintenance of asexual
populations such as mitochondria (Loewe, 2006). Avoiding this mutational catastrophe is
thought to be a major benefit of sex and recombination (see Barton and Charlesworth
(1998) and De Visser and Elena (2007) for reviews).
However, new studies indicate that natural and laboratory asexual populations do not
always melt down as predicted. For example, Silander et al. (2007) recently showed that
even very small laboratory populations of phage with high mutation rates tend towards
fitness plateaus. In addition, a recent comparison of human, chimpanzee, and rhesus Y
chromosomes demonstrated that after an initial period of degradation following the halt of
recombination, gene loss in the human Y chromosome effectively stopped (Hughes et al.,
2012). Finally, theoretical work by Loewe (2006) has revealed several ‘genomic decay para-
doxes’ (i.e. species that persist despite predicted unsustainable genomic decay), including
human mitochondria.
These results argue for a reexamination of the assumptions behind the classic ratchet
3
model. In the absence of recombination (Bell, 1998) or epistasis (Kondrashov, 1994), the
only forces that can check the accumulation of deleterious mutations are back and compen-
satory mutations (Schultz and Lynch, 1997). These mutations are typically assumed to
be rare and are either neglected in models of the ratchet, or assumed to only slightly slow
its rate (Haigh, 1978; Kondrashov, 1995; Bachtrog and Gordo, 2004; Lande, 1998).
However, as most recently discussed by Charlesworth (2012), it is natural to expect that
these back and compensatory mutations become more common as a population declines in
fitness. At a minimum, back mutations that revert deleterious point mutations will cause
the proportion of available beneficial mutations to increase linearly with the accumulation of
these deleterious point mutations. Recent experimental work suggests that the pool of avail-
able compensatory mutations in fact increases even faster than this (Barrick et al., 2010;
Silander et al., 2007). Hence, based on experimental evidence it is reasonable to assume
that the probability a random mutation is beneficial increases with decreasing absolute fit-
ness (Schoustra et al., 2009; Escarmis et al., 1999; Poon and Chao, 2005; Poon et al.,
2005; Estes and Lynch, 2003). Equivalently, but perhaps more intuitively, one expects the
probability that a random mutation is beneficial to decrease with increasing fitness.
Provided that beneficial (back and compensatory) mutation rates do increase as fitness
declines, Muller’s ratchet will eventually come to a halt. Once the fraction of beneficial
mutations is high enough to counter the ratchet, the population will remain in a stable dy-
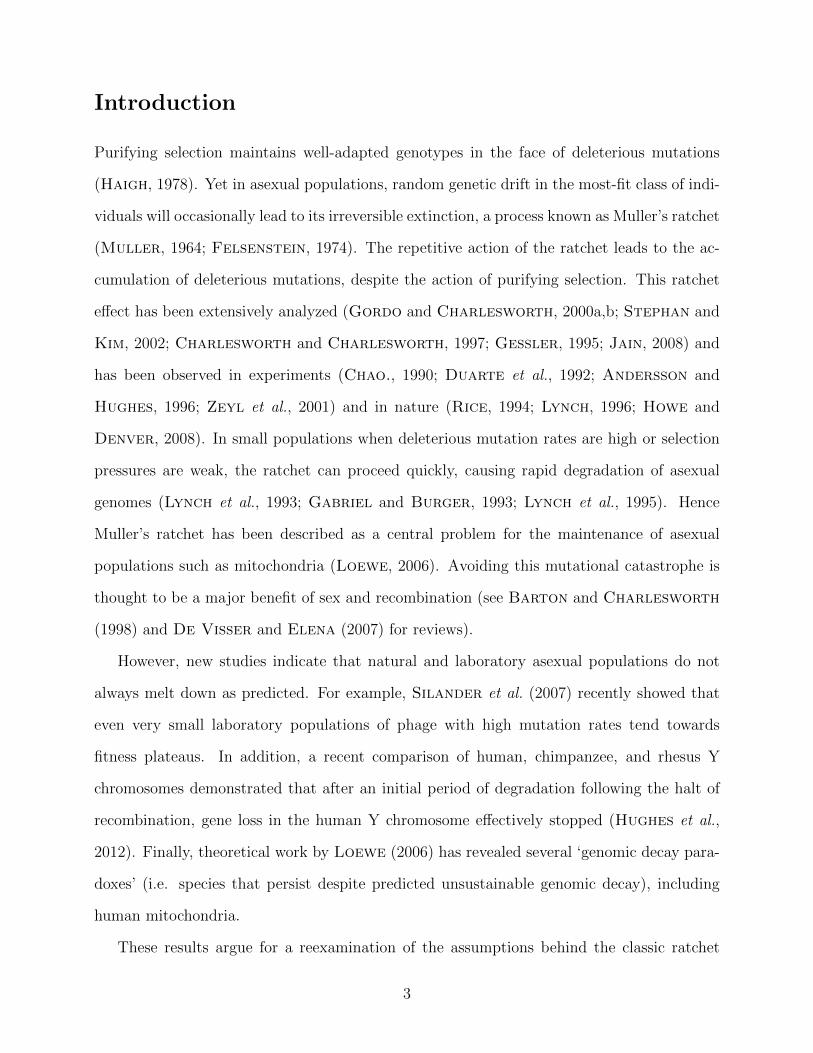
namic equilibrium state, as illustrated in Fig. 1. Qualitatively, we can see that the state is
stable from the following argument: let the critical fraction of beneficial mutations needed
to precisely counter the ratchet and maintain the equilibrium be εc. In a poorly adapted
population, a higher fraction of mutations will be beneficial, ε > εc. This excess of beneficial
mutations will push the population towards higher fitness. At the same time, adaptation
will deplete the available pool of beneficial mutations, until εc is reached, as shown in Fig. 1.
Conversely, in an “over-adapted” population, we expect ε < εc, so that deleterious mutations
dominate, reducing population fitness until εc is recovered. Thus we expect the dynamic
4
mutation-selection balance point to be a stable evolutionary “attractor.” Furthermore, since
back and compensatory mutations are selectively favored, they can balance deleterious mu-
tations even while they are relatively rare, thereby maintaining a well-adapted population.
This mechanism may be responsible for the fitness plateaus observed in the natural and
laboratory populations mentioned above. Moreover, we expect these ‘treadmill’-dynamics,
in which continual fixation of deleterious mutations due to the ratchet is exactly offset by
fixation of back and compensatory mutations, to be the generic null state of an asexual
population under purifying selection. Characterizing this state is an important step towards
predicting the patterns of genetic diversity these populations maintain.
Several earlier studies have considered aspects of this treadmill dynamics in which both
beneficial and deleterious mutations accumulate, including simulations by Antezana and
Hudson (1997), Schultz and Lynch (1997) and Wagner and Gabriel (1990), exper-
imental work by Silander et al. (2007), and a combination of simulations and analytical
work by Rouzine et al. (2003), Rouzine et al. (2008), and Manrubia et al. (2003). The-
oretical work by Poon and Otto (2000) also considered compensatory mutations using
Fisher’s geometrical model, and analytical work by Lande (1998) described alternate fixa-
tion of deleterious and beneficial mutations in small sexual populations. These studies have
all shown that finite populations settle to fitness plateaus in the presence of purifying selec-
tion. However, the nature of this dynamic equilibrium state remains poorly understood: the
critical fraction of beneficial mutations εc, the mean fitness of the population at equilibrium,
and the distribution about that mean all have yet to be characterized.
In this paper, we present a detailed analytical description of the nature of the dynamic
equilibrium mutation-selection balance. Crucially, we decouple the problem of the global
stability of the dynamic balance state (which depends on how the rate of compensatory mu-
tations changes with absolute fitness) from the properties of the dynamic balance state itself.
We accomplish this by treating the probability that a mutation is beneficial as an independent
parameter ε. The dependence of ε on absolute fitness becomes important for the evolutionary
5
Fitness (!)
Bene
ficia
l fra
ctio
n of
mut
atio
ns ("
) ! # ! c ! (U, s, N)c
Adaption!< ! c
!> ! c
!> ! c
!< ! c
Muller’s ratchet
Attractor
Figure 1: The relationship between the fraction of mutations that are beneficial,ε, and the absolute fitness of the population, ω. A poorly adapted population (green)with ω < ωc and ε > εc will adapt towards the dynamic equilibrium “Attractor” state (gray)with higher fitness and lower ε. Conversely, an “over-adapted” population (red) with ω > ωcand ε < εc will decline in fitness towards the dynamic equilibrium state due to Muller’sratchet.
dynamics of the population away from the equilibrium point, but not at the fixed point itself.
This allows us to identify the dynamic balance condition ε = εc and determine how it depends
on population size, mutation rate, and strength of selection, independent of any assumptions
regarding the dependence of ε on absolute fitness. We show that even a very modest rate
of compensatory mutations is sufficient to forestall Muller’s ratchet. Even for remarkably
high mutation rates and small population sizes, dynamic balance can be maintained with
most mutations being deleterious. Muller’s ratchet notwithstanding, selection enables rare
beneficial mutations to compensate for more frequent deleterious mutations, and to maintain
a well adapted population.
6
Model
Our analysis is based on the standard discrete generation Wright-Fisher model with popu-
lation size fixed at N . For the bulk of this paper, we assume that beneficial and deleterious
mutations increase or decrease fitness by the same constant amount s (where s > 0 by con-
vention). In a later section below, we use simulations and bounding analysis to show that
similar behavior occurs when beneficial and deleterious mutations have different fitness ef-
fects. In our simple model with a single s, each individual can be described by its number, k,
of deleterious mutations relative to the perfectly adapted state. We define k to be the mean
number of deleterious mutations per individual, so that an individual with k deleterious mu-
tations has fitness s(k − k) relative to the mean, as shown in Fig. 2. The population can be
characterized by the number of individuals nk in each of these fitness classes. We define U to
be the total mutation rate, and ε to be the fraction of mutations that are beneficial, so that
the beneficial mutation rate is Ub = Uε, and the deleterious mutation rate is Ud = U(1− ε).
Although mutations and genetic drift are stochastic processes, in the bulk of the distri-
bution — where fitness classes contain many individuals — the population dynamics are
well-captured by a deterministic approximation. On average, the number of individuals in
fitness class k evolves as:
dnkdt
= s(k − k)nk︸ ︷︷ ︸I
−Unk︸︷︷︸II
+Udnk−1︸ ︷︷ ︸III
+Ubnk+1︸ ︷︷ ︸IV
. (1)
The terms on the right hand side of this equation describe the different processes acting on
fitness class k: (I) the effect of selection relative to the mean fitness, (II) mutational load, (III)
deleterious mutations from more-fit individuals, and (IV) beneficial mutations from less-fit
individuals. We assume that the selective effect of a single mutation is small, s� 1.
Although we expect that the probability a mutation is beneficial will depend on the
absolute fitness and hence on k, as discussed in the Introduction, we shall assume ε to be
an independent constant parameter. The neglect of the k-dependence of ε is a reasonable
7
approximation because at any given time there will only be a relatively narrow range of k
present in the population. The k dependence of ε becomes important away from the dynamic-
balance point corresponding to the stationary solution of Eq. (1), since on the longer time
scale k and hence the population mean fitness begin to increase or decrease significantly.
This dependence — assuming that ε increases with decreasing absolute fitness — ensures
the global stability of the dynamic balance point, making it an evolutionary attractor. Yet
our approximation that ε is locally constant allows us to accurately compute the εc, and
corresponding distribution nk, at which the population stays on average at a constant fitness.
We have tested this approximation against simulations which introduce k-dependence of ε,
and verified that our characterization of the dynamic equilibrium remains accurate; these
simulations are described in the Supplementary Information.
We also note that by defining fitness relative to the population mean in Eq. (1), as is
standard in Wright-Fisher dynamics, we neglect the possible dependence of population size
on absolute fitness, an effect which could potentially lead to mutational meltdown. We return
to this possibility in the Discussion.
Analysis
In steady state, the fitness distribution nk stays constant on average: dnkdt
= 0 for all k.
Solving Eq. (1) for the steady state in the case of ε = 0 leads to the familiar mutation-
selection balance (Haigh, 1978) with a Poisson distribution of fitness,
nk =Ne−λ
k!λk, (2)
where k = 0 corresponds to the most-fit class. Here we have defined
Figure 2: (A) Schematic illustration of the fitness distribution within a population.We refer to the most-fit class as the “nose” of the distribution. (B) A typical realization ofthe stochastic dynamics at the nose. In the event of extinction of the nose, n1 becomesthe new nose and relative nose fitness decreases by s. Conversely, when a more-fit nose isestablished the relative nose fitness increases by s.
9
This dimensionless ratio is a key parameter that will appear often in the analysis below.
The deterministic approximation (Eq. (1)) corresponds to an infinite population where
Muller’s ratchet (i.e. the stochastic extinction of the fittest genotype) does not operate. In
the absence of such stochastic extinction, any beneficial mutation from the fittest class would
move the distribution towards higher fitness, in conflict with the steady state assumption.
Hence, in infinite populations, steady state can only be achieved with εc = 0. Conversely, in
a finite population where the fittest class can be lost due to genetic drift, Muller’s ratchet
will eventually lead to a decrease in fitness if no beneficial mutations are available. Thus we
must have εc > 0 to be in the dynamic steady state.
A correct description of the dynamic equilibrium state therefore requires a suitable treat-
ment of genetic drift. These stochastic effects are particularly important in the most-fit edge
of the distribution, which we call the “nose,” where the number of individuals with a particu-
lar fitness is small. Our analysis is based on matching a stochastic treatment of the nose with
a deterministic description of the bulk of the fitness distribution (as governed by Eq. (1) with
ε > 0). The stochastic dynamics of the nose are determined by two competing processes:
the random extinction of the most-fit class, versus the establishment of a new more-fit class
due to a beneficial mutation. At stationarity, the rates of these two processes have to be
equal; this condition determines the number of individuals in the nose class. We match this
stochastic condition with the number of individuals in the nose class calculated based on the
deterministic distribution. This determines the critical fraction of beneficial mutations εc as
a function of the population parameters.
The shape of the fitness distribution
We begin with a deterministic analysis of the shape of the fitness distribution at steady state.
Since only relative fitnesses matter, it is convenient to set the origin of k such that the mean
of the fitness distribution is k = λ. In Supplementary Information, we solve for the steady
10
350 300 250 200 150100
102
104
106
108
Fitness class
Num
ber o
f ind
ivid
uals
k = ! k!
SimulationTheory: nk
GaussianPoisson
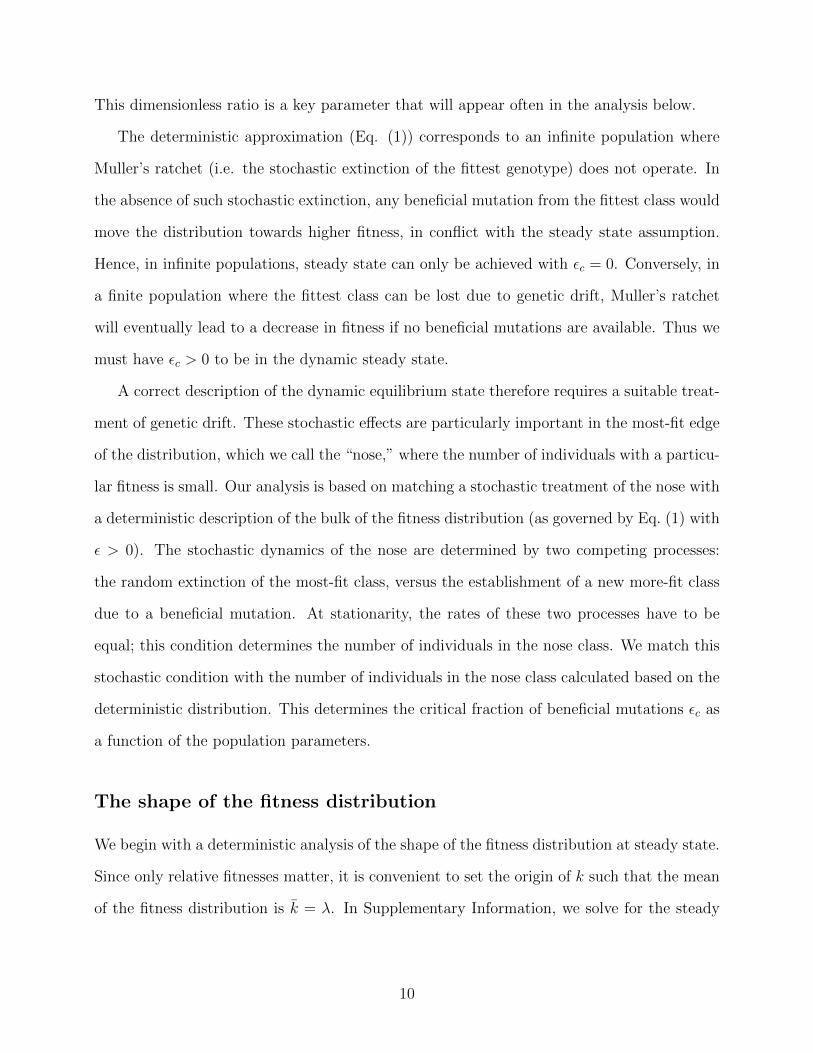
Figure 3: Comparison of the fitness distribution obtained in simulations with theanalytic result Eq. (4) and a Gaussian with equal mean and variance. The simula-tion result is the median fitness distribution observed over 106 generations with parameters:λ = 256, Ns = 1.25× 10⁶ and N = 109.
state of Eq. (1) using Fourier analysis (see SI). We find
nk = Ne−λ(1−2ε)+k log√
1−εε Jk(2α), (4)
where Jk denotes the Bessel function of order k and we have defined α ≡ λ√ε(1− ε). A
comparison of this solution to simulation results is shown in Fig. 3. For k in the vicinity
of k, this distribution is approximately Gaussian with variance σ2k = λ(1 − 2ε). While the
low fitness tail of the distribution decays less rapidly than a Gaussian, the high fitness side
decays more rapidly than a Gaussian.
It is important to note that in the deterministic limit there is no true stationary state
for arbitrary ε > 0; this manifests itself in the loss of positivity of the solution given by
Eq. (4) for high-fitness classes above the position of the nose class. While the position of the
nose, which we will call k?, requires a more careful treatment, Eq. (4) gives a very accurate
11
description of the bulk of the fitness distribution (i.e. nk for k > k?).
To determine the position of the nose, k?, we observe that if classes with k < k? carry
no individuals, fitness class k? does not receive an influx of mutations from the more-fit class
k? − 1. That is, term III in Eq. (1) is absent, yielding (k − k? − λ)nk? + λεnk?+1 = 0. This
along with Eq. (4), gives the following equation for k?:
k?Jk?(2α) = αJk?+1(2α). (5)
This must in general be solved numerically. However, in SI we show that
k? ≈
λ2ε for ελ2 � 1
2λ√ε(1− ε) for ελ2 � 1.
(6)
To gain some intuition into the significance of k?, note that k? = 0 in an infinite population
with εc = 0. In this case, the fitness distribution is the familiar Poisson distribution and
the fittest class contains a fraction e−λ of all individuals. In a finite population, Ne−λ will
be smaller than one for sufficiently large λ = U/s, which implies that at steady state the
mutation free genotype is typically absent and therefore k? is larger than 0. This adjustment
of k? for finite population size is reflected in Eq. (6), which states that the most-fit class gets
closer to the population mean as ε increases.
The stochastic matching condition
We seek to determine the ε = εc at which the distribution is stationary for a given finite
N . Since the most-fit class is populated by a comparatively small number of individuals,
fluctuations due to genetic drift may change its occupancy significantly. In particular, the
population at the nose can go extinct, in which case the next fitness class becomes the new
nose. Alternatively, a lucky beneficial mutation can cause the nose to advance by one class.
Stationarity can therefore only be achieved in an average sense: the rate of advancing the
12
nose has to equal the rate of extinction of the nose.
Since these two processes depend sensitively on the number of individuals in the nose,
requiring the equality of extinction and establishment rates determines the average size of
the population of the nose, nk? , as a function of U , s, and ε. We match this nk? to the
deterministic solution determined above to find εc(N, s, U).
The nature of the dynamics at the nose depends qualitatively on nk? . If nk? is large
enough that its dynamics are dominated by selection, it is rarely lost and Muller’s ratchet is
slow. Conversely, if nk? is small, the class turns over neutrally and is easily lost and reseeded.
We begin by considering the slow ratchet regime where nk? is relatively large, and then turn
to the opposite fast ratchet regime.
Slow ratchet regime. In the regime where nk?s > 1, the fittest class is only rarely lost due
to drift. Note that this regime corresponds to ελ2 < 1, which implies nk? ≈ Ne−λ and k? ≈ 0.
In this regime the mean extinction rate for the nose, r−, is due to rare large fluctuations
which overcome the “restoring force” due to selection trying to preserve mutation selection
balance. Estimates of this extinction rate have been obtained via diffusion theory (Haigh,
1978; Stephan and Kim, 2002; Gordo and Charlesworth, 2000a; Jain, 2008) and have
the form (see SI) r− ≈ e−γsnk?γs√γsnk?/π, where γ is a ”phenomenological” parameter
characterizing the effective strength of selection on the fittest class, introduced by Haigh
(1978) and used in Stephan and Kim (2002); Gordo and Charlesworth (2000a); Jain
(2008) (see below).
To impose our stochastic condition, we must also calculate the rate at which a new more-
fit class establishes, r+. This is given by the product of the rate at which new beneficial
mutants are generated and the probability they establish, r+ = nk?UbPest. Since k? ≈ 0 in
this regime, we have Pest ≈ 2s. Equating the two rates yields the stochastic condition
εc =γ2
2U/s
e−γsNe−λ√
πγsNeλ. (7)
13
This condition suggests that εc in the slow ratchet regime is a function of a combination
of population parameters: λεc(U,N, s)/γ2 ∼ f(γsNe−λ). We find that contrary to earlier
studies (Haigh, 1978; Gordo and Charlesworth, 2000a), constant γ is not consistent
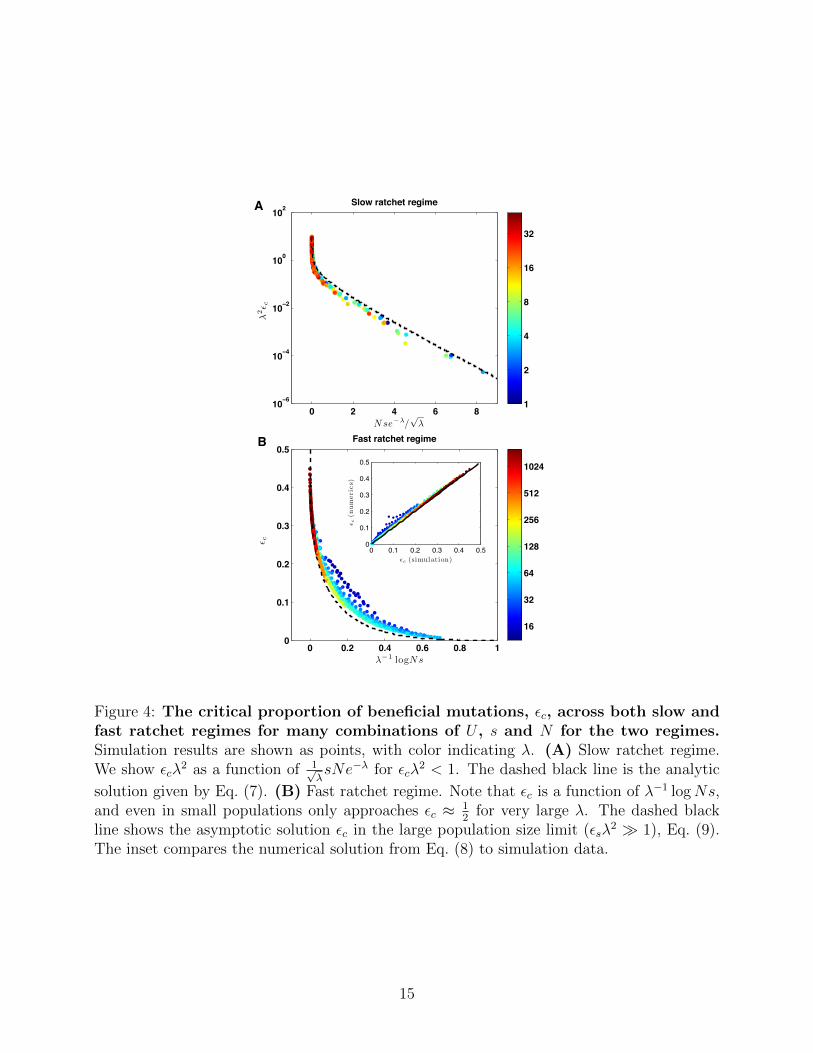
with simulations. Instead, as shown in Fig. 4A, the simulation data in the presented range
is well explained by γ = 1/√λ. This empirical dependence is however consistent with the
approximation γ ≈ 0.6 used by Gordo and Charlesworth (2000a), within the range of
parameters (0.4 . 1/√λ . 0.8) addressed by their study. Since we consider a much broader
range of parameters (0.1 . 1/√λ . 1), accounting for the dependence of γ on U/s becomes
important. Our analytical solution Eq. (7), shown as dotted line in Fig. 4A, is in good
agreement with the simulation data across this wide range of parameters.
In this regime, εc depends exponentially on Nse−λ, and hence rapidly approaches zero as
λ becomes small, approaching the infinite population limit where Muller’s ratchet does not
operate.
Fast ratchet regime. For larger mutation rate, smaller population size, or weaker selec-
tion, the occupancy of the most fit class decreases, thereby increasing its rate of extinction.
Consequently, a higher rate of beneficial mutations (larger ε) is required to match the extinc-
tion rate. The resulting rapid turnover of the population at the nose leads to the failure of
the quasi-static approximation we used in the slow ratchet regime.
As the occupancy of the nose decreases, in particular when nk?s . 1, the dynamics of
the fittest class is governed by drift. The rate of extinction, r−, can therefore be estimated
from neutral diffusion: r− ≈ 1/(2nk?). The rate at which a new more-fit class is established
is given by the same formula as before, r+ = εUnk?Pest. However, Pest now refers to the
probability that a new mutant lineage reaches 12(k?+1)s
individuals. At this point, the lineage
crosses over from stochastic to deterministic dynamics, entering the domain described by
the deterministic solution Eq. (4). Thus Pest = 2(k? + 1)s. Equating r− = r+ yields the
14
0 2 4 6 810 6
10 4
10 2
100
102
N se!!/!
!
!2" c
A Slow ratchet regime
1
2
4
8
16
32
0 0.2 0.4 0.6 0.8 10
0.1
0.2
0.3
0.4
0.5
!!1 logNs
" c
"c (simulation)
" c(n
um
eri
cs)
B Fast ratchet regime
0 0.1 0.2 0.3 0.4 0.50
0.1
0.2
0.3
0.4
0.5
16
32
64
128
256
512
1024
Figure 4: The critical proportion of beneficial mutations, εc, across both slow andfast ratchet regimes for many combinations of U , s and N for the two regimes.Simulation results are shown as points, with color indicating λ. (A) Slow ratchet regime.We show εcλ
2 as a function of 1√λsNe−λ for εcλ
2 < 1. The dashed black line is the analytic
solution given by Eq. (7). (B) Fast ratchet regime. Note that εc is a function of λ−1 logNs,and even in small populations only approaches εc ≈ 1
2for very large λ. The dashed black
line shows the asymptotic solution εc in the large population size limit (εsλ2 � 1), Eq. (9).
The inset compares the numerical solution from Eq. (8) to simulation data.
15
stochastic condition:
nk? ≈1√
4εUsk?. (8)
This condition, together with the solution Eq. (4) for the distribution, allows us to determine
εc(N, s, U). As shown in Fig. 4, our solution Eq. (8) is in excellent agreement with simulations
for most of the data. However, our solution overestimates εc for populations with small
population size and small λ that still satisfy nk?s . 1. A better description in this regime
will require a more careful analysis of fluctuations beyond the nose.
Large population size limit. Large populations can maintain a well adapted genome
with εc � 12
even for moderately large λ. In the limit of large populations and large U/s,
with the limit taken so that εcλ2 � 1 while εc � 1
2, the matching condition reduces to
√εc log εc = λ−1 log
(Nse−λ(1−2εc)
). This equation has the approximate solution
εc ≈z2
log2 [z/ log (z−1)], 2z ≡ 1− logNs
λ. (9)
This result can be made more precise through iteration (see SI for derivations and comparisons
to simulation data). Note here that εc depends only very weakly on Ns and on λ, in contrast
to the slow ratchet regime where εc declines exponentially with Nse−λ.
High mutation rate or weak purifying selection. In this limit, the dynamic equilib-
rium tends towards the state where beneficial and deleterious mutations are equally frequent,
ε = 12. This corresponds to a population that can no longer maintain a well-adapted state.
In the SI, we derive an approximate expression for εc in the fast-ratchet regime in the limit
of large λ:
εc ≈1
2−(
3
4λlogNs
)1/3
. (10)
From this expression we can immediately determine the point at which the population can
no longer maintain a well-adapted state, as defined by a maximum fraction of beneficial
16
mutations, εmax. In order to have εc < εmax, we require
λ
logNs≤ 3
4
[1
0.5− εmax
]3
, (11)
valid for εmax & 0.2. Note that for εmax = 1/4, the RHS of this expression is 48; for
εmax = 1/3, the RHS is 162. Thus even small populations with Ns & 1 can maintain
relatively well-adapted genomes in the face of high mutation rates and weak selection (i.e.
when U � s so that λ� 1).
Different fitness effects for beneficial and deleterious mutations Our analysis to
this point has assumed that both beneficial and deleterious mutations have the same fitness
effect s. However, compensatory mutations often only partially compensate for the cost of
a deleterious mutation. Hence beneficial mutations may tend to have a smaller effect on
fitness than deleterious mutations. The opposite case, where beneficial mutations have larger
effects than deleterious mutations may also be relevant, as weak effect deleterious mutations
accumulate more rapidly and for some effect distributions may dominate. We now consider
the effects of these differences in the fitness effects of beneficial and deleterious mutations.
We denote the effect of a deleterious mutation by sd and the effect of a beneficial mutation
by sb, where by convention both sd and sb are positive.
When sd 6= sb, there still exists a critical value of ε = εc corresponding to a dynamic
equilibrium state, which (provided as always that ε increases as fitness decreases) is globally
stable. However, the shape of the fitness distribution in this equilibrium will be different
from that calculated above, and the critical εc will also change. Fortunately, our analysis of
the single-s model places bounds on this new critical εc that applies for sd 6= sb. To see this,
we first define the εc that corresponds to a particular single-s model (as calculated above)
to be εc(s). Now consider the case sb < sd. The critical εc for this more complex situation
must be less than εc(sb), because stronger-effect deleterious mutations can only decrease εc
(stronger selection against deleterious mutations cannot speed their accumulation). On the
17
other hand, the critical εc must also be greater than εc(sd), because weaker-effect beneficial
mutations can only increase εc. A similar argument leads to analogous bounds for the case
sb > sd.
These simple bounding arguments imply that the critical εc is at most εc(sb) or εc(sd),
whichever is greater. Since we have seen that εc remains small even for remarkably small
s and large U , this can still correspond to a relatively well-adapted state. Provided that
deleterious mutations and the corresponding compensatory mutations do not have widely
differing fitness effects, these bounding arguments also constrain εc to a narrow range. Thus
although the quantitative details of the stable equilibrium state change whenever sb 6= sd,
the main qualitative conclusions of our single-s analysis still apply.
To provide a more precise analysis of how εc depends on both sb and sd, we use simulations
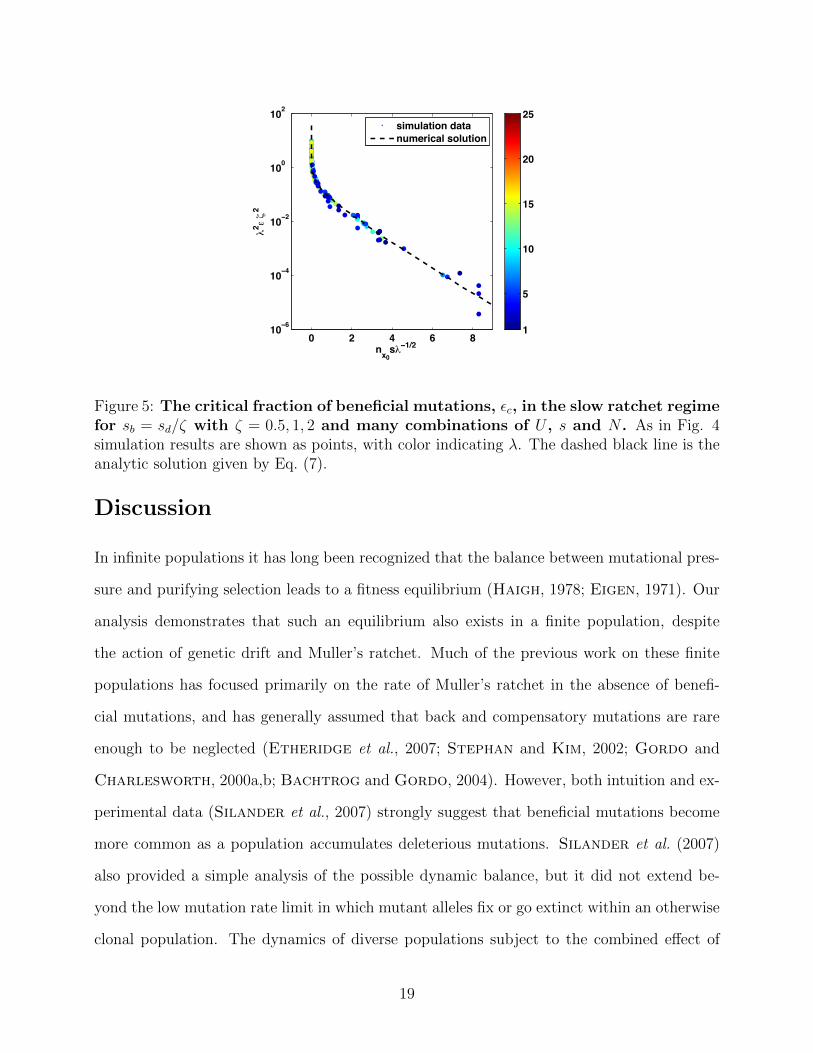
to compare εc for sb = sd/ζ with ζ = 0.5, 1, 2 and show that in the slow ratchet regime
εc(ζ) ≈ ζ2εc(1) demonstrated by the collapse of simulation data for different parameter
values onto the same curve, as shown in Fig. 5. This behavior in the slow ratchet regime is
quite intuitive, as the rate of forward motion of the “nose” increases as s2b . Here one factor
of sb arises from the establishment probability and the other from the size of the forward
step due to each established beneficial mutation. Hence if sb → sb/ζ the rate of beneficial
mutations necessary to maintain dynamic balance must increase by ζ2. Remarkably, this
simple scaling approximation holds well into the crossover to the rapid ratchet regime.
We finally note that of course in general not all beneficial mutations will have the same
fitness effect sb, nor will all deleterious mutations have the same cost sd. Instead, the effect
of any individual mutation will be drawn from some distribution of beneficial or deleterious
fitness effects. The values of sb and sd then represent some weighted average effect of a
beneficial or deleterious mutation. A full analysis of this more complex situation is beyond
the scope of this paper, but we shall return to this issue, qualitatively, in the Discussion
below.
18
0 2 4 6 810−6
10−4
10−2
100
102
nx0sλ−1/2
λ2 ε ζ
2
1
5
10
15
20
25simulation datanumerical solution
Figure 5: The critical fraction of beneficial mutations, εc, in the slow ratchet regimefor sb = sd/ζ with ζ = 0.5, 1, 2 and many combinations of U , s and N . As in Fig. 4simulation results are shown as points, with color indicating λ. The dashed black line is theanalytic solution given by Eq. (7).
Discussion
In infinite populations it has long been recognized that the balance between mutational pres-
sure and purifying selection leads to a fitness equilibrium (Haigh, 1978; Eigen, 1971). Our
analysis demonstrates that such an equilibrium also exists in a finite population, despite
the action of genetic drift and Muller’s ratchet. Much of the previous work on these finite
populations has focused primarily on the rate of Muller’s ratchet in the absence of benefi-
cial mutations, and has generally assumed that back and compensatory mutations are rare
enough to be neglected (Etheridge et al., 2007; Stephan and Kim, 2002; Gordo and
Charlesworth, 2000a,b; Bachtrog and Gordo, 2004). However, both intuition and ex-
perimental data (Silander et al., 2007) strongly suggest that beneficial mutations become
more common as a population accumulates deleterious mutations. Silander et al. (2007)
also provided a simple analysis of the possible dynamic balance, but it did not extend be-
yond the low mutation rate limit in which mutant alleles fix or go extinct within an otherwise
clonal population. The dynamics of diverse populations subject to the combined effect of
19
both deleterious and beneficial mutations has remained understudied (for notable exceptions
see Rouzine et al. (2003, 2008); Pfaffelhuber et al. (2011)).
We have shown that for any population size, mutation rate, and selection pressure, there
exists a proportion of beneficial mutations, εc, which balances the accumulation of deleterious
mutations. Because beneficial mutations are favored by natural selection, a small fraction
beneficial mutation can suffice to maintain stability, εc � 1. We have demonstrated this by
explicitly calculating εc as a function of population size, mutation rate and the strength of
selection. There are two qualitatively different regimes for εc, as shown in Fig. 6. In the
slow ratchet regime, selection stabilizes the fittest subset of the population at the “nose” of
the distribution, so εc is small and depends exponentially on the population parameters Ns
and λ. On the other hand, in the fast ratchet regime, εc must be larger to balance rapid
accumulation of deleterious alleles, and it depends more weakly on the population parameters
Ns and λ. The boundary of the two regimes is roughly given by Nse−λ = 1.
We note that Rouzine et al. (2003) and Rouzine et al. (2008) studied population dy-
namics under the combined action of purifying and positive selection in a model similar to
ours, finding both simulation and analytical evidence for the existence of the dynamic balance
state. However, their analysis focuses on the rate of the ratchet (with ε � εc) or the rate
of adaptation (with ε � εc), and does not apply as ε → εc. Our work, by contrast, focuses
exclusively on the dynamic equilibrium state and the critical εc required to maintain it.
Our analysis treats ε as an independent parameter, even though we expect it to depend
on absolute fitness ω. As discussed above, we expect ε(ω) to decrease with increasing ω.
In this case the steady state corresponding to dynamic balance at εc(N, λ) is stable and
is a global “attractor” point. For ε > εc mean fitness increases (dω/dt > 0), while for
ε < εc mean fitness decreases (dω/dt < 0) which for dε(ω)/dω < 0 guarantees local stability
of the ε = εc equilibrium. While our presentation focused on the properties of dynamic
equilibrium, our approach also defines the actual rate of change of dω/dt = r+ − r− as
a function of instantaneous ε and N (note that, as in Rouzine et al. (2008), in general
20
r± themselves become dependent on this ”velocity”). This quantitative understanding of
differential dynamics, i.e. the rate of change of mean fitness conditional on a given value of
ε, can be integrated for any given ε(ω) defining the corresponding evolutionary trajectory as
a function of time. This consideration can be readily generalized (by allowing N to change
along ω) to include possible reduction in the size of the population that may follow reduction
of absolute fitness. In particular, it is possible that under some conditions the population
will collapse - i.e. “mutational meltdown” will occur - before the stable dynamic equilibrium
is reached (Lynch et al., 1993) (see SI for more extended discussion). The possibility of such
a “meltdown” instability depends critically on precisely how ε depends on ω, and hence on
details of the ecology of the specific system. However, given any specific set of assumptions
about ε(ω), this effect can be analyzed quantitatively in terms of the dynamics formulated
above.
Our analytic results for εc in the dynamic equilibrium were made possible by the explicit
calculation of the shape of the fitness distribution, given in Eq. (4) and illustrated in Fig. 3.
With increasing λ and decreasing N this distribution deviates from the Poisson distribution
for the classic mutation-selection balance (Haigh, 1978), most notably reducing the fitness
of the top class, k?, relative to the mean. Examining the properties of the dynamic mutation-
selection equilibrium over the full parameter range, shown in Fig. 6, has revealed a strong
asymmetry between beneficial and deleterious mutations. For example, for a small population
Ns ∼ 103 with high mutation rate λ ∼ 8, just 2% beneficial mutations are enough to
counteract the effect of deleterious mutations. This indicates that purifying selection is
remarkably effective even for conditions where Muller’s ratchet would proceed extremely
quickly in the absence of back and compensatory mutations.
Populations with ε > εc should adapt, while populations with ε < εc should decline in
fitness. Experimental evolution of model organisms in controlled laboratory environments
appears to be consistent with this expectation. In particular, Silander et al. (2007) showed
that bacteriophage φX174 converged to a population-size dependent fitness plateau, as our
21
1e 10
0.001
0.02
0.05
0.1
0.2
0.3
0.4
102 104 106 108 1010 1012 1014
N s
!Fast ratchet regime
sNe < 1
Slow ratchet regimesNe > 1
HIV0.5%
1.5%1.0%
VSV
E. coli (WT)
E. coli (MUT)
PhageYeast
2
8
32
128
512
2048
Figure 6: The fraction of beneficial mutations εc necessary to maintain the dynamicmutation selection balance in a population with parameters Ns and U/s. Thedotted line separates the slow and fast ratchet regimes. Experiments with various modelorganisms with different population parameters are represented as points.
model would predict. For their population parameters (s ∼ 0.08, U ∼ 0.13) our theory
predicts εc ranging from 2% to 0.2% for their experiments (in which N ranged from 100 to
200) consistent with the beneficial mutation rates they infer. Their experiments with lower
population sizes (N . 30) are in the fast ratchet regime, and estimating εc requires further
analysis of fluctuations beyond the nose.
Other experiments with vesicular stomatitis virus found that large populations adapt
while small populations melt, also consistent with our analysis (Moya et al., 2000). Similar
results have been observed in yeast (Lang et al., 2011; Desai et al., 2007). In the long-
term evolution experiments of Lenski and collaborators in E. coli, parameters are such that
we expect the critical εc to be very small, εc � 10−10, consistent with their observation
of continuous adaptation even after tens of thousands of generations. On the other hand,
mutator strains of E. coli (Trindade et al., 2010) and yeast (Desai et al., 2007) sometimes
show decrease in fitness, which could be used to further test the model. In Fig. 6, we
22
show rough estimates for the parameter regimes in which each of these experimental systems
lie. For example, population parameters for HIV seem to place it close to the boundary
between the slow and fast ratchet regimes (Fig. 6), so that its evolutionary dynamics depend
sensitively on the strength of selection.
While a global “phase diagram” of population dynamics is highly intriguing, our present
attempt to construct it highlights the challenge of doing so. First, our analysis has assumed
that all mutations have the same selective effect s. In general, however, mutations have
a range of selective effects. Mutations with a particular characteristic strength may tend
to dominate the dynamics, if more strongly selected mutations are quickly eliminated by
selection while more weakly selected mutations are effectively neutral given interference from
selection on the other mutations. Thus, our λ parameter must be regarded as an effective
parameter corresponding to mutations with effect strength that dominate the balance. The
possibility of defining such an effective λ in the model of Muller’s Ratchet with deleterious
effects of different size has been discussed by Soderberg and Berg (2007) on the basis
of numerical simulations. Yet the general description of interference within an arbitrary
distribution of (deleterious and beneficial) mutational effects that would provide a precise
definition of effective λeff remains an open problem and an important avenue for future
work. Second, our analysis has focused on asexual populations, and neglected recombination.
Since even weak recombination has the potential to significantly slow Muller’s ratchet, it
would be interesting to generalize our dynamic balance to include its effects (Bell, 1998;
Gordo and Campos, 2008). Increasing recombination rates would presumably allow the
population to maintain better-adapted genotypes in this steady state. Last but not least,
better experimental characterization of mutation effect distributions for different organisms
will be needed to fully achieve the synthesis attempted in Fig. 6.
The dynamic balance state has important implications for patterns of molecular evolu-
tion. Recent analysis of the effects of purifying selection on the structure of genealogies has
suggested that Muller’s ratchet plays a crucial role in determining the structure of genetic
23
variation in asexual populations or on short distance scales in the genomes of sexual organ-
isms (Gordo et al., 2002; Seger et al., 2010). However, these expectations must be revised
if populations exist instead in the dynamic state in which both beneficial and deleterious
mutations fix, without any continuous net degradation or growth of fitness. This means that
even though no change in fitness occurs, signatures of both positive and negative selection are
likely to be found in patterns of molecular evolution, as has been suggested by earlier studies
(Hartl and Taubes, 1996; Antezana and Hudson, 1997). We argue that this state is
the natural null expectation for the effects of mutations and purifying selection on patterns
of genetic variation; efforts to look for positive selection which represent “true” adaptation
should look for deviations from this situation.
Finally, we note that although the dynamic balance we have analyzed is stable, a pop-
ulation will typically fluctuate around this steady state. A few beneficial mutations may
become established at the nose by chance, leading to a temporary increase in mean fitness
which is later balanced by a reduction in ε at this higher fitness, restoring the population to
the equilibrium state. Conversely, a few clicks of Muller’s ratchet will occasionally lead to
temporary reductions in population fitness before the corresponding increase in ε restores the
steady state. These fluctuations around the dynamic balance may be important to the clonal
structure of the population, and hence are likely to play a key role in patterns of molecular
evolution and in understanding the effects of recombination.
Materials and Methods
Simulation methods. Our simulations are done using a custom written Python code
available on request. We implement a discrete time Wright-Fisher model where the popula-
tion is represented by a vector nk with elements corresponding to the number of individuals
in fitness class k. Each generation consists of separate selection and mutation steps. To
implement selection, the vector nk is multiplied by es(k−k)−α to obtain a vector nk containing
24
the expected number of offspring in class k. Here (k − k) is the fitness of class k relative to
the population mean, and α =∑nk−NN
maintains an approximately constant population size
around N .
Our model is simplified by using beneficial and deleterious mutation with effect ±s and
mutation rate Uε and U(1 − ε), respectively. To implement mutation, we calculate the
probability P (i, j) of a genome being hit by i beneficial and j deleterious mutations, which
are Poisson distributed. This mutation matrix is then applied to nk, i.e. the parts of nk
are moved up or down according to the net number of mutations they accrued in this time
step. Having constructed the expected number of individuals in fitness class k after selection
and mutation, we draw a population sample from each class from a Poisson distribution. If
necessary, the population is re-centered in the discrete vector nk. This prevents occupied
classes from running off the grid due to accumulated increase or decrease in their absolute
fitness.
The above process is repeated for a specified number of generations. The speed of adap-
tation, v, (i.e. the rate of change of population averaged fitness) and other features of the
dynamics are measured after an equilibration time to remove transient effects from the initial
conditions. In the parameter regimes studied, we found that 104 generations was generally
sufficient for establishing a steady ”traveling wave” with velocity v dependent on ε and other
parameters.
To solve for εc(U,N, s), we re-run the simulation while iteratively adjusting ε to get v as
close to zero as possible. Since v is a fluctuating quantity, εc can only be determined with
limited accuracy, but this can be improved by increasing the number of generations for each
run.
We have also run simulations in which ε increases with decreasing fitness (i.e. assuming
εk = ε0 − ck where c is a small constant) to demonstrate that the population indeed evolves
towards the values of k such that the ”nose” of the distribution is at the appropriate εc for
local dynamical balance.
25
Acknowledgments
We thank Pierre Neveu, Adel Dayarian, Aleksandra Walczak and Paul Sniegowski for many
useful discussions. SG, DB and BIS were supported by NIGMS and HFSP. ERJ acknowl-
edges support from an NSF graduate research fellowship. RAN is supported by the ERC
through grant StG-2010-260686. MMD acknowledges support from the James S. McDonnell
Foundation, the Alfred P. Sloan Foundation, and the Harvard Milton Fund.
26
References
Andersson, D., and D. Hughes, 1996 Muller’s ratchet decreases fitness of a dna-basedmicrobe. Proc. Natl. Acad. Sci. 93: 906–907.
Antezana, M., and R. Hudson, 1997 Point-mutations, the ratchet, and the initial successof eukaryotic sex: a simulation study. Evolutionary Theory and Review 11: 209–235.
Bachtrog, D., and I. Gordo, 2004 Adaptive evolution of asexual populations undermuller’s ratchet. Evolution Int. J. Org. Evolution 58: 1403–1413.
Barrick, J., M. Kauth, C. Strelioff, and R. Lenski, 2010 Escherichia coli rpobmutants have increased evolvability in proportion to their fitness defects. Molecular Biologyand Evolution 27: 1338–1347.
Barton, N., and B. Charlesworth, 1998 Why sex and recombination? Science 281:1986–1990.
Bell, G., 1998 Recombination and the immortality of the germ line. J. Evol. Biol. 1: 67–82.
Chao., L., 1990 Fitness of rna virus decreased by muller’s ratchet. Nature 348: 454 – 455.
Charlesworth, B., 2012 The effects of deleterious mutations on evolution at linked sites.Genetics 190: 5–22.
Charlesworth, B., and D. Charlesworth, 1997 Rapid fixation of deleterious allelescan be caused by muller’s ratchet. Genetical Research 70: 63–73.
De Visser, J., and S. Elena, 2007 The evolutionof sex: empirical insights into the rolesof epistasis and drift. Nature Reviews Genetics 8: 139–149.
Desai, M. M., D. S. Fisher, and A. W. Murray, 2007 The speed of evolution andmaintenance of variation in asexual populations. Current Biology 17: 385–394.
Duarte, E., D. Clarke, A. Moya, E. Domingo, and J. Holland, 1992 Rapid fitnessloss in mammalian rna virus clones due to muller’s ratchet. Proc. Natl. Acad. Sci. 89:6015–6019.
Eigen, M., 1971 Selforganization of matter and the evolution of biological macromolecules.Naturwissenschaften 58: 465–523.
Escarmis, C., M. Davila, and E. Domingo, 1999 Multiple molecular pathways for fitnessrecovery of an rna virus debilitated by operation of muller’s ratchet. Journal of MolecularBiology 285: 495–505.
Estes, S., and M. Lynch, 2003 Rapid fitness recovery in mutationally degraded lines ofcaenorhabditis elegans. Evolution 57: 1022–1030.
Etheridge, A., P. Pfaffelhuber, and A. Wakolbinger, 2007 How often does theratchet click? facts, heuristics, asymptotics. arXiv 0709.2775v1.
27
Felsenstein, J., 1974 The evolutionary advantage of recombination. Genetics 78: 157–159.
Gabriel, W., and R. Burger, 1993 Muller’s ratchet and mutational meltdowns. Evolution47: 1744–1757.
Gessler, D., 1995 The constraints of finite size in asexual populations and the rate of theratchet. Genetical Research 49: 135–146.
Gordo, I., and P. Campos, 2008 Sex and deleterious mutations. Genetics 179: 621–6.
Gordo, I., and B. Charlesworth, 2000a The degeneration of asexual haploid populationsand the speed of muller’s ratchet. Genetics 154: 1379–1387.
Gordo, I., and B. Charlesworth, 2000b On the speed of muller’s ratchet. Genetics 156:2137–2140.
Gordo, I., A. Navarro, and B. Charlesworth, 2002 Muller’s ratchet and the patternof variation at a neutral locus. Genetics 161: 835–848.
Haigh, J., 1978 The accumulation of deleterious genes in a population. Theor. Popul. Biol.14: 251–26.
Hartl, D., and C. Taubes, 1996 Compensatory nearly neutral mutations: Selection with-out adaptation. Journal of Theoretical Biology 182: 303–309.
Howe, D., and D. Denver, 2008 Muller’s ratchet and compensatory mutation incaenorhabditis briggsae mitochondrial genome evolution. BMC Evolutionary Biology 8:62.
Hughes, J. F., H. Skaletsky, L. G. Brown, T. Pyntikova, T. Graves, et al.,2012 Strict evolutionary conservation followed rapid gene loss on human and rhesus ychromosomes. Nature 483: 82–86. 10.1038/nature10843.
Jain, K., 2008 Loss of least-loaded class in asexual populations due to drift and epistasis.Genetics 179(4): 2125–34.
Kondrashov, A., 1994 Muller’s ratchet under epistatic selection. Proc. Natl. Acad. Sci.136: 1469–1473.
Kondrashov, A., 1995 Contamination of the genome by very slightly deleterious mutations:why have we not died 100 times over? Journal of Theoretical Biology 175: 583–594.
Lande, R., 1998 Compensating for our load of mutations: freezing the meltdown of smallpopulations. Genetica 102/103: 21–27.
Lang, G. I., D. Botstein, and M. M. Desai, 2011 Genetic variation and the fate ofbeneficial mutations in asexual populations. Genetics 188: 647–661.
Loewe, L., 2006 Quantifying the genomic decay paradox due to muller’s ratchet in humanmitochondrial dna. Genet. Res., Camb. 87: 133–159.
28
Lynch, M., 1996 Mutation accumulation in transfer rnas: molecular evidence for muller’sratchet in mitochondrial genomes. Molecular Biology and Evolution 13: 209–220.
Lynch, M., R. Burger, D. Butcher, and W. Gabriel, 1993 The mutational meltdownin asexual populations. J. Hered. 84: 339–344.
Lynch, M., J. Conery, and R. Burger, 1995 Mutation accumulation and the extinctionof small populations. The American Naturalist 146: 489–518.
Manrubia, S. C., E. Lazaro, and J. Perez-Mercader, 2003 Fitness distributions inexponentially growing asexual populations. Physical Review Letters 90(18): 188102.
Moya, A., S. F. Elena, A. Bracho, R. Miralles, and E. Barrio, 2000 The evolutionof rna viruses: A population genetics view. PNAS 97: 6967–6973.
Muller, H., 1964 The relation of recombination to mutational advance. Mutat. Res. 1:2–9.
Pfaffelhuber, P., P. R. Staab, and A. Wakolbinger, 2011 Muller’s ratchet withcompensatory mutations. arXiv 1108.4059v1.
Poon, A., and L. Chao, 2005 The rate of compensatory mutation in the dna bacteriophageφx174. Genetics 170: 989–999.
Poon, A., B. Davis, and L. Chao, 2005 The coupon collector and the suppressor mutation:Estimating the number of compensatory mutations by maximum likelihood. Genetics 170:1323–1332.
Poon, A., and S. Otto, 2000 Compensating for our load of mutations: Freezing themeltdown of small populations. Evolution 54: 1467–1479.
Rice, W., 1994 Degeneration of a nonrecombining chromosome. Science 263: 230–232.
Rouzine, I., E. Brunet, and C. Wilke, 2008 The traveling-wave approach to asexualevolution: Muller’s ratchet and speed of adaptation. Theor. Popul. Biol. 73: 24–46.
Rouzine, I., J. Wakeley, and J. Coffin, 2003 The solitary wave of asexual evolution.Proc. Natl. Acad. Sci. 100: 587–592.
Schoustra, S., T. Bataillon, D. Gifford, and R. Kassen, 2009 The properties ofadaptive walks in evolving populations of fungus. PLoS Biology 7: e1000250.
Schultz, S., and M. Lynch, 1997 Deleterious mutation and extinction: The role of variablemutational effects, synergistic epistasis, beneficial mutations, and degree of outcrossing.Evolution 51: 1363–1371.
Seger, J., W. A. Smith, J. J. Perry, J. Hunn, Z. A. Kaliszewska, et al., 2010 Genegenealogies strongly distorted by weakly interfering mutations in constant environments.Genetics 184: 529–545.
29
Silander, O., O. Tenaillon, and L. Chao, 2007 Understanding the evolutionary fate offinite populations: the dynamics of mutational effects. PLoS Biol. 5: e94.
Soderberg, R., and O. Berg, 2007 Mutational interference and the progression of muller’sratchet when mutations have a broad range of deleterious effects. Genetics 177(2): 971–86.
Stephan, W., and Y. Kim, 2002 Recent Applications of Diffusion Theory to PopulationGenetics . Oxford University Press, Oxford, UK, 72–93.
Trindade, S., L. Perfeito, and I. Gordo, 2010 Rate and effects of spontaneous muta-tions that affect fitness in mutator escherichia coli. Philosophical Transactions of the RoyalSociety B: Biological Sciences 365: 1177–1186.
Wagner, G., and W. Gabriel, 1990 Quantitative variation in finite parthenogenetic pop-ulations: What stops muller’s ratchet in the absence of recombination? Evolution 44:715–731.
Zeyl, C., M. Mizesko, and J. de Visser, 2001 Mutational meltdown in laboratory yeastpopulations. Evolution 55.