Dynamic Resource Management in Dynamic Resource Management in Core Networks J f M H El i h iUi it fL d Jaafar M. H. Elmirghani, University of Leeds j m h elmirghani@leeds ac uk j.m.h.elmirghani@leeds.ac.uk
Transcript
Dynamic Resource Management inDynamic Resource Management in Core Networks
J f M H El i h i U i it f L dJaafar M. H. Elmirghani, University of Leeds
• Dynamic adaptation to available renewable energy
• Optimum placement of data centres and content
• Dynamic content caching
• Dynamic peer-to-peer content distribution
• Future directions
2
E d t d t kEnd-to-end network
3
“Hybrid-power” IP over WDM network architecture
4
The ScenarioThe Scenario
Distance between two neighbouring EDFAs 80 (km)Capacity of each wavelength (B) 40 (Gb/s)Power consumption of a router port (PR) 1000 (W)Power consumption of a transponder (PT) 73 (W)Power consumption of an EDFA (PE) 8 (W)Power consumption of an optical switch (PO) 85 (W)Power consumption of a multiplexer/demultiplexer(PMD)
16 (W)
5
(PMD)
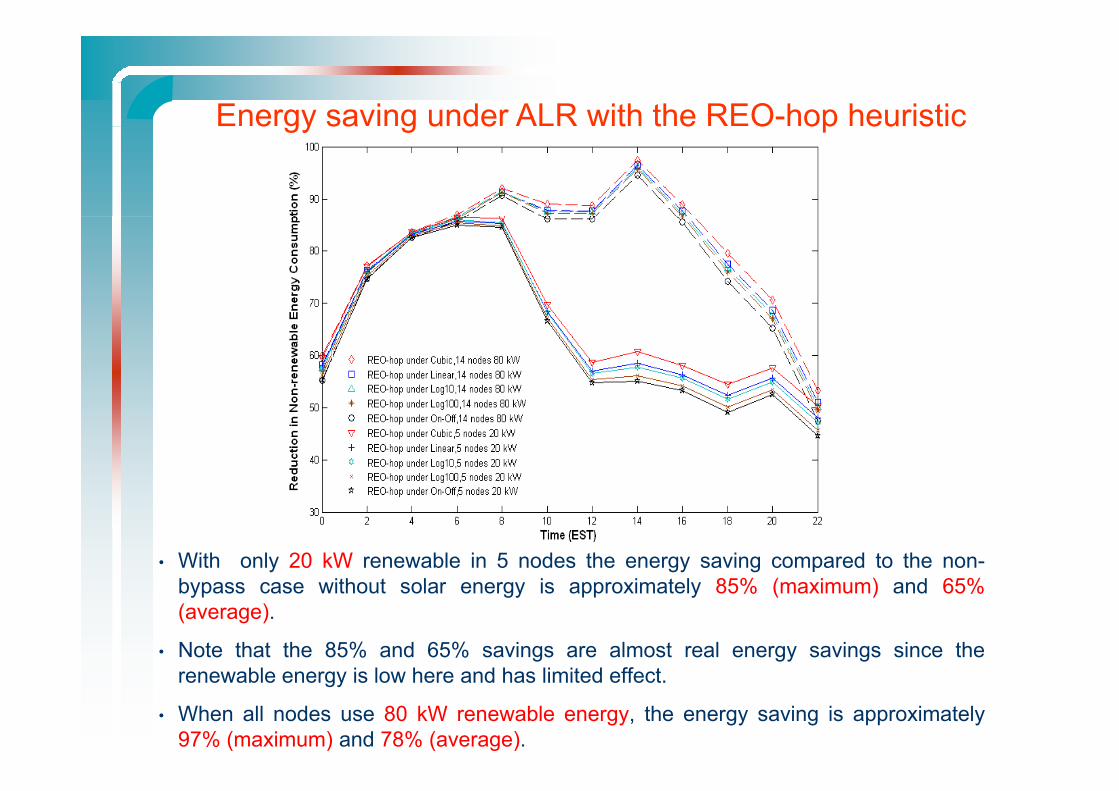
Energy saving under ALR with the REO-hop heuristice gy sa g u de t t e O op eu st c
• With only 20 kW renewable in 5 nodes the energy saving compared to the non-bypass case without solar energy is approximately 85% (maximum) and 65%(average).
• Note that the 85% and 65% savings are almost real energy savings since therenewable energy is low here and has limited effect.
• When all nodes use 80 kW renewable energy, the energy saving is approximately97% (maximum) and 78% (average).
• Three problems are investigated:
Network design with data centres, energy-efficiencyThree problems are investigated:
• Firstly, the optimization, Linear Programming (LP), of the data centreslocations to minimize the Power consumption.
Investigate the IP over WDM routing approach (bypass and non– Investigate the IP over WDM routing approach (bypass and non-bypass), the regularity of the network topology and the number ofdata centres in the network.
Secondly we investigate the energy savings introduced by• Secondly, we investigate the energy savings introduced byimplementing a data replication scheme in the IP over WDM networkwith data centres, where frequently accessed data objects are replicatedover multiple data centres according to their popularityover multiple data centres according to their popularity.
• Thirdly, we investigate introducing renewable energy sources (wind andsolar energy) to the IP over WDM network with data centres.
W l t th it f t ti bit t h bl– We evaluate the merits of transporting bits to where renewableenergy is (wind farms), instead of transporting renewable energy towhere data centres are.
f
7
– We consider the impact of the electrical power transmission losses,network topology, routing, traffic.
D t t i IP WDM t kData centres in an IP over WDM network
8
Summary of power savings as a result of data centreSummary of power savings as a result of data centre location optimisation
Topology Data centre Data centreTopology Data centre traffic only
Data centre traffic and regular traffic
I l t l d th b 37% 11%Irregular topology under the non-bypassheuristic
37% 11%
Irregular topology under the multi-hop 17% 6.3%bypass heuristicNSFNET topology with a single data centre under the non-bypass heuristic
26.6% 12.7%yp
NSFNET topology with a single data centre under the multi-hop bypass heuristic
8.6% 4.6%
NSFNET topology with 5 data centres under 11 4% 4 4%NSFNET topology with 5 data centres under the non-bypass heuristic
11.4% 4.4%
NSFNET topology with 5 data centres under h l i h b h i i
6.5% 1.7%
9
the multi-hop bypass heuristic
Data replication in IP over WDM networks with data centresData replication in IP over WDM networks with data centres
• Large operators have multiple data g p pcentres.
• Content (that has different popularity) can be replicated to reduce delay and power consumption.
• A MILP model is developed to optimize the selection of data centres to replicate data objects under the lightpath bypass approach DC & regular trafficlightpath bypass approach.
• A Zipf distribution is assumed for content popularity.
gNon-bypass:
LP optimal DC nodes =
• With 5 data objects, the popularities are: 43.7%, 21.8%, 14.5%, 10.9%
d 9%
(5,6,8,10,13)
LP determines where each
10
and 9%. object is replicated
Power saving=28%
Renewable energy in IP over WDM networks with data centres• We compare moving bits to where renewable energy is (wind farms) to
transporting renewable energy to data centres.
Renewable energy in IP over WDM networks with data centres
p g gy• We have selected only 3 wind farms based on their location and
maximum output power to power the data centres in the network: 1) WF1: Cedar Creek Wind Farm, 2) WF2: Capricorn Ridge Wind Farm,WF1: Cedar Creek Wind Farm, 2) WF2: Capricorn Ridge Wind Farm, 3) WF3: Twin Groves Wind Farm in blue. The maximum output power of the three wind farms is 300MW, 700 MW and 400 MW, respectively.
• We assume the transmission power loss is 15% per 1000km [25] andWe assume the transmission power loss is 15% per 1000km [25] and the percentage of the power of wind farms allocated to data centres is assumed to be 0.3%.
• The cooling & lighting power consumption of a typical data centre is
Data centre, computing, cooling and lighting power usage
• The cooling & lighting power consumption of a typical data centre is150-200W/ft2. Assuming a 3500ft2 data centre, the total powerconsumed in a typical data centre for cooling is 700kW and thecomputing power consumption in a data centre is assumed to becomputing power consumption in a data centre is assumed to be300kW which is typical for this data centre size.
The power allocated by a wind farm to a data centre is known and is• The power allocated by a wind farm to a data centre is known and isassumed here to be 1.4MW. This corresponds to a power usageefficiency (PUE) of 2 which is typical for a data centre.
• The renewable energy available to a data centre is a function of thetransmission losses and these are location dependent. Furthermore the
t k t l t ffi t ’ ti l lnetwork topology, traffic, components’ power consumption also play animportant role in determining the optimum data centre location.
• Therefore the LP model here takes into account the previous trade-offsas well as the trade-offs introduced by the losses associated with thetransmission of renewable energy to the data centre locations.
R bl i th IP WDM t k ithRenewable energy in the IP over WDM network with data centres
LP Si l ti d R lt
• We run the LP model with five data centres (Ndc=5) underthe previous assumptions.
LP, Simulation and Results
p p
• The optimal locations of data centres obtained from the LPmodel are as follows (4 5 6 7 8) where data centres 4model are as follows (4, 5, 6, 7, 8) where data centres 4and 5 are powered by WF1, data centre 6 and 7 arepowered by WF2, and data centre 8 is powered by WF3.
• The LP model results are such that all the data centres arelocated in the centre of the network.
• It can be observed that the optimum data centres locationsare next to or near wind farms.
E ffi i t hi f IPTV d d iEnergy efficient caching for IPTV on-demand services
• By 2014 over 91% of the global IP traffic is projected to be a form of videoBy 2014 over 91% of the global IP traffic is projected to be a form of video(IPTV, VoD, P2P), with an annual growth in VoD traffic of 33%.
• In proxy-based architectures, proxies (or caches) are located closer toclients to cache some of the server’s contentclients to cache some of the server’s content.
• Our goal is to minimize the power consumption of the network by storingthe optimum number of the most popular content at the nodes’ caches.
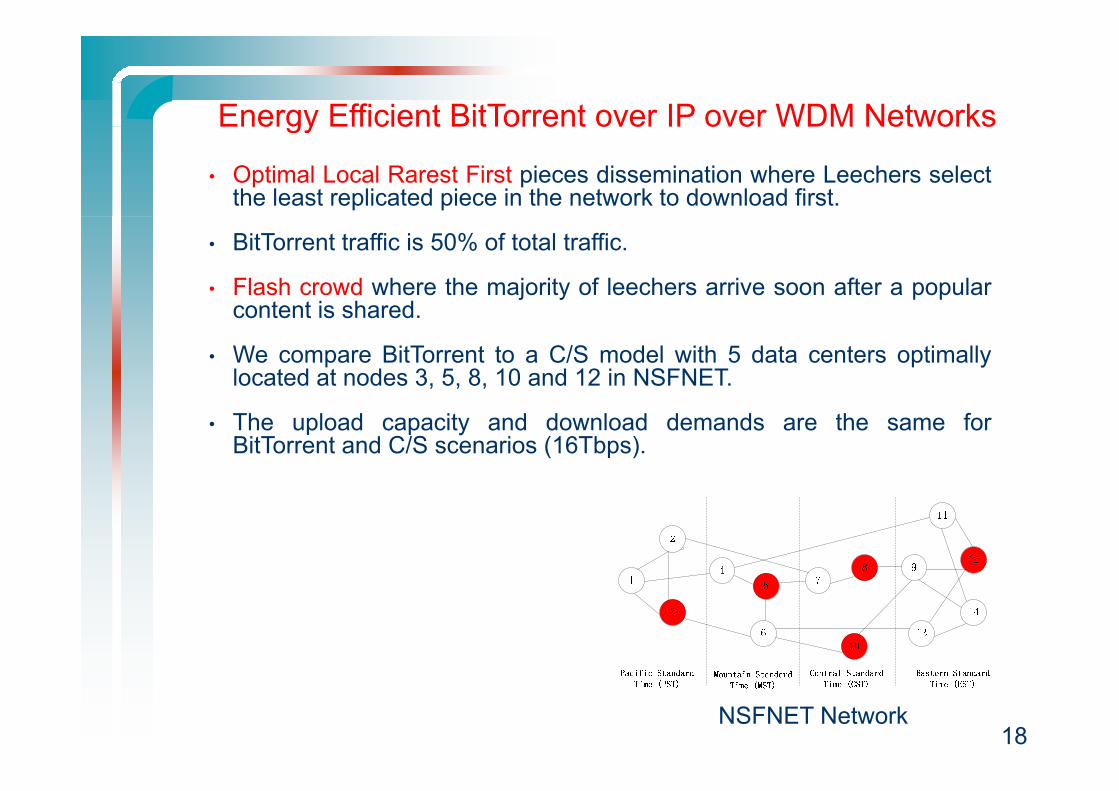
Energy Efficient BitTorrent over IP over WDM NetworksEnergy Efficient BitTorrent over IP over WDM Networks
• The two content distribution schemes, Client/Server (C/S) and Peer-to-Peer(P2P), account for a high percentage of the Internet traffic.( ), g p g
• We investigate the energy consumption of BitTorrent in IP over WDM networks.
We show by mathematical modelling (MILP) and simulation that peers’ co
16
• We show, by mathematical modelling (MILP) and simulation, that peers co-location awareness, known as locality, can help reduce BitTorrent’s cross trafficand consequently reduces the power consumption of BitTorrent on the networkside.
Energy Efficient BitTorrent over IP over WDM NetworksEnergy Efficient BitTorrent over IP over WDM Networks
• The file is divided into small pieces.
• A tracker monitors the group of users currently downloading.
• Downloader groups are referred to as swarms and their members aspeers. Peers are divided into seeders and leechers.peers. Peers are divided into seeders and leechers.
• As a leecher finishes downloading a piece, it selects a fixed number(typically 4) of interested leechers to upload the piece to, ie unchoke,(The choke algorithm).(The choke algorithm).
• Tit-for-Tat (TFT) ensures fairness by not allowing peers to downloadmore than they upload.
• We consider 160,000 groups of downloaders distributed randomlyover the NSFNET network nodes.
• Each group consists of 100 members.Each group consists of 100 members.
• File size of 3GB.
• Homogeneous system where all the peers have the same upload
17
Homogeneous system where all the peers have the same uploadcapacity of 1Mbps.
Energy Efficient BitTorrent over IP over WDM NetworksEnergy Efficient BitTorrent over IP over WDM Networks
• Optimal Local Rarest First pieces dissemination where Leechers selectthe least replicated piece in the network to download first.
• BitTorrent traffic is 50% of total traffic.
• Flash crowd where the majority of leechers arrive soon after a popularcontent is sharedcontent is shared.
• We compare BitTorrent to a C/S model with 5 data centers optimallylocated at nodes 3, 5, 8, 10 and 12 in NSFNET.
• The upload capacity and download demands are the same forBitTorrent and C/S scenarios (16Tbps).
18NSFNET Network
Peer SelectionPeer Selection (100 Peer: 30 Seeders and 70 Leechers in Swarm 1)
Original BitTorrent (Random Selection) β=0
Energy Efficient BitTorrent (Optimized Selection) β=1
19
Average Download RateAverage Download Rate
• All models reach optimal performance
• Energy-efficient heuristic reduce performance by 13%
Power ConsumptionPower Consumption
Non-bypass: Bypass:Model Power Saving=36%
Heuristic Power Saving =36%Model Power Saving=30%
Heuristic Power Saving =28%
Energy ConsumptionEnergy Consumption
Non-bypass:MILP average Energy Saving=36%
H i i E S i 2 %
Bypass:MILP average Energy Saving=30%
H i i E S i 15%Heuristic average Energy Saving =25% Heuristic average Energy Saving =15%
F t di tiFuture directions• Dynamic load migration to match energy supply and demand;
il bilit f blavailability of renewable energy
Traffic shaping to enhance dynamic resource adaptation and• Traffic shaping to enhance dynamic resource adaptation and energy saving
• Hybrid P2P and C/S content distribution networks
• Cross layer resource adaptation (physical layer impairments, adaptive and mixed line rates; application awareness of h i l d t k l )physical and network layers)
Dynamic resource adaptation in clean slate architectures (eg
23
• Dynamic resource adaptation in clean slate architectures (eg. time switched, subcarrier switched, time-subcarrier switching)