1 Erik Jonsson School of Engineering and Computer Science, University of Texas at Dallas, Richardson, TX 75252 2Futurewei Technologies, 2330 Central Expressway, Santa Clara, CA 95050
3Department of Electrical and Computer Engineering, Carleton University, Ottawa, ON, Canada K1S 5B6
Abstract—Optical networks are ideal candidates for the
future intra- and inter-data center networks, due to their merits
of high throughput, low energy consumption, high reliability, and
so on. Optical network virtualization is a key technology to
realize the deployment of various types of network-based
applications on a single optical network infrastructure. Current
virtual optical network embedding allocates resources in an
exclusive and excessive manner. Typically, the spectrum amount
of the virtual optical network’s peak traffic is reserved along the
optical paths. It may lead to high user cost and low carrier
revenue. In this paper, we propose a dynamic resource pooling
and trading mechanism, in which users do no need to reserve the
spectrum amount of their peak traffic demands. We compare the
user cost and carrier revenue of our dynamic mechanism with
the traditional exclusive resource allocation, by formulating our
mechanism as a Stackelberg game and finding the Subgame
Perfect Equilibrium. The numerical results show that our
proposed dynamic mechanism can save user cost while increase
carrier revenue under certain conditions.
Index Terms—flexible-grid optical networks; network
virtualization; SDN; resource pooling and trading
I. INTRODUCTION
The emergence of high-performance and heterogeneous applications such as cloud computing, big data, 3D gaming, etc, has post challenges to the current intra- and inter-data center networks. Optical networks have advantages such as high throughput and low energy consumption, and thus, are promising candidates for the future intra- and inter-data center networks. The optical networks are evolving from fixed-grid, where an optical path’s channel width follows the rigid ITU-T standard, towards flexible-grid optical networks, where the spectrum is allocated according to the capacity and reachability requirements [1]. The flexible-grid optical networks have the potential to greatly improve the spectrum efficiency. In flexible-grid optical networks, different optical channels may have different line rates and modulation formats, which require different spectrum amount, as shown in Table. I [2].
As the traffic among data centers is becoming more dynamic and heterogeneous, it is not scalable or feasible to provision a dedicated network to each network-based application. Network virtualization [3] has been proposed to improve the current data center networks, by allowing multiple virtual networks to share a common substrate physical network. In optical network virtualization, the virtual optical networks (VONs) are composed through the partitioning or aggregation
TABLE I. REQUIRED SPECTRUM AMOUNT
Line rate (Gbps) 100 200 300 400
Channel width (GHz) 50 75 100 125
of physical optical network resources, such as ROADMs, transponders, regenerators, fiber links, and spectrum slices [4].
The VON embedding or VON allocation problem plays a vital role in the resource allocation of optical network virtualization. In VON embedding, each VON provider (user) requests certain resources and the physical optical network provider (carrier) needs to allocate a part of its infrastructure resources to the VONs. Specifically, the carrier needs to map virtual nodes to physical optical nodes, and map virtual links to the physical optical paths. In the previous research on VON embedding [5-7], the resources are allocated exclusively and excessively. For example, for a given virtual optical link, the exact spectrum amount of the link’s peak traffic demand is reserved along the physical optical path. However, in data center networks, the peak traffic demands can be 10~20 times greater than their mean. Also, the peak traffic demands may last for only a short time. Thus, if we provision the resources according to the peak traffic demands, a large number of resources will not be used for most of the time. In [8], we proposed a similar resource pooling and trading mechanism in network virtualization. Different from [8], this paper focuses on optical network virtualization. More specifically, in [8], the user can request arbitrary bandwidth amount without considering the underlined optical network characteristics, while in this paper, the user can only choose among the available optical channels, so the bandwidth they can request is discrete rather than continuous.
In this paper, we propose a dynamic resource pooling and trading mechanism in network virtualization over flexible-grid optical networks. Given a set of optical channels of different line rates and channel widths, a user can reserve one of the optical channels as its long-term reservation. The user can use up to the spectrum amount of its chosen optical channel at any time. When the user’s traffic decreases, it may downgrade its optical channel to a smaller optical channel with lower line rate and less spectrum. The user may sell the unused spectrum amount to the carrier, and the carrier creates and manages a resource pool to gather the unused spectrum. When the user’s traffic increases, it may buy extra spectrum from the resource
2014 IEEE 3rd International Conference on Cloud Networking (CloudNet)
pool and upgrade its optical channel to a higher rate optical channel. In this paper, the proposed mechanism is formulated as a Stackelberg game [9]. The Subgame Perfect Equilibrium (SPE) is found and the numerical results are shown to prove the benefits of the new mechanism. We make the following assumptions in this paper: 1) traffic splitting is not allowed. A user can only have one optical channel for each virtual link at any time, since splitting the traffic is not cost-effective; 2) the user does not occupy more than necessary of the spectrum to accommodate its traffic. The user always uses the optical channel which is larger than, and closest to its traffic demand; 3) spectrum conversion is allowed. The optical channel’s wavelength may be changed by spectrum conversion.
The rest of the paper is organized as follows: in Section II, we describe our dynamic resource pooling and trading mechanism in detail and explains how to formulate it as a Stackelberg game. Section III shows the process of finding SPE. Section IV shows the numerical results. Finally, Section V concludes the paper.
II. DYNAMIC RESOURCE POOLING AND TRADING
MECHANISM
In this section, we firstly illustrate our proposed dynamic resource pooling and trading mechanism. Then, we explain how to formulate it as a Stackelberg game.
A. Introduction on Dynamic Resource Pooling and Trading
Mechanism
In this section, we introduce our new dynamic resource pooling and trading mechanism. In our analysis, an optical channel’s configuration includes two parameters: line rate and channel width. We use li and wi to denote the line rate and the channel width of configuration i’s optical channel.
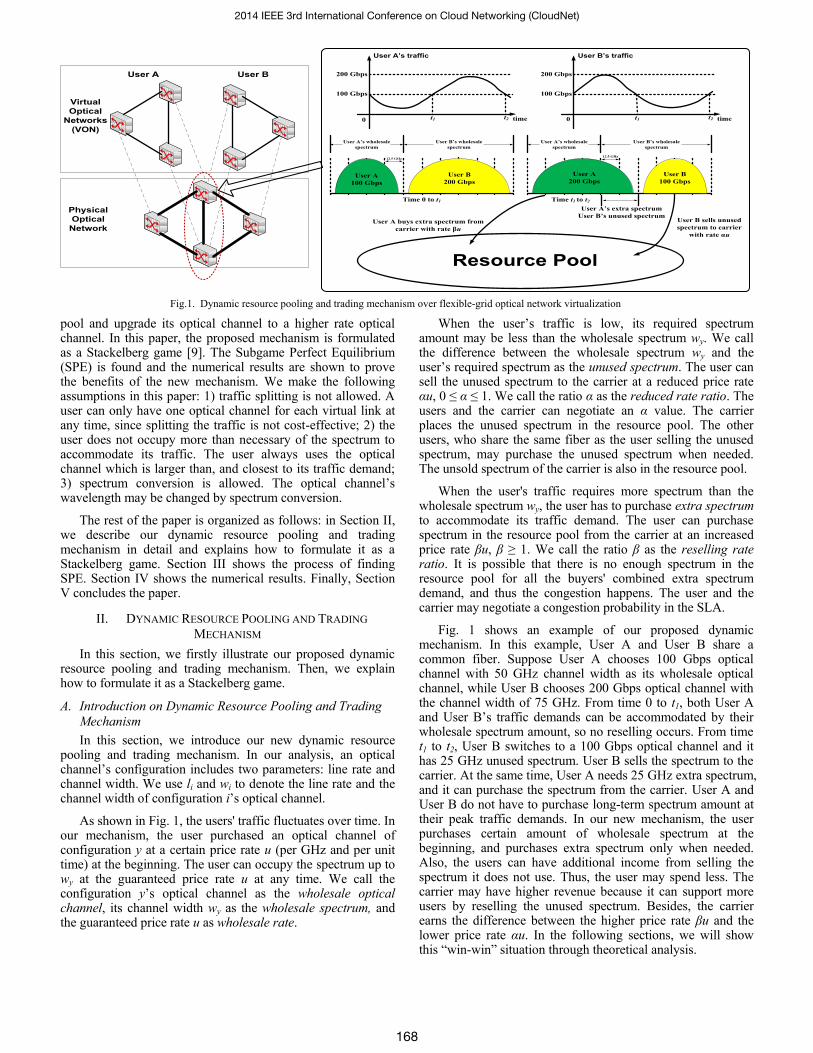
As shown in Fig. 1, the users' traffic fluctuates over time. In our mechanism, the user purchased an optical channel of configuration y at a certain price rate u (per GHz and per unit time) at the beginning. The user can occupy the spectrum up to wy at the guaranteed price rate u at any time. We call the configuration y’s optical channel as the wholesale optical channel, its channel width wy as the wholesale spectrum, and the guaranteed price rate u as wholesale rate.
When the user’s traffic is low, its required spectrum amount may be less than the wholesale spectrum wy. We call the difference between the wholesale spectrum wy and the user’s required spectrum as the unused spectrum. The user can sell the unused spectrum to the carrier at a reduced price rate αu, 0 ≤ α ≤ 1. We call the ratio α as the reduced rate ratio. The users and the carrier can negotiate an α value. The carrier places the unused spectrum in the resource pool. The other users, who share the same fiber as the user selling the unused spectrum, may purchase the unused spectrum when needed. The unsold spectrum of the carrier is also in the resource pool.
When the user's traffic requires more spectrum than the wholesale spectrum wy, the user has to purchase extra spectrum to accommodate its traffic demand. The user can purchase spectrum in the resource pool from the carrier at an increased price rate βu, β ≥ 1. We call the ratio β as the reselling rate ratio. It is possible that there is no enough spectrum in the resource pool for all the buyers' combined extra spectrum demand, and thus the congestion happens. The user and the carrier may negotiate a congestion probability in the SLA.
Fig. 1 shows an example of our proposed dynamic mechanism. In this example, User A and User B share a common fiber. Suppose User A chooses 100 Gbps optical channel with 50 GHz channel width as its wholesale optical channel, while User B chooses 200 Gbps optical channel with the channel width of 75 GHz. From time 0 to t1, both User A and User B’s traffic demands can be accommodated by their wholesale spectrum amount, so no reselling occurs. From time t1 to t2, User B switches to a 100 Gbps optical channel and it has 25 GHz unused spectrum. User B sells the spectrum to the carrier. At the same time, User A needs 25 GHz extra spectrum, and it can purchase the spectrum from the carrier. User A and User B do not have to purchase long-term spectrum amount at their peak traffic demands. In our new mechanism, the user purchases certain amount of wholesale spectrum at the beginning, and purchases extra spectrum only when needed. Also, the users can have additional income from selling the spectrum it does not use. Thus, the user may spend less. The carrier may have higher revenue because it can support more users by reselling the unused spectrum. Besides, the carrier earns the difference between the higher price rate βu and the lower price rate αu. In the following sections, we will show this “win-win” situation through theoretical analysis.
Virtual
Optical
Networks
(VON)
Physical
Optical
Network
User A User B
time
User A’s traffic
100 Gbps
200 Gbps
t1 t2 time
User B’s traffic
100 Gbps
200 Gbps
t1 t20 0
12.5 GHz
User A’s wholesale
spectrum
User B’s wholesale
spectrum
Time 0 to t1
User A
100 Gbps
User B
200 Gbps
12.5 GHz
User A’s wholesale
spectrum
User B’s wholesale
spectrum
Time t1 to t2
User A
200 Gbps
User B
100 Gbps
User A’s extra spectrum
User B’s unused spectrum
Resource Pool
User A buys extra spectrum from
carrier with rate βu
User B sells unused
spectrum to carrier
with rate αu
Fig.1. Dynamic resource pooling and trading mechanism over flexible-grid optical network virtualization
2014 IEEE 3rd International Conference on Cloud Networking (CloudNet)
168
TABLE II. NOTATIONS
Symbol Meaning
u Wholesale rate
x User’s traffic demand
y Configuration of wholesale optical channel
li Line rate of configuration i’s optical channel
wi Channel width of configuration i’s optical channel
α Reduced rate ratio
β Reselling rate ratio
C The total spectrum amount of a fiber
N The number of users sharing a fiber
X The random variable representing user’s traffic
λ The parameter of the user’s traffic distribution
b The peak rate of the user’s traffic
T The total time period
Pnew The total cost a user pays to the carrier using the new
mechanism
Pold The total cost a user pays to the carrier using the old
mechanism
Pnew_avg The average cost a user pays to the carrier using the new
mechanism
Pold_avg The average cost a user pays to the carrier using the old
mechanism
Rnew_avg The average revenue of the carrier using the new
mechanism
Rold_avg The average revenue of the carrier using the old
mechanism
B. A Two-Stage Stackelberg Game
We consider a network virtualization scenario with one carrier and a set of users. The proposed mechanism is formulated as a two-stage Stackelberg game. The carrier is the leader in the Stackelberg game, while the users are the followers. In Stage I, the carrier firstly decides the reselling rate ratio β, which maximizes its revenue, and announces it to the users. In Stage II, each user decides its wholesale optical channel’s configuration, which minimizes its long-term cost.
The two-stage Stackelberg game can be analyzed by exploiting the SPE. Backward induction [10] is a general technique for determining the SPE, that is, we start with Stage II, then proceed to Stage I. Each of these two stages can be formulated as an independent optimization problem. Next, we will find the SPE and show that the “win-win” situation exists under SPE. The notations used in the analysis are shown in Table. II. In the following sections, the new mechanism refers to our dynamic resource pooling and trading mechanism, while the old mechanism refers to the traditional exclusive resource allocation.
III. BACKWARD INDUCTION OF THE TWO-STAGE GAME
In this section, we show how to determine the SPE through backward induction. In the first part, we show how the users determine their wholesale optical channels to minimize their cost; in the second part, we show how the carrier determines the reselling rate ratio β to maximize its revenue.
A. Determining wholesale optical channel in Stage II
In Stage II, the user decides the wholesale optical channel to minimize its cost, given the reselling rate ratio β announced by the carrier in Stage I.
We assume the user's traffic follows the truncated exponential distribution with parameters λ and b. The probability density function (pdf) is:
This assumption of traffic distribution enables us to obtain closed-form cumulative density function of the user’s traffic demand. Our new mechanism does not depend on any particular traffic distribution. The truncated exponential distribution is used in this paper for simplifying the analysis. In the analysis, we suppose the set of line rates are in ascending order, that is, lj > li and wj > wi, , l0 = 0. We assume the peak traffic demand b can be accommodated by the optical channel of configuration L.
The user cost Pnew under the new mechanism over a time period T can be obtained by the following formula:
where the first part is the total payment for the wholesale spectrum, the second part is the income of the user from selling the unused spectrum, and the third part is the total payment for buying the extra spectrum from the carrier.
Let
, then
We denote the y that minimizes the user cost as
If the wholesale spectrum amount is less than , the user
may have to pay more for the extra spectrum; else, if the wholesale spectrum amount is larger than , the user pays
less for the extra spectrum, but there will be more unused spectrum and the penalty of reselling the unused spectrum is larger.
Finally, the minimum average user cost under the new mechanism is only determined by β and can be expressed as
In the old mechanism, the user purchases wholesale spectrum amount at its peak traffic demand, which is in this case. Thus, the user cost using the old mechanism is
2014 IEEE 3rd International Conference on Cloud Networking (CloudNet)
169
Similar to , let
, we have
B. Determining reselling rate ratio β in Stage I
In Stage I, the carrier needs to determine the reselling rate ratio β to maximize its total revenue. For simplifying the analysis, without loss of generality, we assume all the users follow the same truncated exponential distribution with the same parameters λ and b. Also, the traffic distributions of different users are independent. Assume the traffic demands of User 1, User 2, ..., User n are represented as random variables X1, X2, ..., Xn, and their corresponding required spectrum amounts are represented by Z1, Z2, ..., Zn . Then the sequence of variables {Z1, Z2, ..., Zn} is i.i.d.
The carrier needs to solve the following problem
where is the number of users the carrier can accommodate under β using the new mechanism. When β is small, the carrier earns less from reselling the unused spectrum. On the other hand, when β is large, the number of users the carrier can accommodate is smaller. The reason is that is
larger when β is larger and the carrier has to guarantee each user's wholesale spectrum amount under given capacity C,
i.e., , and thus becomes smaller
when β increases. From the analysis above, there should be a which maximizes the carrier revenue.
In the old mechanism, the user buys the same spectrum amount as its peak traffic demand and it does not sell out the unused spectrum. Thus, is obtained by
In the new mechanism, the carrier buys the unused spectrum from one user and sells it to other users in need. Thus, the new mechanism may support more users than the old mechanism. However, the multiplexing of users in the new mechanism may result in congestion, while there is no congestion in the old mechanism. In order to make the new mechanism and old mechanism comparable, we have to limit the congestion probability to a very small value, such that it is negligible. To measure the congestion probability, we firstly need to study the distribution of all the users’ aggregated spectrum amount.
Suppose the aggregated spectrum amount of n users is denoted by a random variable Sn, i.e., Sn = Z1 + Z2 + ... + Zn. According to the classical central limit theorem [11], given that {Z1, Z2, ..., Zn} is a sequence of i.i.d random variables with E[Zi] = μ and Var[Zi] = < ∞, then as n is approaching infinity, the random variable Sn converges to a normal distribution N(nμ,
n ). In our analysis, the mean value of random variable Zi is given by
and the variance is
Assume we have a large number of users, Sn then approximately follows the normal distribution N(nμ, n ). According to the 68-95-99.7 rule [12], approximate 99.7% of the values of Sn lie within 3 standard deviations of the mean,
i.e., . Then
we have . Thus, if we let
, then the congestion probability is at most 0.1%, which is negligible. Meanwhile, the carrier has to guarantee each user's wholesale spectrum amount at any
time, i.e., . Together we have two constraints for
, both of which need to be satisfied:
Overall, we have
Finally, the maximum carrier revenue under the new mechanism is
and the maximum carrier revenue under the old mechanism is
IV. NUMERICAL RESULTS
In this section, we present numerical results to compare the user cost and carrier revenue of the new mechanism and the old mechanism. The line rates and their corresponding channel widths are shown in Table. I.
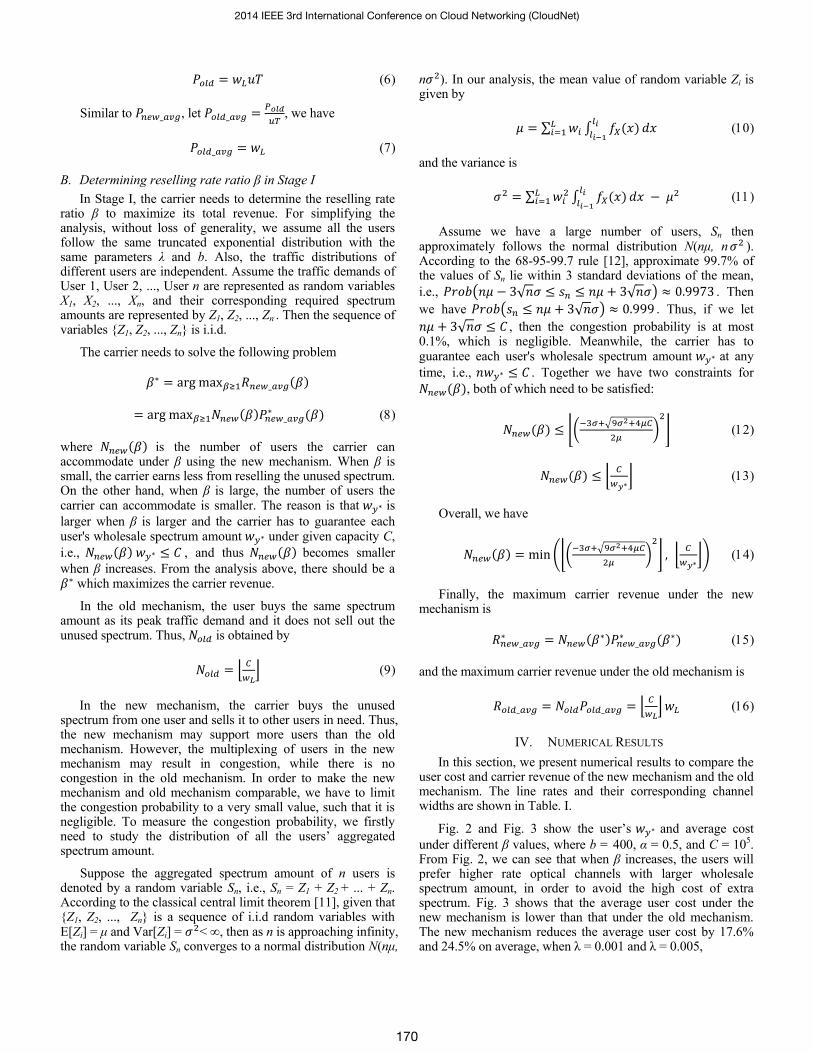
Fig. 2 and Fig. 3 show the user’s and average cost
under different β values, where b = 400, α = 0.5, and C = 105. From Fig. 2, we can see that when β increases, the users will prefer higher rate optical channels with larger wholesale spectrum amount, in order to avoid the high cost of extra spectrum. Fig. 3 shows that the average user cost under the new mechanism is lower than that under the old mechanism. The new mechanism reduces the average user cost by 17.6% and 24.5% on average, when λ = 0.001 and λ = 0.005,
2014 IEEE 3rd International Conference on Cloud Networking (CloudNet)
170
Fig. 2. vs. reselling rate ratio β
Fig. 3. Average user cost vs. reselling rate ratio β
respectively. Under the new mechanism, the average user cost increases when β increases, and finally, the average user cost is constant, since the user chooses the optical channel of the highest line rate as its wholesale optical channel. However, the user can still sell its unused spectrum to the carrier, so the average cost under the new mechanism is still lower than that under the old mechanism, even if the user chooses the highest line rate optical channel as its wholesale optical channel.
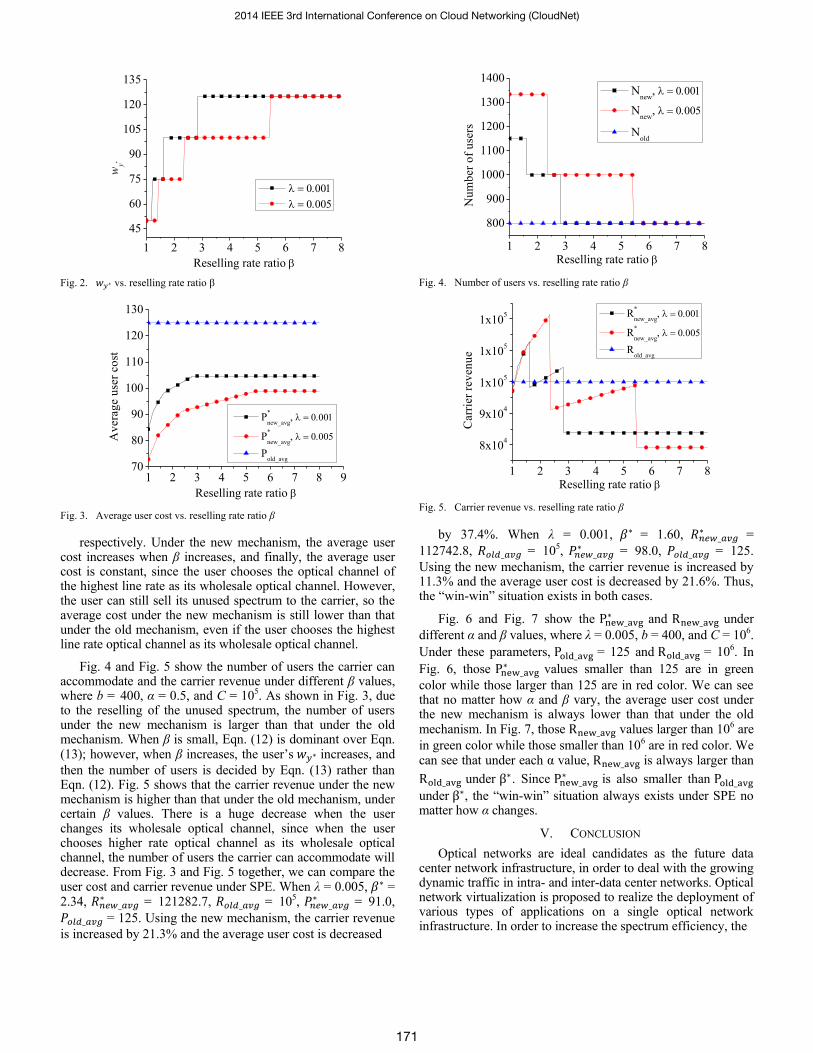
Fig. 4 and Fig. 5 show the number of users the carrier can accommodate and the carrier revenue under different β values, where b = 400, α = 0.5, and C = 105. As shown in Fig. 3, due to the reselling of the unused spectrum, the number of users under the new mechanism is larger than that under the old mechanism. When β is small, Eqn. (12) is dominant over Eqn. (13); however, when β increases, the user’s increases, and
then the number of users is decided by Eqn. (13) rather than Eqn. (12). Fig. 5 shows that the carrier revenue under the new mechanism is higher than that under the old mechanism, under certain β values. There is a huge decrease when the user changes its wholesale optical channel, since when the user chooses higher rate optical channel as its wholesale optical channel, the number of users the carrier can accommodate will decrease. From Fig. 3 and Fig. 5 together, we can compare the user cost and carrier revenue under SPE. When λ = 0.005, = 2.34,
= 121282.7, = 105, = 91.0,
= 125. Using the new mechanism, the carrier revenue
is increased by 21.3% and the average user cost is decreased
Fig. 4. Number of users vs. reselling rate ratio β
Fig. 5. Carrier revenue vs. reselling rate ratio β
by 37.4%. When λ = 0.001, = 1.60, =
112742.8, = 105, = 98.0, = 125.
Using the new mechanism, the carrier revenue is increased by 11.3% and the average user cost is decreased by 21.6%. Thus, the “win-win” situation exists in both cases.
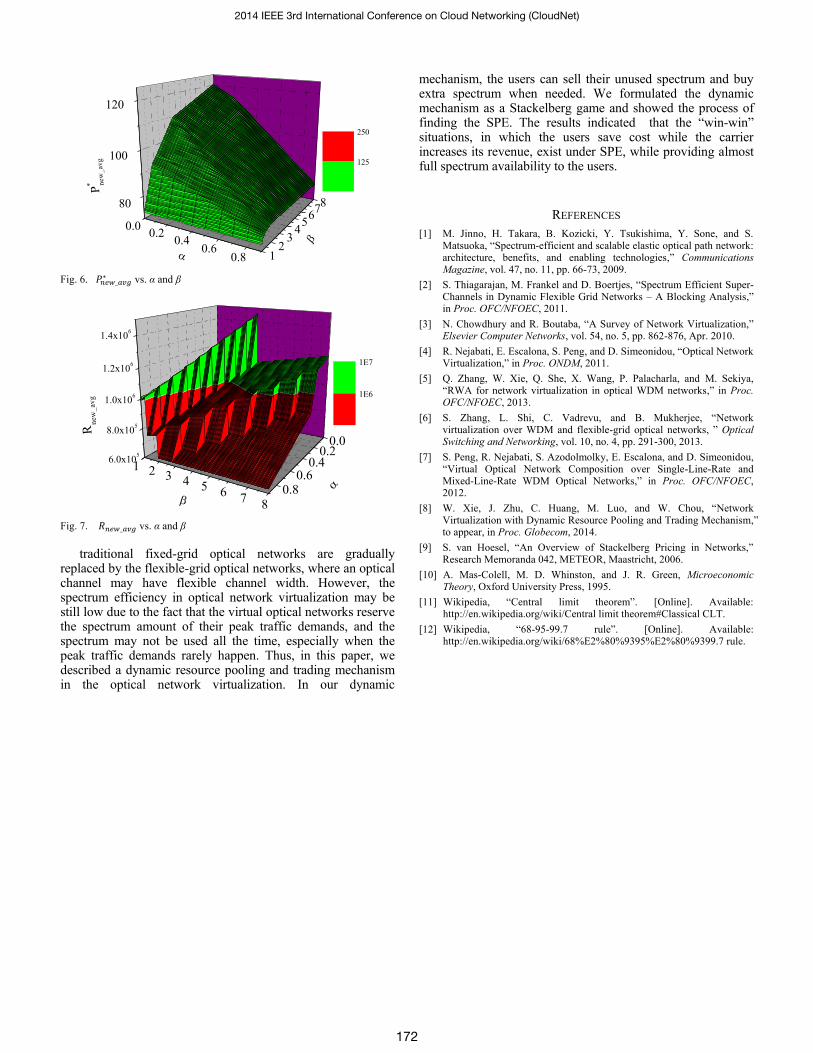
Fig. 6 and Fig. 7 show the and under
different α and β values, where λ = 0.005, b = 400, and C = 106.
Under these parameters, = 125 and = 106. In
Fig. 6, those values smaller than 125 are in green
color while those larger than 125 are in red color. We can see that no matter how α and β vary, the average user cost under the new mechanism is always lower than that under the old mechanism. In Fig. 7, those values larger than 106 are
in green color while those smaller than 106 are in red color. We can see that under each α value, is always larger than
under . Since is also smaller than
under , the “win-win” situation always exists under SPE no matter how α changes.
V. CONCLUSION
Optical networks are ideal candidates as the future data center network infrastructure, in order to deal with the growing dynamic traffic in intra- and inter-data center networks. Optical network virtualization is proposed to realize the deployment of various types of applications on a single optical network infrastructure. In order to increase the spectrum efficiency, the
1 2 3 4 5 6 7 8
45
60
75
90
105
120
135
wy
*
Reselling rate ratio
1 2 3 4 5 6 7 8 970
80
90
100
110
120
130
Av
era
ge u
ser
co
st
Reselling rate ratio
P*
new_avg,
P*
new_avg,
Pold_avg
1 2 3 4 5 6 7 8
800
900
1000
1100
1200
1300
1400
Nu
mb
er
of
use
rs
Reselling rate ratio
Nnew
,
Nnew
,
Nold
1 2 3 4 5 6 7 8
8x10⁴
9x10⁴
1x10⁵
1x10⁵
1x10⁵
Carr
ier
rev
en
ue
Reselling rate ratio
R*
new_avg,
R*
new_avg,
Rold_avg
2014 IEEE 3rd International Conference on Cloud Networking (CloudNet)
171
Fig. 6. vs. α and β
Fig. 7. vs. α and β
traditional fixed-grid optical networks are gradually replaced by the flexible-grid optical networks, where an optical channel may have flexible channel width. However, the spectrum efficiency in optical network virtualization may be still low due to the fact that the virtual optical networks reserve the spectrum amount of their peak traffic demands, and the spectrum may not be used all the time, especially when the peak traffic demands rarely happen. Thus, in this paper, we described a dynamic resource pooling and trading mechanism in the optical network virtualization. In our dynamic
mechanism, the users can sell their unused spectrum and buy extra spectrum when needed. We formulated the dynamic mechanism as a Stackelberg game and showed the process of finding the SPE. The results indicated that the “win-win” situations, in which the users save cost while the carrier increases its revenue, exist under SPE, while providing almost full spectrum availability to the users.
REFERENCES
[1] M. Jinno, H. Takara, B. Kozicki, Y. Tsukishima, Y. Sone, and S. Matsuoka, “Spectrum-efficient and scalable elastic optical path network: architecture, benefits, and enabling technologies,” Communications Magazine, vol. 47, no. 11, pp. 66-73, 2009.
[2] S. Thiagarajan, M. Frankel and D. Boertjes, “Spectrum Efficient Super-Channels in Dynamic Flexible Grid Networks – A Blocking Analysis,” in Proc. OFC/NFOEC, 2011.
[3] N. Chowdhury and R. Boutaba, “A Survey of Network Virtualization,” Elsevier Computer Networks, vol. 54, no. 5, pp. 862-876, Apr. 2010.
[4] R. Nejabati, E. Escalona, S. Peng, and D. Simeonidou, “Optical Network Virtualization,” in Proc. ONDM, 2011.
[5] Q. Zhang, W. Xie, Q. She, X. Wang, P. Palacharla, and M. Sekiya, “RWA for network virtualization in optical WDM networks,” in Proc. OFC/NFOEC, 2013.
[6] S. Zhang, L. Shi, C. Vadrevu, and B. Mukherjee, “Network virtualization over WDM and flexible-grid optical networks, ” Optical Switching and Networking, vol. 10, no. 4, pp. 291-300, 2013.
[7] S. Peng, R. Nejabati, S. Azodolmolky, E. Escalona, and D. Simeonidou, “Virtual Optical Network Composition over Single-Line-Rate and Mixed-Line-Rate WDM Optical Networks,” in Proc. OFC/NFOEC, 2012.
[8] W. Xie, J. Zhu, C. Huang, M. Luo, and W. Chou, “Network Virtualization with Dynamic Resource Pooling and Trading Mechanism,” to appear, in Proc. Globecom, 2014.
[9] S. van Hoesel, “An Overview of Stackelberg Pricing in Networks,” Research Memoranda 042, METEOR, Maastricht, 2006.
[10] A. Mas-Colell, M. D. Whinston, and J. R. Green, Microeconomic Theory, Oxford University Press, 1995.