University of Rhode Island University of Rhode Island DigitalCommons@URI DigitalCommons@URI Open Access Dissertations 2011 DYNAMIC RESPONSE AND DAMAGE EVOLUTION OF COMPOSITE DYNAMIC RESPONSE AND DAMAGE EVOLUTION OF COMPOSITE MATERIALS SUBJECTED TO UNDERWATER EXPLOSIVE LOADING: MATERIALS SUBJECTED TO UNDERWATER EXPLOSIVE LOADING: AN EXPERIMENTAL AND COMPUTATIONAL STUDY AN EXPERIMENTAL AND COMPUTATIONAL STUDY James LeBlanc University of Rhode Island, [email protected]Follow this and additional works at: https://digitalcommons.uri.edu/oa_diss Recommended Citation Recommended Citation LeBlanc, James, "DYNAMIC RESPONSE AND DAMAGE EVOLUTION OF COMPOSITE MATERIALS SUBJECTED TO UNDERWATER EXPLOSIVE LOADING: AN EXPERIMENTAL AND COMPUTATIONAL STUDY" (2011). Open Access Dissertations. Paper 97. https://digitalcommons.uri.edu/oa_diss/97 This Dissertation is brought to you for free and open access by DigitalCommons@URI. It has been accepted for inclusion in Open Access Dissertations by an authorized administrator of DigitalCommons@URI. For more information, please contact [email protected].
Transcript
University of Rhode Island University of Rhode Island
DigitalCommons@URI DigitalCommons@URI
Open Access Dissertations
2011
DYNAMIC RESPONSE AND DAMAGE EVOLUTION OF COMPOSITE DYNAMIC RESPONSE AND DAMAGE EVOLUTION OF COMPOSITE
MATERIALS SUBJECTED TO UNDERWATER EXPLOSIVE LOADING: MATERIALS SUBJECTED TO UNDERWATER EXPLOSIVE LOADING:
AN EXPERIMENTAL AND COMPUTATIONAL STUDY AN EXPERIMENTAL AND COMPUTATIONAL STUDY
Follow this and additional works at: https://digitalcommons.uri.edu/oa_diss
Recommended Citation Recommended Citation LeBlanc, James, "DYNAMIC RESPONSE AND DAMAGE EVOLUTION OF COMPOSITE MATERIALS SUBJECTED TO UNDERWATER EXPLOSIVE LOADING: AN EXPERIMENTAL AND COMPUTATIONAL STUDY" (2011). Open Access Dissertations. Paper 97. https://digitalcommons.uri.edu/oa_diss/97
This Dissertation is brought to you for free and open access by DigitalCommons@URI. It has been accepted for inclusion in Open Access Dissertations by an authorized administrator of DigitalCommons@URI. For more information, please contact [email protected].
A DISSERTATION SUBMITTED IN PARTIAL FULFILLMENT OF THE
REQUIREMENTS FOR THE DEGREE OF
DOCTOR OF PHILOSOPHY
IN
MECHANICAL, INDUSTRIAL AND SYSTEMS ENGINEERING
UNIVERSITY OF RHODE ISLAND
2011
DOCTOR OF PHILOSOPHY DISSERTATION
OF
JAMES LEBLANC
APPROVED:
Thesis Committee:
Major Professor__________________________________
__________________________________
__________________________________
__________________________________
__________________________________ DEAN OF THE GRADUATE SCHOOL
UNIVERSITY OF RHODE ISLAND 2011
james.m.leblanc
Typewritten Text
james.m.leblanc
Typewritten Text
james.m.leblanc
Typewritten Text
Dr. Arun Shukla
james.m.leblanc
Typewritten Text
Dr. Martin Sadd
james.m.leblanc
Typewritten Text
Dr. David Taggart
james.m.leblanc
Typewritten Text
Dr. K. Wayne Lee
james.m.leblanc
Typewritten Text
james.m.leblanc
Typewritten Text
Dr. Nasser H. Zawia
james.m.leblanc
Typewritten Text
james.m.leblanc
Typewritten Text
james.m.leblanc
Typewritten Text
james.m.leblanc
Typewritten Text
james.m.leblanc
Typewritten Text
ABSTRACT
The dynamic response and damage evolution of composite materials subjected to
underwater explosive loading has been studied. The study utilizes both experimental and
numerical techniques to aid in the understanding of the behavior of these materials under shock
loading conditions. The objective of the project is to develop a better understanding of the
response of composite materials when subjected to shock loading conditions leading to more
efficiently designed structures. The focus of the work is on performing high fidelity experiments
under controlled shock loading and corresponding finite element simulations of the experiments.
The work is divided into three phases, each of which build and expand upon the preceding work.
In the first phase of the research the transient response and development of damage
mechanisms of E-Glass / Epoxy composite plates is studied. The plates are bi-axial laminates
consisting of a non-woven, parallel fiber construction, and are round, flat disks. The work
consists of experiments, utilizing a water filled conical shock tube and computational
simulations, utilizing the commercially available LS-DYNA finite element code. Two series of
experiments have been performed and simulated: (1) a reduced energy series which allowed for
the use of strain gages and (2) a series with increased energy which imparted material damage.
The strain data obtained from the reduced energy experiments and the corresponding simulations
are correlated using the Russell Error measure, a mathematical technique which evaluates the
differences in two transient data sets by quantifying the variation in magnitude and phase. It is
shown that there is a high level of correlation between the experiments and the simulations when
using this measure. Additionally the extent of the damage, including the individual mechanisms,
from the high energy experiments and simulations are compared and show good agreement.
The objective of the second phase of the project was to increase the geometrical
complexity of the composite plates by shifting from flat to curved mid-sections. The plates
utilized in the second part of the study are E-Glass / Vinyl Ester, 0/90 biaxial laminates. The
water filled conical shock tube is utilized to impart shock loading to the plates. Computational
finite element simulations are performed with the LS-DYNA finite element code. The transient
response of the plates was measured using a three-dimensional (3D) Digital Image Correlation
(DIC) system, which included high speed photography and specialized post processing software.
This ultra high speed system records full field shape and displacement profiles in real time. The
transient response of the plates is compared to the simulation results using both point-wise time
histories as well as full field deformation profiles. The DIC data and the computational results
show a high level of correlation using the Russell Error measure.
The third phase of the project investigates the relative response of three different laminate
constructions. The objective is to determine the effectiveness of the laminate variations on
increasing the performance of the laminate used in the second phase. Specifically, to improve
the dynamic response and mitigate the damage mechanisms that were observed in the
experiments from phases one and two. Three laminate constructions have been investigated: (1)
a baseline 0°/90° biaxial layup, (2) a 0°/90° biaxial layup that includes a thin glass veil between
plies, and (3) a 0°/90° biaxial layup that has a coating of polyurea applied to the back face. The
digital image correlation system is used to capture the real-time deformation and velocity
response of the plates. The use of polyurea is shown to improve the material performance, while
the inclusion of lightweight veils between the plies is shown to negatively affect the response.
iv
ACKNOWLEDGEMENTS
First and foremost I would like to my advisor Dr. Arun Shukla for his guidance, assistance,
and patience throughout the duration of my work. His patience and inspiring nature has been a
great source of motivation throughout my doctoral studies. Additionally I thank Dr. Sadd, Dr.
Taggart, and Dr. Lee for serving as members of my doctoral committee.
I would like to thank my wife Vinessa, my parents Ray and Holly, my siblings Chris,
Jennifer, and Allison, and my parent in-laws Vincent and Christine for their understanding
nature, and support through this degree program and all of my academic pursuits.
The financial support of the Naval Undersea Warfare Center - Division Newport
(NUWCDIVNPT) In-house Laboratory Independent Research program (ILIR) directed by Dr.
Anthony Ruffa is greatly acknowledged. Additionally, the support of the Office of Naval
Research under ONR Grant No. N00014-10-1-0662 (Dr. Y.D.S. Rajapakse) is acknowledged.
Finally, the support provided by NUWCDIVNPT through the Long Term Training program is
appreciated.
The help and encouragement from my friends and colleagues are greatly appreciated. I
would like to thank all of my lab mates in the dynamic photo-mechanics laboratory. Specifically
Nate Gardner, Nicholas Heeder, and Ryan Sekac for their assistance with the usage of the DIC
equipment during shock testing. Additionally the departmental support of Nancy Dube, Jen
Cerullo, Joe Gomez, and Jim Byrnes is acknowledged. The help and assistance of the NUWC
Survivability Lab personnel for their operation of the shock tube facility, measurement
equipment, and machining resources; Specifically, Bruce Booker, Brian Ploutz, Steve Morin,
Marty Leff, Jim Sinclair, Don Arsenault, and Ken Medeiros. Additionally the support of my
supervisors and mentors at NUWC including Kevin Behan and Stephen Turner is acknowledged.
v
PREFACE
This dissertation is prepared using the manuscript format.
The current study is an investigation into the dynamic response and damage evolution of
composite materials subjected to underwater explosive (UNDEX) loading conditions. The
research consists of experimental and numerical components to study the material behavior. The
composite plates which are used in the study are round discs with both flat and curved mid-
sections. A water filled conical shock tube is utilized to impart the shock loading conditions to
the plates. The transient response of the plates is captured in real time with strain gages and
digital image correlation (DIC). Finite element modeling of the experiments has been performed
utilizing the LS-DYNA code available from the Livermore Software Technology Corporation
(LSTC). The experimental data and the computational results show a high level of correlation
using the Russell Error measure.
Chapter 1 provides a survey of historical and current published literature of subject
matter relevant to this dissertation. The topics covered include methods for imparting shock
loading to materials, investigations of the effects of shock loading on both metallic and
composite materials, and the use of advanced materials to improve the shock response of these
materials. The studies which examine the effect of shock loading on materials consist of
experimental and computational work. This chapter serves to lay the groundwork for the
dissertation and highlight the work that has been done in this field to date.
Chapter 2 presents the effects of underwater shock loading on flat, E-Glass / Epoxy
composite plates. The work consists of experiments, utilizing the water filled conical shock tube
and computational simulations, utilizing the commercially available LS-DYNA finite element
code. Two experimental series have been performed and simulated: (1) a reduced energy series
vi
which allowed for the use of strain gages and (2) a series with increased energy which imparted
material damage. The strain gage data and the computational results show a high level of
correlation using the Russell error measure. The finite element models are also shown to be able
to simulate the onset of material damage by both in-plane and delamination mechanisms. The
chapter will follow the formatting guidelines specified by Composite Structures.
Chapter 3 presents the response of E-Glass / Vinyl Ester curved composite panels
subjected to underwater explosive loading. The work consists of experimental work utilizing the
water filled conical shock tube facility and computational simulations with the commercially
available LS-DYNA finite element code. The composite specimens are 0/90 biaxial laminates
with a thickness of approximately 1.3 mm. The samples are round panels with curved
midsections. The transient response of the plates is measured using a three-dimensional (3D)
Digital Image Correlation (DIC) system, including high speed photography. This ultra high
speed system records full field shape and displacement profiles in real time. The DIC data and
the computational results show a high level of correlation using the Russell Error measure. The
chapter will follow the formatting guidelines specified by Composite Structures.
Chapter 4 investigates the relative response of three E-Glass / Vinyl ester laminates
subjected to underwater explosive loading. The plates are round plates with curved midsections.
The constructions are: (1) a baseline 0°/90° biaxial layup, (2) a 0°/90° biaxial layup that includes
a thin glass veil between plies, and (3) a 0°/90° biaxial layup that has a coating of polyurea
applied to the back face. The work consists of experiments utilizing the water filled, conical
shock tube facility. The samples are round panels with curved midsections, and are
approximately 2.54 mm in thickness. The transient response of the plates is measured using a
three-dimensional (3D) Digital Image Correlation (DIC) system, along with high speed
vii
photography. The results show that the performance of the baseline laminate is improved when
coated with the polyurea material, but conversely is degraded by the inclusion of the glass veils
between plies. The chapter will follow the formatting guidelines specified by International
Journal of Impact Engineering.
viii
TABLE OF CONTENTS ABSTRACT ...................................................................................................................................... ii ACKNOWLEDGEMENTS ........................................................................................................... iv PREFACE ......................................................................................................................................... v TABLE OF CONTENTS .............................................................................................................viii LIST OF TABLES .......................................................................................................................... xi LIST OF FIGURES ....................................................................................................................... xii CHAPTER 1: INTRODUCTION AND LITERATURE REVIEW ............................................ 1 1. INTRODUCTION .................................................................................................................... 1 2. LITERATURE REVIEW ......................................................................................................... 3 CHAPTER 2: DYNAMIC RESPONSE AND DAMAGE EVOLUTION IN COMPOSITE MATERIALS SUBJECTED TO UNDERWATER EXPLOSIVE LOADING: AN EXPERIMENTAL AND COMPUTATIONAL STUDY ...................................................... 10 ABSTRACT ................................................................................................................................ 11 1. INTRODUCTION .................................................................................................................. 11 2. COMPOSITE MATERIAL .................................................................................................... 14 3. SHOCK LOADING APPARATUS ....................................................................................... 15 4. EXPERIMENTAL TESTING ................................................................................................ 17 4.1 TESTING WITH SLIDER ASSEMBLY ........................................................................ 17 5. FINITE ELEMENT MODELING .......................................................................................... 19 6. FINITE ELEMENT SIMULATION RESULTS .................................................................... 23 6.1 STRAIN GAGE DATA – SIMULATION CORRELATION TO TEST ........................ 25 7. DAMAGE MECHANISMS – SIMULATION CORRELATION TO TEST ........................ 29
ix
8. CONCLUSIONS..................................................................................................................... 32 ACKNOWLEDGEMENTS ........................................................................................................ 33 REFERENCES ........................................................................................................................... 33 CHAPTER 3: DYNAMIC RESPONSE OF CURVED COMPOSITE PANELS TO UNDERWATER EXPLOSIVE LOADING: EXPERIMENTAL AND COMPUTATIONAL COMPARISONS ................................................................................. 35 ABSTRACT ................................................................................................................................ 36 1. INTRODUCTION .................................................................................................................. 36 2. COMPOSITE MATERIAL .................................................................................................... 39 3. SHOCK LOADING APPARATUS ....................................................................................... 40 4. EXPERIMENTAL PROCEDURE ......................................................................................... 44 5. FINITE ELEMENT MODELING .......................................................................................... 47 6. FINITE ELEMENT SIMULATION TO RESULTS .............................................................. 52 7. SIMULATION CORRELATION TO TEST.......................................................................... 54 8. CONCLUSIONS..................................................................................................................... 61 ACKNOWLEDGEMENTS ........................................................................................................ 62 REFERENCES ........................................................................................................................... 62 CHAPTER 4: RESPONSE OF E-GLASS / VINYL ESTER COMPOSITE PANELS TO UNDERWATER EXPLOSIVE LOADING: EFFECTS OF LAMINATE MODIFICATIONS ................................................................................................................... 65 ABSTRACT ................................................................................................................................ 66 1. INTRODUCTION .................................................................................................................. 66 2. COMPOSITE MATERIAL .................................................................................................... 69
6.1 Strain Gage Data – Simulation correlation to Test
The strain gage data that was captured during the experiments performed with the slider
assembly is used as a basis to correlate and validate the finite element model results. The quality
of the correlation between the test data and numerical results in this study is quantified using the
Russell Comprehensive Error measurement. The Russell error technique is one method which
evaluates the differences in two transient data sets by quantifying the variation in magnitude and
phase. The magnitude and phase error are then combined into a single error measure, the
comprehensive error factor. The full derivation of the error measure is provided by Russell [15]
with the phase, magnitude, and comprehensive error measures respectively given as:
26
In the above equations ci and mi represent the calculated (simulated) and measured
responses respectively. Excellent, acceptable, and poor correlation using the Russell error
measure is given as: Excellent - RC≤0.15, Acceptable – 0.15<RC≤0.28, and Poor RC>0.28. The
definition of these criteria levels are the result of a study that was undertaken to determine the
correlation opinions of a team in support of a ship shock trial. A summary of the process used to
determine the criteria is presented by Russell [16].
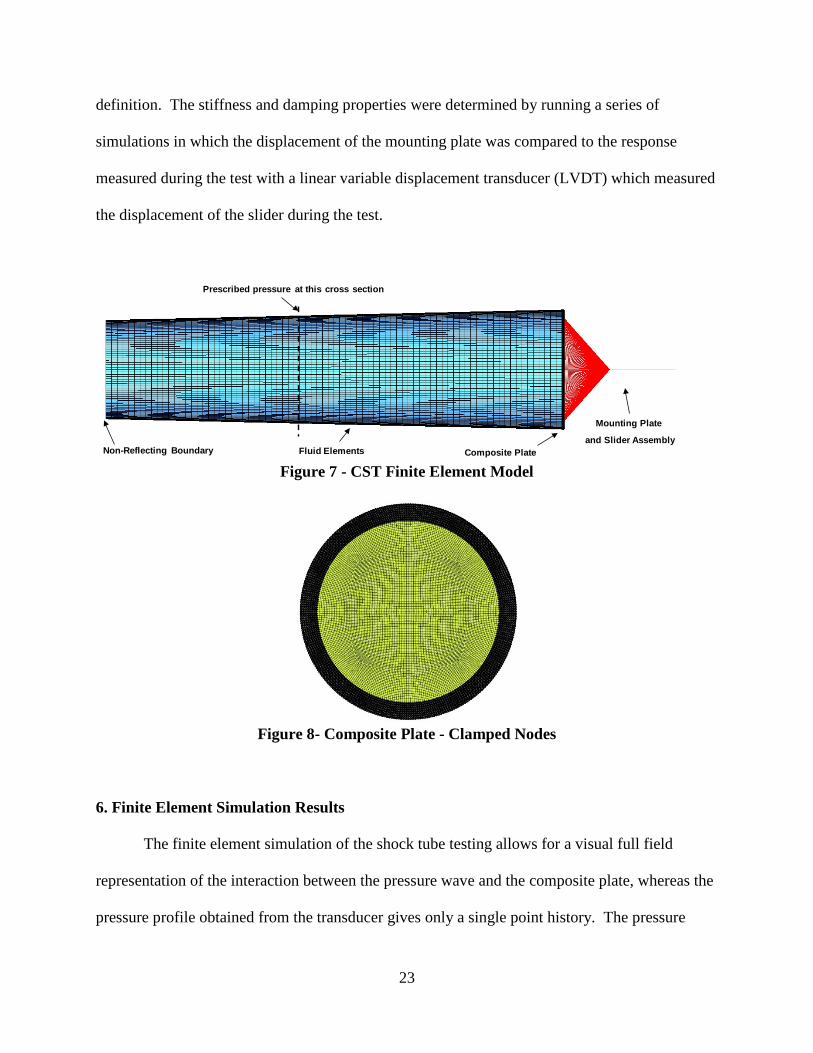
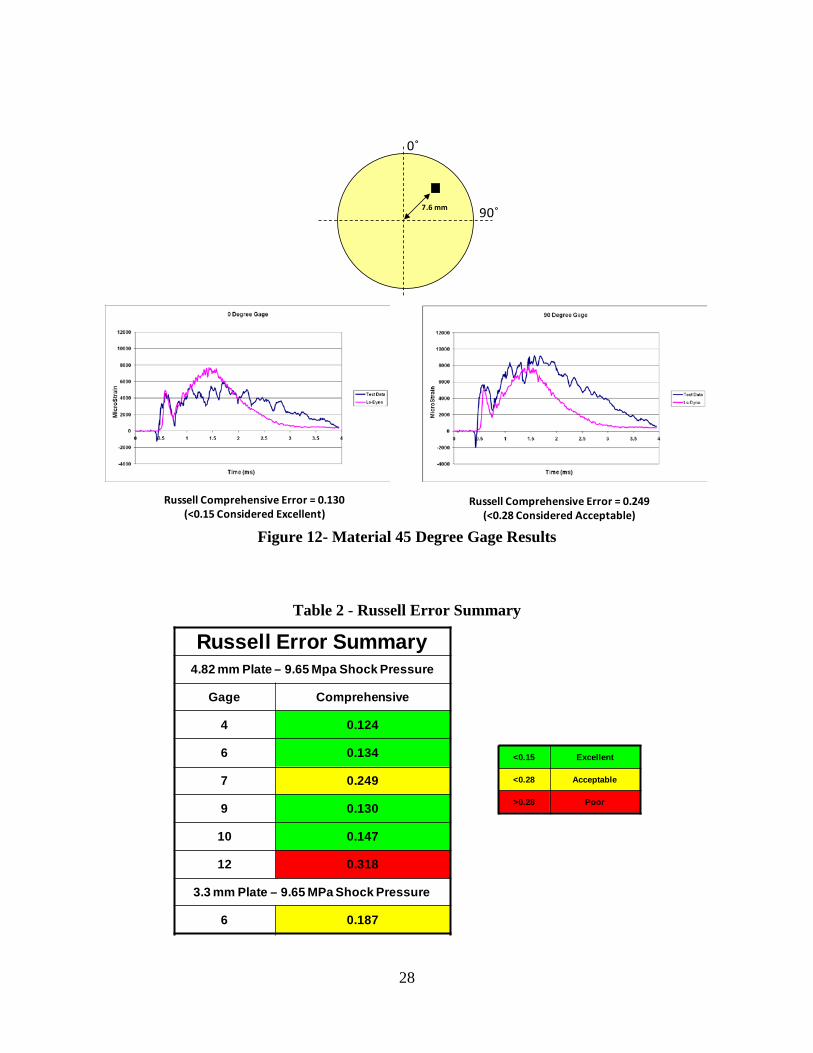
The strain gage data comparisons for the shock test performed with the 4.82 mm (0.190
in.) thick plate and slider assembly is shown in figures 10, 11, and 12 for the 0° and 90° gage
directions. A summary of the Russell error for each of these tests as well as the gage that
survived from the 3.3 mm (0.130 in.) test is provided in table 2. From these graphical
comparisons and error summary it is seen that there is a high level of correlation between the
experimental results and the computational simulations. Five of the six strain profiles that are
compared from the 4.82 mm (0.190 in.) plate thick test fall within the acceptable regime,
including 4 in the excellent regime. The gage that remained attached from the 3.3 mm (0.130
in.) test also shows acceptable correlation. This level of agreement between the test and finite
element data is encouraging since strain gage data is notoriously difficult to correlate to and
match with simulations.
27
0˚
90˚7.6 mm
Russell Comprehensive Error = 0.134(<0.15 Considered Excellent)
Russell Comprehensive Error = 0.124(<0.15 Considered Excellent)
Figure 10- Material 0 Degree Gage Results
0˚
90˚
7.6 mm
Russell Comprehensive Error = 0.318(>0.28 Considered Poor)
Russell Comprehensive Error = 0.147(<0.15 Considered Excellent)
Figure 11- Material 90 Degree Gage Results
28
0˚
90˚7.6 mm
Russell Comprehensive Error = 0.130(<0.15 Considered Excellent)
Russell Comprehensive Error = 0.249(<0.28 Considered Acceptable)
Figure 12- Material 45 Degree Gage Results
Table 2 - Russell Error Summary
Russell Error Summary4.82 mm Plate – 9.65 Mpa Shock Pressure
Gage Comprehensive
4 0.124
6 0.134
7 0.249
9 0.130
10 0.147
12 0.318
3.3 mm Plate – 9.65 MPa Shock Pressure
6 0.187
<0.15 Excellent
<0.28 Acceptable
>0.28 Poor
29
7. Damage Mechanisms – Simulation Correlation to Test
The series of testing performed using the fixed end cap mounting fixture allowed for the
full energy generated by the explosion to be absorbed by the test panel, as opposed to the slider
mechanism which absorbed a portion of the energy. As a result of this increased load on the test
plates in this configuration the panels sustained more severe surface and internal damage. The
damage that was imparted to the sample during a typical test is shown in the left image of figure
13. This figure is from the 3.3 mm (0.130 in.) thick plate that was tested at a shock pressure of
11.7 MPa (1700 lb/in2). The corresponding finite element model result is shown in the right side
image. The image of the test sample has been backlit to highlight the internal delamination that
has occurred.
From these two images several qualitative observations can be made. First, both the
experimental and computational results show that there are 2 cracks that initiate from the through
holes located at the top and bottom (0° material direction) of the sample. These cracks propagate
to a final length of approximately 6.35 cm (2.5 in.) in the experimental test sample and
approximately 7.62 cm (3 in.) in the computational result. In both results the cracks run along
the 0° material direction. The second observation is that there is material damage located
between each of the holes and the edge of the sample, which was also predicted by the
simulation. It is important to note that an initial finite element model of the plate was made in
which the holes were omitted. This model developed neither the localized damage near the hole
locations nor the crack along the 0° direction. This highlights 2 key aspects of this type of
experimental and computational work. The first is that the damage that is observed is likely
initiated due to the stress concentrations induced by the interaction of the mounting bolts and the
30
plate as the material flexes and pulls towards the center of the plate during deformation. The
second is that when undertaking small scale testing, where edge effects and geometric
discontinuities can play a key part in the material response, it is important to include these
features in the computational model. Otherwise the amount of damage predicted by the
simulation will be less than that seen in the experimental component.
In the left image of figure 13 there is a region of delamination damage that developed
along the top edge of the test specimen. This delamination zone extends from the edge of the
plate inward to a radial distance of ~50.8 mm (2 in.) between the 10 to 3 O’clock positions. In
the computational model this delamination zone also develops, figure 14, but it occurs both along
the top and bottom edges. The delamination in the finite element model extends from the edge
inward to a radial distance of 7.62 cm (3 in.). Although the amount of delamination is somewhat
larger in the computational model than is observed in the test it is encouraging that the model is
able to predict the onset of the delamination itself and propagate it to a comparable distance. In
the current model the choice of a delamination criterion was taken to be 34.4 MPa (5000 lb/in2)
for both tensile and shear stresses. The choice of this value was based on discussions of the
developer of the material model (Materials Sciences Corporation). Based on these discussions it
was determined that based on past experience an appropriate knock down factor for the
delamination criteria is approximately one-half of the tensile strength of the pure epoxy. The
degradation by ½ of the tensile strength accounts for voids and interfacial defects / flaws
between the layers of fibers during the manufacturing of the material. The exact epoxy resin
formula is held as proprietary by the material manufacturer however published values for the
tensile strength of epoxy place the value between 27.5-82.7 MPa (4,000-12,000 lb/in2).
Therefore the choice of 34.4 MPa (5000 lb/in2) is reasonable. During the development of the
31
models several values as high as 82.7 MPa (12,000 lb/in2) were utilized to determine the effect of
this value. When a high value is chosen the delamination damage does not occur and all plies
remain in tied contact. If a low value is taken then the plies completely delaminate early on in
the simulation and the results do not agree with the experimental results. More work is planned
into the most efficient way to model the delamination parameters but is outside of the scope of
the current study.
Figure 13- (a) Material Damage during Test, (b) Material Damage from Simulation
32
~ 3”
~ 3”
~ 7.6 mm
~ 7.6 mm
Figure 14 - Finite Element Model Delamination 8. Conclusions
A conical shock tube has been used to study the response of an E-Glass / Epoxy
composite material subjected to underwater shock loading. Two test series have been performed
along with corresponding finite element model development. One test series was performed in
which a slider mechanism was used with the shock tube to absorb a portion of the shock energy.
This allowed the energy imparted to the test specimen to be reduced to the point where strain
gages bonded to the back face of the specimen would remain attached during the event. The
strain gage data recorded during the experiments was correlated to the computational models by
utilizing the Russell error. The Russell error comparisons showed that 6 out of 7 of the gages
that survived the testing had acceptable error measures with 4 of the gages exhibiting excellent
correlation. A second series of testing was performed in which the slider was replaced with a
fixed base mounting fixture which allowed for all of the shock energy to be imparted to the
specimen. The samples tested with this mounting fixture showed significant damage areas
including fiber / matrix breakage as well as internal delamination. The corresponding finite
33
element simulations were able to simulate the appropriate forms and extents of the damage areas.
This work has shown the ability of the LS-DYNA material model
Mat_Composite_Failure_Option_Model to realistically model the behavior of a composite
material under shock loading conditions. It was shown that the static elastic and strength
material properties provide reasonable results for shock loading conditions. This work has
served to show that computational tools can serve to support experimental test results and show
promise for use as an alternative to testing to support structural designs utilizing composite
materials.
Acknowledgements
The financial support of the Naval Undersea Warfare Center (Division Newport) In-
house Laboratory Independent Research program (ILIR) directed by Dr. Anthony Ruffa is
greatly acknowledged.
References 1. Zaretsky E, deBotton G, Perl M. The response of a glass fibers reinforced epoxy composite to an impact loading. International Journal of Solids and Structures 2004; 41: 569–584. 2. Yuan F,Tsai L, Prakash V, Rajendran AM, Dandeka D. Spall strength of glass fiber reinforced polymer composites. International Journal of Solids and Structures 2007; 44: 7731–7747. 3. Mouritz AP. The effect of underwater explosion shock loading on the fatigue behaviour of GRP laminates. COMPOSITES 1995; 26(1). 4. LeBlanc J, Shukla A, Rousseau C, Bogdanovich A. Shock loading of three-dimensional woven composite materials. Composite Structures 2007; 79: 344-355. 5. Matzenmiller A, Lubliner J, Taylor RL. A Constitutive Model for anisotropic damage in fiber-composites. Mechanics of Materials 1995; 20: 125-152. 6. O’Daniel JL, Koudela KL, Krauthammer T. Numerical simulation and validation of distributed impact events. International Journal of Impact Engineering 2005; 31: 1013–1038.
34
7. McGregor CJ, Vaziri R, Poursartip A, Xiao X. Simulation of progressive damage development in braided composite tubes under axial compression. Composites: Part A 2007; 38: 2247–2259. 8. Williams KV, Vaziri R. Application of a damage mechanics model for predicting the impact response of composite materials. Computers and Structures 2001; 79: 997 – 1011. 9. Gama B, Xiao J, Haque M, Yen C, Gillespie J. Experimental and numerical investigations on damage and delamination in thick plain weave S-2 glass composites under quasi-static punch shear loading. Center for Composite Materials, University of Delaware 2004. 10. Xiao J, Gama B, Gillespie J. Progressive damage and delamination in plain weave S-2 glass / SC-15 composites under quasi-static punch-shear loading. Composite Structures 2007; 78: 182-196. 11. Donadon MV, Iannucci L, Falzon BG, Hodgkinson JM, de Almeida SFM. A progressive failure model for composite laminates subjected to low velocity impact damage. Computers and Structures 2008; 86: 1232–1252. 12. Hosseinzadeh R, Shokrieh MM, Lessard L. damage behavior of fiber reinforced composite plates subjected to drop weight impacts. Composites Science and Technology 2006; 66: 61–68. 13. Batra RC, Hassan NM. Response of fiber reinforced composites to underwater explosive loads. Composites: Part B 2007; 38: 448–468. 14. Chan S, Fawaz Z, Behdinan K, Amid R. Ballistic limit prediction using a numerical model with progressive damage capability. Composite Structures 2007; 77: 466–474. 15. Russell DM. Error measures for comparing transient data, Part I: Development of a comprehensive error measure, Part II: Error measures case study. Proceedings of the 68th Shock and Vibration Symposium, 3-6 November 1997. 16. Russell DM. DDG53 Shock trial simulation acceptance criteria. 69th Shock and Vibration Symposium, 12-19 October 1998.
35
CHAPTER 3
DYNAMIC RESPONSE OF CURVED COMPOSITE PANELS TO UNDERWATER
EXPLOSIVE LOADING: EXPERIMENTAL AND COMPUTATIONAL
COMPARISONS
by
James LeBlanc and Arun Shukla
has been submitted to Composite Structures (January 2011)
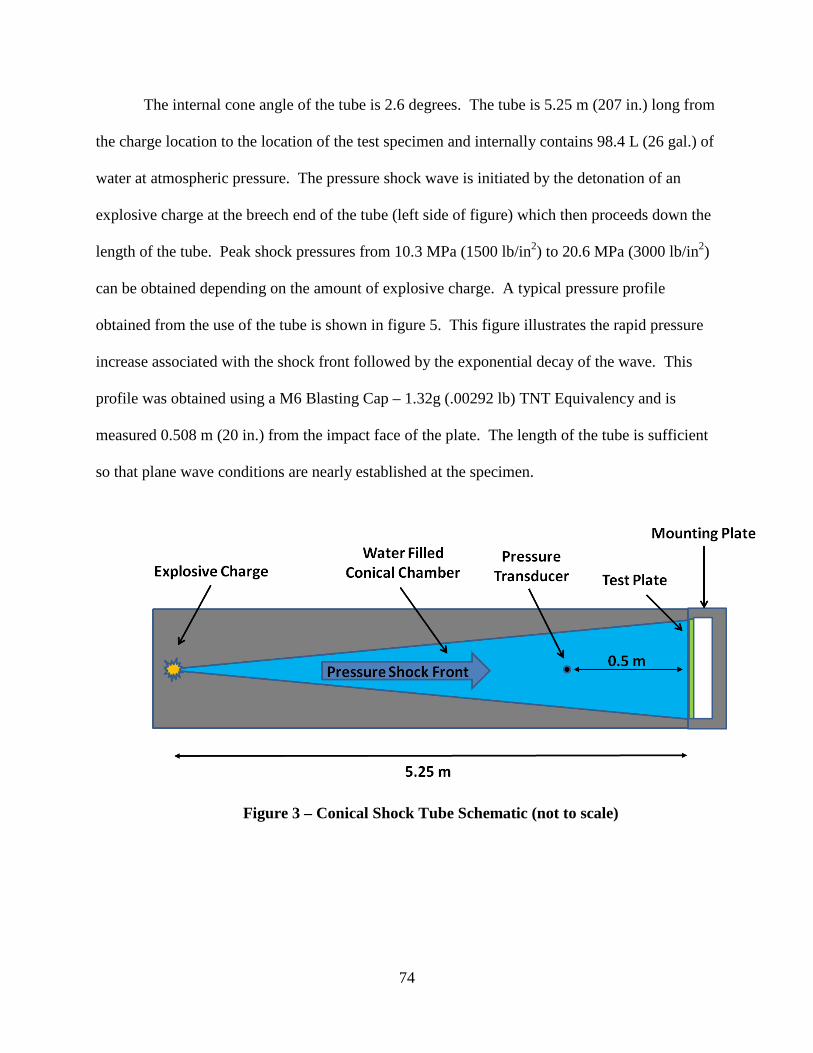
A conical shock tube (CST) facility located at the Naval Undersea Warfare Center,
Division Newport was utilized in the shock loading of the composite materials. The shock tube
is a horizontally mounted, water filled tube with a conical internal shape, Figure 2. The tube
geometry represents a solid angle segment of the pressure field that results from the detonation
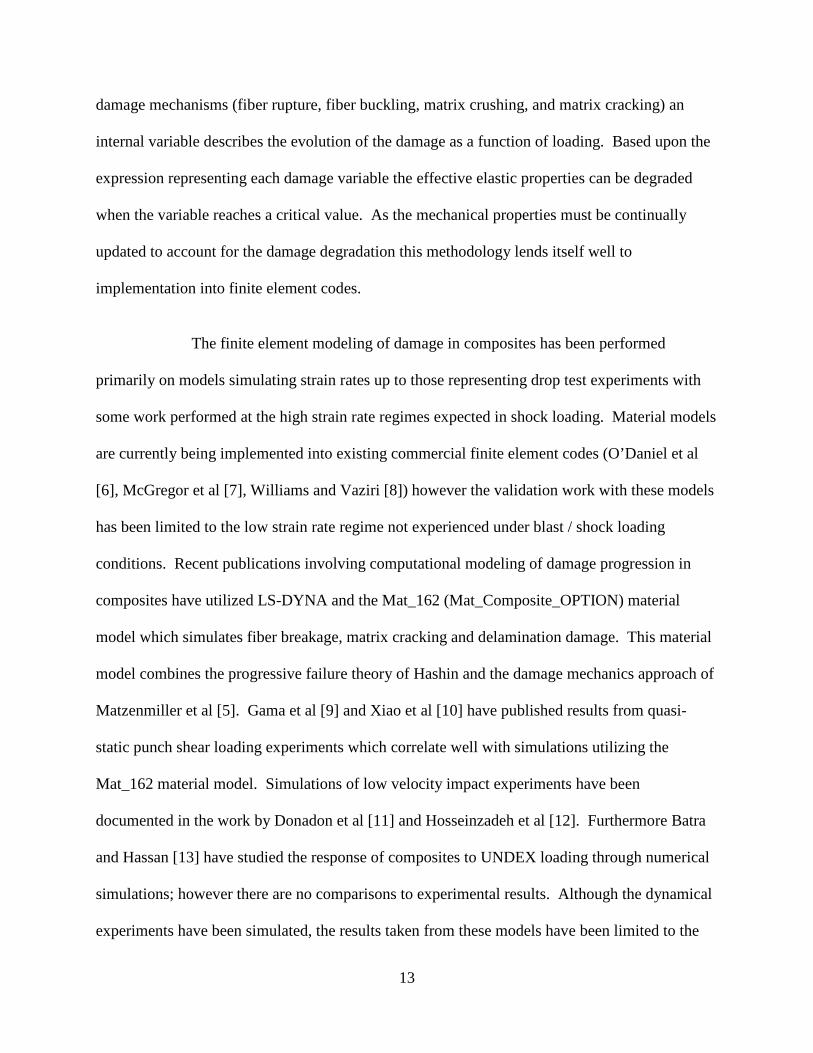
of a spherical, explosive charge, Figure 3. In an open water environment the pressure wave
expands from the charge location as a spherical wave. In the shock tube the rigid wall acts to
confine the expansion of the pressure wave in a manner that simulates a conical sector of the
pressure field. In order to compare free field and shock tube pressure values, it is useful to
41
define an amplification factor which is the ratio between the volume of a spherical charge to the
volume of the conical sector charge and is defined by Poche and Zalesak [20] as:
α is the cone angle
This equation assumes perfectly rigid wall conditions which are not fully realized.
Therefore, the actual amplification factor is less than the calculated value and is typically
reported as an effective weight amplification factor. This is defined by Poche and Zalesak [20]
as the ratio between the weight of a spherical charge, W, required to produce the same peak
pressure at a given standoff distance as that produced in the shock tube by a segment of charge
weight, w. The reduction in the amplification factor is typically attributable to elastic
deformation of the shock tube walls. Further discussion on the development and history of the
water filled conical shock tube is provided by references 21 and 22.
The internal cone angle of the tube is 2.6 degrees. The tube is 5.25 m (207 in.) long from
the charge location to the location of the test specimen and internally contains 98.4 L (26 gal.) of
water at atmospheric pressure. The pressure shock wave is initiated by the detonation of an
explosive charge at the breech end of the tube (left side of figure) which then proceeds down the
length of the tube. Peak shock pressures from 10.3 MPa (1500 lb/in2) to 20.6 MPa (3000 lb/in2)
can be obtained depending on the amount of explosive charge. A typical pressure profile
obtained from the use of the tube is shown in figure 4. This figure illustrates the rapid pressure
increase associated with the shock front followed by the exponential decay of the wave. This
profile was obtained using a M6 Blasting Cap – 1.32g (.00292 lb) TNT Equivalency and is
42
measured 0.508 m (20 in.) from the impact face of the test specimen. The length of the tube is
sufficient so that plane wave conditions are nearly established at the test specimen.
Water Filled Conical Chamber
Mounting Plate
Test Plate
Pressure Transducer
Pressure Shock Front
Explosive Charge
0.5 m
5.25 m Figure 2 – Conical Shock Tube Schematic (not to scale)
Figure 3 – Explosive Charge in Shock Tube (Poche and Zalesak, 1992)
43
Figure 4 – Typical Pressure Profile Generated in the Conical Shock Tube
A mounting fixture has been designed so the test specimens are air backed with fully
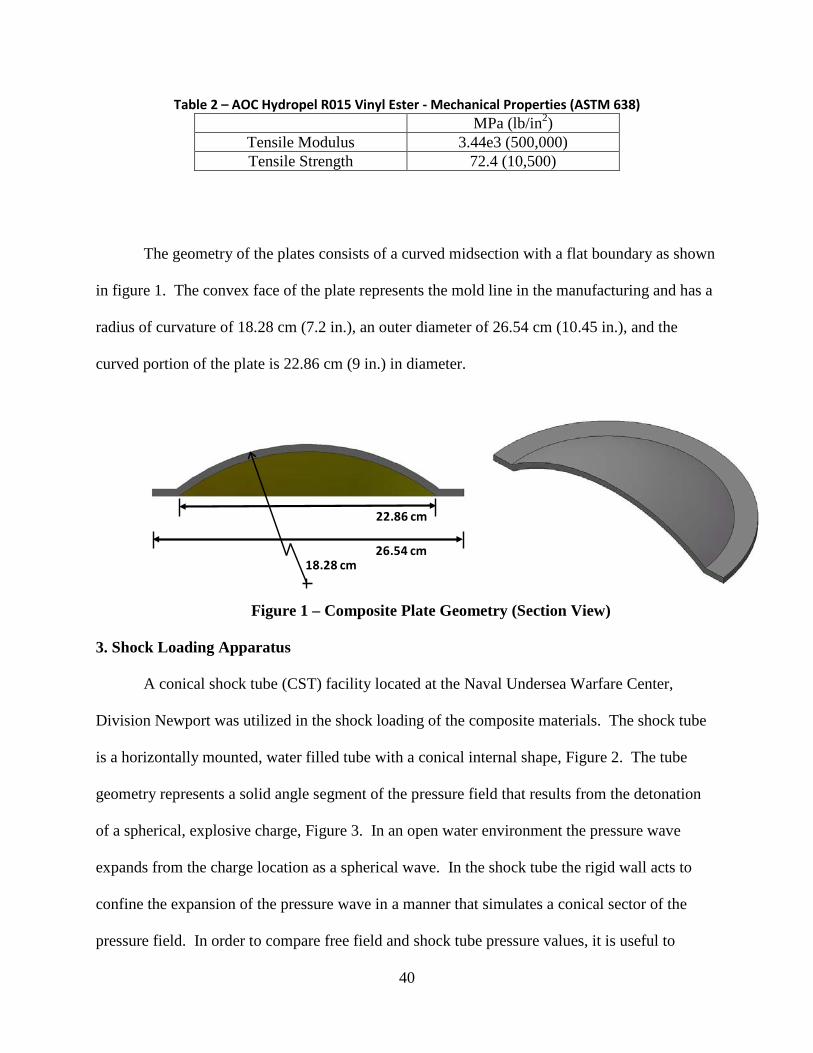
clamped edges. The specimens are 26.54 cm (10.45 in.) in overall diameter with a 22.86 cm (9
in.) unsupported middle section. The mounting arrangement is shown in figure 5. The
specimens are mounted with the convex surface towards the incoming shock fronts. This is
chosen so that the test will represent geometries commonly used in underwater applications with
curved surfaces typically facing into the the fluid (i.e. submersible vehicle hull forms).
44
Mounting Ring
Viewing Window
Composite Plate
Bolting RingCharge Location
Figure 5 – Shock Tube Mounting Configuration
4. Experimental Procedure
Shock testing of the composite material has been performed with the CST utilizing a
fixed end cap. The use of the fixed end cap configuration allows the plate to absorb the full
energy level and sustain a suitable level of damage for comparison to the finite element model
results. The tube can also be configured with a sliding piston end cap [19] to lower the level of
energy the plates absorb, but is not utilized in this study. In the current study high speed
photography coupled with a 3D digital image correlation system is utilized to capture the back
face transient response during the shock event. This system offers the advantage that it is a
45
noncontact measurement technique which gives whole field information and eliminates the
difficulties of strain gages debonding from the specimens at high shock levels and large plate
flexures. The explosive charge used in the study is an M6 blasting cap with a net TNT
equivalence of 1.32grams. This yields peak pressures at the sensor location (.508 m in front of
the test specimen) of approximately 10.3 MPa (1500 lb/in2).
The Digital Image Correlation (DIC) technique is used to capture the transient response
of the back face (dry) of the plates. DIC is a non-intrusive, optical technique for capturing the
full field, transient response of the panels through the use of high speed photography and
specialized software. Capturing the three dimensional response of the plates requires that 2
cameras be used in a stereo configuration. To record the transient response with this system the
cameras must be calibrated and have synchronized image recording throughout the event. The
calibration of the cameras is performed by placing a grid containing a known pattern of dots in
the test space where the composite sample is located during the test. This grid is then translated
and rotated in and out of plane while manually recording a series of images. As this grid pattern
is predetermined, the coordinates of the center of each dot is extracted from each image. The
coordinate locations of each dot extracted uniquely for each camera allows for a correspondence
of the coordinate system of each camera (Tiwari et al [23]). The DIC is then performed on the
image pairs that are recorded during the shock event. Prior to testing the back face of the sample
is painted white and then coated with a randomized speckle pattern, Figure 6. The post
processing is performed with the VIC-3D software package which matches common pixel
subsets of the random speckle pattern between the deformed and un-deformed images. The
matching of pixel subsets is used to calculate the three dimensional location of distinct points on
46
the face of the panel throughout time. This technique has been applied as a full field
measurement technique in many applications including shock loading (Tiwari, et al [24])
Two high speed digital cameras, Photron SA1, are positioned behind the shock tube,
figure 6. The use of two cameras allows for the out-of-plane behavior to be captured. If a single
camera is utilized the data would be limited to the in-plane results. The distance from the lens of
the camera to the specimen is 1.44 m (57 in.) and each camera is angled at approximately 7° with
respect to the symmetry plane, figure 7. A frame rate of 20,000 was used with an inter-frame
time of 50μs.
DIC System
View Window
Specimen
Speckle Pattern
Figure 6 –Digital Image Correlation Schematic
47
7°
1.44 m
Figure 7 –Digital Image Correlation Setup (Not to Scale)
5. Finite Element Modeling
Finite element modeling of the experiment has been performed utilizing the LS-DYNA
code available from the Livermore Software Technology Corporation (LSTC). All simulations
are generated with Version 971, Release 4.2 and are run in double precision mode.
The composite plate in the simulations is modeled using shell elements with a fully
integrated element formulation (Type 16). The model of the 1.37 mm (0.054 in.) plate is shown
in figure 8 and consists of 3 layers of shell elements. Each layer represents a 0° and 90°
combined ply with a thickness of 0.457 mm (0.018in.). The mid-surface of each ply is meshed
and the individual shell layers are offset by the ply thickness. There are five through thickness
integration points for all elements. The holes represent the through bolt holes present in the test
samples used for mounting the plate to the fixture. The in-plane element edge lengths are
approximately 2.54 mm (0.1 in.) and the maximum element aspect ratio is 2.7:1.
48
The LS-DYNA material model utilized in this work is
Mat_Composite_Failure_Option_Model (Mat_059, Option=Shell). This is an orthotropic
material definition capable of modeling the progressive failure of the material due to any of
several failure criterion including tension / compression in the longitudinal and transverse
directions, compression in the through thickness direction, and through thickness shear.
Published descriptions of how each failure mode is handled are scarce, however, there is some
informal documentation available from LSTC. For each possible failure mode, there is an
internal variable which is checked throughout the analysis to determine if failure in that mode is
present. Once failure due to one mode is triggered the load carrying ability of the material in that
direction is reduced to zero. It is important to note that failure in one direction does not cause the
element to be deleted. An element is only deleted from the analysis after it has failed in all
directions and can no longer carry any load. The input material properties are those provided in
table 1. The material model inputs are derived from static tensile testing with no modifications
for strain rate effects. It was seen that the static properties provide reasonable results for shock
loading conditions. The DIC strain measurements made during this study show that the in-plane
strain rates are on the order of 10-50/s. Although the through thickness strain rate was not
measured it is expected to be higher than the in-plane strain rate. Similar observations were
made by Chan et al [19] for the ballistic impact problem and by LeBlanc et al for shock loading
of flat composite plates [25].
49
Figure 8 –Finite Element Model of Composite Plate
In the current modeling effort, delamination damage is considered and is taken into
account through the use of a surface-to-surface tiebreak contact definition. Using this approach,
each ply is modeled as a shell layer of elements representing the mid-surface of each ply and the
shell layers are offset by the ply thickness. The tie break definition initially ties the nodes
between plies together to inhibit sliding motion. The force at each node is monitored by the
software and the corresponding normal and shear stresses are computed. Failure is defined by
the following formula:
where: σN and σS are the computed normal and shear stresses, respectively
NFLS and SFLS are the failure normal and shear stresses, respectively If the current stress state at any node in the contact definition exceeds the failure criteria
then the tie definition for that node is deleted and the node is free to slide. It is important to note
that once the tie component of the contact definition is deleted, the contact for that node
50
transitions to a standard definition. This allows the slave node to slide and separate from the
master surface but not pass through it. Therefore, individual plies can separate but not pass
thorough one another.
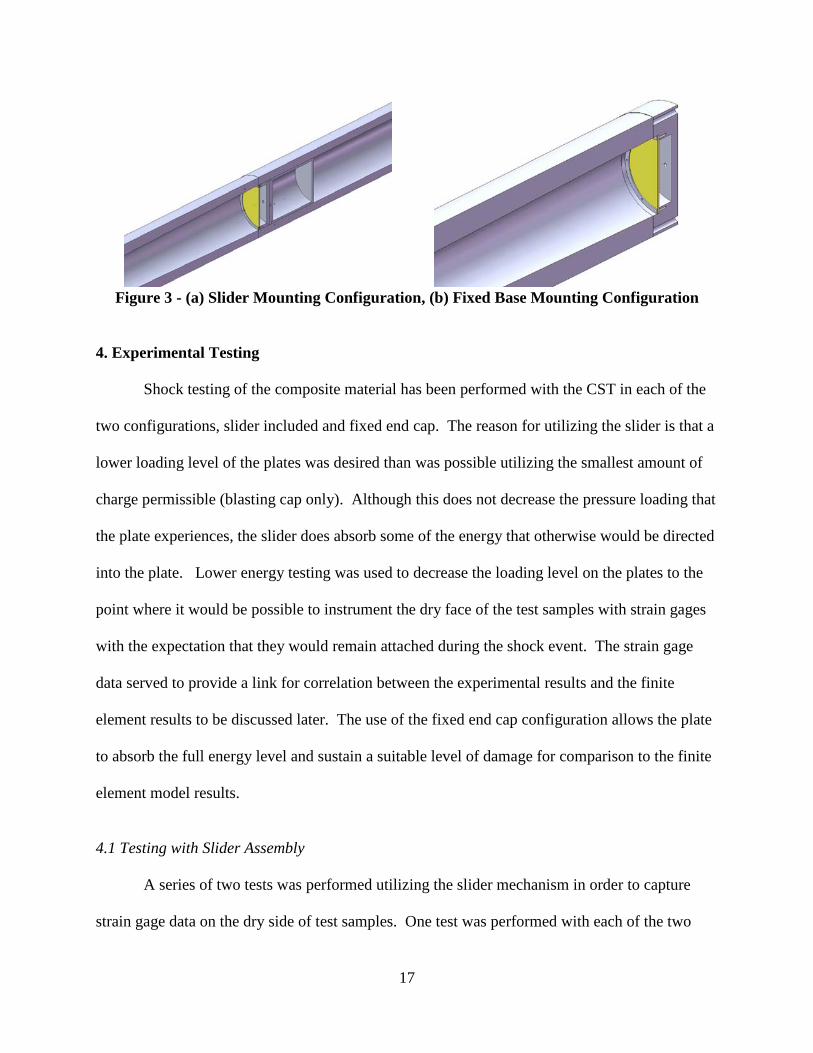
The complete finite element model of the CST test setup is shown in figure 9. The model
consists of the internal fluid of the shock tube and the composite test sample. The fluid within
the tube is considered in the simulation so as to capture the fluid structure interaction (FSI) at the
interface of the fluid and test plate. As will be shown later, this is a critical interaction to
consider as the pressure loading on the plate is not uniform across its face. Only the first 1.01 m
(40 in.) of the fluid extending from the test sample towards the charge location is modeled. This
was deemed to be acceptable for 2 reasons: (1) the fluid is loaded with the pressure profile
measured 0.508 m (20 in.) from the test sample and (2) a non-reflecting boundary layer is
applied at the charge side boundary of the fluid domain. The non-reflecting boundary allows the
wave that is reflected from the plate to leave the fluid domain but not re-enter. This assumption
holds as long as the duration of the plate deformation is small enough such that the wave which
is reflected off the plate cannot reach the end of the tube and reflect back to the plate location
during this time. A simple calculation shows that the time for a wave to travel from the plate to
the end of the tube and back again is 7 ms and the duration of the plate deformation is 5.5 ms.
The fluid is modeled with solid elements and a null material definition. The use of the null
material allows for the material to be defined with an equation of state (EOS) definition. A
linear polynomial EOS is utilized for this model for which only the bulk modulus and density of
the water is defined. This allows for an accurate propagation of the pressure wave in the water in
a computationally efficient manner. The pressure load is applied as a plane wave at the location
of the test pressure transducer. The pressure profile that was measured for the test is applied to
51
the model. The fluid–structure interaction is handled through the use of a tied-surface-to-surface
(LS-DYNA keyword *Contact_Tied_Surface_To_Surface) contact definition. In this method,
two contact surfaces (*Set_Segment) are defined for which the nodes are tied together. For the
coupling of the fluid and composite plate the two surfaces are: (1) the fluid face where it contacts
the plate, and (2) the plate face where it contacts the fluid. The mounting plate is simulated by a
nodal constraint set that forces the nodes in the clamped area of the plate, shown in figure 10, to
have zero displacement. There is no numerical damping applied to the model.
Fluid ElementsNon-Reflecting Boundary
Composite Plate
Prescribed pressure at this cross section
Figure 9 –Finite Element Model of CST
52
Figure 10 – Composite Plate Clamped Nodes
6. Finite Element Simulation Results
The finite element simulation of the shock tube testing allows for a visual full field
representation of the interaction between the pressure wave and the composite plate, whereas the
pressure profile obtained from the transducer gives only a single point history. The pressure
field in the fluid as it interacts with and loads the plate, for the case of the 1.37 mm (0.054 in.)
plate is shown in the left side of figure 11. The associated plate response is shown in the right
side of the figure. The time as shown in these figures is the analysis time, with zero taken at the
initiation of the pressure field 0.508 m (20 in.) from the test sample. Figure 11 illustrates several
key points. First, although the pressure wave is uniform prior to its impact with the test plate, the
loading on the plate itself is complex and not uniform. It is evident that there is a low pressure
area that develops in the center of the plate while the clamped edge is loaded with high pressure.
This can be attributed to the relatively low stiffness of the unsupported area of the plate as
compared to the clamped edge of the plate where it is supported by the mounting ring. The
53
second point is that the loading of the plate and the associated response can be separated into two
distinct time regimes. Where the pressure wave interacts with the plate over 0.2 ms, the plate
does not start to deform until the wave is nearly fully reflected and takes approximately 5.5 ms to
complete.
The plate deformation in the current study can be described as a full inversion, taking
approximately 5.5 ms to complete. At 1 ms, a hinge forms at the outer edge of the plate at the
clamped boundary. This hinge then continues to propagate towards the center of the plate as
seen in the deformation progression images in figure 11. The deformation is completed when the
plate has fully inverted itself at 6.5 ms. At this point it is seen that there is a high pressure region
that develops at the apex of the inverted shape. During the inversion process of the plate the
fluid at the plate boundary is also moving along with the plate surface. Once the inversion of the
plate is complete, the velocity is rapidly arrested, resulting in the development of this high
pressure region. It is noted that the magnitude of this pressure is small compared to the initial
Figure 14 – Full Field Deformation Comparison of Experiment and Simulation
In addition to the transient response correlations, the relationship between the material
damage observed during the test and the damage level predicted by the simulations is of interest.
In the experiment the main damage mechanism that was observed is delamination between the
plies. There was minimal fiber rupture or matrix cracking. The final damage state from the
shock test is shown in figure 15a. Here it is seen that the extent of the delamination ranges from
approximately 1.27 cm (0.5 in.) in the lower left region of the plate to 5.08 cm (2 in.) at the 3
O’clock position. In the corresponding computational model, figure 15b, the delamination area
is highlighted by the black area at the edge of the plate and propagates inwards from the edge 1
cm (0.4 in.). In the simulation results there are also 4 larger delamination zones at the 45°
60
directions. These areas indicate the weaker material directions (fibers run in the 0° and 90°
directions) and extend 3.81 cm (1.5 in.) from the edges. Although the amount of delamination is
somewhat larger in the experiment than is observed in the computational model, it is
encouraging that the model is able to predict the onset of the delamination itself and propagate it
to a comparable distance
In the current model the choice of a delamination criterion was taken to be 36 MPa
(5250 lb/in2) for both tensile and shear stresses. The choice of this value was based on
discussions with the Material Sciences Corporation (MSC) who have developed composite
damage models currently in use within the LS-DYNA code (Mat_162). Based on these
discussions it was determined that the delamination criteria should be set to approximately one-
half of the tensile strength of the pure vinyl ester. The degradation by ½ of the tensile strength
accounts for voids, and interfacial defects / flaws between the layers of fibers during the
manufacturing of the material. Therefore the failure criteria was set to 36 MPa (5,250 lb/in2)
based on the values for the resin provided in table 2. The degradation by one-half was also used
in similar shock loading work by LeBlanc et al [19] for an E-Glass/Epoxy laminate. This
observation is provided to aid in the development of delamination modeling best practices but is
not meant to be definitive. More work is planned into the most efficient way to model the
delamination parameters but is outside of the scope of the current study.
61
Figure 15 – (a) Material Damage during Test, (b) Material Damage from Simulation
8. Conclusions
A conical shock tube has been used to study the response of curved E-Glass / Vinyl ester
composite panels subjected to underwater shock loading. The material is a bi-axial laminate
with fibers balanced in the 0 and 90 degree directions. The round plates are curved in shape with
the convex surface oriented towards the incoming shock front with fully clamped boundaries. A
3D Digital Image Correlation system is used to capture the full field, transient response of the
back (dry) surface of the plates. This allowed for real time recording of the displacement and
velocity history of this surface. The displacement and velocity data for the center point and a
point halfway between the center and boundary are correlated to the computational models by
utilizing the Russell error. The Russell error value for the deflection correlation at these two
points is excellent. The velocity correlation at the point halfway between the center and the
boundary is also excellent, while the center point velocity has acceptable correlation. The full
field displacement evolution is also shown to agree between the experiment and the simulations.
62
The computational model was also able to predict the onset of delamination damage and predict
its growth to a reasonable degree. This work has shown the ability of the LS-DYNA material
model Mat_Composite_Failure_Option_Model to realistically model the behavior of a composite
material under shock loading conditions. This work has served to show that computational tools
can serve to support experimental test results and show promise for use as an alternative to
testing to support structural designs utilizing composite materials.
Acknowledgements
The financial support of the Naval Undersea Warfare Center (Division Newport) In-
house Laboratory Independent Research program (ILIR) directed by Dr. Anthony Ruffa is
greatly acknowledged. Arun Shukla would like to acknowledge the support of Office of Naval
Research under ONR Grant No. N00014-10-1-0662 (Dr. Y.D.S. Rajapakse) to the University of
Rhode Island. Bruce Booker, Steve Morin, and Brian Ploutz are thanked for their operation of
the shock tube facility. The assistance of Nate Gardner and Nicholas Heeder with the DIC setup
is acknowledged. Lastly the authors acknowledge LBI Fiberglass of Groton, CT, specifically
Peter Legnos and Ricky Menser for the manufacturing of the composite samples for testing.
References 1. Espinosa HD, Lee S, Moldovan N. A Novel Fluid Structure Interaction Experiment to Investigate Deformation of Structural Elements Subjected to Impulsive Loading. Experimental Mechanics 2006; 46:805-824. 2. Nurick G, Olson M, Fagnan J. Levin, A. Deformation and Tearing of Blast Loaded Stiffened Square Plates. International Journal of Impact Engineering 1995; 16:273–291. 3. Nurick G, Shave G. The Deformation and Tearing of Thin Square Plates Subjected to Impulsive Loads - An Experimental Study. International Journal of Impact Engineering 1996; 18:99–116.
63
4. Tekalur AS, Shivakumar K, Shukla A. Mechanical Behavior and Damage Evolution in E-Glass Vinyl Ester and Carbon Composites Subjected to Static and Blast Loads. Composites: Part B 2008; 39:57-65. 5. Mouritz AP. Ballistic Impact and Explosive Blast Resistance of Stitched Composites. Composites: Part B 2001; 32: 431-439. 6. LeBlanc J, Shukla A, Rousseau C, Bogdanovich A. Shock Loading of Three-Dimensional Woven Composite Materials. Composite Structures 2007; 79:344-355. 7. Jackson M, Shukla A. Performance of Sandwich Composites Subjected to Sequential Impact and Air Blast Loading. Composites: Part B 2010; doi:10.1016/j.compositesb.2010.09.005. 8. Schubel PM, Luo J, Daniel I. Impact and Post Impact Behavior of Composite Sandwich Panels. Composites: Part A 2007; 38:1051-1057. 9. Arora H, Hooper P, Dear JP. Impact and Blast Resistance of Glass Fibre Reinforced Sandwich Composite Materials. In: Proceedings of IMPLAST 2010; October 2010. 10. Matzenmiller A, Lubliner J, Taylor RL. A Constitutive Model for Anisotropic Damage in Fiber-Composites. Mechanics of Materials 1995; 20:125-152. 11. Zako M, Uetsuji Y, Kurashiki T. Finite Element Analysis of Damaged Woven Fabric Composite Materials. Composites Science and Technology 2003; 63:507-516. 12. Dyka CT, Badaliance R. Damage in Marine Composites Caused by Shock Loading. Composites Science and Technology 1998; 58:1433-1442. 13. O’Daniel JL, Koudela KL, Krauthammer T. Numerical Simulation and Validation of Distributed Impact Events. International Journal of Impact Engineering 2005; 31:1013–1038. 14. McGregor CJ, Vaziri R, Poursartip A, Xiao X. Simulation of Progressive Damage Development in Braided Composite Tubes under Axial Compression. Composites: Part A 2007; 38:2247–2259. 15. Gama B, Xiao J, Haque M, Yen C, Gillespie J. Experimental and Numerical Investigations on Damage and Delamination in Thick Plain Weave S-2 Glass Composites under Quasi-Static Punch Shear Loading. Center for Composite Materials, University of Delaware; 2004. 16. Donadon MV, Iannucci L, Falzon BG, Hodgkinson JM, de Almeida SFM. A Progressive Failure Model for Composite Laminates Subjected to Low Velocity Impact Damage. Computers and Structures 2008; 86:1232–1252. 17. Hosseinzadeh R, Shokrieh MM, Lessard L. Damage Behavior of Fiber Reinforced Composite Plates Subjected to Drop Weight Impacts. Composites Science and Technology 2006; 66:61–68.
64
18. Batra RC, Hassan NM. Response of Fiber Reinforced Composites to Underwater Explosive Loads. Composites: Part B 2007; 38:448–468. 19. LeBlanc J, Shukla A. Dynamic Response and Damage Evolution in Composite Materials Subjected to Underwater Explosive Loading: An Experimental and Computational Study. Composite Structures 2010; 92:2421-2430. 20. Poche L, Zalesak J. Development of a Water-Filled Conical Shock Tube for Shock Testing of Small Sonar Transducers by Simulation of the Test Conditions for the Heavyweight MIL-S-901D (Navy). NRL Memorandum Report 7109, 10 October 1992. 21. Coombs A, Thornhill CK. An Underwater Explosive Shock Gun. Journal of Fluid Mechanics 1967; 29:373-383. 22. Filler WS. Propagation of Shock Waves in a Hydrodynamic Conical Shock Tube. The Physics of Fluids 1964; 7:664-667. 23. Tiwari V, Sutton MA, McNeill SR. Assessment of High Speed Imaging Systems for 2D and 3D Deformation Measurements: Methodology Development and Validation. Experimental Mechanics 2007; 47:561-579. 24. Tiwari V, Sutton MA, McNeill SR, Xu S, Deng X, Fourney WL, Bretall D. Application of 3D Image Correlation for Full-Field Transient Plate Deformation Measurements During Blast Loading. International Journal of Impact Engineering 2009; 36:862-874. 25. Chan S, Fawaz Z, Behdinan K, Amid R. Ballistic Limit Prediction using a Numerical Model with Progressive Damage Capability. Composite Structures 2007; 77:466–474. 26. Russell DM. Error Measures for Comparing Transient Data, Part I: Development of a Comprehensive Error Measure, Part II: Error Measures Case Study. In: Proceedings of the 68th Shock and Vibration Symposium; 3-6 November 1997. 27. Russell DM. DDG53 Shock Trial Simulation Acceptance Criteria. In: 69th Shock and Vibration Symposium; 12-19 October 1998.
65
CHAPTER 4
RESPONSE OF E-GLASS / VINYL ESTER COMPOSITE PANELS TO UNDERWATER
EXPLOSIVE LOADING: EFFECTS OF LAMINATE MODIFICATIONS
by
James LeBlanc and Arun Shukla
Is being prepared for submission to International Journal of Impact Engineering
3. Shock Loading Apparatus A conical shock tube (CST) facility located at the Naval Undersea Warfare Center,
Division Newport was utilized in the shock loading of the composite materials. The shock tube
is a horizontally mounted, water filled tube with a conical internal shape, Figure 3. The tube
geometry represents a solid angle segment of the pressure field that results from the detonation
of a spherical, explosive charge, Figure 4. In an open water environment the pressure wave
expands from the charge location as a spherical wave. In the shock tube the rigid wall acts to
confine the expansion of the pressure wave in a manner that simulates a conical sector of the
pressure field. In order to compare free field and shock tube pressure values, it is useful to
define an amplification factor which is the ratio between the volume of a spherical charge to the
volume of the conical sector charge and is defined by Poche and Zalesak [17] as:
α is the cone angle This equation assumes perfectly rigid wall conditions which are not fully realized.
Therefore, the actual amplification factor is less than the calculated value and is typically
reported as an effective weight amplification factor. This is defined by Poche and Zalesak [17]
as the ratio between the weight of a spherical charge, W, required to produce the same peak
pressure at a given standoff distance as that produced in the shock tube by a segment of charge
weight, w. The reduction in the amplification factor is typically attributable to elastic
deformation of the shock tube walls. Further discussion on the development and history of the
water filled conical shock tube is provided by references 18 and 19.
74
The internal cone angle of the tube is 2.6 degrees. The tube is 5.25 m (207 in.) long from
the charge location to the location of the test specimen and internally contains 98.4 L (26 gal.) of
water at atmospheric pressure. The pressure shock wave is initiated by the detonation of an
explosive charge at the breech end of the tube (left side of figure) which then proceeds down the
length of the tube. Peak shock pressures from 10.3 MPa (1500 lb/in2) to 20.6 MPa (3000 lb/in2)
can be obtained depending on the amount of explosive charge. A typical pressure profile
obtained from the use of the tube is shown in figure 5. This figure illustrates the rapid pressure
increase associated with the shock front followed by the exponential decay of the wave. This
profile was obtained using a M6 Blasting Cap – 1.32g (.00292 lb) TNT Equivalency and is
measured 0.508 m (20 in.) from the impact face of the plate. The length of the tube is sufficient
so that plane wave conditions are nearly established at the specimen.
Figure 3 – Conical Shock Tube Schematic (not to scale)
75
Figure 4 – Explosive Charge in Shock Tube (Poche and Zalesak, 1992)
Figure 5 – Typical Pressure Profile Generated in the Conical Shock Tube A mounting fixture has been designed so the test specimens are air backed with fully
clamped edges. The specimens are 26.54 cm (10.45 in.) in overall diameter with a 22.86 cm (9
in.) unsupported middle section. The mounting arrangement is shown in figure 6. The
76
specimens are mounted with the convex surface towards the incoming shock fronts. This is
chosen so that the experiment will represent geometries commonly used in underwater
applications with curved surfaces typically facing into the fluid (i.e. submersible vehicle hull
forms).
Figure 6 – Shock Tube Mounting Configuration
4. Experimental Procedure
Shock testing of the composite material has been performed with the CST utilizing a
fixed end cap. The use of the fixed end cap configuration allows the plate to absorb the full
energy level of the shock and sustain a suitable level of damage. The tube can also be
configured with a sliding piston end cap (LeBlanc et al. [20]) to lower the level of energy the
plate absorbs, but is not utilized in this study. All experiments were performed two times to
ensure repeatability. High speed photography coupled with a 3D digital image correlation
system is utilized to capture the back face transient response during the shock event. This
77
system offers the advantage that it is a noncontact measurement technique which gives full field
information and eliminates the difficulties of strain gages debonding from the specimens at high
shock levels and large plate flexures. The explosive charge used in the study is an M6 blasting
cap with a net TNT equivalence of 1.32grams. This yields peak pressures at the sensor location
(.508 m in front of the test specimen) of approximately 11 MPa (1600 lb/in2).
The Digital Image Correlation (DIC) technique is used to capture the transient response
of the back face (dry) of the plates. DIC is a non-intrusive, optical technique for capturing the
full field, transient response of the panels through the use of high speed photography and
specialized software. Capturing the three dimensional response of the plates requires that 2
cameras be used in a stereo configuration. To record the transient response with this system the
cameras must be calibrated and have synchronized image recording throughout the event. The
calibration of the cameras is performed by placing a grid containing a known pattern of dots in
the test space where the composite sample is located during the experiment. This grid is then
translated and rotated in and out of plane while manually recording a series of images. As this
grid pattern is predetermined, the coordinates of the center of each dot is extracted from each
image. The coordinate locations of each dot extracted uniquely for each camera allows for a
correspondence of the coordinate system of each camera (Tiwari et al [21]). The DIC is then
performed on the image pairs that are recorded during the shock event. Prior to the experiment,
the back face of the sample is painted white and then coated with a randomized speckle pattern,
Figure 7. The post processing is performed with the VIC-3D software package (Correlated
Solutions) which matches common pixel subsets of the random speckle pattern between the
deformed and un-deformed images. The matching of pixel subsets is used to calculate the three
dimensional location of distinct points on the face of the panel throughout time. This technique
78
has been applied as a full field measurement technique in many applications including shock
loading (Tiwari, et al [22])
Two high speed digital cameras, Photron SA1, are positioned behind the shock tube,
figure 7. The use of two cameras allows for the out-of-plane behavior to be captured. If a single
camera is utilized the data would be limited to the in-plane results. The distance from the lens of
the camera to the specimen is 1.44 m (57 in.) and each camera is angled at approximately 7° with
respect to the symmetry plane, figure 8. A frame rate of 20,000 was used with an inter-frame
time of 50μs.
DIC System
View Window
Specimen
Speckle Pattern
Figure 7 –Digital Image Correlation Schematic
79
7°
1.44 m
Figure 8 –Digital Image Correlation Setup (Not to Scale)
5. Results
The determination of the effectiveness of the two laminate modifications in comparison
to the baseline laminate will focus on deformation and velocity time histories, as well as the level
of post mortem damage. The deformation and velocity histories are presented for distinct points
on the back face of the panels, and are extracted from the DIC post processed data. The post
mortem damage levels are assessed from visual observations of the damage mechanisms.
The pressure profile obtained from the experiment with the baseline laminate is shown in
figure 9. The pressure history can be separated into three distinct time regimes. The first is the
initial shock front which has time duration of less than 1 ms from peak pressure to full decay to
ambient. The second set of pressure effects arrives at the pressure transducer at approximately
10.5 ms after the initial shock front. This secondary wave is formed when the velocity of the
plate is brought to rest. During the initial deformation of the plate, the water that contacts the
plates moves along with the plate surface. When the movement of the plate is brought to rest,
80
the momentum of this water causes it to compress against the plate and a high pressure wave is
developed. This wave then propagates down the length of the tube and is reflected back towards
the plate. The time delay from this secondary wave reaching the transducer, traveling down the
tube, and arriving back at the transducer is expected to be on the order of 5.5ms based on the
distance of travel from the transducer to the charge location. This time delay is clearly seen in
figure 9. The bubble pulse for the charge weight and conditions that are used in this study is
expected to be on the order of 30 ms, and is confirmed by the high pressures seen in the pressure
profiles at this time. From figure 10 it is seen that the initial peak pressure for each shot is nearly
identical. It is important to note the absence of a reflection of the incident pressure wave in the
pressure signal. This is attributable to the similar acoustic impedance values of the water and the
composite plate as well as the fluid structure interaction of a plane wave with a curved surface.
Consider the case of a dilatation wave arriving at the interface between two dissimilar materials
(Water-Composite interface). The wave will be partially transmitted into the plate and partially
reflected back into the water. The magnitudes of the reflected (A2) and transmitted (A4) waves
as a function of the incident wave (A1) are given as:
( )bB
AA
CCAAA
AAA
ρρ
1
1214
412
+=
−=
Where C1 and ρ are the longitudinal wave speed and the density of the water (A) and the
Composite (B). For the water the wave speed and density are 1500 m/s and 1000 kg/m3 and for
the composite material the values are 3064 m/s and 1680 kg/m3. These parameters yield a
reflected wave magnitude that is 55% of the incident wave. The development of these equations
(Sadd, 2009) assume that the surfaces are perfectly bonded with matching of displacements and
stresses at the interface. It is likely that these conditions are not fully realized with one of the
81
mediums being water which carries no shear stress, and has the possibility of separating from the
composite forming a cavitiation region during the initial deformation of the plate. The
development of cavitiation at the water / plate interface has been observed by Espinosa et al.
(2006) for experiments with steel plates. If perfect matching conditions are not fully realized
then the reflected wave has the possibility of further magnitude reduction from the analytical
value of 55%. Furthermore, these equations assume a flat interface normal to the incident wave.
In the current configuration the wave is interacting with a convexly curved surface which will act
to disperse the wave front, further reducing the magnitude of the reflected wave that the pressure
transducer would measure. Previous work has observed similar reduced reflection waves.
Experiments performed by Espinosa (2006) with steel plates measured reflected waves on the
order of 60% of the incident, whereas the theory predicts a value on the order of 95% reflection.
Figure 9 – Pressure – Deformation History Correlations
The center point deformation time history along with the corresponding pressure profile
for the case of the base line laminate is shown in figure 9. It is seen in this figure that the initial
shock causes a deformation of the center point (0–5 ms), a small recovery (5–10 ms), and finally
a temporary arresting of the motion (10–15 ms). After this arresting of the motion, the secondary
pressure wave arrives (15 ms) and restarts the deformation process of the plate. The effect of the
secondary pressure wave is sufficient to carry the deformation process to full inversion of the
plate. A similar trend is seen for the other two laminates in this study.
The comparison of the displacement –time history for the three laminates is shown in
figure 11. The top plot shows the deflection for the center point and the bottom plot shows the
deflection for a point located halfway between the center and the clamped edge along the
horizontal axis. Using the baseline laminate as a reference, the panel which is coated with
polyurea on the back face shows a distinct performance increase in terms of the displacement
sustained after the arrival of the first pressure peak. Conversely, the performance is degraded
when glass veil is incorporated between plies but the panel thickness is maintained constant.
83
After the first pressure peak the baseline laminate sustains a center point displacement of 33.5
mm (1.31 in.) while the deflection for the polyurea sample is 11 mm (0.43 in.), a decrease of
67%. In the case of the veil laminate the center point displacement is 48 mm (1.88 in.), an
increase of 43% over the baseline. In table 3 it was shown that the this laminate has a 34%
reduction in modulus over the baseline, which likely is the cause for this reduction on
deformation behavior, especially since the primary loading mechanism is flexure. In all cases it
is seen that the effects of the secondary pressure waves are sufficient to continue the
displacement to full plate inversion. This is attributable to the plates being weakened and
partially inverted by the initial peak pressure effect.
Figure 11 –Time History Deformation Comparison
The velocity time history comparison for the center point of each of the three laminates is
shown in figure 12. The top plot of this figure shows the velocity history for the total time
84
duration of the event, whereas the bottom plot focuses on the velocity resulting from the initial
shock pressure. From the bottom figure it is seen that the magnitude of the kick off velocity for
each of the laminates is nearly the same, approximately 16 - 17 m/s (52.5 – 55.7 ft/s). There is a
difference, however, in the time that it takes for the velocity to decay back to zero for each of the
panels. The velocity of the baseline laminate fully decays over 4.5 ms while the panel with
polyurea decays faster, taking only 2.4 ms to return to rest. Conversely, the panel with the glass
veil layers takes 5.5 ms, 1 ms longer than the baseline panel. An alternative way to compare the
decay rate of the velocity is to represent the initial velocity profile as an exponential function as
shown below and compute the decay constant, θ, from an exponential curve fit for each panel.
The decay constants respectively for the baseline, polyurea, and the glass veil panels are: -1.9
sec, -2.6 sec, and -1.0 sec.
85
Figure 12 –Velocity History Deformation Comparison
The final damage states of the three laminates are shown in figure 13. From this figure it
is seen that for all of the laminates the primary damage mechanism is delamination, indicated by
the lighter regions of the plates. There is minimal matrix cracking or fiber breakage observed in
any of the panels. There is a small 76.2 mm (3 in.) crack towards the center of the baseline panel
but this is limited to the surface of the plate and is does not extend through the thickness of the
laminate. It is important to note that these are the final states of damage after the entire shock
event occurs, including the secondary deformation process later in time. It was not possible to
separate which damage occurs during the initial shock loading and which occurs as a result of the
secondary deformation process. Similarly it is not known what the exact damage state after the
initial deformation process is and how this initial damage state compares between the three
laminates. The only conclusion that can be drawn from these figures is that among the three
laminates the final level of damage is comparable, and consists primarily of delamination. This
86
indicates that for these loading conditions and plate geometries, the inclusion of glass veils
between plies does not improve the delamination performance of the composite laminate as
compared to the baseline.
Figure 13 – Material Damage Comparison
6. Conclusions
A conical shock tube has been used to study the response of curved E-Glass / Vinyl ester
composite panels subjected to underwater shock loading. Three laminate constructions have
been investigated and consist of (1) a baseline 0°/90° biaxial layup, (2) a 0°/90° biaxial layup
that includes a thin glass veil between plies, and (3) a 0°/90° biaxial layup that has a coating of
polyurea applied to the back face. The round plates are curved in shape with the convex surface
oriented towards the incoming shock front with fully clamped boundaries. A 3D Digital Image
Correlation system is used to capture the full field, transient response of the back (dry) surface of
the plates. This allowed for real time recording of the displacement and velocity history of this
surface.
87
The deformation and velocity time histories at several unique points on the back face of
the sample are used to evaluate the effectiveness of each laminate subjected to shock loading
conditions. Using the deformation response to the initial peak pressure it was shown that the
polyurea reduced the center point deflection by 67%, while the inclusion of glass veils increased
the deflection by 43%. In all cases it is seen that the effects of the secondary pressure waves are
sufficient to continue the displacement to full plate inversion. It is also observed that the
magnitude of the kickoff velocity for all panels was the same at around 16 m/s, however the
polyurea panel showed the fastest decay of this peak velocity back to zero. Overall damage
levels in each of the panels were comparable but it was not possible to separate which damage
occurs during the initial shock loading and which occurs as a result of the secondary deformation
process. The results show that the performance of the baseline laminate is degraded by the
inclusion of the glass veils between plies but improved when the back face is coated with the
polyurea material.
Acknowledgements
The financial support of the Naval Undersea Warfare Center (Division Newport) In-
house Laboratory Independent Research program (ILIR) directed by Dr. Anthony Ruffa is
greatly acknowledged. Arun Shukla would like to acknowledge the support of Office of Naval
Research under ONR Grant No. N00014-10-1-0662 (Dr. Y.D.S. Rajapakse) to the University of
Rhode Island. Bruce Booker, Steve Morin, and Jim Sinclair are thanked for their operation of
the shock tube facility. The assistance of Nate Gardner, Nicholas Heeder, and Ryan Sekac with
the DIC setup is acknowledged. Lastly the authors acknowledge Specialty Products, Inc. ,
specifically Shere Bush, for providing the polyurea material used in this study.
88
References 1. Espinosa HD, Lee S, Moldovan N. A Novel Fluid Structure Interaction Experiment to Investigate Deformation of Structural Elements Subjected to Impulsive Loading. Experimental Mechanics 2006; 46:805-824. 2. Nurick G, Olson M, Fagnan J. Levin, A. Deformation and Tearing of Blast Loaded Stiffened Square Plates. International Journal of Impact Engineering 1995; 16:273–291. 3. Nurick G, Shave G. The Deformation and Tearing of Thin Square Plates Subjected to Impulsive Loads - An Experimental Study. International Journal of Impact Engineering 1996; 18:99–116. 4. Tekalur AS, Shivakumar K, Shukla A. Mechanical Behavior and Damage Evolution in E-Glass Vinyl Ester and Carbon Composites Subjected to Static and Blast Loads. Composites: Part B 2008; 39:57-65. 5. Mouritz AP. Ballistic Impact and Explosive Blast Resistance of Stitched Composites. Composites: Part B 2001; 32: 431-439. 6. LeBlanc J, Shukla A, Rousseau C, Bogdanovich A. Shock Loading of Three-Dimensional Woven Composite Materials. Composite Structures 2007; 79:344-355. 7. Jackson M, Shukla A. Performance of Sandwich Composites Subjected to Sequential Impact and Air Blast Loading. Composites: Part B 2010; doi:10.1016/j.compositesb.2010.09.005. 8. Schubel PM, Luo J, Daniel I. Impact and Post Impact Behavior of Composite Sandwich Panels. Composites: Part A 2007; 38:1051-1057. 9. Arora H, Hooper P, Dear JP. Impact and Blast Resistance of Glass Fibre Reinforced Sandwich Composite Materials. In: Proceedings of IMPLAST 2010; October 2010. 10. Hodge N. Military Experimenting with ‘Spray On’ Armor for Humvees. Defense Today 2004; 25 11. Amini MR, Isaacs JB, Nemat-Nasser S. Experimental Investigation of Response of Monolithic and Bilayer Plates to Impulsive Loads. International Journal of Impact Engineering 2010; 37:82-89 12. Amini MR, Simon J, Nemat-Nasser S. Numerical Modeling of Effect of Polyurea on Response of Steel Plates to Impulsive Loads in Direct Pressure-Pulse Experiments. Mechanics of Materials 2010; 42:615-627
89
13. Amini MR, Isaacs JB, Nemat-Nasser S. Investigation of Effect of Polyurea on Response of Steel Plates to Impulsive Loads in Direct Pressure-Pulse Experiments. Mechanics of Materials 2010; 42:628-639 14. Gardner N, Wang E, Kumar P, Shukla A. Blast Mitigation in a Sandwich Composite Using Graded Core and Polyurea Interlayer. Experimental Mechanics; In Process 15. Geer D. Boat Strength for Builders, Designers, and Owners. International Marine 2000. ISBN 0-07-023159-1 16. Casey D. This Old Boat. International Marine 2009. ISBN 978-0-07-147794-9 17. Poche L, Zalesak J. Development of a Water-Filled Conical Shock Tube for Shock Testing of Small Sonar Transducers by Simulation of the Test Conditions for the Heavyweight MIL-S-901D (Navy). NRL Memorandum Report 7109, 10 October 1992. 18. Coombs A, Thornhill CK. An Underwater Explosive Shock Gun. Journal of Fluid Mechanics 1967; 29:373-383. 19. Filler WS. Propagation of Shock Waves in a Hydrodynamic Conical Shock Tube. The Physics of Fluids 1964; 7:664-667. 20. LeBlanc J, Shukla A. Dynamic Response and Damage Evolution in Composite Materials Subjected to Underwater Explosive Loading: An Experimental and Computational Study. Composite Structures 2010; 92:2421-2430. 21. Tiwari V, Sutton MA, McNeill SR. Assessment of High Speed Imaging Systems for 2D and 3D Deformation Measurements: Methodology Development and Validation. Experimental Mechanics 2007; 47:561-579. 22. Tiwari V, Sutton MA, McNeill SR, Xu S, Deng X, Fourney WL, Bretall D. Application of 3D Image Correlation for Full-Field Transient Plate Deformation Measurements During Blast Loading. International Journal of Impact Engineering 2009; 36:862-874.
90
CHAPTER 5
CONCLUSIONS AND FUTURE WORK
1. CONCLUSIONS
This research has studied the dynamic response and damage evolution of composite
materials when subjected to underwater explosive loading conditions. The work consisted of
both experimental work and computational simulations to aid in the understanding of the
behavior of these materials. The objective of the study was to develop a better understanding of
the shock response of composite materials leading to more efficiently designed structures. The
relevant findings resulting from the present study are presented below.
(1) An experimental methodology has been developed which subjects composite plates of
both flat and curved geometries to shock loading resulting from an underwater
explosion. A conical shock tube facility is utilized which replicates the free field
expansion of pressure waves resulting from the explosion. The plates are air backed and
held with fully clamped boundary conditions. The dynamic response of the back face of
the specimens is captured through the use of strain gages and digital image correlation.
The use of digital image correlation allowed for the capture of the full field deformation
and velocity histories.
(2) A modeling methodology has been developed that is able to accurately simulate the
response of the composite material as observed during the experiments. The modeling is
performed utilizing the commercially available LS-DYNA explicit finite element code.
The finite element models consist of both the water within the conical shock tube and
the composite plate. The models are able to capture the fluid structure interation
between the water and the plates as well as the transient response of the plates.
91
Additionally the models are able to simulate the onset of material damage including both
in-plane and through thickness mechanisms.
(3) The results from the shock experiments and the computational simulations have been
correlated using both the dynamic response histories as well as the final damage states.
The time histories obtained from the strain gages and the digital image correlation
results have been correlated to the simulation results using the Russell Error. This is a
method which evaluates the differences in two transient data sets by quantifying the
variation in magnitude and phase. The correlation between the strain, deflection, and
velocities for the respective experiments were found to fall within the acceptable criteria
with some comparisons being excellent. Additionally, comparisons between the final
material damage state in the experiment and the simulation were agreeable both in terms
of the type and extent of the individual mechanisms.
(4) The effects of laminate modifications were studied to determine the effectiveness of
each on improving the response to shock loading. Three laminate constructions were
investigated: (1) a baseline 0°/90° biaxial layup, (2) a 0°/90° biaxial layup that includes
a thin glass veil between plies, and (3) a 0°/90° biaxial layup that has a coating of
polyurea applied to the back face. It was found that coating the back face of the material
with a layer of polyurea improved the damage mitigation performance of the composite
plates, while conversely including a glass veil between plies degraded the material
performance.
2. FUTURE WORK
The current investigation has provided a basis for experimental and computation techniques
which can be applied to the study of the dynamic response of composite materials subjected to
92
underwater explosive loading conditions. There however, remains a significant body of work to
be completed in this area before the dynamic response of these materials matures to an
equivalent level of understanding as that for metallic materials. This work includes further
experimental and computational studies as well as work which correlates the two. This will
effectively lead to validated modeling practices that can be applied during the design phase of
composite structures. The proposed potential future projects are summarized as follows:
1. Perform small scale underwater explosive experiments in which the charge is located much
closer to the composite plates than what was performed in this study. In the current study
the standoff distance was large compared to the plate geometry, whereas future work should
examine the effects of charge standoffs which are smaller than the plate dimensions. At
smaller standoff distances the pressure wave will have a much more spherical shape when it
interacts with the plates as opposed to the current study where near planar conditions were
achieved and the plate was loaded over its entire surface area. Smaller standoffs will
examine the localized effects of UNDEX loading as only a portion of the plate surface may
be loaded.
2. Conduct shock experiments in which the complexity of the geometry of the test articles is
further increased. In the current study plates that were flat or had a smooth curve to them
were utilized. More complex geometries could include oblong spheroids, cylinders, and
plates with abrupt angle changes. The goal should be to incorporate real world design
shapes into the test article geometry. The current finite element modeling methodology
should also be expanded to simulate these experiments to ensure it is able to accurately
simulate the geometrical effects.
93
3. Conduct an experimental and computational study to more effectively model delamination
damage and determine the appropriate governing parameters. The current study utilized a
tiebreak surface to surface contact definition to model the ply interfaces where the
delamination value was taken to be percentage of the resin properties. This modeling
methodology has the potential to be improved through other representations of this interface
including the use of cohesive elements or constraint sets. An experimental method should
be employed to provide a basis to which the simulations can be compared to and validated
against.
4. Investigate the effects of underwater explosive loading on other materials and laminate
constructions. In the current study E-Glass was used as the structural fibers in all of the
laminates. The performance of other materials such as S-Glass, Carbon, and Kevlar should
be examines as well as the possibility of hybrid materials such as Glass / Carbon
constructions. The performance of these materials needs to be understood as they inherently
have different characteristics. For example carbon fibers have higher tensile strengths and
modulus but fail much more catastrophically than glass fibers which have more elongation.
Additionally the response of other laminate constructions should be examined. The current
research utilized laminates which were constructed using individual layers of continuous
fibers. There now exist three dimensional (3D) fabrics which include through thickness
fibers which are inter-woven through the cloth. These through thickness fibers may
improve the performance of the laminates in terms of reducing the delamination damage.
5. Conduct an investigation into the response of submerged composite structures to high
hydrostatic pressures. This would provide insight as to how a composite structure would
implode as compared to a corresponding metallic structure. For example the implosion
94
process for metallic cylinders is well understood including collapse pressure and final shape.
However there is little understanding of how a composite cylinder of equivalent strength
would collapse.
95
BIBLIOGRAPHY
Amini, M.R., Isaacs, J.B., Nemat-Nasser, S., “Experimental Investigation of Response of
Monolithic and Bilayer Plates to Impulsive Loads”, International Journal of Impact Engineering, 37, 2010, pp: 82-89
Amini, M.R., Simon, J., Nemat-Nasser, S., “Numerical Modeling of Effect of Polyurea on
Response of Steel Plates to Impulsive Loads in Direct Pressure-Pulse Experiments”, Mechanics of Materials, 42, 2010, pp: 615-627
Amini, M.R., Isaacs, J.B., Nemat-Nasser, S., “Investigation of Effect of Polyurea on Response of
Steel Plates to Impulsive Loads in Direct Pressure-Pulse Experiments”, Mechanics of Materials, 42, 2010, pp: 628-639
Arora, H., Hooper, P., Dear, J.P., “Impact and Blast Resistance of Glass Fibre Reinforced
Sandwich Composite Materials”, Proceedings of IMPLAST 2010, October 2010. Batra, R.C., Hassan, N.M., “Response of Fiber Reinforced Composites to Underwater Explosive
Loads”, Composites: Part B, 38, 2007, pp: 448–468. Bogdanovich, A., Singletary, J., Mohamed, M., “A new generation of composites reinforced
with 3-D woven fabric performs”, Proceedings of the 22nd international SAMPE Europe conference, Paris, France, March 27–29, 2001
Casey, D., This Old Boat, International Marine, 2009. ISBN 978-0-07-147794-9 Chan, S., Fawaz, Z., Behdinan, K., Amid, R., “Ballistic limit prediction using a numerical model
with progressive damage capability”, Composite Structures, 77, 2007, pp: 466–474. Coombs, A., Thornhill, C.K., “An Underwater Explosive Shock Gun”, Journal of Fluid
Investigate Deformation of Structural Elements Subjected to Impulsive Loading”, Experimental Mechanics, 46, 2006, pp: 805-824.
Filler, W.S., “Propagation of Shock Waves in a Hydrodynamic Conical Shock Tube”, The
Physics of Fluids, 7, 1964, pp: 664-667
96
Franz, T., Nurick, G., Perry, M., “Experimental Investigation into the Response of Chopped-
Strand Mat Glassfibre Laminates to Blast Loading”, International Journal of Impact Loading, 27, 2002, pp: 639- 667.
Gama, B., Xiao, J., Haque, M., Yen, C., Gillespie, J., “Experimental and numerical
investigations on damage and delamination in thick plain weave S-2 glass composites under quasi-static punch shear loading”, Center for Composite Materials, University of Delaware 2004.
Gardner, N., Wang, E., Kumar, P., Shukla, A., “Blast Mitigation in a Sandwich Composite Using
Graded Core and Polyurea Interlayer”, Experimental Mechanics; In Process Geer, D., Boat Strength for Builders, Designers, and Owners, International Marine, 2000. ISBN
0-07-023159-1 Hodge, N., “Military Experimenting with ‘Spray On’ Armor for Humvees”, Defense Today, 25,
2004 Hosseinzadeh, R., Shokrieh, M.M., Lessard, L., “Damage Behavior of Fiber Reinforced
Composite Plates Subjected to Drop Weight Impacts”, Composites Science and Technology, 66, 2006, pp: 61–68.
Jacinto, A., Ambrosini, R., Danesi, R., “Experimental and Computational Analysis of Plates
Under Air Blast Loading”, International Journal of Impact Engineering, 25, 2001, pp: 927 – 947.
Jackson, M., Shukla, A., “Performance of Sandwich Composites Subjected to Sequential Impact
and Air Blast Loading”, Composites: Part B, 42, 2011, pp: 155-166 LeBlanc, J., Shukla, A., Rousseau, C., Bogdanovich, A., “Shock loading of three-dimensional
woven composite materials”, Composite Structures, 79, 2007, pp: 344-355. LeBlanc, J., Shukla, A., “Dynamic Response and Damage Evolution in Composite Materials
Subjected to Underwater Explosive Loading: An Experimental and Computational Study”, Composite Structures, 92, 2010, pp: 2421-2430.
Matzenmiller, A., Lubliner, J., Taylor, R.L., “A Constitutive Model for anisotropic damage in
fiber-composites”, Mechanics of Materials, 20, 1995, pp: 125-152. McGregor, C.J., Vaziri, R., Poursartip, A., Xiao, X., “Simulation of progressive damage
development in braided composite tubes under axial compression”, Composites: Part A, 38, 2007, pp: 2247–2259.
Mouritz, A.P., “The effect of underwater explosion shock loading on the fatigue behaviour of
GRP laminates”, Composites, 26, 1995, pp: 3-9
97
Mouritz, A.P., “Ballistic Impact and Explosive Blast Resistance of Stitched Composites”,
Composites: Part B, 32, 2001, pp: 431-439. Nurick, G., Olson, M., Fagnan, J., Levin, A., “Deformation and Tearing of Blast Loaded
Stiffened Square Plates” International Journal of Impact Engineering, 16, 1995, pp:273–291.
Nurick, G., Shave, G., “The Deformation and Tearing of Thin Square Plates Subjected to
Impulsive Loads - An Experimental Study”, International Journal of Impact Engineering, 18, 1996, pp: 99–116.
O’Daniel, J.L., Koudela, K.L., Krauthammer, T., “Numerical Simulation and Validation of
Distributed Impact Events”, International Journal of Impact Engineering, 31. 2005, pp: 1013–1038.
Poche, L., Zalesak, J., “Development of a Water-Filled Conical Shock Tube for Shock Testing of
Small Sonar Transducers by Simulation of the Test Conditions for the Heavyweight MIL-S-901D (Navy)”, NRL Memorandum Report 7109, 10 October 1992.
Russell, D.M., “Error measures for comparing transient data, Part I: Development of a
comprehensive error measure, Part II: Error measures case study”, Proceedings of the 68th Shock and Vibration Symposium, 3-6 November 1997.
Tiwari, V., Sutton, M.A., McNeill, S.R., “Assessment of High Speed Imaging Systems for 2D and 3D Deformation Measurements: Methodology Development and Validation”, Experimental Mechanics, 47, 2007, pp: 561-579.
“Application of 3D Image Correlation for Full-Field Transient Plate Deformation Measurements During Blast Loading”, International Journal of Impact Engineering , 36, 2009, pp: 862-874.
Wang, L., “Unloading Waves and Unloading Failures in Structures Under Impact Loading”,
International Journal of Impact Engineering, 30, 2004, pp: 889-900 Wierzbicki, T., Nurick, G., “Large Deformation of Thin Plates Under Localized Impulsive
Loading”, International Journal of Impact Engineering, 18, 1996, pp: 899 – 918. Williams, K.V., Vaziri, R., “Application of a damage mechanics model for predicting the impact
response of composite materials”, Computers and Structures, 79, 2001, pp: 997 – 1011. Xiao, J., Gama, B., Gillespie, J., “Progressive damage and delamination in plain weave S-2 glass
Yuan, F.,Tsai, L., Prakash, V., Rajendran, A.M., Dandeka, D., “Spall strength of glass fiber
reinforced polymer composites” International Journal of Solids and Structures, 44, 2007, pp: 7731–7747.
Zako, M., Uetsuji, Y., Kurashiki, T., “Finite Element Analysis of Damaged Woven Fabric
Composite Materials”, Composites Science and Technology, 63, 2003, pp:507-516. Zaretsky, E., deBotton, G., Perl, M., “The response of a glass fibers reinforced epoxy composite
to an impact loading”, International Journal of Solids and Structures, 41, 2004, pp: 569–584.