Dynamic response characteristics of a rock slopewith discontinuous joints under the combined actionof earthquakes and rapid water drawdown
Abstract In order to study the dynamic response characteristics ofa rock slope with discontinuities under the combined action ofearthquakes and rapid water drawdown, a large-scale shakingtable test was performed on a rock slope with discontinuous joints.Wenchuan earthquake (WE) seismic records were performed toinvestigate the horizontal and vertical acceleration response anddisplacement response. In particular, three-dimensional opticalmeasurement techniques was used to obtain the slope surfacedisplacements. A comparison was made on the seismic responseaccording to the analysis of PGD (peak ground displacement) andMPGA (acceleration amplification coefficient) of the modeled slope.The results show that the experimental slope mainly underwentsettlement and horizontal deformation when the WE records wereapplied in the z and x directions, respectively. The slope was firstshaken by the P wave, which caused the differential settlement tooccur at the surface slope; then, the slope was shaken moreseverely by the S wave, which led to a greater horizontal deforma-tion. Moreover, analysis of the ΔPGD (increment of PGD) andΔMPGA (increment of MPGA) under rapid drawdown suggests thatthe rapid water drawdown mainly impacts the deformation of thesurface slope, particularly between the high and low water levels.The water infiltration through the cracks softened the material ofthe surface slope, and the rapid drawdown also enhanced the slopedeformation. In addition, the damage evolution process of theslope can be identified, mainly including three stages: an elasticstage (< 0.168 g), a plastic stage (0.168–0.336 g), and a failure stage(> 0.336 g).
IntroductionEarthquake-induced rock landslides cause destructive damage andfatalities worldwide (Jiang et al. 2015; Massey et al. 2017), and sotheir dynamic stability should be analyzed accurately (Huang andLi 2009; Huang et al. 2013). The Ms 8.0 Wenchuan earthquakeoccurred in Wenchuan County, Sichuan Province, China, on 12May 2008, at the eastern edge of Qinghai-Tibet Plateau (Wanget al. 2009; Fan et al. 2016). The earthquake triggered extensivelandslides and collapses (Zhang et al. 2014; Gao et al. 2017), whichare the main geological disasters during the earthquake, including56,000 landslides and rock falls, which lead directly to approxi-mately 20,000 deaths (Huang and Li 2009; Dai et al. 2011). Fieldsurveys of geological disasters (Wang et al. 2009, 2011), observedthe phenomenon of wave propagation influencing slope stability.In Hongbai Town, Shifang City, Sichuan Province, 185 landslidesand 93 landslides occurred on the back and facing slope, respec-tively, in the valley that is nearly perpendicular to the seismic fault
(Wang et al. 2011). The proportion of landslides at each locationindicates that the wave propagation triggered more landslides onthe back slope. Moreover, most of the landslides near the earth-quake epicenter were subjected to strong lateral S wave forces andwere characterized by Bthrow-like collapses^ (Che et al. 2016). Pand S waves have significant impact on the rock slope stabilityduring earthquakes. Therefore, the dynamic stability of rockslopes has been one of the most important topics in geotechnicaland seismic engineering (Garevski et al. 2013; Shinoda 2015).
The dynamic response characteristics of rock slopes with com-plex geological structure has been studied by many researchers,particularly rock slopes with discontinuous joints. Normally, thedistribution of joints within a rock mass shows typical disconti-nuity, and the discontinuities play an important role in wavepropagation (Che et al. 2016). Weak structural surfaces contain alarge amount of discontinuous joints in rock masses, and themechanical properties of rock masses are further deteriorateddue to the extension and convergence of the joints. In particular,the geometric and mechanical parameters of discontinuous joints,especially the direction, angle, and location of the joints, have asubstantial impact on the slope stability (Jiang et al. 2013). There-fore, the dynamic response of rock slopes with discontinuousjoints under seismic excitation have been much more complicateddue to the complex composition of geological materials and dis-continuities in rock masses (Wang et al. 2009; Xu and Yan 2014;Dong et al. 2015; Che et al. 2016).
Reservoir water level fluctuation has been one of the mostimportant causal factors in the slope failure of reservoir banks(Berilgen 2007; Xia et al. 2013; Lu et al. 2015; Maihemuti et al. 2016).The pore pressure and seepage pressure increase gradually aswater infiltrates into the slope, and eventually lead to a changein the slope stability, in the process of water level fluctuation(Maihemuti et al. 2016). Water level fluctuation has an impact onthe flow direction of the water between the rock slopes and thereservoir, which leads to the varying pore-water pressure levels inslopes. The rock mass structure is in a dynamic state, balancing thestress from both the bank rock pore-water pressures and thereservoir water level via deformation to generate space for theflow of water within the rock matrix (Huang et al. 2016). It hasalso been acknowledged that water drawdown is a key triggeringfactor of slope failure (Gao et al. 2014; Moregenstern 2015). Inaddition, western China is an earthquake-prone region, particu-larly the seismic belt distributed in the Yunnan-Kweichow Plateau.The stability of the reservoir bank landslides has become an urgentproblem during construction of large-scale projects in westernChina. The stability of a reservoir bank slope can be complicateddue to the combined influence of the reservoir water and earth-quakes, and their stability directly affects the operation of theengineering projects in the area. Therefore, special attention
Landslides
Original Paper
should be paid to the issue of rock slope stability under thecombined influence of earthquakes and reservoir water level.
Great efforts have been made to analyze the slope failuresinduced by earthquakes using various approaches. Field observa-tion, numerical calculation, and physical model tests are the mainmethods in researching the seismic response of rock slope (Liuet al. 2014b). Numerical methods have been widely used to simu-late the actual failure mechanisms of landslides, such as the finiteelement method (FEM) (Toki et al. 2010), the discrete elementmethod (DEM) (Jiang et al. 2015), the discontinuous deformationanalysis (DDA) (Song et al. 2016), et al. In particular, numericalmethods have been used for the dynamic analysis of rock slopesunder seismic excitation; for example, to study the dynamic de-formation process (Jiang et al. 2015) and wave propagation char-acteristics (Che et al. 2016) as well as analyze discontinuousdeformation (Fu et al. 2016). However, using numerical methodsto study the dynamic stability of slopes has a few disadvantages.For example, FEM dynamic analysis is not suitable for largedeformation problems, discontinuous rock mass problems, infi-nite domain problems, and stress concentration problems. DEM issuitable for the discontinuous medium of large deformation prob-lems but has limitations for continuous media. DDA is applicablein the simulation of the deformation process of blocks but haslimitations for the selection of rock mass parameters. In particular,for complex rock mass slope structures, it is difficult to collectenough earthquake recordings by using the abovementionedmethods due to the unpredictable occurrence of earthquakes,and these methods cannot accurately evaluate the seismic re-sponse due to the simplifications of the boundary conditions,mesh generation, and parameter selection. In recent years, shakingtable tests have been used to simulate the variation of dynamicresponse of rock slopes and directly reveal the failure modes ofstructure under seismic excitation (Chen et al. 2016; Fan et al.2016), allowing various types of lithology combinations and struc-tures to be studied, in particular, slopes with discontinuous joints(Che et al. 2016) and slopes with weak intercalation (Chen et al.2016; Fan et al. 2016). In large-scale shaking table tests, the modelsize, the ground motion input parameters, and waveforms can becontrolled based on the case studies to enable the slope dynamicresponses to be measured to greater accuracy (Hong et al. 2005;Lin and Wang 2006; Lin et al. 2015; Yang et al. 2012). Therefore, theshaking table test method has been one direct way to simulate thevariation of dynamic response of slope and directly reveal thefailure modes of structure under seismic excitation (Chen et al.2016; Fan et al. 2016).
Many researchers have studied the dynamic acceleration re-sponse of a rock slope, which is regarded as a continuous medium,based on the analysis of acceleration (Lin and Wang 2006; Huanget al. 2013; Liu et al. 2014a; Fan et al. 2016). However, the analysis ofacceleration is a qualitative analysis method for rock slopes withcomplex geological structures, and errors can arise if the acceler-ation sensors are damaged during the vibration, which may lead tothe inaccurate assessment of the measured dynamic response. Theanalysis of surface displacement has been a direct, visible, andreliable method to reflect the dynamic deformation and failure ofslopes. In particular, the displacement data acquisition is carriedout by non-contact photographic technology, with no interferenceby seismic load. Moreover, the dynamic response of a rock slopethat is modeled as a non-uniform continuous medium with
discontinuous joints has not been widely discussed in terms ofthe surface displacement response; the analysis results are morereliable by using the simultaneous dynamic acceleration and sur-face displacements. These dynamic response characteristics alsohave not been widely studied with large-scale shaking table modeltests; therefore, there is only a small amount of information on theanalysis of the dynamic response of slopes due to earthquakes andrapid water drawdown.
This work takes an actual engineering project as an example,and a large-scale shaking table test was successfully performed ona slope with discontinuous bedding and counter-bedding jointsunder rapid water drawdown. Compared with previous studies,the geological structure of the model slope is very complicated inthe test, and displacement measuring device is more accurate, inparticular, the dynamic response characteristics of the slope wasanalyzed under the combined action of seismic excitation andrapid water drawdown. The analysis of the slope dynamic re-sponse characteristics has been derived from two aspects in thisresearch-displacement response of the slope surface and accelera-tion responses of the slope. Accelerometers were installed in theslope to monitor the acceleration, and a high accuracy displace-ment measurement system, the extended three-dimensional digitalimage correlation (XTDIC) system that utilizes three-dimensionaloptical measurement techniques, was used to obtain the slopesurface displacements. Moreover, the influence of wave propaga-tion directions on the slope deformation is studied, and the failuremechanism of the landslide induced by the P waves and S waveswas also analyzed by analyzing the PGD and MPGA. The influenceof rapid water drawdown on the slope deformation is also clarifiedby using ΔPGD and ΔMPGA. In addition, the failure mode of theslope composed of blocks and its evolution process of the damagedue to deformation is identified under the combined action ofearthquake excitation and rapid water drawdown, according to theanalysis of the PGD and MPGA. This work also discusses whichmethod is more suitable for the analysis of the slope deformationcharacteristics, given the comparative analysis of the PGD (ΔPGD)and MPGA (ΔMPGA).
Shaking table tests
Case studyThe proposed extra-large bridge of the Xiangli Highway over theJinsha River is in the transition zone between the southeast edge ofthe Tibetan Plateau and the Yunnan-Kweichow Plateau in South-west China (Fig. 1). The Lijiang River bank slope is located on theright bank of the Jinsha River, and the average natural gradient ofthe slope is approximately 40° (Fig. 2). The gradient of the pier isapproximately 30°. The soil thickness on the slope surface is 0–5 m, including the colluvial slope rock soil and brecciated soil.Many toppling joints and three bedding weak structural planesdeveloped in the rock mass, and the mountain unloading effect isstrong. The distance between toppling joints is approximately70 m, and the distance between bedding structural planes isapproximately 35 m. The geomorphology of the Lijiang slope isshown in Fig. 2b. Direct shear tests were performed to obtain thecohesive force (c) and internal friction angle (φ). Uniaxial com-pression tests were performed to obtain the elasticity modulus (E)and Poisson’s ratio (μ). The material parameters of the slope massand weak intercalated layers are shown in Table 1. The proposed
Original Paper
Landslides
bridge is located in earthquake-prone region, and a proposedreservoir will be built in the upper reaches of the bridge. Earth-quake and rapid water drawdown may be the main triggers of thereservoir bank landslides, particularly, under the combined influ-ence of their combination.
Technical backgroundA large-scale shaking table test was performed to elucidate thedynamic response characteristics and failure mode of a rock slope
with discontinuous joints, under the combined action of the res-ervoir water and earthquakes. Acceleration sensors were used torecord the acceleration-time curve and to clarify the dynamicacceleration response. The XTDIC measurement system wasadopted to analyze its dynamic surface displacement response.An additional 10-cm-thick buffer layer was mounted on the baseof the model to minimize the bottom boundary effect, where thematerials of the buffer layer are similar to that of the slope. Toeliminate the adverse effects of the wave propagation, a wave
Fig. 1 Location of the study area on the Xiangli highway
Lijiang slope Shangri-la slope
486
m
(a) (b)
Fig. 2 a Topography and geomorphology of Lijiang slope and b geological section of Lijiang slope
Landslides
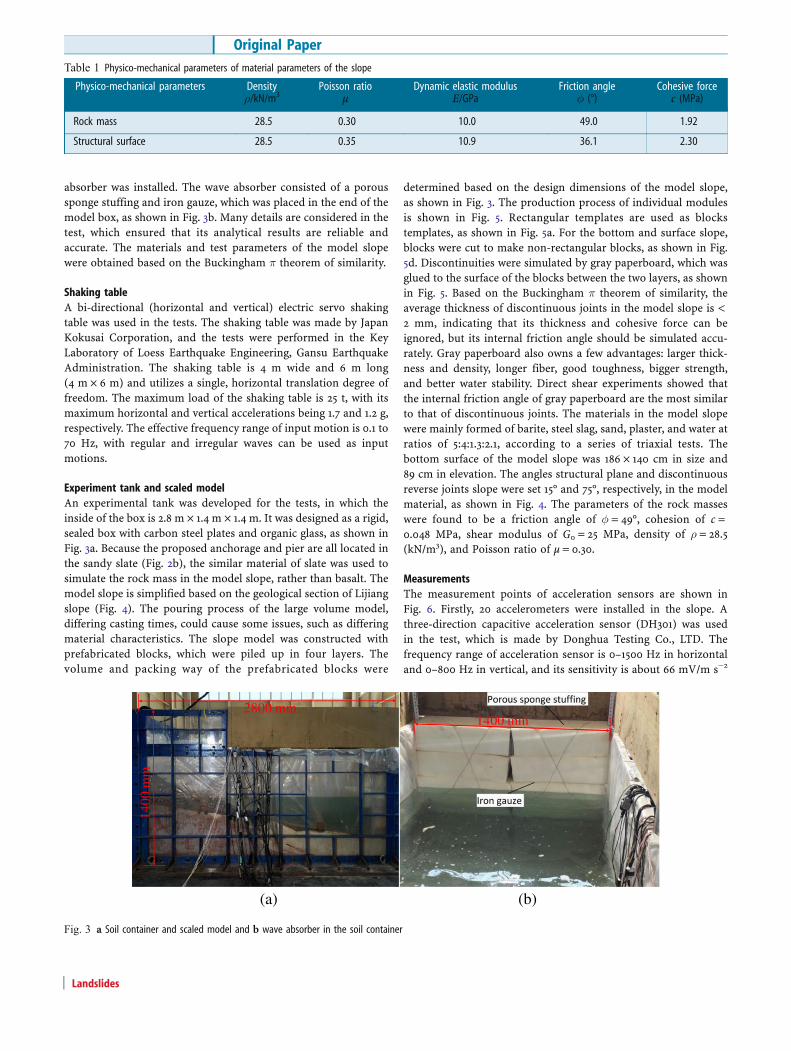
absorber was installed. The wave absorber consisted of a poroussponge stuffing and iron gauze, which was placed in the end of themodel box, as shown in Fig. 3b. Many details are considered in thetest, which ensured that its analytical results are reliable andaccurate. The materials and test parameters of the model slopewere obtained based on the Buckingham π theorem of similarity.
Shaking tableA bi-directional (horizontal and vertical) electric servo shakingtable was used in the tests. The shaking table was made by JapanKokusai Corporation, and the tests were performed in the KeyLaboratory of Loess Earthquake Engineering, Gansu EarthquakeAdministration. The shaking table is 4 m wide and 6 m long(4 m × 6 m) and utilizes a single, horizontal translation degree offreedom. The maximum load of the shaking table is 25 t, with itsmaximum horizontal and vertical accelerations being 1.7 and 1.2 g,respectively. The effective frequency range of input motion is 0.1 to70 Hz, with regular and irregular waves can be used as inputmotions.
Experiment tank and scaled modelAn experimental tank was developed for the tests, in which theinside of the box is 2.8 m × 1.4 m × 1.4 m. It was designed as a rigid,sealed box with carbon steel plates and organic glass, as shown inFig. 3a. Because the proposed anchorage and pier are all located inthe sandy slate (Fig. 2b), the similar material of slate was used tosimulate the rock mass in the model slope, rather than basalt. Themodel slope is simplified based on the geological section of Lijiangslope (Fig. 4). The pouring process of the large volume model,differing casting times, could cause some issues, such as differingmaterial characteristics. The slope model was constructed withprefabricated blocks, which were piled up in four layers. Thevolume and packing way of the prefabricated blocks were
determined based on the design dimensions of the model slope,as shown in Fig. 3. The production process of individual modulesis shown in Fig. 5. Rectangular templates are used as blockstemplates, as shown in Fig. 5a. For the bottom and surface slope,blocks were cut to make non-rectangular blocks, as shown in Fig.5d. Discontinuities were simulated by gray paperboard, which wasglued to the surface of the blocks between the two layers, as shownin Fig. 5. Based on the Buckingham π theorem of similarity, theaverage thickness of discontinuous joints in the model slope is <2 mm, indicating that its thickness and cohesive force can beignored, but its internal friction angle should be simulated accu-rately. Gray paperboard also owns a few advantages: larger thick-ness and density, longer fiber, good toughness, bigger strength,and better water stability. Direct shear experiments showed thatthe internal friction angle of gray paperboard are the most similarto that of discontinuous joints. The materials in the model slopewere mainly formed of barite, steel slag, sand, plaster, and water atratios of 5:4:1.3:2.1, according to a series of triaxial tests. Thebottom surface of the model slope was 186 × 140 cm in size and89 cm in elevation. The angles structural plane and discontinuousreverse joints slope were set 15° and 75°, respectively, in the modelmaterial, as shown in Fig. 4. The parameters of the rock masseswere found to be a friction angle of φ = 49°, cohesion of c =0.048 MPa, shear modulus of G0 = 25 MPa, density of ρ = 28.5(kN/m3), and Poisson ratio of μ = 0.30.
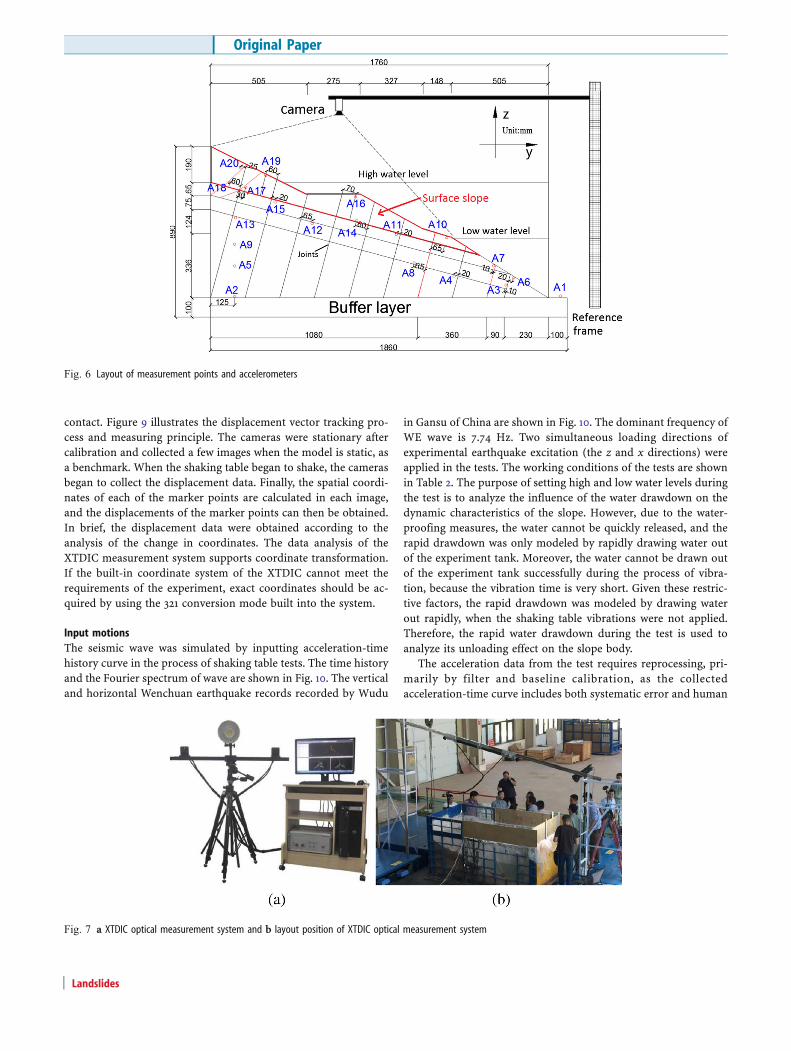
MeasurementsThe measurement points of acceleration sensors are shown inFig. 6. Firstly, 20 accelerometers were installed in the slope. Athree-direction capacitive acceleration sensor (DH301) was usedin the test, which is made by Donghua Testing Co., LTD. Thefrequency range of acceleration sensor is 0–1500 Hz in horizontaland 0–800 Hz in vertical, and its sensitivity is about 66 mV/m s−2
Table 1 Physico-mechanical parameters of material parameters of the slope
Physico-mechanical parameters Densityρ/kN/m3
Poisson ratioμ
Dynamic elastic modulusE/GPa
Friction angleφ (°)
Cohesive forcec (MPa)
Rock mass 28.5 0.30 10.0 49.0 1.92
Structural surface 28.5 0.35 10.9 36.1 2.30
(a) (b)
mm 0041
2800 mm1400 mm
Fig. 3 a Soil container and scaled model and b wave absorber in the soil container
Original Paper
Landslides
with the measuring range (Peak) being ± 20 m/s2. All of theacceleration sensors were embedded into the center of the slopemodel, in order to reduce the side boundary effect. Additionally, totrack the displacement of the slope subjected to seismic loads, anoptical measurement technique was also employed. The displace-ment data were collected by using the XTDIC measurement sys-tem. This system includes two cameras that each have a resolutionof two million pixels, and it has an acquisition frequency of 50 Hz,as shown in Fig. 7. One camera was used to collect the displace-ment data of the surface slope in the y and z directions, and theother camera was used to collect the displacement data in the xand z directions. The highest acquisition frequency of the XTDICmeasurement system is 340 Hz, and its measurement error isapproximately 0.05–0.1 mm, within a range of 5 m from the
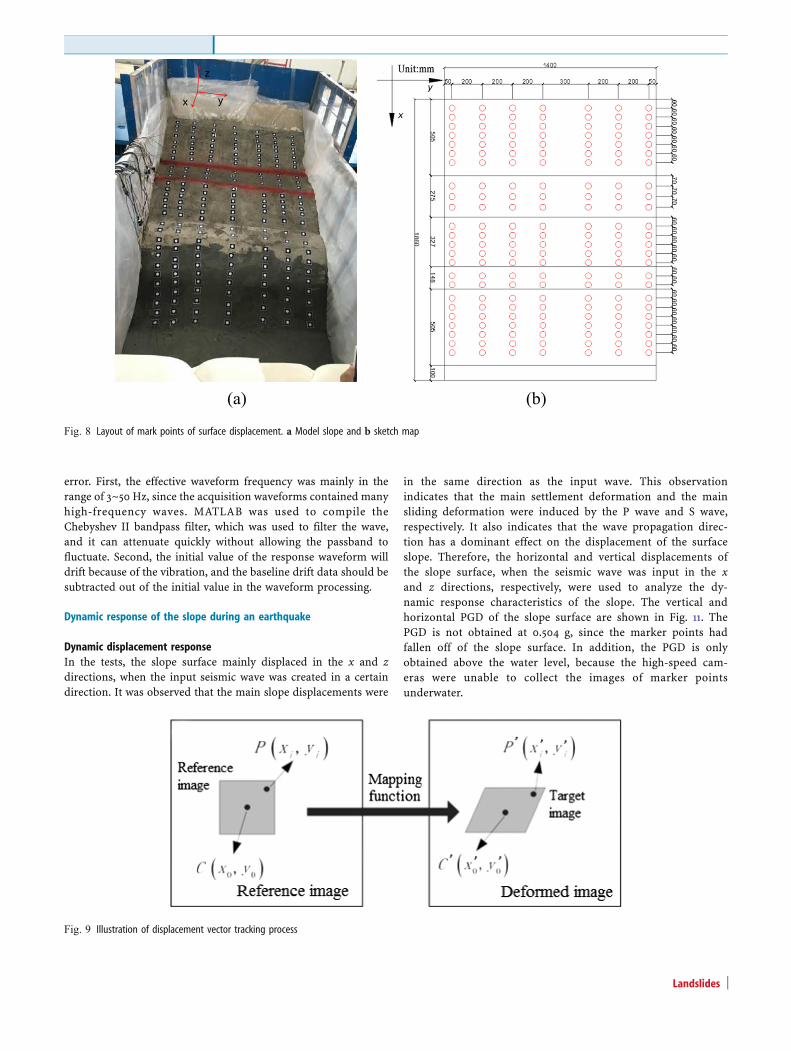
experimental slope. The deformation was observation on slopesurface, and 14-mm non-coding marker points were used at aninitial separation distance of 100–150 mm. The three-dimensionaldisplacement of every marked point was obtained in the tests, andthe layout scheme of the marked points is shown in Fig. 8.
The XTDIC measurement system is based on binocular stereovision technology, and it uses two high-speed cameras to collectthe real-time images in all stages of object deformation. Theaccurate recognition of the marker points or digital speckle canbe used to achieve stereo matching, including the coding and non-coding marker points, which were used to reconstruct the three-dimensional coordinates and displacements of the surface pointsand to calculate the deformation of the object. This method ishighly precise, is fast and easy to operate, and does not involve
Fig. 4 The model slope profile
170 mm
160 mm
350 mm(a)
350 mm
mm
071
(b)
Grey paperboard
(c)
174 mm
47 mm
(d)
Fig. 5 Prefabricated blocks production. a Block mold, b prefabricated blocks, c Gray paperboard, and d non-rectangular blocks production
Landslides
contact. Figure 9 illustrates the displacement vector tracking pro-cess and measuring principle. The cameras were stationary aftercalibration and collected a few images when the model is static, asa benchmark. When the shaking table began to shake, the camerasbegan to collect the displacement data. Finally, the spatial coordi-nates of each of the marker points are calculated in each image,and the displacements of the marker points can then be obtained.In brief, the displacement data were obtained according to theanalysis of the change in coordinates. The data analysis of theXTDIC measurement system supports coordinate transformation.If the built-in coordinate system of the XTDIC cannot meet therequirements of the experiment, exact coordinates should be ac-quired by using the 321 conversion mode built into the system.
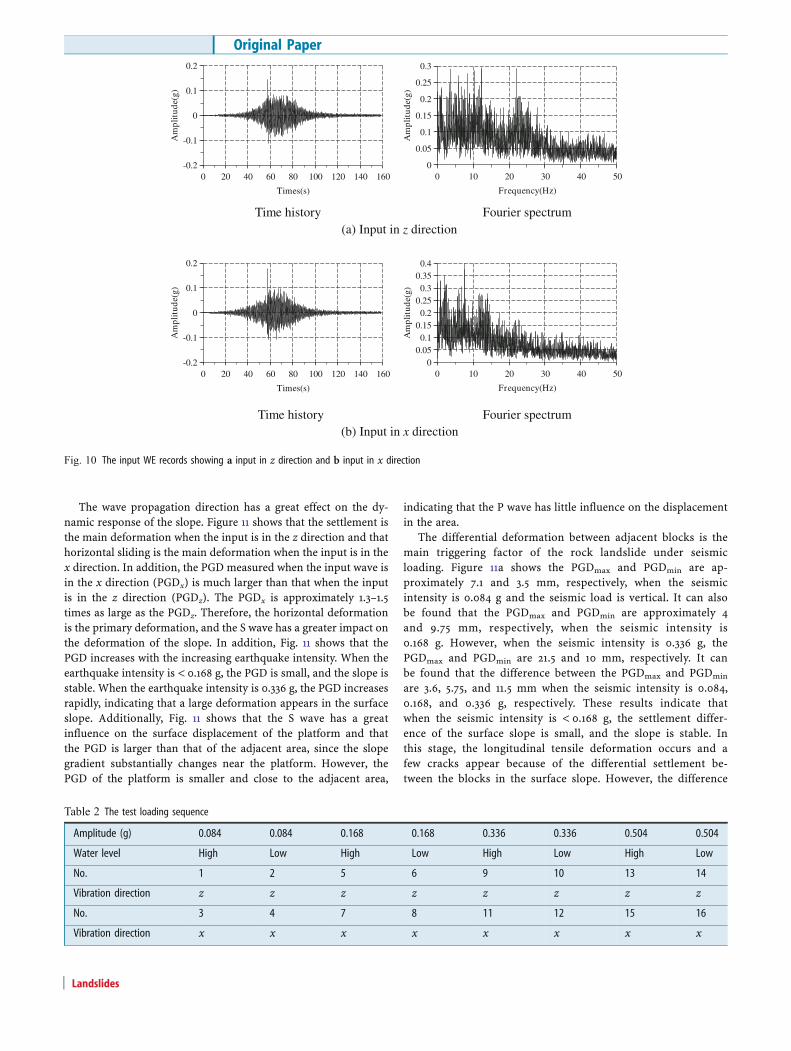
Input motionsThe seismic wave was simulated by inputting acceleration-timehistory curve in the process of shaking table tests. The time historyand the Fourier spectrum of wave are shown in Fig. 10. The verticaland horizontal Wenchuan earthquake records recorded by Wudu
in Gansu of China are shown in Fig. 10. The dominant frequency ofWE wave is 7.74 Hz. Two simultaneous loading directions ofexperimental earthquake excitation (the z and x directions) wereapplied in the tests. The working conditions of the tests are shownin Table 2. The purpose of setting high and low water levels duringthe test is to analyze the influence of the water drawdown on thedynamic characteristics of the slope. However, due to the water-proofing measures, the water cannot be quickly released, and therapid drawdown was only modeled by rapidly drawing water outof the experiment tank. Moreover, the water cannot be drawn outof the experiment tank successfully during the process of vibra-tion, because the vibration time is very short. Given these restric-tive factors, the rapid drawdown was modeled by drawing waterout rapidly, when the shaking table vibrations were not applied.Therefore, the rapid water drawdown during the test is used toanalyze its unloading effect on the slope body.
The acceleration data from the test requires reprocessing, pri-marily by filter and baseline calibration, as the collectedacceleration-time curve includes both systematic error and human
Fig. 6 Layout of measurement points and accelerometers
Fig. 7 a XTDIC optical measurement system and b layout position of XTDIC optical measurement system
Original Paper
Landslides
error. First, the effective waveform frequency was mainly in therange of 3~50 Hz, since the acquisition waveforms contained manyhigh-frequency waves. MATLAB was used to compile theChebyshev II bandpass filter, which was used to filter the wave,and it can attenuate quickly without allowing the passband tofluctuate. Second, the initial value of the response waveform willdrift because of the vibration, and the baseline drift data should besubtracted out of the initial value in the waveform processing.
Dynamic response of the slope during an earthquake
Dynamic displacement responseIn the tests, the slope surface mainly displaced in the x and zdirections, when the input seismic wave was created in a certaindirection. It was observed that the main slope displacements were
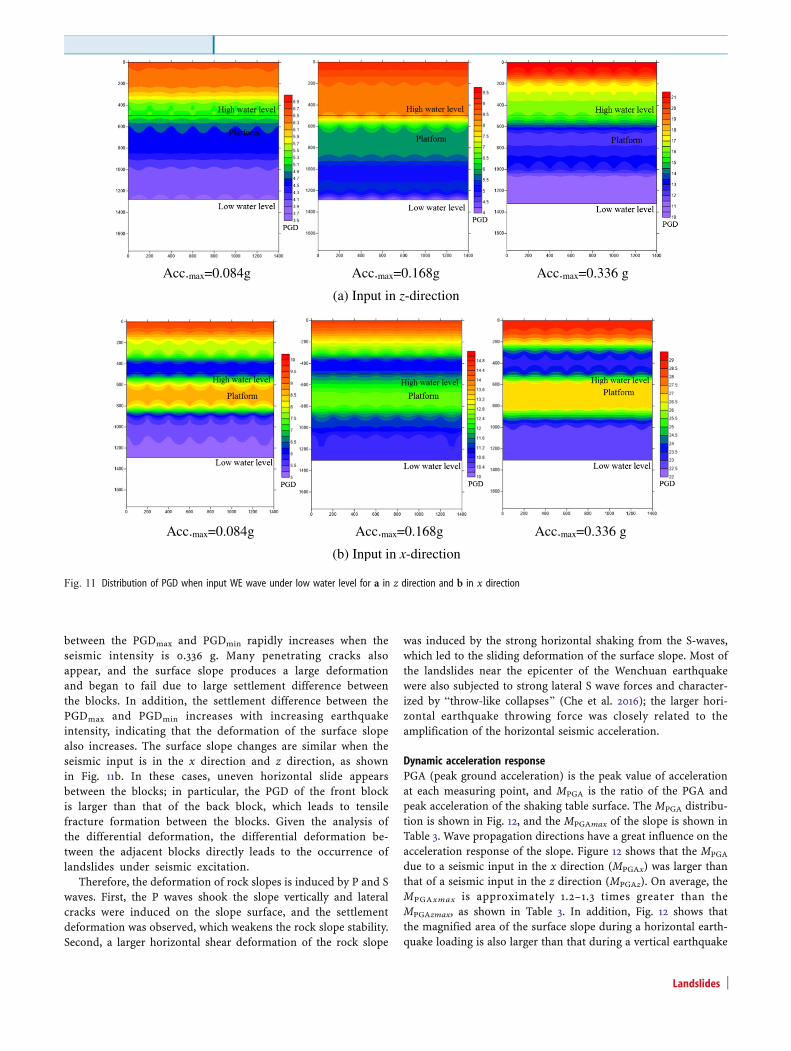
in the same direction as the input wave. This observationindicates that the main settlement deformation and the mainsliding deformation were induced by the P wave and S wave,respectively. It also indicates that the wave propagation direc-tion has a dominant effect on the displacement of the surfaceslope. Therefore, the horizontal and vertical displacements ofthe slope surface, when the seismic wave was input in the xand z directions, respectively, were used to analyze the dy-namic response characteristics of the slope. The vertical andhorizontal PGD of the slope surface are shown in Fig. 11. ThePGD is not obtained at 0.504 g, since the marker points hadfallen off of the slope surface. In addition, the PGD is onlyobtained above the water level, because the high-speed cam-eras were unable to collect the images of marker pointsunderwater.
(a) (b)
yx
z
Fig. 8 Layout of mark points of surface displacement. a Model slope and b sketch map
Fig. 9 Illustration of displacement vector tracking process
Landslides
The wave propagation direction has a great effect on the dy-namic response of the slope. Figure 11 shows that the settlement isthe main deformation when the input is in the z direction and thathorizontal sliding is the main deformation when the input is in thex direction. In addition, the PGD measured when the input wave isin the x direction (PGDx) is much larger than that when the inputis in the z direction (PGDz). The PGDx is approximately 1.3–1.5times as large as the PGDz. Therefore, the horizontal deformationis the primary deformation, and the S wave has a greater impact onthe deformation of the slope. In addition, Fig. 11 shows that thePGD increases with the increasing earthquake intensity. When theearthquake intensity is < 0.168 g, the PGD is small, and the slope isstable. When the earthquake intensity is 0.336 g, the PGD increasesrapidly, indicating that a large deformation appears in the surfaceslope. Additionally, Fig. 11 shows that the S wave has a greatinfluence on the surface displacement of the platform and thatthe PGD is larger than that of the adjacent area, since the slopegradient substantially changes near the platform. However, thePGD of the platform is smaller and close to the adjacent area,
indicating that the P wave has little influence on the displacementin the area.
The differential deformation between adjacent blocks is themain triggering factor of the rock landslide under seismicloading. Figure 11a shows the PGDmax and PGDmin are ap-proximately 7.1 and 3.5 mm, respectively, when the seismicintensity is 0.084 g and the seismic load is vertical. It can alsobe found that the PGDmax and PGDmin are approximately 4and 9.75 mm, respectively, when the seismic intensity is0.168 g. However, when the seismic intensity is 0.336 g, thePGDmax and PGDmin are 21.5 and 10 mm, respectively. It canbe found that the difference between the PGDmax and PGDmin
are 3.6, 5.75, and 11.5 mm when the seismic intensity is 0.084,0.168, and 0.336 g, respectively. These results indicate thatwhen the seismic intensity is < 0.168 g, the settlement differ-ence of the surface slope is small, and the slope is stable. Inthis stage, the longitudinal tensile deformation occurs and afew cracks appear because of the differential settlement be-tween the blocks in the surface slope. However, the difference
Time history Fourier spectrum(a) Input in z direction
Time history Fourier spectrum(b) Input in x direction
-0.2
-0.1
0
0.1
0.2
0 20 40 60 80 100 120 140 160)g(edutilp
mA
Times(s)
0
0.05
0.1
0.15
0.2
0.25
0.3
0 10 20 30 40 50
)g(edutilpm
A
Frequency(Hz)
-0.2
-0.1
0
0.1
0.2
0 20 40 60 80 100 120 140 160
)g(edutilpm
A
Times(s)
00.050.1
0.150.2
0.250.3
0.350.4
0 10 20 30 40 50
)g(edutilpm
A
Frequency(Hz)
Fig. 10 The input WE records showing a input in z direction and b input in x direction
between the PGDmax and PGDmin rapidly increases when theseismic intensity is 0.336 g. Many penetrating cracks alsoappear, and the surface slope produces a large deformationand began to fail due to large settlement difference betweenthe blocks. In addition, the settlement difference between thePGDmax and PGDmin increases with increasing earthquakeintensity, indicating that the deformation of the surface slopealso increases. The surface slope changes are similar when theseismic input is in the x direction and z direction, as shownin Fig. 11b. In these cases, uneven horizontal slide appearsbetween the blocks; in particular, the PGD of the front blockis larger than that of the back block, which leads to tensilefracture formation between the blocks. Given the analysis ofthe differential deformation, the differential deformation be-tween the adjacent blocks directly leads to the occurrence oflandslides under seismic excitation.
Therefore, the deformation of rock slopes is induced by P and Swaves. First, the P waves shook the slope vertically and lateralcracks were induced on the slope surface, and the settlementdeformation was observed, which weakens the rock slope stability.Second, a larger horizontal shear deformation of the rock slope
was induced by the strong horizontal shaking from the S-waves,which led to the sliding deformation of the surface slope. Most ofthe landslides near the epicenter of the Wenchuan earthquakewere also subjected to strong lateral S wave forces and character-ized by Bthrow-like collapses^ (Che et al. 2016); the larger hori-zontal earthquake throwing force was closely related to theamplification of the horizontal seismic acceleration.
Dynamic acceleration responsePGA (peak ground acceleration) is the peak value of accelerationat each measuring point, and MPGA is the ratio of the PGA andpeak acceleration of the shaking table surface. The MPGA distribu-tion is shown in Fig. 12, and the MPGAmax of the slope is shown inTable 3. Wave propagation directions have a great influence on theacceleration response of the slope. Figure 12 shows that the MPGA
due to a seismic input in the x direction (MPGAx) was larger thanthat of a seismic input in the z direction (MPGAz). On average, theMPGAxmax is approximately 1.2–1.3 times greater than theMPGAzmax, as shown in Table 3. In addition, Fig. 12 shows thatthe magnified area of the surface slope during a horizontal earth-quake loading is also larger than that during a vertical earthquake
Acc.max=0.084g Acc.max=0.168g Acc.max=0.336 g
(a) Input in z-direction
Acc.max=0.084g Acc.max=0.168g Acc.max=0.336 g
(b) Input in x-direction
Fig. 11 Distribution of PGD when input WE wave under low water level for a in z direction and b in x direction
Landslides
Acc.max=0.084g Acc.max=0.168 g
Acc.max=0.336g Acc.max=0.504 g
(a) Input in z-direction
Acc.max=0.084g Acc.max=0.168 g
Acc.max=0.336g Acc.max=0.504 g
(b) Input in x-direction
Fig. 12 Distribution of MPGA when input WE wave under high water level for a in z direction and b in x direction
Original Paper
Landslides
loading. This is because the slope weight has an adverse effect onthe amplification of the vertical acceleration, which leads to arestrained acceleration amplification effect in the z direction. Dur-ing the earthquake, the slope deformation was mainly induced bythe P and S waves. The slope was first shaken by the P wave.Differential settlement occurred in the surface slope, which led tothe formation of many vertical cracks between the discontinuousjoints and consequently the formation of the blocks, which ulti-mately increased the free surface of the surface slope. Then, theslope was shaken by S wave, and the inertial force of the surfaceslope becomes larger than that during the P wave shaking, whichleads to a more marked magnification of acceleration than thatcreated by P wave. Therefore, the magnified acceleration effect ofthe slope was more substantial when the seismic wave was input inthe x direction, indicating that the slope deformation was triggeredby the S wave.
Evolution process of damage deformationThree blocks between the experimental high and low water levelswere selected as examples to clarify the evolution process of
deformation and failure of the slope, and the PGD and MPGA ofthe surface slope are analyzed in Fig. 13. The three blocks includeblock 1 (A10), block 2 (A11), and block 3 (A16) from the low waterlevel experiments, and the average PGD of the three blocks wasused in this analysis. Figure 13 shows the evolution process of thedamage deformation of the slope can be divided into three stages:stage 1 (< 0.168 g), stage 2 (0.168–0.336 g), and stage 3 (> 0.336 g). Itshould be noted that the PGD of the three blocks in stage 3 arepredicted values. Due to the marker points falling off the slopesurface in stage 3, the predicted values are based on two aspects.First, the increasing rate of the PGD clearly increases with increas-ing seismic intensity, and the PGD predictive values can be deter-mined from the seismic intensity, within a certain range. Second,the lateral displacements can be obtained during the test, but theycannot be used to analyze the actual dynamic response because thelateral displacements were constrained by the model box walls,and their values were slightly smaller than that of the slope sur-face. However, the increasing trend between the lateral displace-ments and surface displacements is similar. Therefore, the PGDpredictive values in stage 3 can be obtained within a certain range.
Both the MPGA and the PGD increase with the increasingearthquake intensity, but they increase at different rates. Therate of increase in the MPGA decreases gradually with increas-ing earthquake intensity, while the rate of increase in the PGDcontinuously increases. First, the MPGA increases rapidly instage 1 because no clear deformation occurs in the slope. Instage 1, the PGD increases slowly, and the inertial force of thesurface slope increases with increasing earthquake intensity,which leads to the rapid acceleration amplification effect.Second, the rate of increase in the PGD quickly increases instage 2, while that of the MPGA decreases to a certain degree.This is due first to the many cracks forming in the surfaceslope; as the experiment progresses, these cracks propagate,deepen, and often connect with the increase in the seismicintensity. It is notable that a large deformation occurs in stage2 with much larger displacements, which makes the rate ofincrease in the slope inertial force decrease to a certainextent, which leads to an increased change in the decreasingamplification effect. Finally, in stage 3, the predictive PGDalso quickly increases, and the MPGA is generally stable, whichindicates that failure begins; sliding along the slip surfaceoccurs when the earthquake intensity reaches a certain value.
Therefore, the damage deformation process of the slope can bedivided into three stages: elastic stage (< 0.168 g), plastic stage(0.168–0.336 g), and failure stage (> 0.336 g). Moreover, the dam-age deformation process of the slope can be identified by either theMPGA or PGD. It is notable that a rapid increase in the PGD can beidentified between damage stages. However, the change in theMPGA is smaller, particularly in stages 2 and 3. This indicates thatthe damage deformation process of the slope can be elucidated byusing the PGD, particularly if a large deformation of the slopeoccurs, and the rapid increase in the PGD can reflect the defor-mation more clearly than the MPGA.
Dynamic deformation characteristic under the combined action ofearthquakes and rapid drawdownEarthquakes and rapid water drawdown are the two maintriggers of reservoir bank landslides. The dynamic surfacedisplacements and acceleration amplification effect were used
Table 3 The MPGAmax of the slope when input in x and z directions
Earthquake intensity(g)
0.084 0.168 0.336 0.504
MPGAxmax 2.1 2.3 2.9 3.2
MPGAzmax 1.6 2.1 2.4 2.8
(a) Input in z-direction
(b) Input in x-direction
1
1.5
2
2.5
3
3.5
0.05 0.15 0.25 0.35 0.45 0.55
MP
GA
Earthquake intensity/g
A10A11A16
A10A11A16
2
5
8
11
14
17
20
PG
D/m
m
MPGA PGD
Stage 1
Stage 2Stage 3
1
1.5
2
2.5
3
3.5
4
0.05 0.15 0.25 0.35 0.45 0.55
MP
GA
Earthquake intensity/g
A10A11A16
A10A11A16
5
10
15
20
25
30
35
PG
D/m
m
MPGA PGD
Stage 2
Stage 1Stage 3
Fig. 13 Relationship between MPGA and PGD under low water level for a in zdirection and b in x direction
Landslides
to analyze the influence of these two triggers on the dynamicdeformation characteristics of the slope, by using the ΔPGDand ΔMPGA.
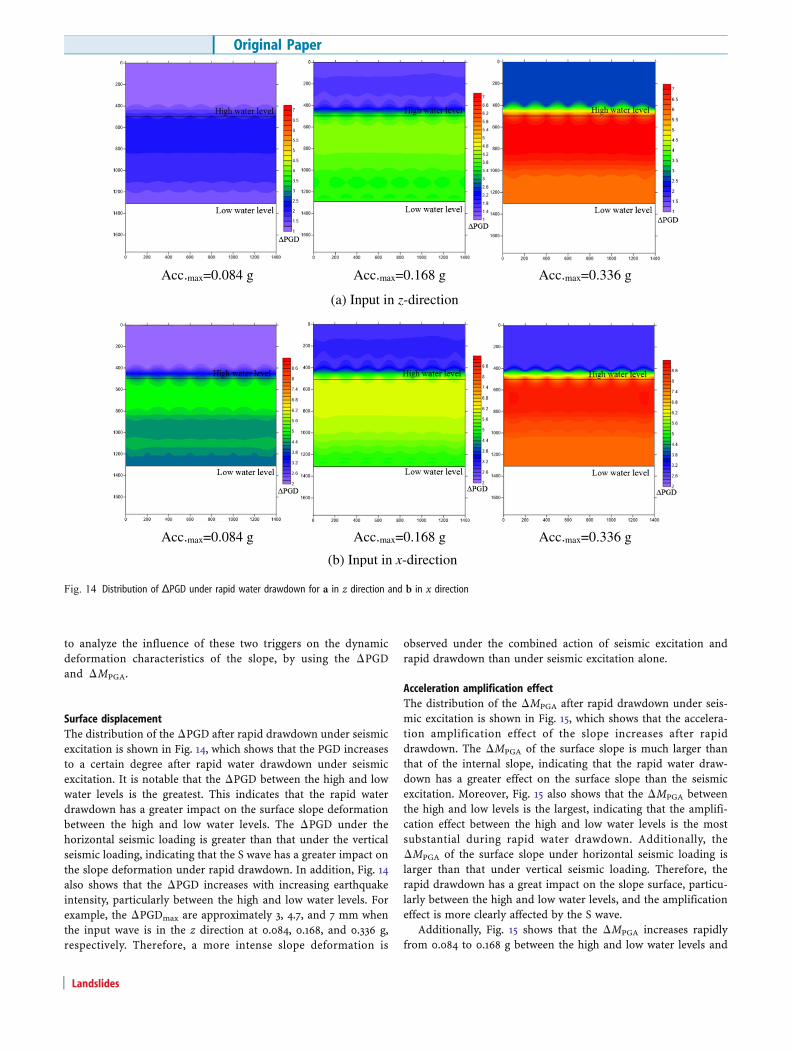
Surface displacementThe distribution of the ΔPGD after rapid drawdown under seismicexcitation is shown in Fig. 14, which shows that the PGD increasesto a certain degree after rapid water drawdown under seismicexcitation. It is notable that the ΔPGD between the high and lowwater levels is the greatest. This indicates that the rapid waterdrawdown has a greater impact on the surface slope deformationbetween the high and low water levels. The ΔPGD under thehorizontal seismic loading is greater than that under the verticalseismic loading, indicating that the S wave has a greater impact onthe slope deformation under rapid drawdown. In addition, Fig. 14also shows that the ΔPGD increases with increasing earthquakeintensity, particularly between the high and low water levels. Forexample, the ΔPGDmax are approximately 3, 4.7, and 7 mm whenthe input wave is in the z direction at 0.084, 0.168, and 0.336 g,respectively. Therefore, a more intense slope deformation is
observed under the combined action of seismic excitation andrapid drawdown than under seismic excitation alone.
Acceleration amplification effectThe distribution of the ΔMPGA after rapid drawdown under seis-mic excitation is shown in Fig. 15, which shows that the accelera-tion amplification effect of the slope increases after rapiddrawdown. The ΔMPGA of the surface slope is much larger thanthat of the internal slope, indicating that the rapid water draw-down has a greater effect on the surface slope than the seismicexcitation. Moreover, Fig. 15 also shows that the ΔMPGA betweenthe high and low levels is the largest, indicating that the amplifi-cation effect between the high and low water levels is the mostsubstantial during rapid water drawdown. Additionally, theΔMPGA of the surface slope under horizontal seismic loading islarger than that under vertical seismic loading. Therefore, therapid drawdown has a great impact on the slope surface, particu-larly between the high and low water levels, and the amplificationeffect is more clearly affected by the S wave.
Additionally, Fig. 15 shows that the ΔMPGA increases rapidlyfrom 0.084 to 0.168 g between the high and low water levels and
Acc.max=0.084 g Acc.max=0.168 g Acc.max=0.336 g
Acc.max=0.084 g Acc.max=0.168 g Acc.max=0.336 g
(a) Input in z-direction
(b) Input in x-direction
Fig. 14 Distribution of ΔPGD under rapid water drawdown for a in z direction and b in x direction
Original Paper
Landslides
then it decreases from 0.168 to 0.336 g, while the ΔMPGA arearemains fairly consistent. This observation indicates that the slope
is stable when the ΔMPGA is < 0.336 g. However, the ΔMPGA laterrapidly decreases from 0.336 to 0.504 g; the ΔMPGA area also
Acc.max=0.084 g
Acc.max=0.336 g(a) Input in z-direction
Acc.max=0.084 g
Acc.max=0.336 g
Acc.max=0.168 g
Acc.max=0.504 g
Acc.max=0.168 g
Acc.max=0.504 g(b) Input in x-direction
Fig. 15 Distribution of ΔMPGA after rapid water drawdown for a in z direction and b in x direction
Landslides
decreases and is localized on the platform area. This is because thesurface slope has been damaged, and the amplification effectdecreases. Therefore, the acceleration amplification effect of theslope increases with increasing seismic loading, but the ΔMPGA
decreases from 0.168 to 0.504 g under rapid water drawdown.
Analysis of the damage deformation processTo further clarify the slope damage deformation under thecombined action of earthquakes and rapid drawdown, thechange in the ΔMPGA and ΔPGD of the three blocks underrapid water drawdown were also analyzed, as shown in Fig. 16.Figure 16 shows that the change in ΔMPGA and ΔPGD isdifferent with increasing earthquake intensity. The ΔMPGA
first increases from 0.084 to 0.168 g and then graduallydecreases from 0.168 to 0.504 g, but the ΔPGD increaseslinearly with the increasing earthquake intensity. The influ-ence of rapid drawdown on the slope deformation under theearthquake excitation is clearer in the analysis of the PGD.There is no obvious deformation observed from 0.084 to0.168 g, indicating that the ΔMPGA increases rapidly, due tothe following two reasons. First, water infiltrates into theslope through cracks and softens the joints and slip surfacematerial. Second, the rapid water drawdown promotes thedeformation of the slope by producing an unloading effectof the slope and a water hammer effect in the cracks, increas-ing the inertial force and the downward drag force of thesurface slope. Finally, this leads to the gradual decrease in theΔMPGA after rapid drawdown, and the surface slope
transitions from an elastic state to a plastic state when theΔMPGA is > 0.168 g. However, the surface displacement alwaysincreases due to the increasing deformation of the surfaceslope, which leads to the overall increase in the ΔPGD.Therefore, the MPGA and PGD increase after rapid drawdown,as shown in Fig. 16. Rapid drawdown has less of an influenceon the MPGA and a greater impact on the PGD with increasingearthquake intensity. Moreover, a rapid increase in the PGDcan be identified under the combined action of earthquakesand rapid drawdown, but the change in the MPGA is notobvious, particularly when the slope damage begins, for ex-ample, when the earthquake intensity is > 0.168 g.
Slope damage phenomenonThe dynamic failure process of the slope is shown in Fig. 17.Figure 17a shows that no obvious cracks appear when theseismic intensity is < 0.168 g. Figure 17b shows that the initialrupture follows the crack near the slope surface when theseismic intensity reaches 0.336 g, and many cracks appearbetween the high and low water levels. The cracks propagatefurther, deepen, and often connect, but at this stage, thesliding body has not yet formed. Figure 17c shows that morecracks appear in a wider area, and a large deformation can befound on the surface slope when the seismic intensity is0.504 g. Finally, when the seismic load reaches a thresholdvalue, the surface slope divides into multiple separate blocks,and surface slope slides along the slip surface, which wasobserved along the gray paperboard, as shown in Figs. 17dand 18. The dynamic failure process can also be divided intothree stages based on the deformation phenomenon: the stagewith no obvious deformation (< 0.168 g), the stage in whichlarge deformation occurs (0.168–0.336 g), and the stage inwhich damage occurs (> 0.336 g).
Additionally, Fig. 17d also shows that the settlement andsliding deformation can be observed at the top of the slope,which is because the acceleration amplification effect at thetop of the slope is the most intense. Figure 17c, d shows thatthe area between the high and low water levels is damagedmore intensely. Importantly, the rapid water drawdown andwater infiltration greatly impact the deformation of the areaand promote the deformation of the surface slope. Theirinfluence can be summarized as follows. First, the seepageline of the slope was mainly along the slip surface andcracks along the joints in the surface slope, as shown inFig. 18. Many cracks occur at the surface slope during theearthquake. Reservoir water infiltrates into the slope throughthe cracks below the high water level, which reduces thestrength of the joints and slip surface materials and allowsthe cracks to propagate, which reduces the sliding resistanceof the slope. Second, the rapid water drawdown creates anunloading effect in the slope and water hammer effect in thecracks as well as increases the inertial force of the surfaceslope, which further promotes the slope deformation. Third,the rapid water drawdown also increases the sliding force ofthe surface slope by reducing its sliding resistance, particu-larly between the high and low water levels. Given the effectof the reservoir water, the infiltration and rapid drawdownpromote crack propagation both laterally and vertically,which further weakens the slope and facil i tates its
0.1
0.3
0.5
0.7
0.05 0.15 0.25 0.35 0.45 0.55
ΔMP
GA
Earthquake intensity/g
A10
A11
A16
A10
A11
A16
1
3
5
7
ΔPG
D/m
m
ΔMPGA ΔPGD
0.2
0.34
0.48
0.62
0.76
0.9
0.05 0.15 0.25 0.35 0.45 0.55
ΔMP
GA
Earthquake intensity/g
A10
A11
A16
A10
A11
A16
3
5
7
9
ΔPG
D/m
m
ΔMPGA ΔPGD
(a) Input in z-direction
(b) Input in x-direction
Fig. 16 Relationship between ΔMPGA and ΔPGD after rapid drawdown for a in zdirection and b in x direction
Original Paper
Landslides
Fig. 17 Failure process of slope model after rapid water drawdown. a 0.168 g. b 0.336 g. c 0.504 g. d The final damage phenomenon
Fig. 18 Deformation characteristics of the slope affected by reservoir water (unit: mm)
Landslides
deformation. Therefore, under the combined action of earth-quakes and reservoir rapid drawdown, the surface slope willundergo block sliding along the first structured plane.
In conclusion, according to the analysis of the dynamic re-sponse characteristics of the slope, some problems require moreattention during the construction process of the Jinsha Riverbridge. In terms of the actual engineering design, the anchor andbridge pier positions in the Lijiang bank slope are critical, andtheir stability should monitored. The bridge pier is in the platform,as shown in Fig. 2b, and its dynamic stability has been affected to alarge degree by the earthquakes and rapid drawdown, since theMPGA and PGD of the platform are much larger than the surround-ing areas. After the completion of the proposed reservoir, the testresults suggest that the reservoir water drawdown speed should becontrolled. Moreover, the damage phenomenon of the model slopeshows that the platform was damaged seriously when the seismicintensity was > 0.336 g; therefore, the bridge pier should be rein-forced to avoid future damage during a large earthquake. Inaddition, the test results show that the MPGA and PGD near theanchorage are small, indicating that the anchorage is stable duringearthquakes, and the current anchorage position is reasonable.
ConclusionsA series of shaking table tests were performed to study the dy-namic response characteristics of a rock slope with discontinuousjoints under rapid water drawdown. In addition, the XTDIC mea-surement system was used to analyze the slope surface displace-ment. The conclusions are as follows:
1. The wave propagation direction greatly impacts the slopedeformation. The main deformation style of the slope issettlement and horizontal movement when the seismicwave input is in the z and x directions, respectively. Thedeformation of the surface slope is larger when the seismicinput is in the x direction than the z direction. The PGDunder horizontal earthquake loading is approximately 1.3–1.5 times greater than the PGD under vertical earthquakeloading, while the MPGAx is approximately 1.2–1.3 timesgreater than the MPGAz, overall.
2. From the analysis of the ΔPGD and ΔMPGA, the rapid waterdrawdown has a greater impact on the deformation of theslope surface, particularly between high and low water levels,and the amplification effect is more clearly affected by the Swave. The water infiltration through the cracks softened thematerial of the surface slope, and the rapid drawdown alsoenhanced the slope deformation. The deformation process ofthe slope can be divided into three stages based on the ob-served test phenomenon: a stage with no obvious deformation(< 0.168 g), a stage in which large deformation occurs (0.168–0.336 g), and a stage in which damage occurs (> 0.336 g). Thedeformation process of the slope can also be divided into threestages according to the analysis of the PGD and MPGA: anelastic stage (< 0.168 g), a plastic stage (0.168–0.336 g), and afailure stage (> 0.336 g). Additionally, the deformation processof the slope during the earthquake can be identified accordingto either theMPGA or PGD, but it can be explained more clearlyby using the PGD, particularly when the large deformation ofthe slope first occurs; in this case, the rapid increase in thePGD can reflect the deformation more clearly than the MPGA.
The influence of the rapid drawdown on the slope deformationunder earthquake excitation is most clearly observed by ana-lyzing the ΔPGD.
3. The settlement deformation and sliding deformation inducedby the P waves and S waves, respectively, were the maindeformation styles observed in the surface slope. The effectsof the wave propagation in the slope under rapid drawdownare as follows. First, the rock mass on the slope shakes verti-cally due to the P waves, and lateral cracks form on the slopesurface, and settlement deformation occurs. Second, a largerhorizontal shear deformation of the rock slope is induced bythe strong horizontal shaking from the S waves. The differen-tial settlement and horizontal movement of the blocks in thesurface slope lead to the formation of many cracks during theearthquake. Third, the water infiltration softens the joints andstructural surface, and the rapid water drawdown promotesthe slope deformation. Finally, under the combined action ofearthquakes and rapid drawdown, the surface slope undergoesblock sliding along the slip surface.
AcknowledgmentsThis work is supported by the National Natural Science Founda-tion of China (No. 11372180). The authors would like to expresstheir gratitude to Zhijian Wu of Key Laboratory of Loess Earth-quake Engineering, CEA, Gansu Province, for their helpful advice.
References
Berilgen MM (2007) Investigation of stability of slopes under water drawdown condi-tions. Comput Geotech 34(2):81–91. https://doi.org/10.1016/j.compgeo.2006.10.004
Che A, Yang H, Wang B, Ge X (2016) Wave propagations through jointed rock massesand their effects on the stability of slopes. Eng Geol 201:45–56. https://doi.org/10.1016/j.enggeo.2015.12.018
Chen Z, Hu X, Xu Q (2016) Experimental study of motion characteristics of rock slopeswith weak intercalation under seismic excitation. J Mt Sci 13(3):546–556. https://doi.org/10.1007/s11629-014-3212-0
Dai F, Xu C, Yao X, Xu L, Tu X, Gong Q (2011) Spatial distribution of landslides triggeredby the 2008 Ms 8.0 Wenchuan earthquake, China. J Asian Earth Sci 40(4):883–895.https://doi.org/10.1016/j.jseaes.2010.04.010
Dong H, Gratchev I, Balasubramaniam A (2015) Back analysis of a natural jointed rockslope based on the photogrammetry method. Landslides 12(1):147–154
Fan G, Zhang J, Wu J et al (2016) Dynamic response and dynamic failure mode of a weakintercalated rock slope using a shaking table. Rock Mech Rock Eng 49(8):1–14
Fu X, Sheng Q, Zhang Y, Chen J, Leng X (2016) Extension of the discontinuousdeformation analysis method to simulate seismic response of a large rock caverncomplex. Int J Geomech 17(5):E4016008
Gao Y, Zhu D, Lei G et al (2014) Stability analysis of three-dimensional slopes underwater drawdown conditions. Can Geotech J 51(6):1355–1364. https://doi.org/10.1139/cgj-2013-0448
Gao Y, Yin Y, Li B et al (2017) Characteristics and numerical runout modeling of theheavy rainfall-induced catastrophic landslide–debris flow at Sanxicun, Dujiangyan,China, following the Wenchuan Ms 8.0 earthquake. Landslides 14(4):1–14
Garevski M, Zugic Z, Sesov V (2013) Advanced seismic slope stability analysis. Landslides10(6):729–736. https://doi.org/10.1007/s10346-012-0360-6
Hong Y, Chen R, Wu C et al 2005. Shaking table tests and stability analysis of steepnailed slopes. Canadian Geotechnical Journal 42(5):1264–1279
Huang R, Li W (2009) Analysis of the geo-hazards triggered by the 12 May 2008Wenchuan earthquake, China. Bull Eng Geol Environ 68(3):363–371. https://doi.org/10.1007/s10064-009-0207-0
Huang R, Zhao J, Ju N, Li G, Lee ML, Li Y (2013) Analysis of an anti-dip landslidetriggered by the 2008 Wenchuan earthquake in China. Nat Hazards 68(2):1021–1039.https://doi.org/10.1007/s11069-013-0671-5
Huang Z, Jiang Z, Zhu S, Wu X, Yang L, Guan Y (2016) Influence of structure and waterpressure on the hydraulic conductivity of the rock mass around undergroundexcavations. Eng Geol 202:74–84. https://doi.org/10.1016/j.enggeo.2016.01.003
Jiang T, Liu Y, Ma J (2013) Time history response analysis of jointed rock slope underseismic loads. Chin J Rock Mech Eng 32:3938–3944
Jiang M, Jiang T, Crosta GB, Shi Z, Chen H, Zhang N (2015) Modeling failure of jointedrock slope with two main joint sets using a novel DEM bond contact model. Eng Geol193:79–96. https://doi.org/10.1016/j.enggeo.2015.04.013
Lin ML, Wang KL (2006) Seismic slope behavior in a large-scale shaking table model test.Eng Geol 86(2):118–133. https://doi.org/10.1016/j.enggeo.2006.02.011
Lin Y, Leng W, Yang G et al (2015) Seismic response of embankment slopes withdifferent reinforcing measures in shaking table tests. Nat Hazards 76(2):791–810.https://doi.org/10.1007/s11069-014-1517-5
Liu H, Xu Q, Li Y (2014a) Effect of lithology and structure on seismic response of steepslope in a shaking table test. J Mt Sci 11(2):371–383. https://doi.org/10.1007/s11629-013-2790-6
Liu Y, Li H, Xiao K, Li J, Xia X, Liu B (2014b) Seismic stability analysis of a layered rocks l ope . Comput Geo te ch 55 (1 ) : 474–481 . h t tp s : / / do i . o rg /10 .1016 /j.compgeo.2013.10.002
Lu L, Wang ZJ, Song ML, Arai K (2015) Stability analysis of slopes with ground waterduring earthquakes. Eng Geol 193:288–296. https://doi.org/10.1016/j.enggeo.2015.05.001
Maihemuti B, Wang E, Hudan T et al (2016) Numerical simulation analysis of reservoirbank fractured rock-slope deformation and failure processes. Int J Geomech16(2):04015053
Massey C, Pasqua FD, Holden C et al (2017) Rock slope response to strong earthquakeshaking. Landslides 14(1):249–268. https://doi.org/10.1007/s10346-016-0684-8
Moregenstern N (2015) Stability charts for earth slopes during rapid drawdown.Géotechnique 13(2):121–131
Shinoda M (2015) Seismic stability and displacement analyses of earth slopes using non-circular slip surface. Soils Found 55(2):227–241. https://doi.org/10.1016/j.sandf.2015.02.001
Song Y, Huang D, Cen D (2016) Numerical modeling of the 2008 Wenchuan earthquake-triggered Daguangbao landslide using a velocity and displacement dependent frictionlaw. Eng Geol 215:50–68. https://doi.org/10.1016/j.enggeo.2016.11.003
Toki K, Miura F, Oguni Y (2010) Dynamic slope stability analyses with a non-linear finiteelement method. Earthq Eng Struct Dyn 13(2):151–171
Wang F, Cheng Q, Highland L, Miyajima M, Wang H, Yan C (2009) Preliminaryinvestigation of some large landslides triggered by the 2008 Wenchuan earthquake,Sichuan Province, China. Landslides 6(1):47–54. https://doi.org/10.1007/s10346-009-0141-z
Wang F, Wang Y, Sun G et al (2011) Study on slope response under seismic loading:taking the Dongshanshiziliang profile in Qingchuan, Sichuan as an example. Geosci-ence 25(1):142–150
Xia M, Ren G, Ma X (2013) Deformation and mechanism of landslide influenced by theeffects of reservoir water and rainfall, Three Gorges, China. Nat Hazards 68(2):467–482. https://doi.org/10.1007/s11069-013-0634-x
Xu B, Yan C (2014) An experimental study of the mechanical behavior of a weakintercalated layer. Rock Mech Rock Eng 47(2):791–798. https://doi.org/10.1007/s00603-013-0420-9
Yang G, Wu F, Dong J et al (2012) Study of dynamic response characters and failuremechanism of rock slope under earthquake. Chin J Rock Mech Eng 31(4):696–702
Zhang S, Zhang L, Glade T (2014) Characteristics of earthquake- and rain-inducedlandslides near the epicenter of Wenchuan earthquake. Eng Geol 175(11):58–73.https://doi.org/10.1016/j.enggeo.2014.03.012
D. Song : A. Che : R. Zhu : X. GeSchool of Naval Architecture, Ocean and Civil Engineering,Shanghai Jiao Tong University,800 Dongchuan-Road, Shanghai, 200040, China