Page 1
Dynamic Response of Battery Tabs
under Ultrasonic Welding
Bongsu Kang
Mechanical Engineering Department
Indiana University - Purdue University Fort Wayne
Fort Wayne, Indiana 46805-1499, USA
Wayne Cai
Advanced Propulsion Manufacturing Research Group
Manufacturing Systems Research Lab
General Motors Global R&D Center
Warren, Michigan 48090-9055, USA
Chin-An Tan
Mechanical Engineering Department
Wayne State University
Detroit, Michigan 48202, USA
Submitted to:
ASME Journal of Manufacturing Science and Engineering
August 2012
Authors and Manuscript Information
Bongsu Kang (Corresponding Author) Wayne Cai Chin-An Tan
Phone: (260) 481-5712 (248) 204-2570 (313) 577-3888
e-mail: [email protected] [email protected] [email protected]
Number of pages submitted = 41 (including cover page)
Number of Tables = 3
Number of Figures = 13
Running head = Battery Tab Dynamics
Page 2
Battery Tab Dynamics Kang et al.
2
ABSTRACT
Ultrasonic metal welding for battery tabs must be performed with 100% reliability in battery
pack manufacturing as the failure of a single weld essentially results in a battery that is
inoperative or cannot deliver the required power due to the electrical short caused by the failed
weld. In ultrasonic metal welding processes, high-frequency ultrasonic energy is used to
generate an oscillating shear force (sonotrode force) at the interface between a sonotrode and
few metal sheets to produce solid-state bonds between the sheets clamped under a normal force.
These forces, which influence the power needed to produce the weld and the weld quality,
strongly depend on the mechanical and structural properties of the weld parts and fixtures in
addition to various welding process parameters such as weld frequencies and amplitudes. In
this work, the effect of structural vibration of the battery tab on the required sonotrode force
during ultrasonic welding is studied by applying a longitudinal vibration model for the battery
tab. It is found that the sonotrode force is greatly influenced by the kinetic properties, quantified
by the equivalent mass and equivalent stiffness, of the battery tab and cell pouch interface. This
study provides a fundamental understanding of battery tab dynamics during ultrasonic welding
and its effect on weld quality, and thus provides a guideline for design and welding of battery
tabs from tab dynamics point of view.
Page 3
Battery Tab Dynamics Kang et al.
3
NOMENCLATURE
A Cross-sectional area of battery tab (41mm0.2mm)
a Sonotrode amplitude (20 m peak-to-peak)
Ap Weld area ( = sonotrode tip areas, 3(3 mm5 mm) = 45 mm2)
b Longitudinal dimension of weld spot (3 mm is used for numerical examples)
c0 Phase velocity ( E )
E Young’s modulus (70 Gpa for aluminum and 110 Gpa for copper)
Fs Sonotrode force [N]
Fe Tab-end force [N] ( 1 2e e eF F F , see Figure 4)
Fi Interface force at weld spot [N]
keq Equivalent stiffness of the tab-end (see Figure 4)
L Tab length (see Figure 4)
Distance between the top of dummy mass and the bottom of sonotrode tip (see Figure 9)
L1 Length of the tab between the weld spot and tab-end (see Figure 4)
L2 Length of the tab between the weld spot and free end (see Figure 4)
m Mass of the weld spot element [kg]
meq Equivalent mass of the tab-end (see Figure 4)
u Longitudinal displacement of the tab [mm]
Un Normal mode function
x Longitudinal coordinate
See Eq. (28)
n Longitudinal wavenumber of the battery tab. See Eq. (24).
Wavenumber of a thin bar under longitudinal vibration
Wavelength ( 2 )
Mass density (2700 kg/m3 for aluminum and 8940 kg/m
3 for copper)
x Axial stress
Y Yield strength ( 55Y Mpa for aluminum and 172Y Mpa for copper at 25C)
Sonotrode frequency [rad/s] ( 2 f , f = sonotrode frequency [Hz])
n Natural frequency [rad/s]
Page 4
Battery Tab Dynamics Kang et al.
4
1. INTRODUCTION
Automotive battery packs for electric vehicles typically consist of hundreds of battery cells
in order to meet the desired power and capacity requirements. These cells must be connected
together with robust mechanical joints before being assembled into a battery pack. Joining of
battery cells and battery tabs presents challenges due to the need to weld multiple, highly
conductive, and dissimilar materials, with varying thickness combinations. Characteristics of
various joining technologies used on the battery pack industry, such as resistance welding, laser
welding, ultrasonic welding, and mechanical joining, are well summarized by Lee et al. (2010).
Considering key factors such as process reliability, ease-of-use, and cost, ultrasonic metal
welding (USMW) is currently the most widely used joining technique for battery pack assembly
due to its ability to join dissimilar metals, such as aluminum to copper, in an automated process
at relatively low cost. Moreover, in contrast to traditional fusion welding processes, USMW is a
solid-state joining process (Doumanidis and Gao, 2004), providing a low-resistance, current-
carrying capability as well as required strength, without using any filler material or gas, heat, or
current, thus eliminating consumable materials costs and wastes and post-assembly cleaning.
In ultrasonic metal welding processes, high-frequency ( 20 kHz) ultrasonic energy is used
to generate oscillating shears at the interface between a sonotrode (horn) and metal sheets to
produce solid-state bonds between the sheets clamped under pressure in a short period of time
(less than a second). The amplitude of the oscillation is normally in the range of 5 to 30 microns
(m). Physical principles of USMW are discussed by Rozenberg and Mitkevitch (1973).
Experimental studies of the USMW mechanisms and the resulting material microstructures can
be found in the works of Devine (1984), Flood (1997), Hetrick et al. (2009), and Lee et al.
(2011), and numerical studies of the USMW process using FEA models are presented by, for
Page 5
Battery Tab Dynamics Kang et al.
5
example, Viswanath et al. (2007), Siddiq and Ghassemieh (2009), Elangovan et al. (2009), and
Lee et al. (2011).
Shown in Figure 1 is the schematic of a typical weld unit of a battery pack used in an
electric vehicle and a tooling setup for ultrasonic welding. Hundreds of weld units are connected
through an interconnect board (ICB) conducting electricity in the battery pack. The weld unit
consists of multiple lithium-ion battery cell pouches, each has two electrode extensions (battery
tabs) sealed in the upper part of the pouch, and a bus-bar pre-mounted on the ICB. Thin copper
or aluminum sheets are used for those battery tabs. The bus-bar is made of a copper plate which
is several times thicker than the battery tab. Notice that the battery tabs are bent as shown in the
schematic in order to connect multiple pouches to the bus-bar. Once the battery tabs and bus-bar
are aligned and sandwiched under a clamping force between the sonotrode and anvil, electrical
currents passing through the piezo-stacks cause the stacks to expand and contract (oscillate) at
ultrasonic frequency. This oscillation is amplified through a booster to excite the sonotrode at a
desired frequency. The amplitude of the sonotrode oscillation is generally controlled such that it
maintains a constant amplitude during welding. Basic principles of power ultrasonics can be
found in reference (Graff, 1974).
Ultrasonic metal welding for battery tabs must be performed with 100% reliability in
battery pack manufacturing as the failure of one weld essentially results in a battery that is
inoperative or cannot deliver the required power due to the electrical short caused by the failed
weld. Moreover, this stringent weld quality control is of great concern for battery pack
manufacturers as automotive batteries are exposed to harsh driving environment such as
vibration, severe temperature, and possibly crash, all of which can affect battery performance
and safety. Therefore, one of the main issues arising in ultrasonic welding of battery tabs is to
Page 6
Battery Tab Dynamics Kang et al.
6
ensure consistent weld quality that meets design specifications such as electrical conductivity
and shear strength of the weld. The quality of ultrasonic metal welds depend on a number of
factors such as weld configuration, mechanical and metallurgical properties of weld parts, and
weld process parameters – weld power, time, frequency, amplitude, clamping pressure, etc.
Combinations of these factors determine the sonotrode force which is required to cause the
shearing motion at the weld interface for solid-state bonding. It should be noted that if the
required sonotrode force for welding is larger than the gripping force of the sonotrode tip
(welding tip), the sonotrode tip will slide against the weld part, resulting in extrusion or even no
welding. Note that the gripping force of the sonotrode tip is traction at the interface between the
sonotrode tip and weld part which solely depends on the size and knurl pattern of the sonotrode
tip and the clamping pressure. Therefore it is a prerequisite for USMW that the required
sonotrode force for welding should be as small as possible and must not exceed the gripping
force of the sonotrode tip during the weld cycle (De Vries, 2004).
The sonotrode force required for welding is a resultant force of the inertia force of the weld
spot element (weld part pressed by the sonotrode tip) and the elastic/plastic friction force at the
weld interface. The sonotrode force must be larger than this resultant force to induce a shearing
motion at the weld interface for welding. For a weld part whose size is not significantly larger
than the size of weld area, e.g., electrical contact pads or thin wires, the weld part may be
considered as a rigid body since the entire weld part oscillates in phase with the sonotrode tip.
However, when the dimensions of weld part is significantly larger than those of the weld area,
e.g., spot welding of thin wall sections, the elastic vibrations of the weld part during welding
should be taken into account for the determination of the upper limit of required sonotrode force.
When the wavelength of ultrasonic excitation is comparable to the vibrational wavelengths of the
Page 7
Battery Tab Dynamics Kang et al.
7
weld part itself, the elastic vibrations of the weld part during welding may interact with the weld
spot element causing the required sonotrode force to fluctuate beyond the maximum gripping
force of the sonotrode tip. For the present ultrasonic welding of battery tabs, since the
dimensions of the battery tab are much larger than the dimensions of the weld area, the structural
vibrations of battery tabs are expected to play an important role in determining the weld quality
by constantly changing the required sonotrode force during welding.
While a significant amount of research work on USMW and its applications has been made,
most efforts have been focused on the aspects of weld metallurgy and weldability of different
materials, however, there is only a limited amount of work to understand the overall dynamics of
the ultrasonic welding system, particularly including the structural vibrations of weld parts and
supporting structures (tools and fixtures). Jagota and Dawson (1987) presented experimental and
finite element analyses showing that the bonding strength of thin-walled thermoplastic parts by
ultrasonic welding is strongly influenced by the lateral vibration of the weld parts. The impact of
waveform designs, by controlling the wavelength of the ultrasonic input, on vibration response
reduction of weld parts for the battery welding system is studied by Lee at al. (2011).
The main objective of the present study is to examine the longitudinal dynamic response of
the battery tab during ultrasonic welding and assess its effect on the sonotrode force required for
welding. This study is motivated by preliminary laboratory tests which show a significant
variation in weld strength of battery tabs resulted from a slight alteration in structural properties
of the weld part such as boundary conditions of the battery tab or anvil rigidity. A brief
discussion on the free and forced longitudinal vibration of a thin bar is presented in Section 2 as
the battery tab is modeled as a thin bar extended in the direction parallel to the excitation
direction of the sonotrode. In Section 3, the tab-end force which is part of the required sonotrode
Page 8
Battery Tab Dynamics Kang et al.
8
force due to the elastic vibration of the battery tab is calculated for different end conditions of the
battery tab. Experimental results on the kinetic properties of the tab-end are presented in Section
4. Summary and conclusions are presented in Section 5.
2. THEORY AND MODELING
In the present study, the battery tab is modeled as a thin bar extended parallel to the
direction of ultrasonic excitation of the sonotrode, based on the fact that thickness of the battery
tab is much smaller than other dimensions, particularly the longitudinal dimensions and on the
assumption that the shear stresses developed in the weld spot element during welding result in a
body force distributed over the weld spot. A brief introduction to the underlying theory applied
to the longitudinal vibration analysis of the battery tab is presented in this section.
2.1. Longitudinal Vibration of a Thin Bar
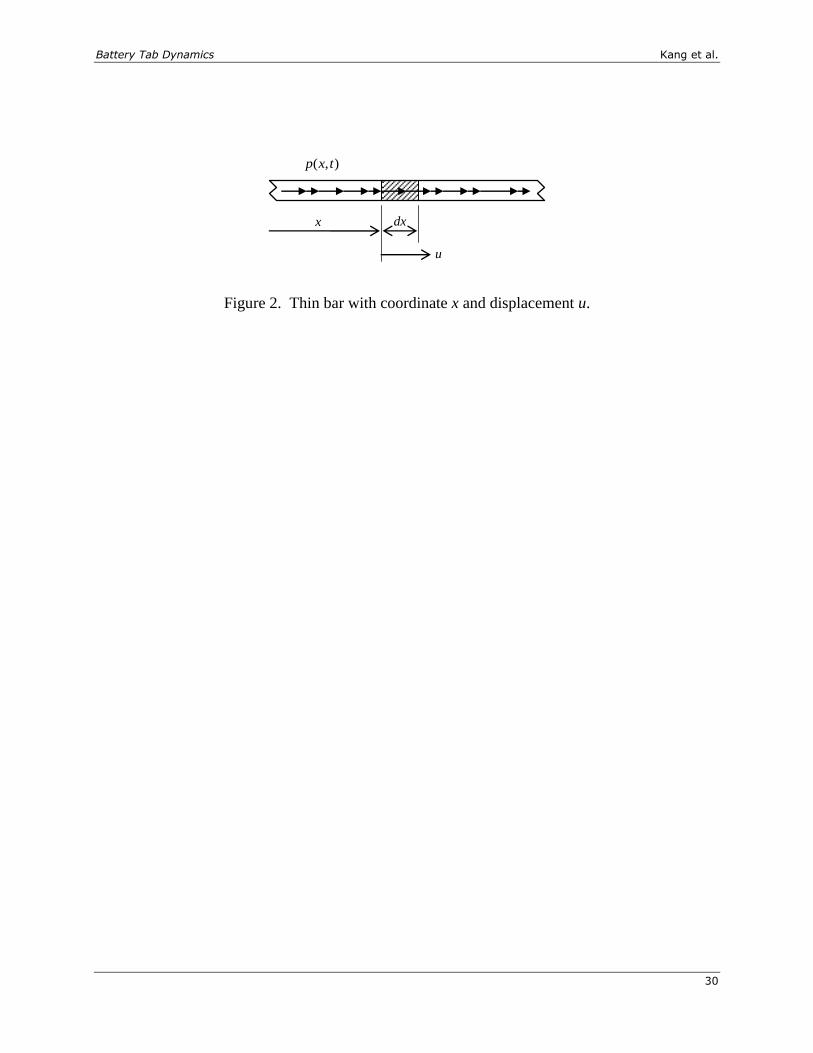
Consider a thin, infinitely long, straight bar with a uniform cross-section subjected to an
arbitrarily distributed axial body force ( , )p x t (measured as a force per unit length) as shown in
Figure 2. The equation governing the longitudinal vibration of the bar can be found as (Graff,
1975).
2 2
2 2
u uEA p A
x t
(1)
where ( , )u u x t denotes the axial displacement of a cross-section, x the spatial coordinate, t the
time, E the Young’s modulus, A the cross-sectional area, and the mass density of the bar. In
the absence of the body force, Eq. (1) reduces to the classical wave equation:
2 2
2 2 2
0
1u u
x c t
0
Ec
(2)
Page 9
Battery Tab Dynamics Kang et al.
9
where c0 is the phase velocity (or bar velocity) at which longitudinal waves propagate. Typical
phase velocities in most metals are quite high compared to the velocity of sound in air of 340 m/s.
Table 1 shows the phase velocities for the battery tab materials.
2.2. Longitudinal Vibration of a Thin Bar with a Finite Length
The solution of Eq. (1) can be found by assuming that
( , ) ( ) ( )u x t U x G t (3)
which leads to
1 2( ) cos sinU x C x C x (4)
1 2( ) cos sinG t D t D t (5)
where the radial frequency , wavenumber , and wavelength (the distance between two
successive points of constant phase) are related by
00 2
cc
(6)
The arbitrary constants in Eqs. (4) and (5) depend on the boundary conditions and initial
conditions. For example consider a bar free at one end ( 0x ) and fixed at the other end ( x L ).
The free boundary condition at 0x implies that the stress at the bar end must be zero, therefore
2
(0, ) (0)( ) ( ) 0
u t dUEA EA G t EA C G t
x dx
(7)
Since ( ) 0G t and 0 , Eq. (7) dictates 2 0C . The fixed boundary condition at x L
requires that
1( , ) ( ) ( ) cos ( ) 0u L t U L G t C LG t (8)
Since 1 0C ,
cos 0L (9)
Page 10
Battery Tab Dynamics Kang et al.
10
which is the frequency equation for the free-fixed bar. Eq. (9) is satisfied only when
(2 1)
2n
n
L
1,2,3,n (10)
Thus, the natural frequencies of the system can be found from
0
(2 1)
2n
nc
L
1,2,3,n (11)
These represent the discrete frequencies at which the system is capable of undergoing harmonic
motion. For a given value of n, the vibrational pattern (called the nth
normal mode or modeshape)
of the bar is described by
( ) cosn nU x x 1,2,3,n (12)
Combining the time and spatial dependence for a given n, the assumed solution in Eq. (3)
becomes
1 2( , ) ( cos sin )sinn n n n n nu x t D t D t x (13)
The general solution is then obtained by superposing all particular solutions as
1 2
1 1
( , ) ( , ) ( cos sin )sinn n n n n n
n n
u x t u x t D t D t x
(14)
where the coefficients Dn1 and Dn2 are to be determined by applying the initial conditions of the
bar.
2.3. Steady State Response Analysis
As a simple example, consider the case of a bar, free at 0x and fixed at x L , subjected
to a harmonic end force 0 sinp t at 0x . Assuming the bar is initially at rest, the steady state
response of the bar can be obtained by assuming a solution of the form
( , ) ( )sinu x t U x t (15)
where ( )U x is given in Eq. (4). Applying the boundary conditions, i.e.,
Page 11
Battery Tab Dynamics Kang et al.
11
0
(0)dUEA p
dx ( ) 0U L (16)
the coefficient C1 and C2 can be found as
01 tan
pC L
EA
0
2
pC
EA (17)
The resulting forced motion of the bar is
0( , ) (tan cos sin )sinp
u x t L x x tEA
(18)
It can be seen that the response becomes unbounded at the frequencies corresponding to
cos 0L , or
0
(2 1)
2
nc
L
1,2,3,n (19)
3. DYNAMICS OF THE BATTERY TABS
Shown in Figure 3 is the cross-sectional view of a single battery cell assembly, where the
battery tab (tab hereafter) and other weld parts are clamped between the sonotrode tip and anvil.
For the present report, the tab is modeled as a thin bar under longitudinal (x-direction) vibration
subjected to boundary excitation due to the oscillatory motion of the weld spot element, based on
the following observations and assumptions:
i. Only one tab is considered in the model; other tabs (if any) and the bus-bar (collectively
called “other weld parts” in Figure 3), along with the anvil, are modeled as stationary,
rigid bodies.
ii. The thickness of the tab is much smaller than the other dimensions of the tab, especially
tab length in the x-direction.
iii. The sonotrode oscillates in the x-direction only, and its amplitude remains constant
Page 12
Battery Tab Dynamics Kang et al.
12
during welding; transverse (z-direction) vibration does not exist.
iv. The weld spot element beneath the sonotrode tip is considered as a rigid body and
assumed to oscillate in phase with the sonotrode, which is the source of longitudinal
excitation.
v. For the modeling purpose, a term tab-end is defined. As indicated in Figure 3, the tab-
end includes part of the tab extended from the bend line and some part of the battery cell
pouch that surrounds the inserted tab.
Note that the shearing motion of the weld spot element in the tab during welding depends
on not only the sonotrode force and friction at the weld interface but also the elastic vibration of
the tab. The vibration characteristics of the tab is governed by the boundary conditions of the tab
as discussed in Section 2.2, then it can be seen from Figure 3 that the tab-end constitutes a
natural (kinetic) boundary condition for the tab. During ultrasonic welding, part of the vibration
energy injected by the oscillating sonotrode tip travels along the tab, through the tab-end, and
then eventually dissipates in the battery cell pouch which contains viscoelastic materials. Hence,
the kinetic properties of the tab-end become an important factor determining the longitudinal
vibration characteristics of the tab. The kinetic properties of the tab-end are represented by the
equivalent mass (meq) and equivalent stiffness (keq) as shown in Figure 4. Due to complex
geometry and material properties of the tab-end which consists of both parts of the battery tab
and battery cell pouch, the determination of the equivalent mass and stiffness of the tab-end by
analytical or numerical methods seems limited. An experimental dynamic test to measure the
equivalent mass is outlined in Section 3.1. Note that the equivalent stiffness of the tab-end can
be readily measured through a simple tensile test of the battery tab and cell pouch assembly.
Page 13
Battery Tab Dynamics Kang et al.
13
Shown in Figure 4 is the free body diagram for the weld spot element in a battery cell
sketched in Figure 3, subjected to three forces: sonotrode force Fs, interface force Fi from the
neighboring tab, and tab-end force 1 2e e eF F F which is due to the elastic vibration of the
extended part of the tab during welding. From the free body diagram for the weld spot element
in Figure 4, one can find that the minimum sonotrode force Fs required for welding, i.e.,
s i eF mx F F (20)
The first term on the right side of Eq. (20) is the inertia force of the weld spot element due
to the vibration of the sonotrode. Assuming that the sonotrode maintains its grip against the
weld spot element during welding and that the sonotrode oscillates at the frequency f [Hz] with
the amplitude of a, i.e., sina t , it can be found that
2 sinmx a t 2 f (21)
It is not an easy task to quantify the interface force Fi. This force is expected to be
significantly larger than the other forces in Eq. (20). Note that due to the transitional behavior of
friction migrating from dry to viscous friction as welding progresses, Fi is not constant.
Quantification of Fi is not a trivial task and may require rigorous theoretical, numerical, and
experimental analyses, and thus it is beyond the scope of the present study and left as future
work. However, assuming that the entire weld interface is plastically yielded (i.e., ideal full
metal-to-metal contact), one may theoretically approximate the maximum value of Fi as a force
that shears the weld. By applying the Tresca maximum-shear yield criterion for the two
dimensional stress state (De Vries, 2004) and noting that Y p , the theoretical maximum of
Fi can be found to be
2 2max 0.52
p
i Y Y p
AF p A (22)
Page 14
Battery Tab Dynamics Kang et al.
14
where Ap is the area of plastic deformation zone (weld area) at the weld spot, p the clamping
pressure, and Y the yield strength of the tab material. More comprehensive discussion
regarding the transitional behavior of the friction coefficient in USMW can be found in the study
by Gao and Doumanidis (2002).
The tab-end force Fe acting on the weld spot element during welding can be determined by
the boundary value analysis of the tab under longitudinal vibration. It is shown in the present
study that the tab-end force Fe can be significantly large and very sensitive to the amount of
effective mass meq of the tab-end due to high acceleration (over 16,000G at 20 kHz with
sonotrode amplitude of 10 m) during welding. A detailed analysis of the tab-end force is to
follow.
3.1. Natural Frequency Analysis of the Battery Tab
When the wavelength of ultrasonic excitation is comparable to the vibrational wavelengths
of the weld part itself, the weld part may be induced to vibrate by the ultrasonic welding system,
that is resonance can occur. This resonance could cause inconsistent weld quality or a structural
failure of the weld part. In order to examine possible resonance of the tab during welding, the
natural frequencies of the tab are determined and compared with the ultrasonic welding
frequency. With reference to Figure 4, the boundary conditions for the tab are
(0) 0U
2( )( ) ( )
eq eqm kU L U L
EA
(23)
where L is the tab length, i.e., 1 2L L L b . Applying the above boundary conditions to Eq.
(4), it can be found that the natural frequencies of the tab must satisfy the following frequency
equation
2 ˆˆ tan 0eq n n n eqm k
0
n n
L
c (24)
Page 15
Battery Tab Dynamics Kang et al.
15
where n denotes the wavenumber (number of repeating waves in the span) for the nth
vibration
mode and ˆeqm and ˆ
eqk are the nondimensional equivalent mass and stiffness of the tab-end,
respectively, normalized by
ˆeq
eq
mm
AL ˆ eq
eq
k Lk
EA (25)
The frequency equation in Eq. (24) needs to be solved numerically, hence 150eqk kN/m is
assumed for both aluminum and copper tabs, which gives 3ˆ 5.23 10eqk for the aluminum tab
and 3ˆ 3.33 10eqk for the copper tab. Assuming 20L mm, ˆ0 2eqm is considered for
numerical simulations, which corresponds to 0 0.89eqm gram for the aluminum tab and
0 2.93eqm gram for the copper tab. Shown in Figure 5 are the wavenumber loci as a function
of ˆeqm for the first 6 longitudinal vibration modes of the tab. Notable findings are as follows.
The wavenumber of the fundamental longitudinal vibration mode of the tab is very small.
For example, 1 0.07 for ˆ 0eqm and 1 0.04 for ˆ 2eqm , each corresponding to the
wavelength of 1,795 mm and 3,142 mm. This suggests that the fundamental longitudinal
vibration mode of the tab behaves almost like a rigid body mode.
The effect of increasing ˆeqm on the longitudinal wavenumbers of the tab becomes quickly
saturated for all vibration modes.
Although not presented, under the presence of ˆeqm , ˆ
eqk has an insignificant effect on
altering the wavenumbers of the tab for all vibration modes unless it is very large. Note
that the fundamental wavenumber is 2 when ˆeqk .
Page 16
Battery Tab Dynamics Kang et al.
16
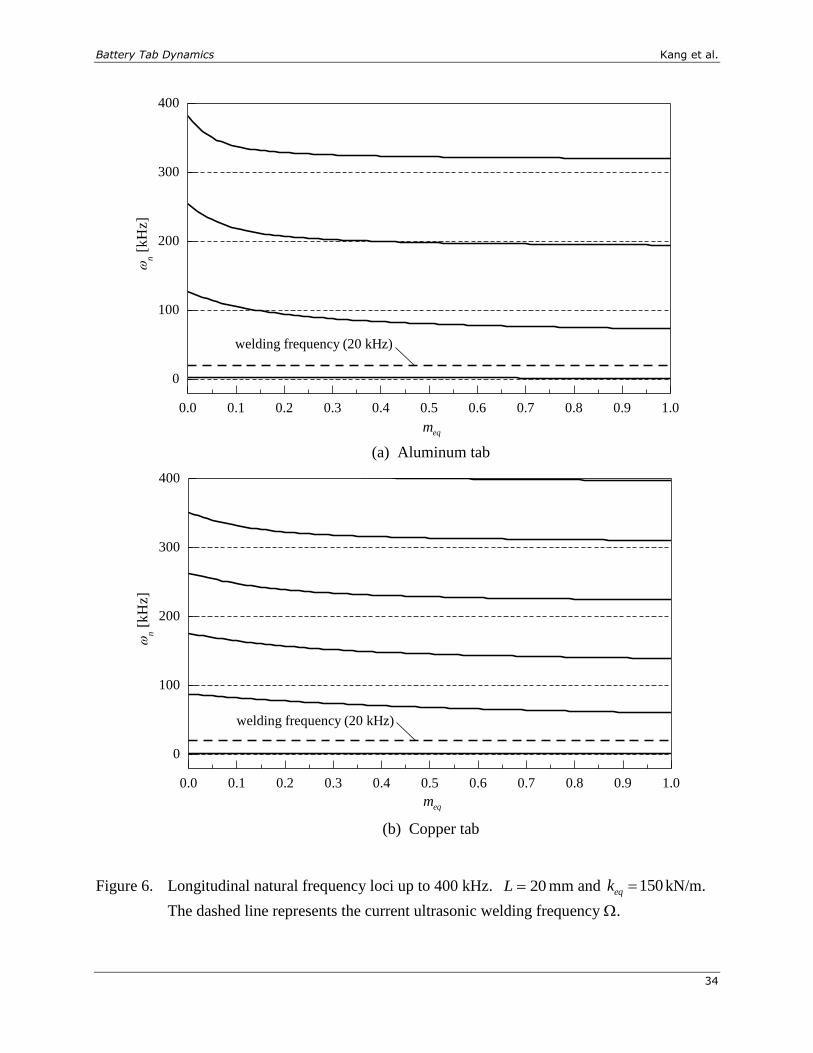
Shown in Figure 6 are the natural frequency loci of the longitudinal vibration for each tab
against the equivalent mass of the tab-end when 150eqk kN/m. It can be noticed that the
current ultrasonic welding frequency (20 kHz) is not close to any of the natural frequencies for
both aluminum and copper tabs, regardless of eqm , indicating little possibility for resonance of
the tab during welding.
3.2. Dynamic Effects of the Tab-End
In order to determine the tab-end forces Fe1 and Fe2 acting on the weld spot element, the tab
is divided into two segments with respect to the weld spot element, i.e., S1 segment ( 1 10 L )
which is on the right side of the weld spot element and S2 segment ( 2 20 L ) on the left side
of the weld spot element as shown in Figure 4.
To determine Fe1, consider S1 segment of the tab. Since the weld spot element is rigid and
oscillates with the sonotrode in the same phase, the velocity at 1 0 of S1 segment must be the
same as the sonotrode tip velocity a . Moreover, at the other end ( 1 1L ), S1 segment
interacts with the tab-end. Therefore, the boundary conditions for S1 segment of the tab are:
(0)U a
2
11
1
( )( )( )
eq eqm kdU LU L
d EA
(26)
Applying the above boundary conditions to Eq. (4), the steady-state longitudinal
displacement of S1 segment of the tab can be found as
1 1 1
0 0
( , ) cos sin sinu t a tc c
1 10 L (27)
where
Page 17
Battery Tab Dynamics Kang et al.
17
2
1 1
0 0 0
2
1 1
0 0 0
( )cos sin
( )cos sin
eq eq
eq eq
m kL L
EA c c c
m kL L
c c EA c
(28)
It can be noticed that 1
0
tan Lc
when either eq eqk m or 0eq eqk m (free
boundary). This implies, when eq eqk m , the dynamic effect of the tab-end is identical to
the one with the free boundary condition.
For S2 segment of the tab, since 0eq eqk m , it can be readily found that
2 2 2 2
0 0 0
( , ) cos tan sin sinu t a L tc c c
2 20 L (29)
Axial Stress Distribution in the Tab
Since x E u x , the axial stress distribution in each segment of the tab can be found
from Eqs. (27) and (29). For S1 segment,
1 1 1
0 0 0
( , ) cos sin sinx t Ea tc c c
1 10 L (30)
and for S2 segment
2 2 2 2
0 0 0 0
( , ) tan cos sin sinx t Ea L tc c c c
2 20 L (31)
Figure 7 shows the axial stress distributions in S1 segment of the tab for different values of meq,
where 1 20L mm and 150eqk kN/m. The cases for free ( 0eq eqk m ) and fixed ( eqk
and 0eqm ) boundary conditions are also shown as the limiting cases. Notable behavior is
summarized as follows:
Stress distributions in the tab are monotonic with a gradual decrease in slopes toward the
Page 18
Battery Tab Dynamics Kang et al.
18
tab-end, indicating that the stress wavelength is much larger than the tab length.
Depending on the equivalent mass of the tab-end, the entire or part of the tab can be
subjected to dynamic stresses exceeding the material’s yield strength ( 55Y Mpa for
aluminum and 172Y for copper at 25C). These high stresses could plasticize the tab
material and make the tab prone to buckling during welding under certain conditions, for
example the transverse vibration of the tab or material irregularity.
Large stresses in the tab during welding may be indicative of the loss of welding energy.
In other words, part of the welding energy gives rise to increase in the overall strain energy
of the tab. It is necessary to employ a design to minimize the equivalent mass (or its effect)
of the tab-end.
As previously mentioned, when eq eqk m the tab-end behaves as if it is free of
constraints. This fact could be utilized for the design of tab-pouch interface to lower the
stresses in the tab during welding.
The effect of the equivalent stiffness of the tab-end is not as drastic as the equivalent mass.
This can be inferred by comparing the stress distribution curves between the two extreme
cases, free and fixed boundary conditions. It can be seen that the difference in stresses is
relatively small, even between these two extreme cases, indicating that the dynamics of the
tab during welding is more affected by the equivalent mass rather than the equivalent
stiffness.
Effect of Weld Spot Location on the Tab-End Force
From Eq. (30), the tab-end force 1 (0, )e xF A t exerting on the weld spot element due to
the elastic vibration of S1 segment of the tab can be found as
Page 19
Battery Tab Dynamics Kang et al.
19
1
0
sineF EAa tc
(32)
In a similar manner, from Eq. (31), the tab-end force exerted by S2 segment of the tab is
2 2
0 0
tan sineF EAa L tc c
(33)
The total amplitude of the tab-end force acting on the weld spot element becomes
1 2 2
0 0
tane e eF F F EAa Lc c
(34)
It can be seen from Eqs. (32) and (33) that the tab-end force acting on the weld spot element
depends on the span length of each segment as well as the equivalent mass and stiffness of the
tab-end. In other words, the location of the weld spot relative to the entire tab length also affects
the sonotrode force required for welding. Figure 8 shows the total tab-end force Fe acting on the
weld spot element for each of the aluminum and copper tabs as a function of the weld spot
location measured from the free end (i.e., 0x in Figure 4) of the tab, for slightly different
values of the equivalent mass of the tab-end, demonstrating the effect of tab-end dynamics.
Some notable behavior is summarized as follows:
The weld spot location plays an important role in determining the tab-end force, and thus
the sonotrode force required for welding. A slight change in the equivalent mass of the tab-
end significantly changes the tab-end force.
For the aluminum tab, the tab-end force is not a simple linear function of the equivalent
mass. For example, when 2 0L , the smallest tab-end force is when 0.5eqm gram. A
similar behavior can be found for the copper tab, however in this case meq for the smallest
tab-end force is much larger than the one for the aluminum tab.
Although not shown in the plots, it is found that the effect of the equivalent stiffness of the
Page 20
Battery Tab Dynamics Kang et al.
20
tab-end on the tab-end force is not as drastic as the equivalent mass.
The relation between the weld spot location and tab-end force can serve as a guideline for
design and welding (such as the Z-height) of the battery tabs. For example, when
0.5eqm gram for the aluminum tab, 2 1.1L mm is the optimal Z-height for the minimum
tab-end force.
Sonotrode force Required for Welding
Recalling Eq. (20), the required sonotrode force Fs for welding is the sum of the three non-
constant forces; inertia force 2ma of the weld spot element, elastic/plastic friction force Fi at
the weld interface, and tab-end force Fe due to the longitudinal vibration of the tab. It has been
suggested by the present analysis that 2
i eF F ma in general. The interface force Fi rapidly
increases as welding progresses to its maximum value, inducing plastic deformation at the weld
interface (Gao and Doumanidis, 2002). While Fi is at its maximum, it is possible that the sum of
the other two forces (2
ema F ) causes the required sonotrode force to exceed its upper limit
which is the gripping force (Fg) at the sonotrode-tab interface. Noted that Fg is a constant force
which depends solely on the clamping pressure and knurl pattern of the sonotrode tip. When
s gF F , the sonotrode tip loses its grip on the tab, which would result in extrusion or
unacceptable welding. For welding to occur, the peak value of the required sonotrode force must
not exceed the gripping force during the weld cycle. As demonstrated in the present analysis
results, the tab-end force is significantly influenced by the longitudinal vibration of the tab itself
which in turn depends on the kinetic properties of the tab-end, i.e., equivalent mass and stiffness.
Therefore a proper design of the battery tab and cell pouch interface can minimize the tab-end
force, thus lowering the required sonotrode force during welding.
Page 21
Battery Tab Dynamics Kang et al.
21
4. EXPERIMENTAL RESULTS AND DISCUSSION
4.1. Experimental Measurement of the Equivalent Mass of Tab-End
The equivalent stiffness of the tab-end can be readily measured through a typical tensile
test. While the battery cell pouch and tab assembly is secured (by using a fixture) in the same
manner as it is constrained in the battery module during welding, the tab is quasi-statically pulled
by a tensile testing machine to generate a force-displacement curve, where note that grip on the
tab must be right above the bend line. The maximum slope of the force-displacement curve is
the measure of the equivalent stiffness of the tab-end.
Figure 9(a) shows schematically the technique to measure the equivalent mass using an
ultrasonic welder, a laser vibrometer with DAQ, and a dummy mass securely affixed to the
battery tab. In addition, a fixture is required to clamp the battery cell pouch in the same manner
as in actual welding. During welding, the dummy mass vibrates in response to the sonotrode
excitation through the longitudinal motion of the tab.
Once the response amplitude of the dummy mass is measured with the laser vibrometer, the
equivalent mass of the tab-end can be calculated from the sinusoidal transfer function of the
equivalent 2-DOF mass-spring system shown in Figure 9(b). The equations of motion of the
equivalent system are
( )eq eqmx k k x ku k y (35)
eq eq eqm y k y k x (36)
where m is the mass of the dummy mass and k is the longitudinal stiffness of the tab between the
weld spot and dummy mass as shown in Figure 9(a). From the above equations, the sinusoidal
transfer function for the dummy mass can be found as
Page 22
Battery Tab Dynamics Kang et al.
22
2
2
2
( )
( )( )
eq
eq
eq eq
kaG i
kk k m
k m
(37)
Hence, the steady-state response amplitude of the dummy mass is
( )ssX aG i (38)
where a is the sonotrode amplitude. Since keq and Xss are known from the measurement, meq can
be found by solving Eq. (38) for meq.
According to the methodologies described above, the equivalent mass (meq) and stiffness
(keq) of the tab-end have been experimentally determined. For the measurement of keq, a single
battery cell-pouch, insulation form, and cooling plates are placed between two nylon frames
clamped by a specially built fixture in order to replicate the same boundary conditions for the
battery cell-pouch as it is secured in the battery module during welding. Instron tensile testing
machine with DAQ is used to obtain the p- curve for each of the C-bend and S-bend tabs, from
which keq of the tab-end is obtained and summarized in Table 2.
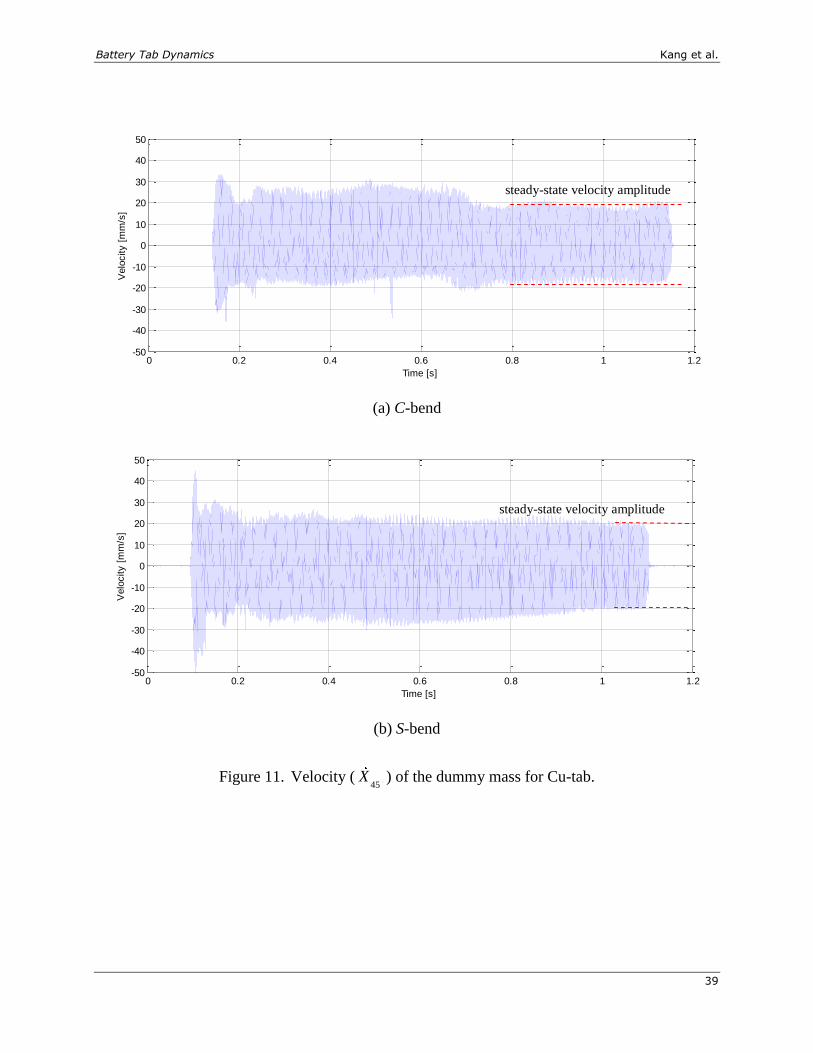
In order to determine meq of the tab-end, the velocity (45
X ) of the dummy mass is
measured at 45 (due to interference with the fixture and welder) by using the Polytec laser
vibrometer, and from which the velocity ( X ) in the weld direction can be found by 45
2X X .
Figure 10 and Figure 11 show the measured velocity (45
X ) of the dummy mass. Applying
4.7m grams, and keq, and the steady-state velocity amplitude for each tab to Eq. (25), meq of
the tab-end is determined as summarized in Table 3. It can be seen that meq of the tab-end is
found to be insignificantly small. It is believed that the tab-bend effectively weakens the
dynamic coupling between the battery tab and cell-pouch.
Page 23
Battery Tab Dynamics Kang et al.
23
4.2. Dynamic Effects of the Tab-End
By applying the measured values of the effective mass and stiffness of the tab-end, the
axial stress distribution in the tab during welding and the resulting tab-end force are computed.
Shown in Figure 12 is the axial stress distribution of the tab (Segment 1). It can be seen that
axial stresses are well below the yield strength (55 Mpa for Al-tab and 172 Mpa for Cu tab at
25C) and very little differences in stresses between C-bend and S-bend. Figure 13 shows the
tab-end force as a function of the weld spot location. It can be seen that 1 mm change in the Z-
height toward the battery cell-pouch lowers the tab-end force by about 1 N for Al-tab and 5 N for
Cu-tab within a practical range of weld spot location. Note that the range of the weld spot
location in the current practice is between 0 and 2 mm.
5. SUMMARY AND CONCLUSIONS
The effect of dynamic response of a single battery tab on the sonotrode force required for
welding is studied by applying a one-dimensional continuous vibration model for the battery tab.
The battery tab is modeled as a thin bar vibrating longitudinally under ultrasonic excitation from
the sonotrode. This study serves as the foundation for a scientific understanding of battery tab
dynamics during ultrasonic welding and its effect on weld quality, and thus provides a guideline
for design and welding of battery tabs. Notable findings are summarized as follows:
1. A slight change in the kinetic properties of the battery tab-end (interface between the tab and
battery cell pouch), being amplified by the longitudinal vibration of the battery tab at high
acceleration during ultrasonic welding, causes a significant change in the sonotrode force
required for welding. Experimental quantification of the kinetic properties of the tab-end in
Page 24
Battery Tab Dynamics Kang et al.
24
terms of the equivalent mass and stiffness as key design parameters is needed for the design
of battery tabs to improve the weld quality.
2. Axial stresses of the battery tab during ultrasonic welding could exceed the material’s yield
strength when the equivalent mass of the tab-end is large, suggesting that the battery tab is
prone to plastic deformation and buckling due to dynamic instability triggered by subtle
transverse motions such as anvil or bus-bar vibrations. Reduction of the equivalent mass of
the battery tab-end can lower the required sonotrode force for welding.
3. The difference in sonotrode forces required for welding between the aluminum and copper
tab is significantly large. That is, the sonotrode force required for welding of the aluminum
tab is significantly lower than welding the copper tab. Studies on the effect of an excessive
sonotrode force on weld quality is warranted.
4. The sonotrode force required for welding is substantially affected by the weld spot location.
The optimal location of weld spot for the minimum sonotrode force also depends on the
equivalent mass and stiffness of the battery tab-end.
Page 25
Battery Tab Dynamics Kang et al.
25
ACKNOWLEDGEMENT
The authors would like to thank Tao Wu for help conduct experiments.
DISCLAIMER
This paper was prepared as an account of work sponsored by an agency of the United
States Government. Neither the United States Government nor any agency thereof, nor any of
their employees, makes any warranty, express or implied, or assumes any legal liability or
responsibility for the accuracy, completeness, or usefulness of any information, apparatus,
product, or process disclosed, or represents that its use would not infringe privately owned rights.
Reference herein to any specific commercial product, process, or service by trade name,
trademark, manufacturer, or otherwise does not necessarily constitute or imply its endorsement,
recommendation, or favoring by the United States Government or any agency thereof. The
views and opinions of authors expressed herein do not necessarily state or reflect those of the
United States Government or any agency thereof.
Page 26
Battery Tab Dynamics Kang et al.
26
REFERENCES
De Vries, E., 2004, “Mechanics and Mechanisms of Ultrasonic Metal Welding,” Ph.D.
Dissertation, The Ohio State University.
Devine, J., 1984, “Joining Metals with Ultrasonic Welding,” Machine Design, 56(21), pp. 91-95.
Doumanidis and Gao, Y., 2004, “Mechanical Modeling of Ultrasonic Welding,” Welding
Journal, 83, pp. 140S-146S.
Elangovan, S., Semeer, S., and Prakasan, K., 2009, “Temperature and Stress Distribution in
Ultrasonic Metal Welding – An FEA-Based Study,” Journal of Material Processing Technology,
209, pp. 1143-1150.
Flood, G., 1997, “Ultrasonic Energy Welds Copper to Aluminum,” Welding Journal, 76(1), pp.
43-45.
Gao, Y. and Doumanidis, C., 2002, “Mechanical Analysis of Ultrasonic Bonding for Rapid
Prototyping,” ASME Journal of Manufacturing Science and Engineering, 124, pp. 426-434.
Graff, K. F., 1974, “Process Applications of Power Ultrasonics - A Review,” Proceedings of
IEEE Ultrasonics Symposium, pp. 628-641.
Graff, K. F., 1975, Wave Motion in Elastic Solids, Dover Publications, Inc., New York.
Hetrick, E. T., Baer, J. R., Zhu, W., Reatherford, L. V., Grima, A. J., Scholl, D. J., Wilkosz, D.
E., Fatima, S., and Ward, S. M., 2009, “Ultrasonic Metal Welding Process Robustness in
Aluminum Automotive Body Construction Applications,” Welding Journal, 88, pp. 149-158.
Jagota, A. and Dawson, P. R., 1987, “The Influence of Lateral Wall Vibrations on the Ultrasonic
Welding of Thin-Walled Parts,” ASME Journal of Engineering for Industry, 109, pp. 140-147.
Lee, D, Kannatey-Asibu, Jr., E., and Cai, W., “Ultrasonic Welding Simulations for Multiple,
Thin and Dissimilar Metals, submitted to ASME International Symposium on Flexible
Automation, St. Louis, June 18-20, 2012.
Lee, S. S., Cai, W., and Abell, J. A., 2011, “Waveform Analysis for Ultrasonic Welding of
Battery Tabs,” submitted to IEEE Transactions on Automation Science and Engineering, Special
Issue on Automation in Green Manufacturing.
Lee, S. S., Kim, T. H., Hu, S. J., Cai, W. W., and Abell, J. A, 2010 “Joining Technologies for
Automotive Lithium-Ion Battery Manufacturing - A Review,” Proceedings of the ASME 2010
International Manufacturing Science and Engineering Conference, Paper No. MSEC2010-34168
(9 pages), October 12-15, 2010, Erie, Pennsylvania.
Page 27
Battery Tab Dynamics Kang et al.
27
Lee, S. S., Kim, T. H., Hu, S. J., Cai, W., Abell, J. A., and Li, J., 2011, “Characterization of
Ultrasonic Metal Weld Quality for Lithium-Ion Battery Tab Joining,” submitted to ASME
Journal of Manufacturing Science & Engineering.
Rozenberg, L., Mitskevich, A., 1973, “Ultrasonic Welding of Metals”, Physical Principles of
Ultrasonic Technology, V.1, Part 2, Acoustic Institute Academy of Sciences of the USSR,
Moscow, USSR, 1970, Plenum Press, New York.
Siddiq, A. and Ghassemieh, E., 2009, “Theoretical and FE Analysis of Ultrasonic Welding of
Aluminum Alloy 3003,” Journal of Manufacturing Science and Engineering, 131(4), pp. 1-11.
Viswanath, A. G. K., Zhang, X., Ganesh, V. P., and Chun, L., 2007, “Numerical Study of Gold
Wire Bonding Process on Cu/Low-K Structures,” IEEE Transactions on Advanced Packaging,
30(3), pp. 448-456.
Zhang, C. and Li, L., 2009, “A Coupled Thermal-Mechanical Analysis of Ultrasonic Bonding
Mechanism,” Metallurgical and Materials Transactions B, 40B, pp. 196-207.
Page 28
Battery Tab Dynamics Kang et al.
28
Table 1. Phase velocity c0.
Mass density [kg/m3] Young’s modulus E [Gpa] Phase velocity c0 [m/s]
Aluminum 2,700 70 5,092
Copper 8,940 110 3,508
Table 2. Equivalent stiffness (keq) of the tab-end.
Bend shape Al-tab [kN/m] Cu-tab [kN/m]
C-bend ( ) 94 115 114 180
S-bend ( ) 21 42 33 53
Table 3. Equivalent mass (meq) of the tab-end.
Bend shape Al-tab [grams] Cu-tab [kN/m]
C-bend ( ) 0.006 0.0066 0.0091 0.0114
S-bend ( ) 0.0013 0.0027 0.0021 0.0034
Page 29
Battery Tab Dynamics Kang et al.
29
Figure 1. Schematic of the weld unit and ultrasonic welding setup.
Transducer assembly
(Piezo-stacks)
Back-plate
Anvil
Bus-bar
Electrode extension
(Battery tab)
Battery cell pouch
weld spot
Tab-end
x
Interconnect board
Sonotrode
Page 30
Battery Tab Dynamics Kang et al.
30
Figure 2. Thin bar with coordinate x and displacement u.
x dx
( , )p x t
u
Page 31
Battery Tab Dynamics Kang et al.
31
Figure 3. Schematic of the battery cell assembly (with the cell pouch partially shown)
Battery cell pouch
Part of battery tab is inserted
and sealed in pouch opening
Seal tape Sonotrode tip
Weld spot
element
Tab-end
sina t
x Anvil
z Bend line
Other
weld parts
tab
Page 32
Battery Tab Dynamics Kang et al.
32
Figure 4. Free body diagram for the weld spot element and coordinate system.
Bend line
Tab-end
keq meq Fi
Fs
Fe1
x
L1
Fe2
L2 b
sina t Sonotrode tip
m
1 2
0x
Segment 1 Segment 2
L
Page 33
Battery Tab Dynamics Kang et al.
33
Figure 5. Wavenumber loci of the first 6 longitudinal vibration modes. 3ˆ 5.23 10eqk .
0.0 0.2 0.4 0.6 0.8 1.0 1.2 1.4 1.6 1.8 2.0
0
2
4
6
8
10
12
14
16
ˆeqm
n
Page 34
Battery Tab Dynamics Kang et al.
34
(a) Aluminum tab
(b) Copper tab
Figure 6. Longitudinal natural frequency loci up to 400 kHz. 20L mm and 150eqk kN/m.
The dashed line represents the current ultrasonic welding frequency .
0.0 0.1 0.2 0.3 0.4 0.5 0.6 0.7 0.8 0.9 1.0
0
100
200
300
400
eqm
n [
kH
z]
welding frequency (20 kHz)
0.0 0.1 0.2 0.3 0.4 0.5 0.6 0.7 0.8 0.9 1.0
0
100
200
300
400
eqm
n [
kH
z]
welding frequency (20 kHz)
Page 35
Battery Tab Dynamics Kang et al.
35
(a) Aluminum tab, 150eqk kN/m
(b) Copper tab, 150eqk kN/m
Figure 7. Axial stress distribution in the tab due to longitudinal vibration of the tab, where
1 20L mm and meq is in grams.
0 2 4 6 8 10 12 14 16 18 20-20
0
20
40
60
80
100
120
Free
Fixed
meq
= 0
meq
= 0.1
meq
= 0.2
meq
= 0.3
meq
= 0.4
meq
= 0.5
Y
x [
Mp
a]
[mm]
0 2 4 6 8 10 12 14 16 18 20-50
0
50
100
150
200
250
Free
Fixed
meq
= 0
meq
= 0.1
meq
= 0.2
meq
= 0.3
meq
= 0.4
meq
= 0.5
Y
x [
Mp
a]
1 [mm]
Page 36
Battery Tab Dynamics Kang et al.
36
(a) Aluminum tab, 150eqk kN/m
(b) Copper tab, 150eqk kN/m
Figure 8. Tab-end force as a function of the weld spot location, where the total length of the tab
is 23L mm. Note that meq is in grams.
0 1 2 3 4 5 6 7 8 9 100
20
40
60
80
100
meq
= 0
meq
= 0.1
meq
= 0.2
meq
= 0.3
meq
= 0.4
meq
= 0.5
meq
= 0.6
meq
= 0.7
meq
= 0.8
meq
= 0.9
meq
= 1.0
F
e [
N]
Weld spot location, L2 [mm]
0 1 2 3 4 5 6 7 8 9 1050
100
150
200
250
300
meq
= 0
meq
= 0.1
meq
= 0.2
meq
= 0.3
meq
= 0.4
meq
= 0.5
meq
= 0.6
meq
= 0.7
meq
= 0.8
meq
= 0.9
meq
= 1.0
Fe [
N]
Weld spot location, L2 [mm]
Page 37
Battery Tab Dynamics Kang et al.
37
(a) Experimental setup (b) Equivalent 2-DOF system
Figure 9. Experimental setup for measurement of the equivalent mass of the tab-end.
( ) sinu t a t
keq
meq
EAk x
y
m
DAQ
Laser vibrometer
to measure the
vertical motion
of the dummy
mass
son
otr
od
e
( ) sinu t a t
Copper coupon plate
anv
il
Dummy mass
Battery cell pouch
Battery tab
x
fixture
Page 38
Battery Tab Dynamics Kang et al.
38
(a) C-bend
(b) S-bend
Figure 10. Velocity (45
X ) of the dummy mass for Al-tab.
0 0.1 0.2 0.3 0.4 0.5 0.6 0.7 0.8 0.9 1-50
-40
-30
-20
-10
0
10
20
30
40
50
Time [s]
Velo
city [
mm
/s]
0 0.1 0.2 0.3 0.4 0.5 0.6 0.7 0.8 0.9 1-50
-40
-30
-20
-10
0
10
20
30
40
50
Time [s]
Velo
city [
mm
/s]
steady-state velocity amplitude
steady-state velocity amplitude
Page 39
Battery Tab Dynamics Kang et al.
39
(a) C-bend
(b) S-bend
Figure 11. Velocity (45
X ) of the dummy mass for Cu-tab.
0 0.2 0.4 0.6 0.8 1 1.2-50
-40
-30
-20
-10
0
10
20
30
40
50
Time [s]
Velo
city [
mm
/s]
0 0.2 0.4 0.6 0.8 1 1.2-50
-40
-30
-20
-10
0
10
20
30
40
50
Time [s]
Velo
city [
mm
/s]
steady-state velocity amplitude
steady-state velocity amplitude
Page 40
Battery Tab Dynamics Kang et al.
40
Figure 12. Axial stress distribution due to longitudinal vibration of the tab, where 1 20L mm.
0 5 10 15-2
0
2
4
6
8
1 [mm]
x [
Mpa]
0 5 10 15-2
0
2
4
6
8
1 [mm]
x [
Mpa]
0 5 10 15-5
0
5
10
15
20
25
1 [mm]
x [
Mpa]
0 5 10 150
5
10
15
20
25
1 [mm]
x [
Mpa]
94kN/m 0.006geq eqk m
115kN/m 0.0066geq eqk m
21kN/m 0.0013geq eqk m
42kN/m 0.0027geq eqk m
(a) Al-tab, C-bend
(b) Al-tab, S-bend
(c) Cu-tab, C-bend
(d) Cu-tab, S-bend
114kN/m 0.0091geq eqk m
180kN/m 0.0144geq eqk m
33kN/m 0.0021geq eqk m
53kN/m 0.0034geq eqk m
Page 41
Battery Tab Dynamics Kang et al.
41
Figure 13. Tab-end force vs. weld spot location, where the total length of the tab is 23L mm.
0 1 2 3 4 5 6 7 8 9 1066
67
68
69
70
Weld spot location, L2 [mm]
Fe [
N]
0 1 2 3 4 5 6 7 8 9 1066
67
68
69
70
Weld spot location, L2 [mm]
Fe [
N]
0 1 2 3 4 5 6 7 8 9 10220
225
230
235
240
245
250
Weld spot location, L2 [mm]
Fe [
N]
0 1 2 3 4 5 6 7 8 9 10220
225
230
235
240
245
250
Weld spot location, L2 [mm]
Fe [
N]
94kN/m 0.006geq eqk m
115kN/m 0.0066geq eqk m
21kN/m 0.0013geq eqk m
42kN/m 0.0027geq eqk m
(a) Al-tab, C-bend
(b) Al-tab, S-bend
(c) Cu-tab, C-bend
(d) Cu-tab, S-bend
114kN/m 0.0091geq eqk m
114kN/m 0.0091geq eqk m
33kN/m 0.0021geq eqk m
53kN/m 0.0034geq eqk m
Current practice
range
Current practice
range
Current practice
range
Current practice
range