Page 1
1
Dynamic Response of Rubberized Concrete Columns with and without FRP 1
Confinement Subjected to Lateral Impact 2
Thong M. Pham1, X. Zhang2, M. Elchalakani3, A. Karrech4, Hong Hao5* and Aarin Ryan63
Abstract 4
This study experimentally investigates the impact response of rubberized concrete columns 5
subjected to lateral impact. A pendulum impact testing apparatus was used to test the concrete 6
columns with varied rubber contents including 0%, 15%, and 30%. Fine and coarse aggregates 7
were replaced by crumb rubber with particle sizes of 2-5 mm and 5-7 mm, respectively. The 8
experimental results have shown that the rubberized concrete columns significantly reduce the 9
peak impact force (27% - 40%) and thus mitigate the risk of injury and even death if rubberized 10
concrete is used in roadside barriers. In addition, the rubberized concrete columns were more 11
flexible than the normal concrete columns. They could deflect twice the reference columns 12
before failure. Rubberized concrete significantly increased the impact energy absorption. The 13
columns with 15% and 30% crumb rubber showed an increase in the impact energy absorption 14
by 58% and 63% as compared to the reference columns. The rubberized concrete column 15
confined with FRP outperformed the reference columns in terms of both the energy absorption 16
1 Research Fellow, Center for Infrastructural Monitoring and Protection, School of Civil and Mechanical Engineering, Curtin University, Kent Street, Bentley, WA 6102, Australia. Email: [email protected] 2 Research Fellow, Center for Infrastructural Monitoring and Protection, School of Civil and Mechanical
Engineering, Curtin University, Kent Street, Bentley, WA 6102, Australia. Email: [email protected] 3Senior Lecturer, School of Civil, Environmental and Mining Engineering, the University of Western Australia,
35 Stirling Highway, WA 6009, Australia. Email: [email protected] 4 Associate Professor, School of Civil, Environmental and Mining Engineering, the University of Western
Australia, 35 Stirling Highway, WA 6009, Australia. Email: [email protected] 5*John Curtin Distinguished Professor, Center for Infrastructural Monitoring and Protection, School of Civil and
Mechanical Engineering, Curtin University, Kent Street, Bentley, WA 6102, Australia, and School of Civil
Engineering, Guangzhou University, Guangzhou 510006, China. Corresponding author’s email:
[email protected] 6Former student, School of Civil, Environmental and Mining Engineering, the University of Western Australia, 35 Stirling Highway, WA 6009, Australia. Email: [email protected]
© 2018. This manuscript version is made available under the CC-BY-NC-ND 4.0 license http://creativecommons.org/licenses/by-nc-nd/4.0/
Page 2
2
and load carrying capacity. Therefore, rubberized concrete is a better alternative and 17
recommended for the use in roadside barriers to achieve better impact energy absorption 18
capacity and reduce the maximum impact force under vehicle collisions. 19
Keywords: Rubberized concrete; Impact loading; Energy absorption; Roadside barriers. 20
© 2018. This manuscript version is made available under the CC-BY-NC-ND 4.0 license http://creativecommons.org/licenses/by-nc-nd/4.0/
Page 3
3
Introduction 21
Used tires are among the largest and most problematic sources of waste in modern societies due 22
to their durability. Millions of used tires are being discarded every year, which contain a number 23
of environmentally damaging constituents, while only a small portion goes through recycling 24
processes [1]. Tires typically require huge dumpsites as more than 75% of a tire volume are 25
void. Furthermore, dumps can be turned into fertile grounds for proliferation of insects and on 26
top of this microorganisms may also take more than 100 years to biodegrade the tires [1]. 27
Therefore, it is necessary to find alternative solutions to recycle used tires and turn them into 28
useful products. 29
Crumb rubber produced from used tires have been successfully utilized to replace aggregates 30
in order to create new concrete, namely rubberized concrete [2-5]. Previous studies have shown 31
that partially using rubber as aggregates in concrete increases its ductility, toughness, energy 32
absorption, and damping ratio [1, 6-8]. However, previous studies also concluded that replacing 33
normal aggregates by rubber reduces the structural strength properties of rubberized concrete 34
[1, 9-11]. The reduction in these properties depends on many factors, such as the replacement 35
of fine and/or coarse aggregates, the percentage of rubber replacement, and the use of any 36
supplementary cementitious material such as silica fume. Elchalakani [1] recommended adding 37
silica fume to the mix to improve the mechanical properties of rubberized concrete including 38
the axial compressive strength, the flexural strength, and the modulus of elasticity. The author 39
suggested that silica fume has enhanced the bonding at the interfacial transition zone so that it 40
is beneficial to rubberized concrete. 41
Previous studies have shown that rubberized concrete can absorb more energy than 42
conventional concrete [6, 7, 12]. The high energy absorption capacity of rubberized concrete 43
can be utilized in structures where the energy absorption capacity is required rather than high 44
© 2018. This manuscript version is made available under the CC-BY-NC-ND 4.0 license http://creativecommons.org/licenses/by-nc-nd/4.0/
Page 4
4
strength, for example, roadside barriers [1, 3, 6] and pedestrian pathways [13]. The impact 45
resistance, defined as the combination of strength and dynamic energy absorption [14], was 46
examined in previous studies on rubberized concrete [3, 8, 11, 15-17]. The impact resistance 47
can be studied by well-established impact tests that are the weighted pendulum, Charpy-type 48
impact, drop-weight, constant strain-rate test, projectile impact, split Hopkinson pressure bar, 49
explosive test, and instrumented pendulum impact [14]. Most of the studies in the open 50
literature examine the impact resistance of rubberized concrete by using simple drop-weight 51
tests according to ACI 544.2R-17 [14]. The simplest and common method of the above impact 52
tests is the repeated drop-weight impact test. The testing apparatus includes a 4.54 kg steel ball 53
dropping from 0.45 m height. The steel ball is dropped multiple times on a specimen until the 54
occurrence of the first crack and the ultimate failure. The energy absorption is measured from 55
this type of impact test but not the strength. However, results of this type of impact tests are 56
very scattered as mentioned by ACI 544.2R-17 [14]. There are studies in the literature 57
investigating the axial impact resistance capacity of rubberized concrete [8, 15-17], however, 58
no studies examined rubberized concrete columns against lateral impact. In addition, as 59
rubberized concrete is utilized in roadside barriers, the lateral impact response of the structures 60
become crucial to understanding the behaviour of roadside barriers under vehicle collisions 61
while the axial impact resistance is relatively less relevant in this circumstance. 62
Beside unconfined rubberized concrete, Youssf et al. [18] investigated the structural behaviour 63
of confined rubberized concrete columns under lateral cyclic loads. The authors concluded that 64
using confined rubberized concrete slightly increased the peak strength and slightly decreased 65
the ultimate drift compared to those of unconfined rubberized concrete. Meanwhile, the rubber 66
particle sizes were found to have an insignificant effect on the energy dissipation and viscous 67
damping of rubberized concrete. Xue and Shinozuka [19] conducted shaking table tests on 68
rubberized concrete columns. The authors found that the damping coefficient of the rubberized 69
© 2018. This manuscript version is made available under the CC-BY-NC-ND 4.0 license http://creativecommons.org/licenses/by-nc-nd/4.0/
Page 5
5
concrete columns increases by 62% as compared to normal concrete. In addition, the seismic 70
response acceleration of rubberized concrete decreases by 27% as compared to normal concrete. 71
Sukontasukkul et al. [20] recommended using rubberized concrete as a cushion layer in 72
bulletproof concrete panels. The authors combined a soft rubberized concrete layer and a hard 73
layer of steel fiber reinforced concrete to resist impact loads. The soft layer of rubberized 74
concrete was designed to absorb energy and then transfer less impact energy to the hard layer. 75
In another application, the impact response of real scale roadside barriers made of rubberized 76
concrete was investigated by Atahan and Sevim [6]. The safety barriers had the height, base 77
width, top width, and length of 1 m, 0.45 m, 0.25 m and 1 m, respectively. The authors used a 78
4-wheel vehicle with the weight of 500 kg for the impact tests and concluded that the energy 79
absorption increased with the rubber content. Besides, rubberized concrete has another 80
advantage of significantly reducing acceleration induced by an impact event thus mitigated 81
injury risk to human occupants. The above studies have made a consensus that rubberized 82
concrete yields higher energy absorption but lower strength than the corresponding 83
conventional concrete. To propose rubberized concrete with higher energy absorption as well 84
as higher strength, FRP confinement can be used since this technique has shown a significant 85
increase in strength and energy absorption of conventional concrete under impact loads [21-86
23]. 87
As far as the authors are aware, no study has been carried out to investigate the impact response 88
of rubberized concrete columns under lateral impact. Since understanding the performances of 89
the column subjected to lateral impact loads is essential for application of the column in 90
roadside barrier constructions, pendulum impact tests were performed to investigate the impact 91
response of rubberized concrete columns in this study. In total, 7 rubberized concrete columns 92
were cast and tested with 800 mm height and 100 mm square section. Two different rubber 93
contents including 15% and 30% were examined. A steel impactor weighing 300 kg was lifted 94
© 2018. This manuscript version is made available under the CC-BY-NC-ND 4.0 license http://creativecommons.org/licenses/by-nc-nd/4.0/
Page 6
6
to certain heights before releasing to generate the impact loading on the mid-height of the 95
columns. The progressive damage, the impact force time histories, the displacement time 96
histories, and energy absorption capacity were examined and discussed. 97
Experimental program 98
In this study, seven reinforced rubberized concrete columns were cast and tested at the concrete 99
laboratory of the University of Western Australia. Six columns were made of unconfined 100
rubberized concrete and one column (15% rubber content) was wrapped with one layer of FRP. 101
Among the six columns associated with unconfined rubberized concrete, there were three pairs 102
including two columns with normal concrete (0% rubber), two columns with 15% rubberized 103
concrete and the other two columns with 30% rubberized concrete. The columns were tested 104
under pendulum impact until failure. 105
Mix design and pre-treatment 106
Three concrete mixes were designed to examine the effects of varying rubber contents on the 107
impact resistance of reinforced concrete columns. The conventional concrete served as a 108
baseline had the compressive strength of 50 MPa. Normal fine and coarse aggregates of the 109
rubberized concrete were replaced by rubber at 15% and 30%, in which conventional aggregates 110
were replaced by two types of rubber aggregates including 2-5 mm diameter crumbed rubber 111
and 5-7 mm diameter crumb rubbers. The crumbed rubber was manufactured and supplied by 112
tyre cycle [24]. The crumb rubber has the specific gravity of 540 kg/m3 [1]. The sieve tests were 113
carried out and the particle size distribution is shown in Fig. 1. All the specimens had the ratios 114
of cement, water and total aggregate remain unchanged. The ratio of water to cement was 0.5 115
for all the mixes. It is noted that the rate at which water was added to the mix had a large impact 116
on the slump and mixing of the concrete. Gradually adding water to the mixer produced the 117
© 2018. This manuscript version is made available under the CC-BY-NC-ND 4.0 license http://creativecommons.org/licenses/by-nc-nd/4.0/
Page 7
7
best result as it reduced clumping of material and ensured a good distribution of water. The 118
water absorbed by rubber through the water soaking process was accounted for when producing 119
rubberized concrete by deducting the overall water required for the mix by the amount of 120
absorbed water. Details of the mixture design of the rubberized concrete are presented in Table 121
1. The compressive strength of rubberized concrete was tested at 28 days according to AS 122
1012.9 [25]. The compressive strengths of 0%, 15%, and 30% rubberized concrete were 50.3 123
MPa, 25.0 MPa, and 14.4 MPa, respectively. The density of the specimens was 2271 kg/m3, 124
2086 kg/m3, and 1943 kg/m3, respectively. 125
126
Fig. 1. Particle size distribution from sieve testing 127
According to a previous study by Mohammadi [26], rubber aggregates for the two mixes were 128
soaked for 24 hours in a 10% sodium hydroxide solution (NaOH). This process allows the 129
aggregates to absorb a certain amount of water, improving the interfacial bonding and reducing 130
the possibility of rubber aggregate floating in the mix. After the treatment, the rubber was 131
drained, then soaked and rinsed three times in clean water to neutralize the pH. As mixing the 132
concrete, the rubber aggregates and the conventional aggregates were mixed for 1 minute with 133
10% of the required water, then cement was added and the substances are mixed for 1 minute. 134
© 2018. This manuscript version is made available under the CC-BY-NC-ND 4.0 license http://creativecommons.org/licenses/by-nc-nd/4.0/
Page 8
8
Next, a half of the remaining water was added and mixed for 1 minute. Lastly, the remaining 135
amount of the water was added and mixed for 1 minute before adding superplasticizer and 136
mixing for 1 minute. Details about the mixing procedure can be found in the previous study by 137
Elchalakani [1]. Slump tests were carried out for each mix and the slump of normal concrete, 138
15% rubberized concrete and 30% rubberized concrete was 150 mm, 180 mm, and 165 mm, 139
respectively. 140
Specimen design 141
Figure 2 shows the schematic view of the specimen and the experimental pendulum impact test 142
setup. The overall dimensions of the testing column were 800 mm in height and 100 mm x 100 143
mm in cross-section area. A footing of 140 mm depth and 400 mm x 400 mm in cross-section 144
area was built to connect the column specimens to the laboratory strong floor. The solid steel 145
impactor weight was 300 kg. The added mass on top of the column specimen was made of 288 146
kg and consisting of 400 mm x 400 mm x 450 mm (L x W x H) concrete block and 5 pieces of 147
23 kg steel plates that were firmly fixed to the top slab. The total weight of added mass is thus 148
403 kg. It should be noted that road side barriers normally do not support vertical load. Adding 149
a dead weight generates initial compressive stress and also the P-Δ effect on the column, which 150
may lead to conservative test results if the damage is governed by tensile strength of the column 151
owing to flexural bending. In this study, however, the dead weight was added in the tests to 152
simulate the vertical downward load as recommended in the standard AS 5100.2:2017 [27] in 153
which road side barriers are classified based on its performance level, such as low, regular, and 154
medium performance levels. For the regular barrier performance level, the ultimate vertical 155
downward load of 100 kN over 6 m contact length between the barrier and the vehicle as given 156
in Table 12.2.2 of AS 5100.2:2017 [27]. The compressive strength of concrete material with 157
0% rubber at the testing day was 50.3 MPa. 158
© 2018. This manuscript version is made available under the CC-BY-NC-ND 4.0 license http://creativecommons.org/licenses/by-nc-nd/4.0/
Page 9
9
159
160
Fig. 2. Impact test setup 161
The reinforcement of the columns included 6 mm diameter bars in the longitudinal direction 162
and 4 mm diameter stirrups at a spacing of 50 mm throughout the columns. The longitudinal 163
reinforcement ratio of these columns was 1.14%. The 6 mm diameter longitudinal bars were 164
extended into the top flange and the bottom footing to create fully fixed boundary conditions at 165
the two ends. The nominal yield stress and elastic modulus of the reinforcement were 250 MPa 166
and 200 GPa, respectively. 167
In addition, there was one 15% rubberized concrete column confined with CFRP. Column CF-168
15-01 was wrapped with one longitudinal CFRP layer and one transverse CFRP layer. It should 169
also be noted that the transverse layers had an overlap of 100 mm. Carbon fiber SikaWrap®-170
230C which is a woven unidirectional carbon fiber fabric designed for structural engineering 171
applications was used in this study. The dry fiber had the tensile strength of 4300 MPa as 172
provided by the manufacturer [28]. The fiber density was 1.8 g/cm3 and the nominal thickness 173
was 0.131 mm. The dry fiber modulus of elasticity in tension was 230 GPa. Firstly, the concrete 174
surface of the two columns was prepared carefully in which all grease, dust, and any other 175
contaminant that could impair adhesion were removed by an air jet. The concrete surface was 176
© 2018. This manuscript version is made available under the CC-BY-NC-ND 4.0 license http://creativecommons.org/licenses/by-nc-nd/4.0/
Page 10
10
then cleaned by acetone before bonding with FRP. The epoxy curing time was maintained at 177
least seven days before testing. Epoxy MasterBrace 4500 was used to bond FRP to concrete 178
surface. The epoxy consisted of two parts with the mixing ratio of 2:1 by weight as 179
recommended by the manufacturer [29]. The epoxy had the nominal tensile strength = 17 MPa, 180
compressive strength = 60 MPa, and flexural strength = 35 MPa. The first coat of epoxy should 181
be applied to the concrete surface using either a roller or brush. The CFRP sheet was placed on 182
the concrete surface and rolled in the fiber direction two to three times using a Uni-Pro fiber 183
glass compression roller [30] to impregnate the resin into the fibers. This process was done to 184
ensure no air bubbles in the interfaces and the resin. It should be noted that when joining strips 185
of fiber together a 15 cm overlap length is required in the main direction and additional resin 186
must be applied at the overlap section. 187
Impact test setup 188
The pendulum impact apparatus comprised a steel rig fixed on a strong solid floor to support 189
the entire test system. A 300-kg solid steel impactor was connected through a 2.8-m-long steel 190
arm to the frame. An inclinometer installed on top of the steel rig was utilized to measure the 191
release angle of the impactor. For each impact test, the impactor was lifted to a certain height, 192
corresponding to a designated angle, and then released to impact the centre (mid-height) of the 193
columns. The impactor hits the column and rebounds, which is pulled back to avoid the column 194
being impacted for the second time. 195
The impact force was measured by a load cell that was fixed in front of the impactor. One linear 196
variable differential transformer (LVDT) was placed at column mid-height to confirm the 197
displacements recorded by the high-speed camera. The load cell and LVDT were connected to 198
a National Instrument USB-9237 acquisition system, and the data were captured at a sampling 199
frequency of 50 kHz. A high-speed camera (Photron SA-Z) was utilized to monitor the 200
© 2018. This manuscript version is made available under the CC-BY-NC-ND 4.0 license http://creativecommons.org/licenses/by-nc-nd/4.0/
Page 11
11
deformation-to-failure process of the columns. The filming rate of the high-speed camera was 201
set to 8000 frames per second and the exposure time was set to balance with the aperture. Four 202
halogen lights were used to provide sufficient lighting for high-speed filming. Seven tracking 203
points were used for the columns to enable the high-speed camera images to be post-processed 204
using digital image correlation software to derive the column displacement time histories at 205
these tracking points. The tracking points are spread apart at 100 mm with an extra point on the 206
impactor and on the top of the column. 207
Experimental results and discussion 208
The columns were tested with multiple impacts by progressively increasing the impact velocity. 209
The release angle of the steel projectile was 3o, 15o, and 30o which corresponded to Impact 1, 210
2, and 3 with the impact velocities of 0.27 m/s, 1.37 m/s, and 2.71 m/s, respectively. In addition, 211
if the columns did not fail at the third impact, they were subjected to the fourth impact which 212
was released at an angle of 40o, corresponding to the impact velocity of 3.58 m/s. The 213
progressive failure of the columns was examined by using the high-speed camera. Accordingly, 214
the images from the high-speed camera were used to conduct image processing for measuring 215
the displacement and velocity at multiple points. Meanwhile, the impact force was monitored 216
by using the mounted load cell on the steel impactor. 217
Deformation and progressive failure 218
In general, all the columns exhibited hairline cracking at the midpoint (impact point) and near 219
the top and bottom footings after Impact 1. These cracks had clearly developed and propagated 220
after Impact 2. Subsequently, these columns experienced severe damage associated with 221
varying degrees in which major cracks or complete collapse of the columns were observed. All 222
of the columns failed after the third impact. The impact response of the columns included two 223
© 2018. This manuscript version is made available under the CC-BY-NC-ND 4.0 license http://creativecommons.org/licenses/by-nc-nd/4.0/
Page 12
12
stages: the first stage is the impact force phase when the impactor and the column were in 224
contact and the second stage when the columns freely vibrated after the impactor and the 225
columns were apart. The first stage lasted for about 40-80 ms which is the impact duration in 226
the impact force time history while the free vibration phase lasted much longer up to 1 second. 227
The deformation and the progressive failure of the specimens were recorded by the high-speed 228
camera and presented in Fig. 3. This figure shows the response of Columns CT-15-02 and CF-229
15-01 after Impact 3. For Column CT-15-02, the flexural crack at the rear face of the column 230
caused failure followed by cracks at the columns top and base. It is different from the static 231
case, when the columns were impacted, the added mass on the top provided inertial restraint to 232
the column and acted as a fix restraint at the column top in the early stage of the impact event. 233
This observation was also reported in the previous studies [31, 32]. On the other hand, Column 234
CF-15-01 failed by noticeable damage of the two ends of the column where the joint between 235
the column and the top and base concrete blocks opened with longitudinal reinforcements 236
fractured. The damage at the two ends of Column CF-15-01 was more severe than that of 237
Column CT-15-02. FRP confinement enhanced the column strength at the impact point so that 238
it did not fail under Impact 3. The mid-height region of Column CF-15-01 observed less impact 239
energy than that of Column CT-15-01. As a result, more impact energy was transferred to the 240
two ends of Column CF-15-01 and thus caused more serious damage. It is noted that the 241
vibration and displacement of the columns under Impact 1 and 2 are not presented here since 242
the small impact forces did not cause any remarkable damage. However, the image processing 243
was carried out by using high-speed camera images to investigate the lateral displacement at 244
the tracking points. 245
© 2018. This manuscript version is made available under the CC-BY-NC-ND 4.0 license http://creativecommons.org/licenses/by-nc-nd/4.0/
Page 13
13
246
Fig. 3. Impact response of Column CT-15-02 (above) CF-15-01 (below) under Impact 3 247
The typical failure of the unconfined rubberized concrete columns is described in Fig. 4 where 248
damage was observed at three critical sections including the impact point, the column-footing 249
connection, and the column-top connection. The failure of these columns was caused by both 250
flexural and shear failure. Damage to the columns was found to be localized at the three critical 251
locations while there was no damage at other parts of the columns. As the impact force was 252
increased, concrete crushing at the impact point and flexural damage of concrete in the rear face 253
of the columns were observed. Diagonal shear damage near the column base and column top 254
was also initiated after Impact 2. As shown in Fig. 3, the flexural crack at the impact point was 255
very severe at 27 ms while the top concrete plate was still perpendicular to the column 256
indicating that only minor cracks appeared and no damage was observed. Accordingly, damage 257
of the three critical locations became obvious at 114 ms. As the impact force increased, the 258
© 2018. This manuscript version is made available under the CC-BY-NC-ND 4.0 license http://creativecommons.org/licenses/by-nc-nd/4.0/
Page 14
14
shear and flexural cracks further increased leading to complete failure of the columns. At the 259
same level of the impact, the columns with higher rubber content showed more severe damage. 260
261
Fig. 4. Typical failure of the columns under lateral impact (CT-30-01) 262
The damage and failure mode of the tested columns with different rubber contents are shown 263
in Fig. 5 to investigate its effect on the failure mode. As can be seen from the figure, the level 264
of damage increases with the rubber content. It mean that the columns with higher rubber 265
content exhibited more severe damage and thus absorb more impact energy. The use of FRP 266
confinement has changed the failure mode of the rubberized concrete columns from three-267
plastic-hinge to two-plastic-hinge failure. However, the confined column was stronger than 268
other columns so that it survived after impact 3 and failed at Impact 4 under higher impact 269
energy. 270
© 2018. This manuscript version is made available under the CC-BY-NC-ND 4.0 license http://creativecommons.org/licenses/by-nc-nd/4.0/
Page 15
15
271
Fig. 5. Damage of the tested columns with different rubber contents after Impact 3 272
Impact force time histories 273
Impact force time histories of the rubberized concrete columns were derived from the load cell 274
record and shown in Figs. 6-7. All the graphs exhibit a similar pattern including an initial peak 275
followed by a subsequent peak caused by the interaction between the impactor and the column. 276
The first peak impact force was significantly larger than other peaks and the impact duration 277
during the first peak was about 30 ms for the normal concrete columns and 40-60 ms for the 278
rubberized concrete columns. As displayed in the graphs, with the increase in the release angle 279
from 3 degree to 15 degree, the peak impact force showed a significant increase. However, the 280
peak impact force of the unconfined rubberized concrete columns did not further increase when 281
the release angle increased from 15 degree to 30 degree. On the other hand, the peak impact 282
force of all the rubberized columns under Impact 3 was smaller than Impact 2 except the 283
confined column CF-15-1. It was because Impact 2 caused damage at the impact point to the 284
column and reduced the contact stiffness of the columns so that the impact force was smaller 285
although the impact kinetic energy is larger. It is noted that the impact force time history of 286
© 2018. This manuscript version is made available under the CC-BY-NC-ND 4.0 license http://creativecommons.org/licenses/by-nc-nd/4.0/
Page 16
16
Column CF-15-01 under impact 2 was missed due to a malfunction but the peak was seen at 287
about 32 kN. The rubberized concrete confined with FRP exhibited a significant increase in its 288
impact load resistant capacity as shown in Fig. 7. 289
290
Fig. 6. Impact force time histories of the columns 291
292
Fig. 7. Impact force time histories of the columns with and without FRP confinement 293
© 2018. This manuscript version is made available under the CC-BY-NC-ND 4.0 license http://creativecommons.org/licenses/by-nc-nd/4.0/
Page 17
17
As shown in Fig. 6, the impact force time histories among the three impacts exhibited a slight 294
difference at the second peak. For Impact 2, there was a gap between the first and the second 295
impact with the impact force equal to zero, implying the impactor and the column separated 296
from each other before the column rebounded back inducing the second impact. Meanwhile, 297
this phenomenon was not observed for Impact 1. As the impact energy was relatively small 298
(Impact 1), after the first contact the impact force reduced owing to the deformation of the 299
column but the impactor moved together with the column before column rebounded to induce 300
the second impact. As the impact energy and impact forces increased, the impactor pushed the 301
column to deform quickly and at the same time the larger impact caused more prominent 302
rebound of the impactor, which resulted in separation between the impactor and the column 303
before column rebounded to cause the second impact. Close inspections on the high-speed 304
camera images have confirmed that the columns rebounded and made contact with the load cell 305
causing the second peak. The peak impact force and impact duration of the columns are 306
presented in Table 2. In addition, the impact impulse is estimated as the enclosed area of the 307
impact force time history and also presented in the table. 308
Fig. 6 shows the rubberized concrete significantly reduced the peak impact force and extended 309
the impact duration. For instance for Impact 2, the peak impact forces of Columns CT-00-01, 310
CT-15-01, and CT-30-01 were 30 kN, 22 kN, and 18 kN, respectively, corresponding to the 311
reduction of the peak impact force by 27% and 40%. In the meantime, the duration of these 312
impacts was 60 ms, 80 ms, and 110 ms for Columns CT-00-01, CT-15-01, and CT-30-01, 313
respectively. It is noted that the impact duration of these columns includes the first and the 314
second peak impact force as shown in Fig. 8. The impact force time histories after Impact 2 315
showed the highest impact forces so that it was chosen to compare the impact resistance 316
between the columns with different rubber contents. This characteristic has proven that 317
rubberized concrete can be efficiently utilized in real structures to minimise the peak impact 318
© 2018. This manuscript version is made available under the CC-BY-NC-ND 4.0 license http://creativecommons.org/licenses/by-nc-nd/4.0/
Page 18
18
force. For example, rubberized concrete can be used as road side barriers to considerably reduce 319
peak impact force and thus minimize injury or even death when an accidental collision occurs. 320
However, as shown in Fig. 8, the impact load resistant capacity of the rubberized concrete 321
columns is smaller than that of the reference column. A compromise between the energy 322
absorption and the load resistant capacity is required when designing these structures. 323
324
Fig. 8. Impact force time histories of the columns with different rubber contents under impact 325
2 326
Displacement time histories 327
The displacement time histories of the columns were derived from image processing of the 328
high-speed camera images at the tracking points including the midheight and column top as 329
shown in Figs. 9-10. In addition, the maximum displacement at the midheight and the column 330
top as well as the residual displacement are presented in Table 3. 331
© 2018. This manuscript version is made available under the CC-BY-NC-ND 4.0 license http://creativecommons.org/licenses/by-nc-nd/4.0/
Page 19
19
332
Fig. 9. Midheight displacement histories of the columns 333
As shown in Fig. 9 and Table 3, the maximum displacement of the columns under Impact 1 was 334
quite small and the columns’ deformation was mostly still in the elastic range and the residual 335
displacement of these columns ranged from 0.5 mm to 1.5 mm. As the impact energy increased 336
(Impact 2), the maximum displacement at the impact point of normal concrete columns was 15-337
19 mm while the corresponding values of the columns with 15% and 30% rubber contents were 338
23-25 mm, and 25-26 mm, respectively. These results demonstrate that rubberized concrete 339
columns become much flexible than its counterpart made of normal concrete. As can be seen 340
from Fig. 9 and Table 3, the column displacement increased significantly when the rubber 341
contents increased from 0% to 15%. However, further increasing the rubber content from 15% 342
to 30% did not change the column displacement considerably. Under Impact 3, the maximum 343
displacement of Column CT-00 at the impact point was 65-75 mm while the corresponding 344
values for Column CT-15 and CT30 were 92-137 mm and 127-130 mm, respectively. The 345
rubberized concrete columns deflected approximately twice the reference columns CT-00 (≈70 346
mm vs ≈120 mm). 347
© 2018. This manuscript version is made available under the CC-BY-NC-ND 4.0 license http://creativecommons.org/licenses/by-nc-nd/4.0/
Page 20
20
348
Fig. 10. Column top displacement time histories 349
350
Fig. 11. Displacement time histories of the columns with and without FRP confinement 351
Fig. 11 shows the effectiveness of using FRP confinement to reduce the displacement. Under 352
Impact 2, the maximum displacement at mid-height of the normal concrete columns was 15-19 353
mm while the corresponding displacements for two Columns CT-15 and Column CF-15-01 354
were 23-25 mm and 20 mm, respectively. Column CF-15-01 did not show a considerable 355
© 2018. This manuscript version is made available under the CC-BY-NC-ND 4.0 license http://creativecommons.org/licenses/by-nc-nd/4.0/
Page 21
21
enhancement of the column’s stiffness under Impact 2 compared to the reference column. The 356
rubber content in Column CF-15-01 made the column more flexible while the FRP confinement 357
increased the column stiffness and partially compensated for the loss of the column’s stiffness 358
due to replacing aggregates with rubber. As a result, the column CF-15-01’s displacement was 359
in between the reference plain concrete column and column CT-15. Under Impact 3, the 360
midheight displacement of the reference columns (CT-00) was 65-75 mm while the 361
corresponding midheight displacement of Columns CT-15 and CF-15-1 were 92-137 mm and 362
55 mm, respectively. It can be seen that the FRP confinement can significantly reduce the 363
displacement while it still enhance the energy absorption capacity. As shown in Table 2, the 364
energy absorption of Column CT-00-01 and CF-15-01 under Impact 3 was 517 J and 821 J, 365
respectively. 366
In addition, the displacement time histories at the column top (Fig. 10) is also an important 367
measure of the column response under lateral impact. It is different from the static case, where 368
the displacement at the column top is 2.5 times the displacement at the midheight, the 369
displacement at the column top was almost similar to that at the impact point but with a delay. 370
This delay relates to the free vibration frequency of the columns and also the interaction 371
between the impactor and the columns, which generated stress waves travelling from the impact 372
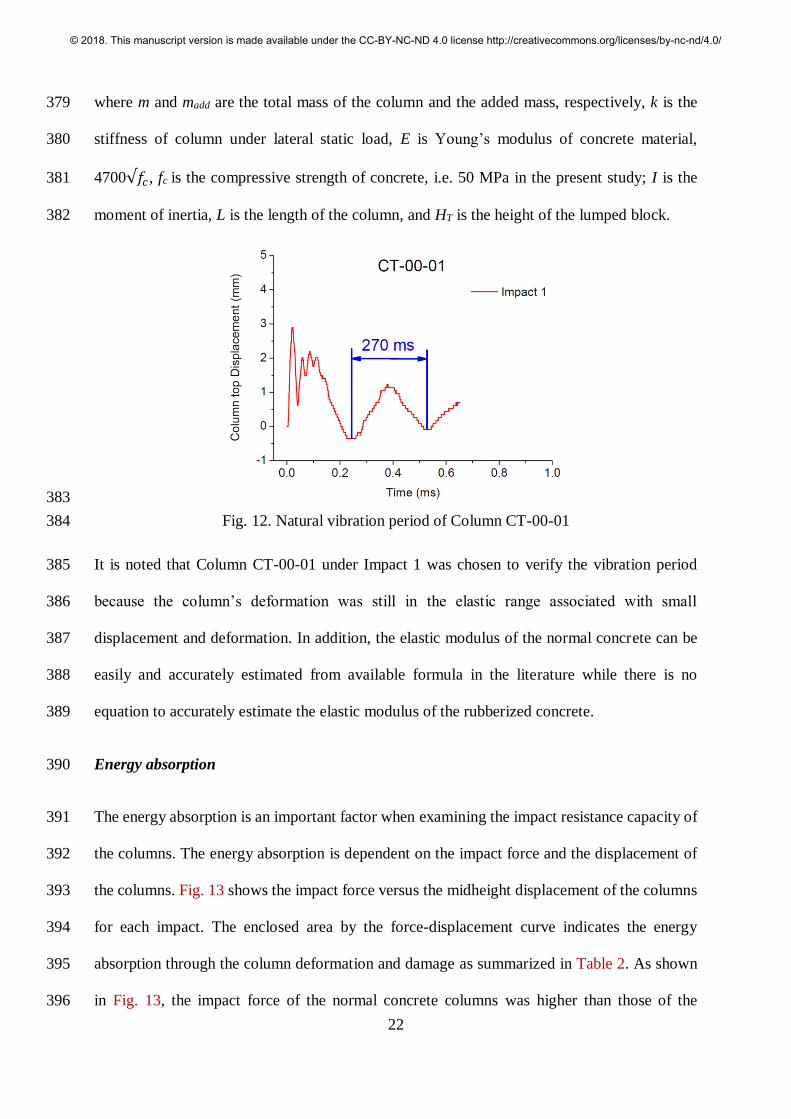
point toward the column ends. From Fig. 12, the vibration period of Column CT-00 was 373
approximately 270 ms, which is estimated from the free-vibration phase of the testing results 374
from Impact 1. The natural vibration period of these columns can be theoretically estimated as 375
235 ms. These results have confirmed the reliability of these complicated impact tests. The 376
natural vibration period can be estimated as follows [31, 32]: 377
)(2353
2
3
ms
HL
EI
mmT
T
add
(1) 378
© 2018. This manuscript version is made available under the CC-BY-NC-ND 4.0 license http://creativecommons.org/licenses/by-nc-nd/4.0/
Page 22
22
where m and madd are the total mass of the column and the added mass, respectively, k is the 379
stiffness of column under lateral static load, E is Young’s modulus of concrete material, 380
4700√𝑓𝑐 , fc is the compressive strength of concrete, i.e. 50 MPa in the present study; I is the 381
moment of inertia, L is the length of the column, and HT is the height of the lumped block. 382
383
Fig. 12. Natural vibration period of Column CT-00-01 384
It is noted that Column CT-00-01 under Impact 1 was chosen to verify the vibration period 385
because the column’s deformation was still in the elastic range associated with small 386
displacement and deformation. In addition, the elastic modulus of the normal concrete can be 387
easily and accurately estimated from available formula in the literature while there is no 388
equation to accurately estimate the elastic modulus of the rubberized concrete. 389
Energy absorption 390
The energy absorption is an important factor when examining the impact resistance capacity of 391
the columns. The energy absorption is dependent on the impact force and the displacement of 392
the columns. Fig. 13 shows the impact force versus the midheight displacement of the columns 393
for each impact. The enclosed area by the force-displacement curve indicates the energy 394
absorption through the column deformation and damage as summarized in Table 2. As shown 395
in Fig. 13, the impact force of the normal concrete columns was higher than those of the 396
© 2018. This manuscript version is made available under the CC-BY-NC-ND 4.0 license http://creativecommons.org/licenses/by-nc-nd/4.0/
Page 23
23
rubberized concrete columns. However, the deformations of the latter ones were significantly 397
larger. When the impact force was small and the columns deformation was mostly in the elastic 398
range, the energy absorption of the rubberised concrete columns was higher than that of the 399
reference columns. For Impact 1, the impact energy absorption of Columns CT-15 and CT-30 400
are 42% and 130% higher the reference columns, respectively. For Impact 2, the corresponding 401
values for Columns CT-15 and CT-30 were 4% and 6%. For impact 3, the energy absorption of 402
the columns without rubber was approximately 607 J while the corresponding average energy 403
absorption for the columns with 15% and 30% rubber was 683 J and 867 J, respectively. These 404
increases indicate that the enhancement of energy absorption in these columns was 13% and 405
43%, respectively. Therefore, it can be concluded that rubberized concrete increases the energy 406
absorption under lateral impact forces. 407
408
Fig. 13. Impact force versus mid-height displacement of the rubberized concrete columns 409
Fig. 14 shows the impact force versus the midheight displacement of the columns for each 410
impact. The rubberized concrete column confined with FRP exhibited an exceptional 411
improvement in absorbing energy. Under the first impact, the energy absorption of Columns 412
CF-15-01 was enhanced by 107% as compared to that of the reference column. As mentioned 413
previously, this column survived after the third impact with the release angle of 30o and it is the 414
only column failing at the fourth impact with the release angle of 400. The maximum energy 415
absorption of Column CF-15-01 at the fourth impact was 1483 J which was equal to 2.44 times 416
© 2018. This manuscript version is made available under the CC-BY-NC-ND 4.0 license http://creativecommons.org/licenses/by-nc-nd/4.0/
Page 24
24
the corresponding one of the reference column (607 J). Therefore, FRP confined concrete 417
column can be used to achieve both better energy absorption and load carrying capacity. 418
419
Fig. 14. Impact force versus mid-height displacement of the columns with/without FRP 420
confinement 421
Conclusions 422
The impact behaviour of rubberized concrete columns has been experimentally investigated by 423
using the pendulum impact tests. The rubberized concrete columns showed an excellent impact 424
behaviour over the normal concrete columns. The key findings can be summarized as follows: 425
1. The rubberized concrete columns significantly reduce the peak impact force (27% - 40%) 426
and thus they can mitigate the risk of injury if rubberized concrete is used in construction 427
of roadside barriers. 428
2. The rubberized concrete columns are more ductile and they can deflect twice the reference 429
columns before failure, especially when they are confined with FRP. 430
3. Rubberized concrete significantly increases the impact energy absorption. The columns 431
with 15% and 30% rubber showed an increase in the impact energy absorption by 58% 432
and 63% as compared to the reference columns, respectively. 433
© 2018. This manuscript version is made available under the CC-BY-NC-ND 4.0 license http://creativecommons.org/licenses/by-nc-nd/4.0/
Page 25
25
4. The rubberized concrete columns with and without FRP confinement showed an increase 434
of the impact energy by 4-42% and 35-144% as compared to the reference columns, 435
respectively. 436
Finally, the results in this study has indicated that rubberized concrete is a promising material 437
to use in roadside barriers since it significantly increases the ductility and energy absorption 438
under impact loads. In addition, rubberized concrete considerably reduces the peak impact force 439
and thus it can reduce the risks to passengers if collision occurs. 440
Acknowledgement 441
The authors would like to deeply thank Liam O’keefe from Tyres Stewardship Australia and 442
Adrian Jones from Tyrecycle. Thanks are given to Andrew Sarkady and Anup Chakrabortty 443
from BASF for kindly donating the superplasticizer required for all the specimens. Thanks are 444
given to the following technicians Matt Arpin, Malcolm Stafford, Jim Waters and Brad Rose 445
for assisting the students in performing the experiments. Thanks are given to Cameron Marshal 446
and Armin Hosseini, and David Pegrum, former students of the University of Western Australia 447
for performing the tests and processing the test data. 448
References 449
[1] Elchalakani M. High strength rubberized concrete containing silica fume for the 450
construction of sustainable road side barriers. Structures. 2015;1:20-38. 451
[2] Topçu IB. The properties of rubberized concretes. Cem Concr Res. 1995;25(2):304-10. 452
[3] Topçu IB, Avcular N. Collision behaviours of rubberized concrete. Cem Concr Res. 453
1997;27(12):1893-8. 454
[4] Khatib ZK, Bayomy FM. Rubberized Portland cement concrete. J Mater Civ Eng. 455
1999;11(3):206-13. 456
[5] Hernández-Olivares F, Barluenga G, Bollati M, Witoszek B. Static and dynamic behaviour 457
of recycled tyre rubber-filled concrete. Cem Concr Res. 2002;32(10):1587-96. 458
[6] Atahan AO, Sevim UK. Testing and comparison of concrete barriers containing shredded 459
waste tire chips. Mater Lett. 2008;62(21):3754-7. 460
© 2018. This manuscript version is made available under the CC-BY-NC-ND 4.0 license http://creativecommons.org/licenses/by-nc-nd/4.0/
Page 26
26
[7] Ozbay E, Lachemi M, Sevim UK. Compressive strength, abrasion resistance and energy 461
absorption capacity of rubberized concretes with and without slag. Mater Struct. 462
2011;44(7):1297-307. 463
[8] Liu F, Chen G, Li L, Guo Y. Study of impact performance of rubber reinforced concrete. 464
Constr Build Mater. 2012;36:604-16. 465
[9] Gupta T, Chaudhary S, Sharma RK. Assessment of mechanical and durability properties of 466
concrete containing waste rubber tire as fine aggregate. Constr Build Mater. 2014;73:562-74. 467
[10] Youssf O, Hassanli R, Mills JE. Mechanical performance of FRP-confined and unconfined 468
crumb rubber concrete containing high rubber content. Journal of Building Engineering. 2017. 469
[11] Pham TM, Elchalakani M, Hao H. Axial impact resistance of rubberized concrete 470
with/without FRP confinement for sustainable road side barriers. Int J Protect Struct. 471
2018;Revision submitted. 472
[12] Zheng L, Sharon Huo X, Yuan Y. Experimental investigation on dynamic properties of 473
rubberized concrete. Constr Build Mater. 2008;22(5):939-47. 474
[13] Sukontasukkul P, Chaikaew C. Properties of concrete pedestrian block mixed with crumb 475
rubber. Constr Build Mater. 2006;20(7):450-7. 476
[14] ACI 544.2R-17. Report on the Measurement of Fresh State Properties and Fiber Dispersion 477
of Fiber-Reinforced Concrete. Farmington Hills, MI: American Concrete Institute; 2017. 478
[15] Atahan AO, Yücel AÖ. Crumb rubber in concrete: Static and dynamic evaluation. Constr 479
Build Mater. 2012;36:617-22. 480
[16] Donga PD, Shah D, Bhavsar JK. Impact Resistance of Waste Rubber Fiber Silica Fume 481
Concrete. Journal of Civil Engineering and Environmental Technology. 2016;3(4):274-9. 482
[17] Gupta T, Sharma RK, Chaudhary S. Impact resistance of concrete containing waste rubber 483
fiber and silica fume. Int J Impact Eng. 2015;83:76-87. 484
[18] Youssf O, ElGawady MA, Mills JE. Static cyclic behaviour of FRP-confined crumb rubber 485
concrete columns. Eng Struct. 2016;113:371-87. 486
[19] Xue J, Shinozuka M. Rubberized concrete: A green structural material with enhanced 487
energy-dissipation capability. Constr Build Mater. 2013;42:196-204. 488
[20] Sukontasukkul P, Jamnam S, Rodsin K, Banthia N. Use of rubberized concrete as a cushion 489
layer in bulletproof fiber reinforced concrete panels. Constr Build Mater. 2013;41:801-11. 490
[21] Pham TM, Chen W, Hao H. Failure and impact resistance analysis of plain and FRP-491
confined concrete cylinders under axial impact loads. Int J Protect Struct. 2018;9(1):4-23. 492
[22] Pham TM, Hao H. Axial impact resistance of FRP-confined concrete. J Compos Constr. 493
2017;21(2):04016088. 494
[23] Pham TM, Hao H. Behavior of fiber reinforced polymer strengthened reinforced concrete 495
beams under static and impact loads. Int J Protect Struct. 2017;8(1):1-22. 496
[24] Tyre recycle. 2018. 497
[25] AS 1012.9. Compressive strength tests - concrete. 10129: 2014. Sydney, NSW, 498
Australia2014. 499
[26] Mohammadi I. Investigation on the use of crumb rubber concrete (CRC) for rigid 500
pavements 2014. 501
[27] AS 5100.2:2017. Bridge design. Part 2: Design loads. Sydney, NSW, Australia2017. 502
[28] Sika Australia. Strengthening columns or beams with carbon fibre fabric. 2017. 503
[29] BASF. MasterBrace 4500 - High strength saturant for MasterBrace fabric sheets. 2017. 504
[30] Uni-Pro. UNi-PRO Fibreglass Compression Roller. 2017. 505
[31] Do TV, Pham TM, Hao H. Numerical investigation of the behaviour of precast segmental 506
concrete columns subjected to vehicle collision. Eng Struct. 2018;156:375-93. 507
[32] Do TV, Pham TM, Hao H. Dynamic responses and failure modes of bridge columns under 508
vehicle collision. Eng Struct. 2018;156:243-59. 509
510
© 2018. This manuscript version is made available under the CC-BY-NC-ND 4.0 license http://creativecommons.org/licenses/by-nc-nd/4.0/
Page 27
27
List of Figures 511
Figure 1. Particle size distribution from sieve testing 512
Figure 2. Impact test setup 513
Figure 3. Impact response of Column CT-15-02 (above) CF-15-01 (below) under Impact 3 514
Figure 4. Typical failure of the columns under lateral impact 515
Figure 5. Damage of the tested columns with different rubber contents after Impact 3 516
Figure 6. Impact force time histories of the columns 517
Figure 7. Impact force time histories of the columns with/without FRP confinement 518
Figure 8. Impact force time histories of the columns with different rubber contents 519
Figure 9. Midheight displacement time histories of the columns 520
Figure 10. Column top displacement time histories of the columns 521
Figure 11. Column top displacement time histories of the columns 522
Figure 12. Natural vibration period of Columns CT-00 523
Figure 13. Impact force versus midheight displacement of the unconfined concrete columns 524
Figure 14. Impact force versus midheight displacement of the columns with/without FRP 525
confinement 526
© 2018. This manuscript version is made available under the CC-BY-NC-ND 4.0 license http://creativecommons.org/licenses/by-nc-nd/4.0/
Page 28
28
List of Tables 527
Table 1. Mix design and preliminary test results 528
Table 2. Impact force and energy dissipation of the tested columns 529
Table 3. Peak and residual displacement of the tested columns 530
© 2018. This manuscript version is made available under the CC-BY-NC-ND 4.0 license http://creativecommons.org/licenses/by-nc-nd/4.0/
Page 29
29
Table 1. Mix design and preliminary test results 531
%
rubber
Water
(kg/m3)
Cement
(kg/m3)
4-7 mm agg.
(kg/m3)
<4 mm agg.
(kg/m3)
Sand
(kg/m3)
Rubber 5-7
mm (kg/m3)
Rubber 1-5
mm (kg/m3)
fc’
(MPa)
0 213 426 750 130 843 0 0 50.27
15 213 426 638 111 717 49 63 23.67
30 213 426 525 91 590 98 127 14.37
532
© 2018. This manuscript version is made available under the CC-BY-NC-ND 4.0 license http://creativecommons.org/licenses/by-nc-nd/4.0/
Page 30
30
Table 2. Impact force and energy dissipation of the tested columns 533
Column Impact Peak impact
force (kN)
Impact
duration (ms)
Impulse
(kN.ms)
Energy
dissipation (J)
CT-00-01
1 13 40 161 19
2 30 60 416 228
3 21 110 701 517
CT-00-02
1 13 40 167 9
2 28 80 439 233
3 23 125 627 697
CT-15-01
1 12 50 171 12
2 22 80 381 140
3 17 150 593 691
CT-15-02
1 11 50 180 27
2 N.A N.A N.A N.A
3 14 150 591 676
CT-30-01
1 10 80 211 39
2 18 110 444 235
3 13 250 644 849
CT-30-02
1 10 80 176 25
2 19 100 433 253
3 15 250 693 885
CF-15-01
1 14 50 1645 29
2 N.A N.A N.A N.A
3 46 25 634 821
4 32 50 824 1483
534
© 2018. This manuscript version is made available under the CC-BY-NC-ND 4.0 license http://creativecommons.org/licenses/by-nc-nd/4.0/
Page 31
31
Table 3. Peak and residual displacement of the columns 535
Column Impact Peak Disp. at
column top (mm)
Residual Disp. at
column top (mm)
Peak Disp. at
midheight (mm)
Residual Disp. at
midheight (mm)
CT-00-01
1 2.7 0.5 2.7 0.5
2 22.0 10.0 14.5 8.5
3 82.0 72.0 65.0 58.0
CT-00-02
1 3.8 0.6 2.9 0.4
2 29.0 20.0 19.0 14.0
3 108.0 97.0 75.0 70.0
CT-15-01
1 5.6 1.0 4.0 0.6
2 37.5 22.5 23.0 14.0
3 130.0 125.0 92.0 87.0
CT-15-02
1 5.5 1.0 4.5 0.9
2 N.A N.A 24.8 15.2
3 160.0 142.0 137.0 122.0
CT-30-01
1 12.0 1.3 9.0 1.5
2 41.0 19.0 26.0 13.0
3 142.0 118.0 130.0 118.0
CT-30-02
1 6.0 0.5 4.2 0.5
2 41.0 20.0 26.0 14.0
3 158.0 138.0 127.0 119.0
CF-15-01
1 4.6 1.1 3.2 0.9
2 32.5 14.0 20.0 9.0
3 90.0 80.0 55.0 46.0
4 240.0 235.0 140.0 133.0
536
© 2018. This manuscript version is made available under the CC-BY-NC-ND 4.0 license http://creativecommons.org/licenses/by-nc-nd/4.0/