R ESEARCH ARTICLE doi: 10.2306/scienceasia1513-1874.2008.34.229 ScienceAsia 34 (2008): 229–237 Dynamic simulation of plate and frame heat exchanger undergoing food fouling: coconut milk fouling case study Phavanee Narataruksa a *, Panya Triratana a , Karn Pana-Suppamassadu a , Peter J. Heggs b , and Suvit Tia c a Department of Chemical Engineering, Faculty of Engineering, King Mongkut’s Institute of Technology North Bangkok, Bangkok 10800, Thailand. b School of Chemical Engineering and Analytical Science, The University of Manchester, Manchester M60 1QD, United Kingdom. c Department of Chemical Engineering, Faculty of Engineering, King Mongkut’s University of Technology Thonburi, Bangkok 10140, Thailand. * Corresponding author, E-mail: [email protected]ABSTRACT: The mathematical modelling and-simulation of plate heat exchangers with rapid fouling effects are presented. Crank-Nicolson’s method and the ghost-node technique were used to solve the thermal model. Effects of fouling were added to the model through the overall heat-transfer coefficient correlation. A fourth order Runge-Kutta scheme was used to obtain the integral value of the fouling model. An experimental study of coconut-milk pasteurization section developed previously was used as a case study. The flow configuration adopted was 1 pass 2 channels of hot water countercurrents with 1 pass 1 channel of coconut milk. The variation of the coconut milk outlet temperature and the overall heat-transfer coefficient with time from the simulation agreed well with those obtained from the experiments. The algorithm presented in this research work can be used to provide a result of step change of selected input variable(s), i.e. fluid-flow rate and temperature. The feature allowed the control strategy to be specified in order to bring back an outlet temperature of one process stream when the process was undergoing fouling. Ultimately, the algorithm was also used to simulate the case of 1 pass 25 channels of hot water countercurrent with 1 pass 25 channels of coconut milk. The results of this case study indicated that adjustment of inlet temperature of hot water was appropriate from the energy consumption point of view. KEYWORDS: dynamic simulation, plate heat exchanger, fouling Received 27 Aug 2007 Accepted 16 Jan 2008 www.scienceasia.org INTRODUCTION Plate heat exchangers (PHEs) have been widely used in diary and food processing plants, chemical in- dustries, power plant, and cooling systems due to the ease of maintenance and cleaning, their compact de- signs, and their excellent heat-transfer coefficient char- acteristics 1–3 . The PHEs consist of a pack of gaskets and corrugated metal plates pressed together with a frame. A gasket that seals around the plate prevents fluid mixing. It can also be used to create PHE flow configurations such as series, parallel, and multi-pass arrangements by closing and opening ports at the four plate corners. Heat duty is easily adjusted by increasing or decreasing the number of metal plates. To obtain the optimum flow configuration for a given duty, the steady-state thermal model of PHEs has been used. A number of authors have presented steady- state design methods for PHEs. Ngao-aram 4 reported that the ε-NTU method was useful for the design of PHEs for parallel or looped flow configurations, which are associated with a pressure drop across the unit. Narataruksa 5 developed a general thermal model of PHEs for the use of PHEs as two stream heat exchangers and multi-stream heat exchangers. Ribeiro and Cano Andrade 6 obtained the thermal performance of co- and counter-current for series, parallel, and multi-pass arrangement here by simulation using a linear combination of exponential functions. The results of the analysis clearly indicated the necessity of incorporating the dispersion and phase lag effect for prediction of transient behaviour of multi-pass PHEs. Gut and Pinto 7,8 presented the thermal model and six-parameter configurations that influenced heat exchanger performance. Also, Gut et al 2 adopted this model and conducted an experiment in order to find a heat transfer correlation in terms of the Nusselt number. Gut and Pinto 7 optimized the heat transfer area with the same thermal model and heat transfer correlation by a screening method. As a result, they showed that the screening method can be used to obtain the optimal configuration. Fernandes et al 9 , simulated stirred yoghurt in PHEs with a computational fluid dynamics technique in order to investigate velocity
Transcript
R ESEARCH ARTICLEdoi: 10.2306/scienceasia1513-1874.2008.34.229
ScienceAsia 34 (2008): 229–237
Dynamic simulation of plate and frame heat exchangerundergoing food fouling: coconut milk fouling case studyPhavanee Narataruksaa*, Panya Triratanaa, Karn Pana-Suppamassadua, Peter J. Heggsb, and Suvit Tiac
a Department of Chemical Engineering, Faculty of Engineering, King Mongkut’s Institute of Technology North Bangkok, Bangkok 10800, Thailand.b School of Chemical Engineering and Analytical Science, The University of Manchester, Manchester M60 1QD, United Kingdom.c Department of Chemical Engineering, Faculty of Engineering, King Mongkut’s University of Technology Thonburi, Bangkok 10140, Thailand.
ABSTRACT: The mathematical modelling and-simulation of plate heat exchangers with rapid fouling effects are presented. Crank-Nicolson’s method and the ghost-node technique were used to solve the thermal model. Effects of fouling were added to the model through the overall heat-transfer coefficient correlation. A fourth order Runge-Kutta scheme was used to obtain the integral value of the fouling model. An experimental study of coconut-milk pasteurization section developed previously was used as a case study. The flow configuration adopted was 1 pass 2 channels of hot water countercurrents with 1 pass 1 channel of coconut milk. The variation of the coconut milk outlet temperature and the overall heat-transfer coefficient with time from the simulation agreed well with those obtained from the experiments. The algorithm presented in this research work can be used to provide a result of step change of selected input variable(s), i.e. fluid-flow rate and temperature. The feature allowed the control strategy to be specified in order to bring back an outlet temperature of one process stream when the process was undergoing fouling. Ultimately, the algorithm was also used to simulate the case of 1 pass 25 channels of hot water countercurrent with 1 pass 25 channels of coconut milk. The results of this case study indicated that adjustment of inlet temperature of hot water was appropriate from the energy consumption point of view.
Plate heat exchangers (PHEs) have been widely used in diary and food processing plants, chemical in-dustries, power plant, and cooling systems due to the ease of maintenance and cleaning, their compact de-signs, and their excellent heat-transfer coefficient char-acteristics1–3. The PHEs consist of a pack of gaskets and corrugated metal plates pressed together with a frame. A gasket that seals around the plate prevents fluid mixing. It can also be used to create PHE flow configurations such as series, parallel, and multi-pass arrangements by closing and opening ports at the four plate corners. Heat duty is easily adjusted by increasing or decreasing the number of metal plates.
To obtain the optimum flow configuration for a given duty, the steady-state thermal model of PHEs has been used. A number of authors have presented steady-state design methods for PHEs. Ngao-aram4 reported that the ε-NTU method was useful for the design of PHEs for parallel or looped flow configurations, which are associated with a pressure drop across the
unit. Narataruksa5 developed a general thermal model of PHEs for the use of PHEs as two stream heat exchangers and multi-stream heat exchangers. Ribeiro and Cano Andrade6 obtained the thermal performance of co- and counter-current for series, parallel, and multi-pass arrangement here by simulation using a linear combination of exponential functions. The results of the analysis clearly indicated the necessity of incorporating the dispersion and phase lag effect for prediction of transient behaviour of multi-pass PHEs. Gut and Pinto7,8 presented the thermal model and six-parameter configurations that influenced heat exchanger performance. Also, Gut et al2 adopted this model and conducted an experiment in order to find a heat transfer correlation in terms of the Nusselt number. Gut and Pinto7 optimized the heat transfer area with the same thermal model and heat transfer correlation by a screening method. As a result, they showed that the screening method can be used to obtain the optimal configuration. Fernandes et al9, simulated stirred yoghurt in PHEs with a computational fluid dynamics technique in order to investigate velocity
ScienceAsia 34 (2008)
www.scienceasia.org
behaviour in the flow channels. Numerical results concerning the difference between the inlet and the outlet yoghurt temperatures were compared with experimental data, and a standard deviation of 6.9% and 7.3% for the simulations with variable and constant heat flux were reported, respectively.
However, to predict the change in PHE thermal performance under the influence of some disturbances, the steady state model is no longer useful. In particular, the PHEs used in food processing presents a major problem due to a kind of disturbance called food fouling. A number of authors have tried to simulate the effects of fouling. The simulation results of cow milk fouling models10–13 and coconut milk fouling models1 are presented here. To reproduce the temperature profiles within the PHEs as a function of time, the fouling models must be used in conjunction with dynamic thermal models of PHEs as a dynamic simulation. Lakshmanan and Potter14 simulated the thermal dynamic model of this kind of heat exchanger using a cinematic model, and concluded that the cinematic model could find not only the steady state temperature profiles but also dynamic temperature profiles. Sharifi et al15 predicted the temperature profile of PHEs when the fluid viscosity was a function of the temperature using an explicit and a Crank-Nicholson finite difference method (CNFDM). A comparison be-tween the implicit and explicit methods was conducted, and it was concluded that explicit methods had the advantage of step change in hot fluid output temperature but it had a stability concern; the applied time increment could not be too small. Therefore, the CNFDM, which produced unconditionally stable solutions, was the attractive and proper choice, and so it was employed. Das and Murugesan16 and Das et al17 presented generalized models for thermal simulation of a single pass PHE with flow distribution and end effects by using the transfer function method. They concluded that flow maldistribution had a significant effect on thermal performance. Geogiadis and Macchietto18 simulated the effects of milk fouling by using a thermal dynamic model coupled with a kinetic milk fouling model. Three arrangements with 16 channels were used as case studies. Their simulation results were consistent with experimental data.
Most dynamic thermal models described in the literature were developed to study PHEs in dynamic circumstances. For the operation of PHEs with food fouling, the model could be used with fouling models obtained from kinetic data of reaction fouling. In some cases, fouling-model parameters such as the rate of decrease of thermal performance as a function of processing time, fluid temperature, and fluid flow
rate can be obtained from experimental data. These empirical models are easily obtained, especially when the fouling mechanism is not dominated by the reaction. This work presents fundamental dynamical models and simulations including fouling effects by using the aforementioned empirical fouling models. A system of PHE for pasteurization of coconut milk was used as a case study to compare the results of the simulated thermal performance with the experimental work.
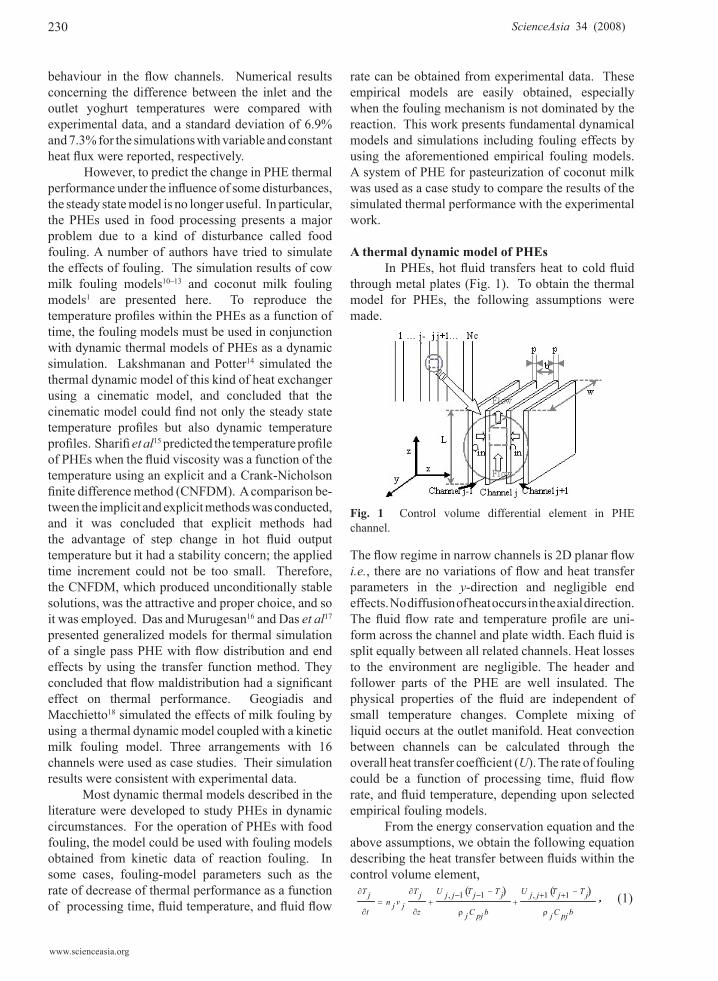
A thermal dynamic model of PHEs In PHEs, hot fluid transfers heat to cold fluid through metal plates (Fig. 1). To obtain the thermal model for PHEs, the following assumptions were made.
The flow regime in narrow channels is 2D planar flow i.e., there are no variations of flow and heat transfer parameters in the y-direction and negligible end effects. No diffusion of heat occurs in the axial direction. The fluid flow rate and temperature profile are uni-form across the channel and plate width. Each fluid is split equally between all related channels. Heat losses to the environment are negligible. The header and follower parts of the PHE are well insulated. The physical properties of the fluid are independent of small temperature changes. Complete mixing of liquid occurs at the outlet manifold. Heat convection between channels can be calculated through the overall heat transfer coefficient (U). The rate of fouling could be a function of processing time, fluid flow rate, and fluid temperature, depending upon selected empirical fouling models.
From the energy conservation equation and the above assumptions, we obtain the following equation describing the heat transfer between fluids within the control volume element,
Fig. 1 Control volume differential element in PHE channel.
bpjCj
jTjTjjU
bpjCj
jTjTjjU
z
jT
jvjnt
jT −+++
−−−+
∂
∂=
∂
∂ 11,11, ,( )( ) (1)
230
ScienceAsia 34 (2008)
www.scienceasia.org
where b is the plate gab (m), Cp the specific heat ca-pacity (J/kg K), ρ is the density (kg/m3), z the dis-tance in vertical direction (m), the j subscript refers to the channel number, T=T(z,t) is the temperature, v is the fluid velocity(m/s), n is a direction of fluid, in which a value of +1 or –1 is assigned to the downward and upward flow, respectively, and U is the overall heat transfer coefficient between hot (h) and cold (c) channels, which can be estimated by a combination of thermal resistances: (2)
where . Here p is the plate thickness (m), λ the thermal conductivity (W/m K), and α is the convective heat transfer coefficient of each fluid and can be evaluated via , (3)
where Nu is the Nusselt number. A general form of Nu for PHEs was proposed by Copper19: (4)
and (5)
where Re and Pr are the Reynolds and Prandtl numbers, respectively, μ is the dynamic viscosity (Pa.s) The hydraulic diameter (De) can be obtained from . (6)
where Ac is the cross sectional area (m2), and Pc the cross section perimeter (m), and Rf is the fouling resistance on fouled plates. Fouling resistance can be obtained from proposed fouling models1,10,20. Some authors have reported that Rf is a function dBi/dt, where Bi is the Biot number and can be calculated from
, (7)
where U0 is the overall heat transfer coefficient under a clean condition.
Numerical simulation In order to predict the temperature profile, the thermal dynamical model, which is a set of partial differential equations (PDEs), was solved by the CNFDM, an implicit finite difference method with
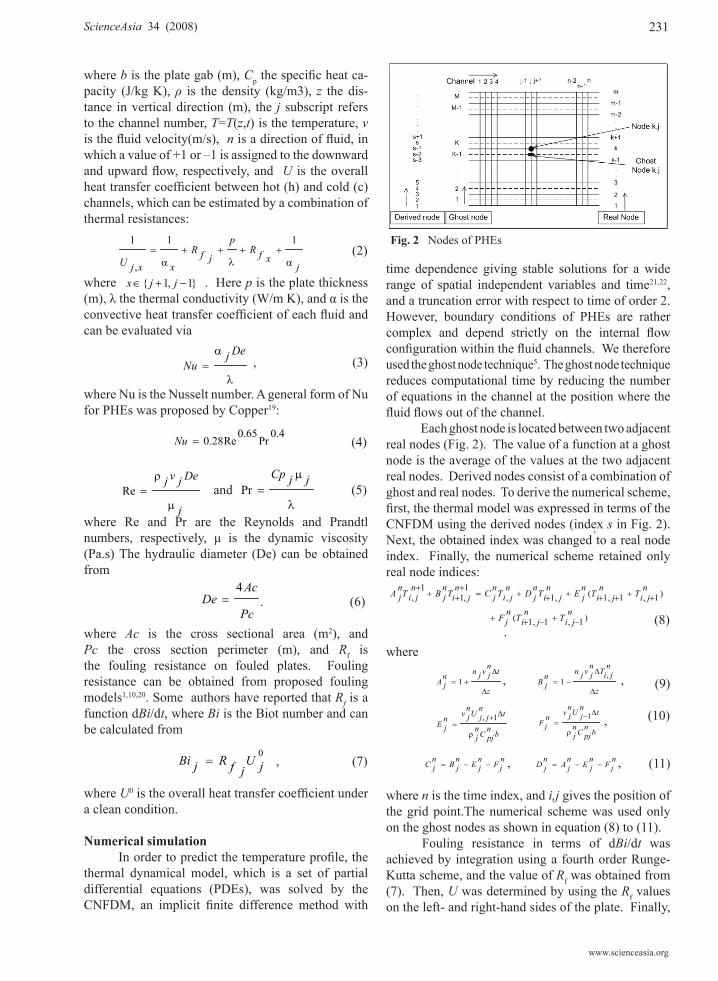
time dependence giving stable solutions for a wide range of spatial independent variables and time21,22, and a truncation error with respect to time of order 2. However, boundary conditions of PHEs are rather complex and depend strictly on the internal flow configuration within the fluid channels. We therefore used the ghost node technique5. The ghost node technique reduces computational time by reducing the number of equations in the channel at the position where the fluid flows out of the channel.
Each ghost node is located between two adjacent real nodes (Fig. 2). The value of a function at a ghost node is the average of the values at the two adjacent real nodes. Derived nodes consist of a combination of ghost and real nodes. To derive the numerical scheme, first, the thermal model was expressed in terms of the CNFDM using the derived nodes (index s in Fig. 2). Next, the obtained index was changed to a real node index. Finally, the numerical scheme retained only real node indices:
(8)
where
(9)
(10) (11) where n is the time index, and i,j gives the position of the grid point.The numerical scheme was used only on the ghost nodes as shown in equation (8) to (11). Fouling resistance in terms of dBi/dt was achieved by integration using a fourth order Runge-Kutta scheme, and the value of Rf was obtained from (7). Then, U was determined by using the Rf values on the left- and right-hand sides of the plate. Finally,
jxfR
p
jfRxxjU
11
,
1++++=
jjx }1,1{ −+∈
DejNu =
0.4Pr
0.65Re28.0=Nu
jjCp=Pr
j
Dejvj=Re
Pc
AcDe
4=
0jU
jfRjBi =
Fig. 2 Nodes of PHEs
)1,1,1(,1,1,1
1,
njiT
njiT
njE
njiT
njD
njiT
njC
njiT
njB
njiT
njA +++++++=
+++
+
)1,1,1(n
jiTn
jiTnjF −+−++
z
tnjvjnn
jA∆
∆+= 1 ,
z
njiT
njvjnn
jB∆
∆−=
,1 ,
bnpjC
nj
tnjU
njvn
jF∆−
=1 ,
njF
njE
njB
njC −−= , n
jFnjE
njA
njD −−= ,
bnpjC
nj
tn
jjUnjvn
jE∆+
=1,
,
,
231
ScienceAsia 34 (2008)
www.scienceasia.org
all the parameters of each channel, A-F, were calculated. The consistency of the scheme applied here was tested by taking the limit of the finite difference equations as both time-step and grid-size tend to zero. These gave the original PDE. When applying equations to all ghost nodes and boundary conditions, the equations were arranged into a matrix equation, Ax = b. The inverse of matrix A was determined and it did not change with time, and hence the inverse matrix can be used for all time steps. The initial conditions (ICs) and boundary conditions (BCs) of the PHE systems depend on the internal flow arrangement.
We used the following simulation algorithm (Fig. 3). First of all, with a specified fluid flow rate and temperature at the inlets, a steady state temperature profile with no heat loss was calculated for all channels. Next, at the initial time set to zero, U under clean condition value of each plate (Uo
j) was assigned with U from the steady state. Then the calculation of the PHE thermal performance with fouling effects is ready to begin. Starting with the calculation of fouling resistance by solving a selected fouling model by using the Runge-Kutta method, with this value, the U model was then updated. The final step was the calculation of temperature profiles of the next time step using the proposed thermal dynamic model. The calculation continued until the
computational time reached a predefined value
Simulation case study PHE used in coconut milk pasteurization was employed as a case study. The plate properties are summarized in Table 1. The Nusselt numbers of the coconut milk side and the water side used the correlation of a flat straight passage23. The correlation in (12) was suggested for turbulent flow, and the channel velocity varies from 0.1 to 3 m/s.
Table 1. Plate properties, fluid properties and composition of coconut milk1,5
The fouling resistance values were substituted into the fouling model from Pichitvittayakarn’s experimental data1 as a function of time:
These case studies were used for two purposes. The first case was used to define a number of grid lines and the value of the time difference for simu-lation. Then, the simulation results were compared with the experimental data of Pichitvittayakarn1. The second case was used to select conditions for control-ling PHEs undergoing rapid fouling.
Case study 1There were two objectives for solving this case
study by the proposed algorithm. First, a group of dynamic simulated results were needed to identify a minimum number of grids and a maximum number of time intervals in which the simulated results can be reliable. Second, in order to verify the thermal models and simulation technique, the simulated results will be compared with the experimental results obtained by Pichitvittayakarn1.
The simulation of 3 channels (1 pass 1 channel of coconut milk counter current with 1 pass Fig. 3 Algorithm.
Plate Data Case Study 1 Case study 2 C omponent (s) Percent* (w/w)
Thermal conductivity (W/m K) 16.2 1 6.2 Water 70.57
Width (m) 0.085 0.205 Protein 2.99 Length (m) 0.3 0.785 Carbohydrate 1.97 Developed Area (m2) 0.0255 0.168 Fat 17.00 Hot gab (m) 0.016 0.00366 Cold gab (m) 0.002 0.00366 Calcium 0.0078 Thickness (m) 0.0006 0.0009 Iron 0.0006
Magnesium 0.0121 Case Study 1 Case Study 2 Phosphorus 0.0410
2 channels of hot water) was investigated (Fig. 4a). The conditions of the simulation were similar to that of Pichitwitayakan’s experiment1. ICs and BCs for this case study are as follows:
Fig. 4 PHE configurations: (a) Three-channel flow arrangement for case study 1, (b) Fifty-channel flow arrangement for case study 2.
Case study 2The objective of this case study was to find the
temperature and flow rate of hot water, which might be altered when the coconut milk outlet temperature was less than the acceptable temperature as a result of fouling effects. The constrained and unconstrained utility devices that served temperature and flow rate of the inlet hot water was investigated in this case (Fig. 5). The acceptable outlet coconut milk temperature was 74 °C while the set point of the coconut milk temperature was 74.5 °C.
The selected condition for changing parameters is the first condition that gives the highest outlet
temperature of coconut milk that is higher than the set-point temperature. This case study was separated into two sections.
Fluid properties at the inlet are shown in Table 1. ICs and BCs of this case are as follows:
where nGrid is the maximum number of grid lines.The selected condition for changing parameters
is the first condition that gives the highest outlet tem-perature of coconut milk that is higher than the set-point temperature. This case study was separated into two sections.
The first section involves unconditional device constraints. In this section, only either the temperature or the flow rate of the hot water was adjusted. The condition change was done twice. The first change was done after the PHEs were operated from the clean condition until the outlet coconut milk temperature was less than the acceptable value. The last change was done after the PHEs were operated from the first adjustment until the temperature was less than the acceptable temperature again.
The second section was calculated based on the limitations of the heater and pump. Maximum temperature and flow rate that the heater and pump could provide, were 92 °C and 8 x10⁻⁴ m3/s, respectively. In this case, the variation of only one parameter was not sufficient to bring the outlet coconut milk temperature to the set point. Then, adjusting one parameter to the maximum value simultaneously with the other parameter with the value obtained in the previous section was accomplished.
RESULTS AND DISCUSSION
Case study 1The convergence strongly depended on the
number of grid points. In general, the numerical scheme requires a small grid size to assure the convergence, but at the same time, a smaller grid size requires more computational time. To obtain the optimum number of grid points, the number of grid lines was varied from 10 to 100, with 10-grid line
P2
V1
V2
P1 V3
H1
T2
T1
HX1
Water 30 Co
Coconut milk 70 Co
Coconut milk outlet
Hot Water outlet
T1 Hot Water Tank for Heating Water T2 Coconut Milk Storage Tank P1 Hot Water Pump P2 Coconut Milk Pump H1 Immersion Electric Heater HX1 Plate Heat Exchanger V1 By Pass Value of Coconut Milk StreamV2 Coconut Milk Inlet Valve V3 Hot Water Inlet Valve
Coconut Milk
Hot Water
(a) (b)
Fig. 5 Flow diagram of case study 2.
inhotai TT =0, }3,1{},...1{ ∈∈ anGridi
incoldTbiT =0, 2},...1{ =∈ bnGridi (21)
(22)
(23)
+∈ In , }49...,7,5,3{∈x
incoldTn
T =2,0 +∈In, ,
,nxnGridT
nnGridT ,1, =
, , inhotT
nnGridT =1,
+∈ In (24)
(32)
,
, ,25
,0,
∑
=x
nxT
nouthT +
∈ In }49...,5,3,1{∈x ,
(20)inhTaiT ,
0, = , } { }49,...,5,3,1,...1 ∈∈ anGridi
incTbiT ,
0, = , { } { }50,...,6,4,2,...1 ∈∈ bnGridi ,
nnGridT
nnGridT 3,1, = , +
∈ In ,
incoldTn
T =2,0 , +∈ In ,
inhotTn
nGridT =1, , +∈ In ,
2
3,01,0,
nT
nTn
outhT+
= , +∈ In .
(14)
(15)
(16)
(17)
(18)
(19)
233
ScienceAsia 34 (2008)
www.scienceasia.org
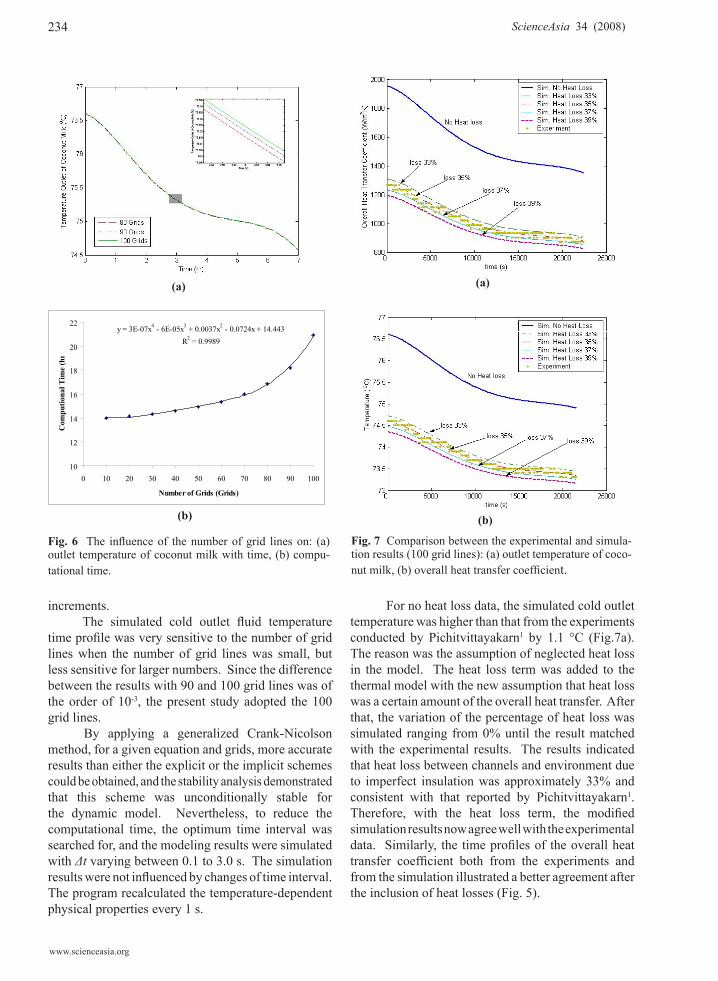
increments.The simulated cold outlet fluid temperature
time profile was very sensitive to the number of grid lines when the number of grid lines was small, but less sensitive for larger numbers. Since the difference between the results with 90 and 100 grid lines was of the order of 10-3, the present study adopted the 100 grid lines.
By applying a generalized Crank-Nicolson method, for a given equation and grids, more accurate results than either the explicit or the implicit schemes could be obtained, and the stability analysis demonstrated that this scheme was unconditionally stable for the dynamic model. Nevertheless, to reduce the computational time, the optimum time interval was searched for, and the modeling results were simulated with Δt varying between 0.1 to 3.0 s. The simulation results were not influenced by changes of time interval. The program recalculated the temperature-dependent physical properties every 1 s.
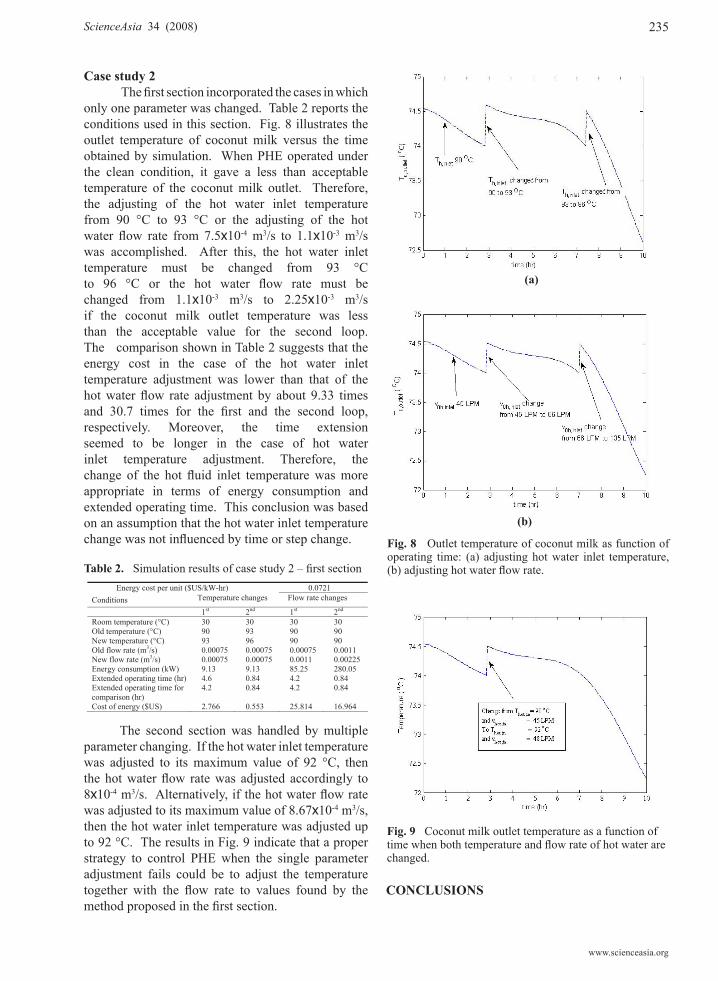
For no heat loss data, the simulated cold outlet temperature was higher than that from the experiments conducted by Pichitvittayakarn1 by 1.1 °C (Fig.7a). The reason was the assumption of neglected heat loss in the model. The heat loss term was added to the thermal model with the new assumption that heat loss was a certain amount of the overall heat transfer. After that, the variation of the percentage of heat loss was simulated ranging from 0% until the result matched with the experimental results. The results indicated that heat loss between channels and environment due to imperfect insulation was approximately 33% and consistent with that reported by Pichitvittayakarn1. Therefore, with the heat loss term, the modified simulation results now agree well with the experimental data. Similarly, the time profiles of the overall heat transfer coefficient both from the experiments and from the simulation illustrated a better agreement after the inclusion of heat losses (Fig. 5).
Fig. 6 The influence of the number of grid lines on: (a) outlet temperature of coconut milk with time, (b) compu-tational time.
Fig. 7 Comparison between the experimental and simula-tion results (100 grid lines): (a) outlet temperature of coco-nut milk, (b) overall heat transfer coefficient.
(a)
(b)
234
ScienceAsia 34 (2008)
www.scienceasia.org
Case study 2 The first section incorporated the cases in which
only one parameter was changed. Table 2 reports the conditions used in this section. Fig. 8 illustrates the outlet temperature of coconut milk versus the time obtained by simulation. When PHE operated under the clean condition, it gave a less than acceptable temperature of the coconut milk outlet. Therefore, the adjusting of the hot water inlet temperature from 90 °C to 93 °C or the adjusting of the hot water flow rate from 7.5x10⁻⁴ m3/s to 1.1x10⁻³ m3/s was accomplished. After this, the hot water inlet temperature must be changed from 93 °C to 96 °C or the hot water flow rate must be changed from 1.1x10⁻³ m3/s to 2.25x10⁻³ m3/s if the coconut milk outlet temperature was less than the acceptable value for the second loop. The comparison shown in Table 2 suggests that the energy cost in the case of the hot water inlet temperature adjustment was lower than that of the hot water flow rate adjustment by about 9.33 times and 30.7 times for the first and the second loop, respectively. Moreover, the time extension seemed to be longer in the case of hot water inlet temperature adjustment. Therefore, the change of the hot fluid inlet temperature was more appropriate in terms of energy consumption and extended operating time. This conclusion was based on an assumption that the hot water inlet temperature change was not influenced by time or step change.
The second section was handled by multiple parameter changing. If the hot water inlet temperature was adjusted to its maximum value of 92 °C, then the hot water flow rate was adjusted accordingly to 8x10⁻⁴ m3/s. Alternatively, if the hot water flow rate was adjusted to its maximum value of 8.67x10⁻⁴ m3/s, then the hot water inlet temperature was adjusted up to 92 °C. The results in Fig. 9 indicate that a proper strategy to control PHE when the single parameter adjustment fails could be to adjust the temperature together with the flow rate to values found by the method proposed in the first section.
CONCLUSIONS
Fig. 8 Outlet temperature of coconut milk as function of operating time: (a) adjusting hot water inlet temperature, (b) adjusting hot water flow rate.
(b)
(a)
Table 2. Simulation results of case study 2 – first section
Fig. 9 Coconut milk outlet temperature as a function of time when both temperature and flow rate of hot water are changed.
Energy cost per unit ($US/kW-hr) 0.0721 Conditions Temperature changes Flow rate changes
1st 2nd 1st 2nd
Room temperature (°C) 30 30 30 30 Old temperature (°C) 90 93 90 90 New temperature (°C) 93 96 90 90 Old flow rate (m3/s) 0.00075 0.00075 0.00075 0.0011 New flow rate (m3/s) 0.00075 0.00075 0.0011 0.00225 Energy consumption (kW) 9.13 9.13 85.25 280.05 Extended operating time (hr) 4.6 0.84 4.2 0.84 Extended operating time for 4.2 0.84 4.2 0.84 comparison (hr)Cost of energy ($US) 2.766 0.553 25.814 16.964
235
ScienceAsia 34 (2008)
www.scienceasia.org
In this study, a Crank-Nicolson finite difference scheme using central differencing and ghost nodes was used to solve the PDE modelling plate heat exchangers. This work focused on rapid fouling effects. The empirical fouling model based on the work of Pichitvittayakarn1 was used as an example of food fouling. The simulated results of the cold outlet temperature and the overall heat transfer coefficient time profiles agreed well with the experimental results of Pichitvittayakarn1. The proposed dynamic model and calculation algorithm were promising in simulating the thermal performance of PHEs undergoing rapid fouling. However, the reliability of the simulation relied strongly on the accuracy of the fouling models adopted. The algorithm presented in this work could also be used to identify the optimum control strategy for a PHE. Single- or multiple- parameter controlling pump and heater could be delivered to extend PHE operating time. The magnitude of tuning could also be investigated by our simulation method.
ACKNOWLEDGEMENTS
This work was supported by the Commission on Higher Education (CHE), Ministry of Education, Thailand, and the Thailand Research Fund (TRF), Thailand.
REFERENCES
Pichitvittayakarn W, Narataruksa P, Heggs PJ, 1. Tia S (2006) Monitoring and modeling of coconut milk fouling at pasteurization tempera-tures, MSc. thesis, KMUTT, Thailand.Gut JAW, Pinto M, Tandini C (2004) Thermal 2. model validation of plate heat exchangers with generalized. Chem. Eng. Sci. 59, 4589–98.Shah RK, Kandlikar SG (1988) The influence 3. of the number of thermal plates on plate heat exchanger performance.In: Current researches in heat and mass transfer, A compendium and a Festschrift for Professor Arcot Ramachandran, pp 267–88, Hemisphere, Washington, DC.Ngao-aram S (1996) Design methodology of 4. plate heat exchanger, MSc. thesis, UMIST, Manchester, UK.Narataruksa P (2000) Plate heat exchangers – 5. design, performance, and multistream, PhD thesis, UMIST, UK.
6. Ribeiro CP, Cano Andrade MH (2002) An
algorithm of steady state simulation of plate heat exchangers. J. Food Eng. 53, 59 – 66.
7. Gut JAW, Pinto M (2004) Optimal configura-tion design for plate heat exchangers. Int. J. Heat Mass Transfer 47, 4833–48.
8. Gut JAW, Pinto M (2004) Modeling of plate heat exchanger with generalized configurations. Int. J. Heat Mass Transfer 46, 2571–85.
9. Fernandes CS, Dias R, Nobrega JM, Afonso IM, Melo LF, Maia JM (2004) Simulation of stirred yoghurt processing in plate heat exchangers. J. Food Eng. 69, 281-90.
10. Frye PJ, Schreier PJR (1995) Heat exchanger fouling: A Model study of the scale up of labora-tory data. Chem. Eng. Sci. 50, 1311–21.
11. Delplace F, Leuliet JC (1995) Modeling fouling of a plate heat exchanger with different flow arrangements by whey protein solutions. Trans. IChemE. 73, 112–20.
12. Delplace F, Leuliet JC, Levieux D (1997) A reaction engineering approach to the analysis of fouling by whey proteins of six-channels-per-pass plate heat exchanger. J. Food Eng. 34, 91–108.
13. Grijspeerdi K, Hazarika B (2003) Application of computational fluid dynamic to mode the hydrodynamic of plate heat exchanger for milk processing. J. Food Eng. 57, 237–42.
14. Lakshmanan CC, Potter OE (1990) Dynamic simulation of plate heat exchanger. Int. J. Heat Mass Transfer 33, 995–1002.
15. Sharifi F, Narandji GMR, Mehravaran K (1997) Dynamic simulation of plate heat exchangers. Int. Commun. Heat Mass Transfer 22, 213–25.
16. Da SK, Murugesan K (2000) Transient response of multipass plate heat exchangers with axial thermal dispersion in fluid. Int. J. Heat Mass Transfer 43, 4327–45.
17. Das SK, Rao BP, Kumar PK (2002) Effect of flow distribution to the channel on the thermal performance of a plate heat exchanger. Chem. Eng. Process. 41, 49–58.
18. Geogiadis MC, Macchietto S (2000) Dynamic modeling and simulation of plate heat exchangers under milk fouling. Chem. Eng. Sci. 55, 1605–19.
19. Cooper A (1974) Recover more heat with plate heat exchangers. The Chemical Engineer. 285, 280–5.
20. Schreier PJR (1995) Monitoring and modeling of heat exchanger fouling, Ph.D. thesis. University of Cambridge, Cambridge, UK.


![Heat Exchanger Fouling and Cleaning - MODEL ...heatexchanger-fouling.com/papers/papers2019/32_Lozano F...Fouling rate is also traditionally (and incorrectly, see [13]) equated with](https://static.documents.pub/doc/80x56/5eda5de9b3745412b57139a0/heat-exchanger-fouling-and-cleaning-model-heatexchanger-f-fouling-rate.jpg)


