Dynamic study of blood–brain barrier closure after its disruption using ultrasound: a quantitative analysis Benjamin Marty 1 , Benoit Larrat 1,2 , Maxime Van Landeghem 3 , Caroline Robic 4 , Philippe Robert 4 , Marc Port 4 , Denis Le Bihan 1 , Mathieu Pernot 2 , Mickael Tanter 2 , Franck Lethimonnier 1 and Se ´bastien Me ´riaux 1 1 NeuroSpin, I 2 BM, Commissariat a ` l’E ´ nergie Atomique, Gif-sur-Yvette, France; 2 Institut Langevin, ESPCI ParisTech, CNRS UMR 7587, INSERM U979, Paris, France; 3 PPMD, ESPCI ParisTech, CNRS UMR 7615, Paris, France; 4 Guerbet Research Division, Roissy-Charles de Gaulle, France Delivery of therapeutic or diagnostic agents to the brain is majorly hindered by the blood–brain barrier (BBB). Recently, many studies have demonstrated local and transient disruption of the BBB using low power ultrasound sonication combined with intravascular microbubbles. However, BBB opening and closure mechanisms are poorly understood, especially the maximum gap that may be safely generated between endothelial cells and the duration of opening of the BBB. Here, we studied BBB opening and closure under magnetic resonance (MR) guidance in a rat model. First, MR contrast agents (CA) of different hydrodynamic diameters (1 to 65nm) were employed to estimate the largest molecular size permissible across the cerebral tissues. Second, to estimate the duration of the BBB opening, the CA were injected at various times post-BBB disruption (12 minutes to 24 hours). A T 1 mapping strategy was developed to assess CA concentration at the ultrasound (US) focal point. Based on our experimental data and BBB closure modeling, a calibration curve was obtained to compute the half closure time as a function of CA hydrodynamic diameter. These findings and the model provide an invaluable basis for optimal design and delivery of nanoparticles to the brain. Journal of Cerebral Blood Flow & Metabolism (2012) 32, 1948–1958; doi:10.1038/jcbfm.2012.100; published online 18 July 2012 Keywords: BBB disruption; MR contrast agent; MRI; nanoparticles; T 1 mapping; ultrasound Introduction Cerebral tissues are isolated from circulating blood by the blood–brain barrier (BBB) (Rubin and Staddon, 1999). This physiological barrier consists of a lining of tightly packed vascular endothelial cells, different from the peripheral blood vessels (Hawkins and Davis, 2005). The tight junctions between these cells restrict the diffusion of microscopic objects (e.g., bacteria) and of large, hydrophilic molecules ( > 400 Da) from blood to brain parenchyma, while allowing the passage of small, hydrophobic molecules such as O 2 , CO 2 , proteins, and metabolites (Pardridge, 2005). Because of the neuroprotective nature of the BBB, delivery of potentially important diagnostic and therapeutic agents is a major challenge in the treatment of most brain disorders. Strategies to design specific drugs targeted to the brain involve finding an efficient mode of drug delivery across the BBB. Recently, it has been demonstrated that the use of low power focused ultrasound combined with a systemic injection of lipid- (or polymer-) shelled microbubbles enables a noninvasive, local and transi- ent disruption of the BBB (Hynynen et al, 2001). Many studies were then carried out to (1) establish optimal ultrasound parameters that permit adequate tissular penetration without causing tissue damage (Choi et al, 2006; Hynynen et al, 2005; O’Reilly et al, 2010, 2011a, b; Sheikov et al, 2008), (2) quantify permeability of the disrupted brain tissue (Vlachos et al, 2010, 2011), and (3) evaluate responses to treatments of particular brain disorders including tumors (Chen et al, 2010; Liu et al, 2010; Treat et al, 2008) and Alzheimer’s disease (Jordao et al, 2010; Raymond et al, 2008). Most of these studies used magnetic resonance contrast agents (MR-CA) for monitoring the processes. Despite a rapidly growing number of studies, the mechanism of ultrasound-induced BBB opening is understood only poorly. In particular, the maximum space that can be safely generated (ensuring reversi- bility) between endothelial cells, and the duration for Received 7 March 2012; revised 15 May 2012; accepted 11 June 2012; published online 18 July 2012 Correspondence: S Me ´riaux, PhD, CEA Saclay, DSV/I 2 BM/Neuro- Spin, Ba ˆtiment 145—Point courrier 156, 91191 Gif-Sur-Yvette Cedex, France. E-mail: [email protected]This study was supported by Iseult/Inumac French-German project. Journal of Cerebral Blood Flow & Metabolism (2012) 32, 1948–1958 & 2012 ISCBFM All rights reserved 0271-678X/12 $32.00 www.jcbfm.com
Transcript
Dynamic study of blood–brain barrier closureafter its disruption using ultrasound:a quantitative analysis
Benjamin Marty1, Benoit Larrat1,2, Maxime Van Landeghem3, Caroline Robic4,Philippe Robert4, Marc Port4, Denis Le Bihan1, Mathieu Pernot2, Mickael Tanter2,Franck Lethimonnier1 and Sebastien Meriaux1
1NeuroSpin, I2BM, Commissariat a l’Energie Atomique, Gif-sur-Yvette, France; 2Institut Langevin,ESPCI ParisTech, CNRS UMR 7587, INSERM U979, Paris, France; 3PPMD, ESPCI ParisTech,CNRS UMR 7615, Paris, France; 4Guerbet Research Division, Roissy-Charles de Gaulle, France
Delivery of therapeutic or diagnostic agents to the brain is majorly hindered by the blood–brainbarrier (BBB). Recently, many studies have demonstrated local and transient disruption of the BBBusing low power ultrasound sonication combined with intravascular microbubbles. However, BBBopening and closure mechanisms are poorly understood, especially the maximum gap that may besafely generated between endothelial cells and the duration of opening of the BBB. Here, we studiedBBB opening and closure under magnetic resonance (MR) guidance in a rat model. First, MR contrastagents (CA) of different hydrodynamic diameters (1 to 65 nm) were employed to estimate the largestmolecular size permissible across the cerebral tissues. Second, to estimate the duration of the BBBopening, the CA were injected at various times post-BBB disruption (12 minutes to 24 hours). A T1
mapping strategy was developed to assess CA concentration at the ultrasound (US) focal point.Based on our experimental data and BBB closure modeling, a calibration curve was obtained tocompute the half closure time as a function of CA hydrodynamic diameter. These findings and themodel provide an invaluable basis for optimal design and delivery of nanoparticles to the brain.Journal of Cerebral Blood Flow & Metabolism (2012) 32, 1948–1958; doi:10.1038/jcbfm.2012.100; published online18 July 2012
Cerebral tissues are isolated from circulating blood bythe blood–brain barrier (BBB) (Rubin and Staddon,1999). This physiological barrier consists of a lining oftightly packed vascular endothelial cells, different fromthe peripheral blood vessels (Hawkins and Davis,2005). The tight junctions between these cells restrictthe diffusion of microscopic objects (e.g., bacteria) andof large, hydrophilic molecules ( > 400 Da) from bloodto brain parenchyma, while allowing the passage ofsmall, hydrophobic molecules such as O2, CO2,proteins, and metabolites (Pardridge, 2005). Becauseof the neuroprotective nature of the BBB, delivery ofpotentially important diagnostic and therapeuticagents is a major challenge in the treatment of mostbrain disorders. Strategies to design specific drugs
targeted to the brain involve finding an efficient modeof drug delivery across the BBB.
Recently, it has been demonstrated that the use oflow power focused ultrasound combined with asystemic injection of lipid- (or polymer-) shelledmicrobubbles enables a noninvasive, local and transi-ent disruption of the BBB (Hynynen et al, 2001). Manystudies were then carried out to (1) establish optimalultrasound parameters that permit adequate tissularpenetration without causing tissue damage (Choi et al,2006; Hynynen et al, 2005; O’Reilly et al, 2010,2011a, b; Sheikov et al, 2008), (2) quantify permeabilityof the disrupted brain tissue (Vlachos et al, 2010, 2011),and (3) evaluate responses to treatments of particularbrain disorders including tumors (Chen et al, 2010; Liuet al, 2010; Treat et al, 2008) and Alzheimer’s disease(Jordao et al, 2010; Raymond et al, 2008). Most ofthese studies used magnetic resonance contrast agents(MR-CA) for monitoring the processes.
Despite a rapidly growing number of studies, themechanism of ultrasound-induced BBB opening isunderstood only poorly. In particular, the maximumspace that can be safely generated (ensuring reversi-bility) between endothelial cells, and the duration for
Received 7 March 2012; revised 15 May 2012; accepted 11 June2012; published online 18 July 2012
Correspondence: S Meriaux, PhD, CEA Saclay, DSV/I2BM/Neuro-Spin, Batiment 145—Point courrier 156, 91191 Gif-Sur-YvetteCedex, France.E-mail: [email protected]
This study was supported by Iseult/Inumac French-German project.
Journal of Cerebral Blood Flow & Metabolism (2012) 32, 1948–1958& 2012 ISCBFM All rights reserved 0271-678X/12 $32.00
which this opening lasts, have not been measured.The knowledge of these parameters is crucial for thecurrent development of brain targeted nanoparticles.Functionalized MR-CA for instance, are available in awide range of hydrodynamic diameters: gadolinium(Gd) chelates, a few nm (Wadghiri et al, 2003), ironnanoparticles, 25 to 100 nm (Mendonca Dias andLauterbur, 1986; Renshaw et al, 1986), gadolinium-based emulsions or liposomes, 200 to 300 nm (De-voisselle et al, 1988), and have very different vascularremanences, ranging from a few minutes to tens ofhours. An estimate of the time window during whicha molecule of a given size may be delivered across theBBB would be useful to monitor the amount of drugreleased to cerebral tissue and to adjust the dosage.For example, it has been shown that 3 to 8 nm wideparticles are able to cross BBB 20 minutes after itsultrasound-induced disruption, but not particles ofsize 50 nm (Choi et al, 2010). Additionally, as thebrain is unprotected while the BBB is open, it isimportant to know the time-to-recovery to limit anypossible brain damages induced by tissular penetra-tion of pathogenic agents.
The quantification of the amount of MR-CA cross-ing the BBB requires development of molecularimaging sequences via imaging techniques that aresensitive (high-field magnetic resonance imaging(MRI)) and provide outputs that can be correlatedwith the MR-CA concentration. Contrast agent quan-tification is one of the principal challenges for MRmolecular imaging. Unlike other techniques such asfluorescence or nuclear imaging where the receivedsignal comes directly from the CA, MR signal comesfrom the surrounding water protons and is thereforeindirectly related to the presence of an exogenousprobe. To quantify the CA concentration using MRI, itis necessary to model its interaction with thesurrounding water molecules. Paramagnetic com-plexes interact with the surrounding water protonsby decreasing their relaxation times (Swift andConnick, 1962). Contrast agent concentration can belinked to the T1 or T2 relaxation time decrease (inmilliseconds). Here, we adapted a T1 mappingsequence proposed by Deichmann and Haase (1992)and Deichmann et al (1999) that permitted estimationof a wide range of T1 values with a good accuracy, andhigh spatial and temporal resolutions.
In this study, a calibrated BBB opening procedurewas performed in healthy young adult rats under MRguidance. Five MR-CA were used (three paramagneticand two superparamagnetic) with different hydro-dynamic diameters (from 1 to 65 nm) to investigatethe maximum permissible size of the gaps induced inthe endothelial wall under safe conditions. Then,using the T1 mapping strategy for the three para-magnetic CA, we quantified the amount of particlescrossing the BBB when injected at different timesafter ultrasound-induced BBB disruption. This en-abled quantitative monitoring of the dynamics of BBBclosure for each given molecular size. Lastly, wepresent a theoretical model to fit the experimental
data and derive a calibration curve to predictduration of BBB opening as a function of thehydrodynamic diameter of a given CA.
Materials and methods
Animal Preparation
All experiments were performed in accordance with therecommendations of the European Community (86/609/EEC) and the French legislation (decree no. 87/848) for useand care of laboratory animals. This study has beenapproved by the Comite d’EThique en ExperimentationAnimale du Commissariat a l’Energie Atomique et auxenergies alternatives Direction des Sciences du Vivant Ilede France (CETEA CEA DSV IdF) under protocol ID 12_009.A total of 47 Sprague Dawley male rats (80 to 100 g, Janvier,Le Genest-Saint-Isle, France) were used. Their head wasshaved to ensure proper coupling of the ultrasound beam tothe brain. Rats were anesthetized with 1.5% isoflurane in amixture of air and oxygen, and placed in a cradle in proneposition. A catheter (25 G needle) was positioned in thecaudal vein to inject microbubbles and MR-CA from outsidethe scanner with minimal dead volume. Ten percentheparin was added to all injected solutions to avoid clotformation in the catheter. Body temperature and respirationrate were continuously monitored during the experiments.
Magnetic Resonance Contrast Agents
Magnetic resonance contrast agents of different hydrody-namic diameters were provided by Guerbet Research (Roissy-Charles de Gaulle, France). Main characteristics and injecteddoses of these nanoparticles are summarized in Table 1. Aftereach MR-CA injection, the bolus was flushed by injection of100mL of saline solution. Three of the five MR-CA wereparamagnetic Gd-chelates (Dotarem, P846, and P792) andwere detected and quantified using T1 strategies (Kang et al,2010; Protti et al, 2010; Yankeelov et al, 2006). The other twoCA (P904 and P03680) were ultrasmall superparamagneticiron oxide (USPIO) nanoparticles. A T2-weighted sequencewas use to detect them in cerebral tissues (Hyodo et al, 2009;Philippens et al, 2004). Longitudinal r1 and transverse r2
relaxivities were measured in vitro at 7 T using galleries oftubes containing different concentrations of CA diluted in a0.3% agar matrix, and maintained at 37 1C. For Gd-chelates,relaxivity values are in good agreement with those found inthe literature (Fries et al, 2009).
Ultrasound Equipment
A MR-compatible focalized transducer (central frequency1.5 MHz, diameter 30 mm, focal depth 20 mm, Imasonic,Voray sur I’Ognon, France) driven by a programmablefunction generator was used to produce ultrasound waves.It was coupled to the rat skull using a latex balloon filledwith deionized and degassed water. Electrical power sent tothe transducer was monitored during the BBB openingsession. Main characteristics of the transducer (focal pointsize 0.6� 0.6� 3 mm3, transcranial acoustic transmission
Study of BBB closure after US-induced disruptionB Marty et al
1949
Journal of Cerebral Blood Flow & Metabolism (2012) 32, 1948–1958
factor 52%±5%) were estimated in a previous study (Larratet al, 2010).
Blood–Brain Barrier Opening
Blood–brain barrier disruption was performed during MRimaging session thanks to a dedicated holder maintainingthe ultrasound transducer above rat head. Its position wasmonitored using an ARFI (acoustic radiation force imaging)sequence and the right thalamus in the brain was chosen asa target for BBB disruption. Sonovue microbubbles(Bracco, Milan, Italy) were administrated via a bolus(1.5� 108 bubbles/mL, 200mL, 2 seconds) B5 secondsbefore the beginning of ultrasound session. The bolus wasflushed by injection of 100mL of saline solution. Sonicationwas performed with 3 milliseconds bursts every 100 milli-seconds for 1 minute (Choi et al, 2011). The peak-negativeacoustic pressure at the ultrasound focal point wascalibrated to 0.45 MPa, a level sufficiently low to ensuresafe and reversible BBB opening (Larrat et al, 2011; Chopraet al, 2010). Anatomical images were acquired at the end ofeach MRI session to verify integrity of the brain tissues.
Magnetic Resonance Imaging Acquisitions
Magnetic resonance imaging was performed on a 7 T/90 mm Pharmascan scanner (Bruker, Ettlingen, Germany).A saddle coil was specially designed in-house for excita-tion and signal reception. The geometry and size of theresonator (diameter 30 mm) were optimized to maximizethe overall signal-to-noise ratio over the whole brain whileallowing the ultrasound beam to propagate from thetransducer to the rat brain.
A multislice spin-echo sequence was modified toinclude additional motion-sensitizing gradients, and syn-chronized to ultrasonic bursts so that the phase signal wasproportional to local acoustic intensity (Larrat et al, 2010;McDannold and Maier, 2008). This ARFI sequencewas acquired with the following parameters: TE (echotime)/TR (repetition time) = 40/1,700 milliseconds, Tacq = 4minutes, R = 0.5� 0.5� 1 mm3, duration of the motionencoding gradients = 13.3 milliseconds, duration of thesonication = 3 milliseconds.
A high spatial resolution T2-weighted rapid acquisitionwith refocused echoes (RARE) sequence (TEeff/TR =
32/4,200 milliseconds, R = 0.125� 0.125� 0.3 mm3) wasused to detect the presence of USPIOs, and also foracquiring images at the end of every experiment to confirmlack of hemorrhages or edema due to ultrasound. T1-weighted multi-slice multi-echo (MSME) sequence (TE/TR = 8/300 milliseconds, R = 0.25� 0.25� 1 mm3) was ac-quired to detect paramagnetic Gd-chelates.
To measure concentration of Gd-chelates, a T1 mappingsequence was acquired before and after MR-CA injection. Itconsisted in a segmented series of FGE (fast gradient echo)images acquired at different time points after magnetizationinversion to follow the entire T1 recovery curve (Deichmannand Haase, 1992; Deichmann et al, 1999). Sequenceparameters were: TR1 = 5 milliseconds, TE = 2.5 milliseconds,6 segments, 60 inversion times (from 64 to 5,800 milli-seconds), flip angle = 51, and R = 0.2� 0.2� 1 mm3. Repeti-tion time between the acquisitions of two segments, TR2, was9 seconds, and total acquisition time was 12.5 minutes.A centric encoding of the k-space was chosen to avoid T2
effects during echo trains at the acquisition of central lines.
Data Analysis
Data were analyzed using dedicated codes written inMatlab software (MathWorks, Natick, MA, USA). Maps ofacoustic pressure index (IPac) were deduced from ARFIsequence using the following equation:
where jON (respectively jOFF) is the phase of ARFI signalacquired with ultrasound (respectively without ultra-sound), and Pth is the expected acoustic pressure at thefocal point in case of an ideal ultrasound coupling. In aprevious study (Larrat et al, 2010), we verified the linearitybetween acoustic intensity and MR-ARFI phase signalusing the same setup. In another study (Larrat et al, 2011),we also characterized and verified the linearity betweenacoustic pressure and the amount of MR-CA crossing theBBB in the range of acoustic pressure values applied here.
To generate T1 maps, the MRI signal measured with theFGE sequence was fitted as a function of the inversion timepixel by pixel as proposed by Deichmann and colleagues.Magnetic resonance contrast agents concentration maps (C)were then calculated from the T1,0 map before MR-CA
Table 1 Principal features of the paramagnetic and superparamagnetic nanoparticle contrast agents (CA) used in this study
MR, magnetic resonance.Hydrodynamic diameters (dH) were measured by light scattering, longitudinal (r1) and transverse (r2) relaxivities were estimated at 7 T in 0.3% agar gelsmaintained at 37 1C, vascular remanences were taken from literature (Fries et al, 2009), and diffusion coefficients in brain parenchyma were estimated in aprevious work (Marty et al, 2010). The paramagnetic CA were imaged using T1w/T1 mapping sequences, while the superparamagnetic using T2w sequences.
Study of BBB closure after US-induced disruptionB Marty et al
1950
Journal of Cerebral Blood Flow & Metabolism (2012) 32, 1948–1958
injection and the T1 maps after MR-CA injection using thefollowing equation (Swift and Connick, 1962), consideringthat relaxivities r1 measured in vitro in agar matrix hardlydiffer from the ones in rat brain tissues:
C ¼ 1
r1
1
T1� 1
T1;0
� �ð2Þ
Signals from different manually drawn ROIs (regions ofinterest) were analyzed. A ROIspot of 0.6� 0.6� 3 mm3
corresponding to the transducer focal point size was drawnin the right thalamus. To analyze the effect of BBBdisruption, a similar ROIcontra was taken in the correspond-ing contralateral (left thalamus) region of the brain. Thisenabled correction for the residual vascular concentrationof MR-CA during imaging. Another control ROI was drawnin an extracerebral region in the cheek muscles (ROImuscle).For each rat, a corrected MR-CA concentration at the focalpoint (C* without unit) was calculated as given below,based on the concentration measured at the ROIspot
(CROIspot), that at the control spots (CROIcontra and CROImuscle),and the index of deposited acoustic pressure (IPac):
C� ¼ CROIspot � CROIcontra
CROImuscle:IPacð3Þ
This processing step was mandatory to ensure thecorrection of the bias introduced by unequal injectedvolumes (unequal plasmatic concentrations) and the biasintroduced by variations in acoustic wave penetrationthrough the skull. These corrections allowed comparingMR-CA concentrations among animals.
Results
Low Power, Pulsed Ultrasound for LocalizedDisruption of Blood–Brain Barrier
In a rat model, BBB was opened transiently with theuse of ultrasound, immediately followed by intrave-nous injection of Dotarem (Gd-chelate) and measure-ment of the amount of the MR-CA delivered across the
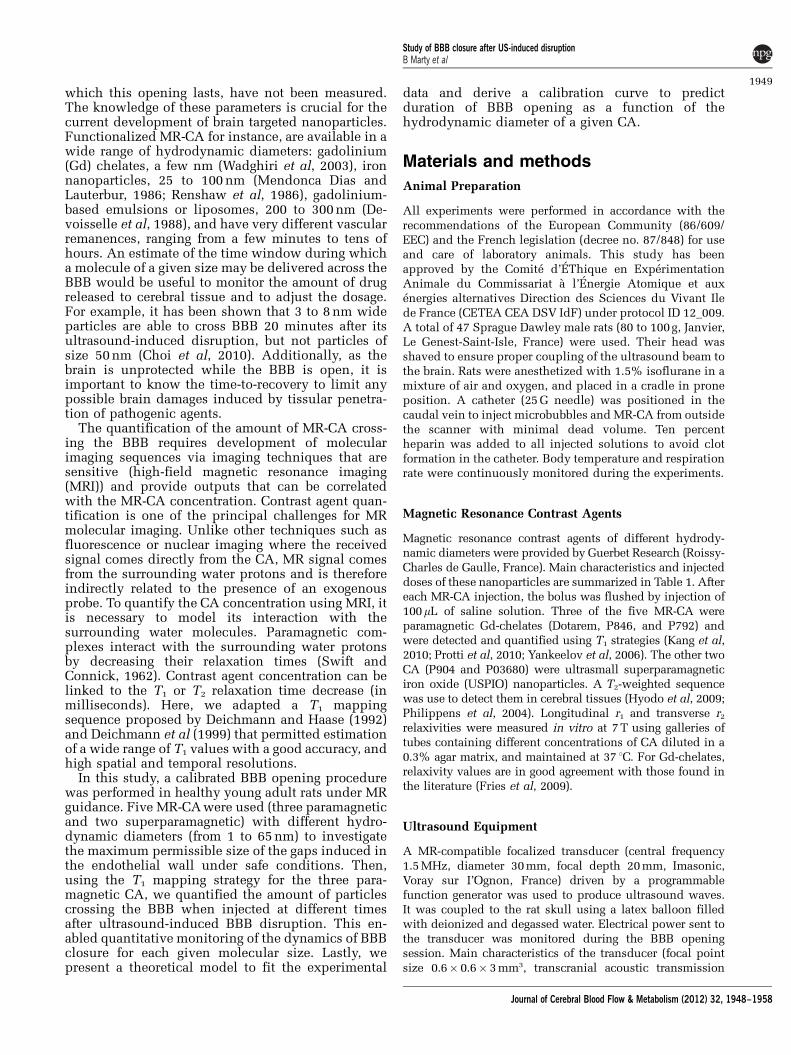
BBB (Figure 1). Before the ultrasound sonication,ARFI was performed to obtain the acoustic pressuremap in the brain (Figure 1A). This sequence was usedto verify that the ultrasound beam was focused at thedesired point in the right thalamus, and to estimatethe acoustic pressure at this focal point beforemicrobubbles injection, ensuring that the acousticpressure remains below a predetermined safetythreshold (Chopra et al, 2010; Larrat et al, 2011).Once the transducer was set at the desired position,Sonovue microbubbles were injected intravenouslyvia a catheter positioned in the caudal vein, and theBBB was disrupted by pulsed sonication for 1 minute.Dotarem was then injected using the same catheter. Tomeasure the concentration of Dotarem delivered, T1
maps were acquired before and after MR-CA injection(Figure 1B). There was high tissue perfusion of the CA(strong T1 decrease) in the cheek and neck muscles,but not in the brain tissue due to the BBB. Asexpected, the ultrasound focal point (purple arrow)was the only area of the brain exhibiting a strongT1 decrease indicating BBB disruption. Based onT1 mapping, CA concentration was obtained at thethree selected ROIs: ultrasound focal point, ROIspot
(n11), a control region contralateral to the ultrasoundfocal point, ROIcontra (n12) and a region in cheekmuscles ROIcheeks (n13) (Figure 1C).
Maximum Gap Between Endothelial Cells AfterReversible Ultrasound-Induced Disruption of theBlood–Brain Barrier
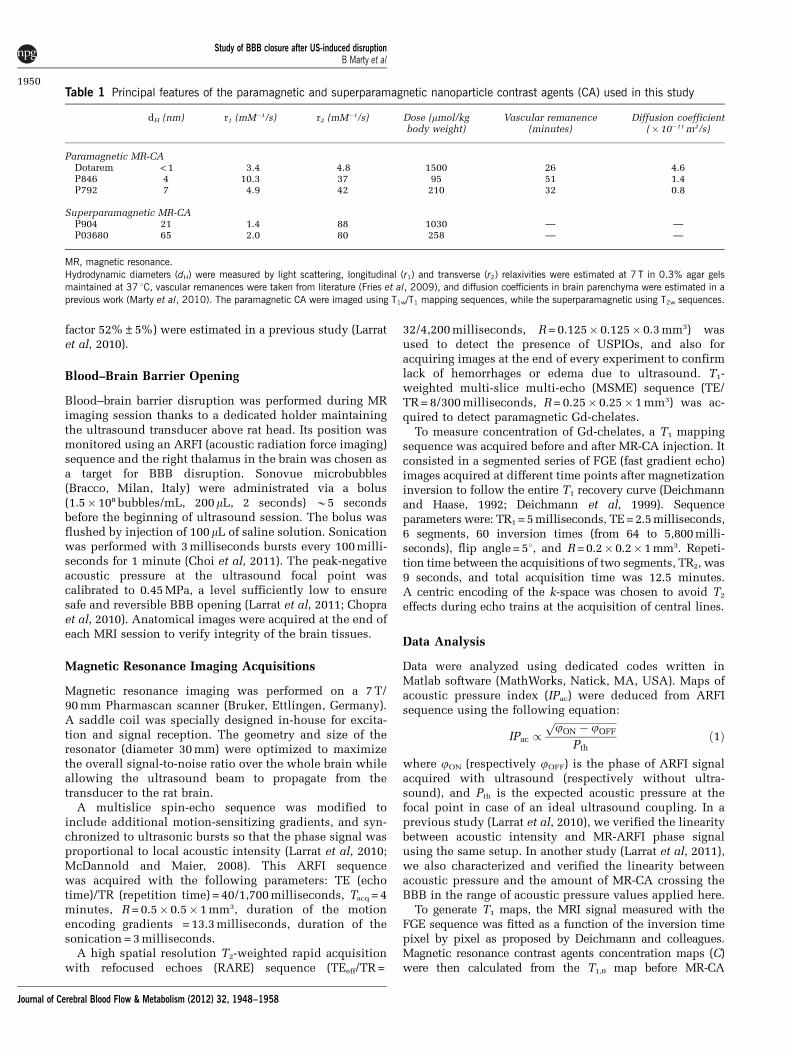
To determine the size of gaps generated afterultrasound-induced disruption of the BBB, we chosefive different MR-CA of varying hydrodynamicdiameters (Table 1) and verified their passage acrossBBB at the ultrasound focal point. The CA wereintravenously injected (n = 4 rats for Gd-chelates andn = 2 for iron oxide nanoparticles) directly afterultrasound-induced BBB disruption. T1-weighted
Figure 1 Different steps of magnetic resonance imaging (MRI)-guided ultrasound-induced disruption of blood–brain barrier (BBB).BBB disruption was achieved by intravenous injection of microbubbles via a catheter in the tail vein, in conjunction with transcranialultrasound sonication. This was followed by injection of MRI contrast agent (CA) via the same catheter. The entire procedure wasperformed inside a 7 T MRI scanner. (A) Index of deposited acoustic pressure map derived from acoustic radiation force imaging(ARFI) images acquired before injection of microbubbles revealed the ultrasound focal point. (B) T1 maps (in milliseconds) acquiredbefore (Baseline) and after MR-CA injection. (C) MR-CA concentration map (in mM) derived from corresponding T1 maps.Concentrations from three regions of interest (ROIs) were analyzed: ultrasound focal point (n11), contralateral control region (n12),and extracerebral control region in the cheek muscles (n13).
Study of BBB closure after US-induced disruptionB Marty et al
1951
Journal of Cerebral Blood Flow & Metabolism (2012) 32, 1948–1958
(T1w) images were obtained for the three paramag-netic CA and T2-weighted (T2w) images for the twoUSPIO CA (Figure 2). For all three Gd-chelates, apositive contrast was clearly visible on T1w images atthe ultrasound focal point, revealing the presence ofthe CA. Student’s t-test performed on the measuredMR signals confirmed that for each CA the differencebetween mean signals in ROIspot and in ROIcontra wassignificant (P < 0.01). For the 25-nm USPIO, anegative contrast appeared on T2w images after itsinjection, suggesting that BBB was permeable tomolecules of this size. Signal differences withcontralateral region were also significant (P < 0.01).However, the largest USPIO (65 nm) was detectedonly at the very focal point of the transducer as itspenetration was significantly hindered comparedwith the smaller USPIO. The signal differencesbetween ROIspot and ROIcontra for this USPIO werenot significant (P > 0.01) if the ROI was of thestandard size (0.6� 0.6� 3 mm3), but the differencesbecame significant (P < 0.01) if the size of the ROIspot
was decreased to 0.2� 0.2� 1 mm3 around the focalpoint. These results suggest that 65 nm is close to themaximal gap between endothelial cells that isattainable after BBB disruption with this protocol.
Quantification of Magnetic Resonance Contrast AgentConcentration
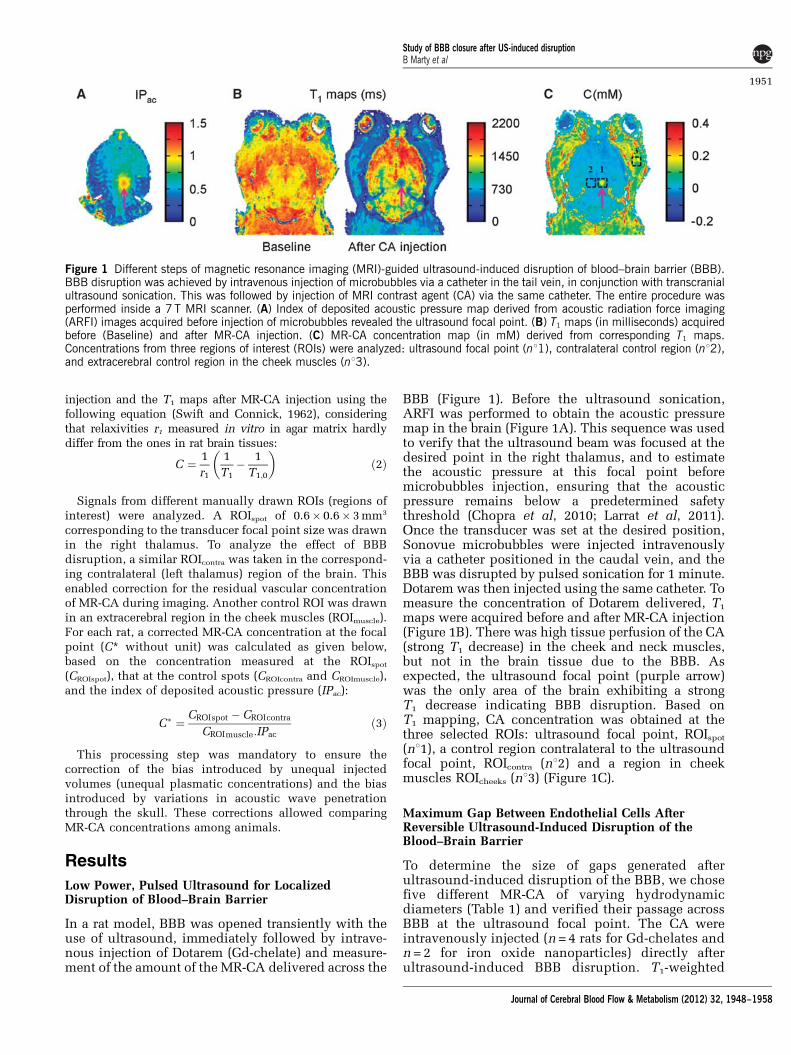
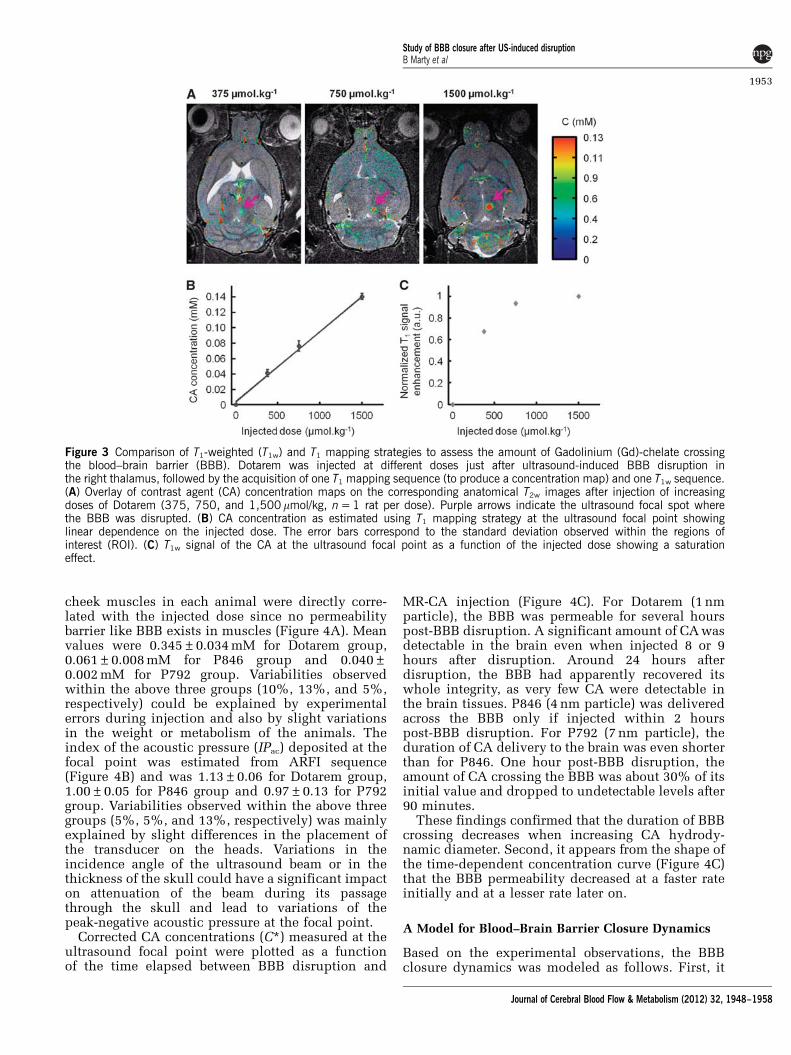
Rats were injected with Dotarem at increasing doses(375, 750, and 1,500mmol/kg, n = 1 rat per dose)
following BBB disruption. Concentration mapsacquired by T1 mapping were overlaid on theanatomical T2w images (Figure 3A). Additionally, aT1-weighted MSME sequence was also acquired. Theestimated CA concentration at the ultrasound focalpoint was found to be proportional to the injecteddose (C375 < C750 < C1500) (Figure 3B). In contrast, theT1w signals did not exhibit the same behavior andeven saturated at high CA injected doses (Figure 3C).These observations confirm the high interest of ourprotocol to precisely quantify small variations of CAconcentration, and that quantitative analysis based onT1w signals alone can be misleading. Hence, resultspresented in the following sections of this study wereall derived from quantitative data obtained using theT1 mapping sequence (equation (3)).
Quantitative Study of Blood–Brain Barrier ClosureDynamics
The BBB closure dynamics was assessed usingparamagnetic CA of different molecular sizes, admi-nistrated at different times after ultrasound-induceddisruption. Rats were injected with the followingCA: Dotarem (n = 10 rats), P846 (n = 10 rats), andP792 (n = 8 rats) from 0 to 24 hours after ultrasoundsonication. The reproducibility of CA delivery wasverified by measuring both the injected dose and theacoustic power deposited at the ultrasound focalpoint. Contrast agent concentrations measured in the
Figure 2 Ultrasound-induced localized delivery in rat brain of magnetic resonance imaging (MRI) contrast agents (CA) with differenthydrodynamic diameters. Paramagnetic CA (Dotarem, P846 and P792) or ultrasmall superparamagnetic iron oxide (USPIO) CA(P904 and P03680) were injected in rats immediately after ultrasound-induced blood–brain barrier (BBB) disruption, and the signalintensities were measured within 5 minutes at the ultrasound focal point. T1w images of the paramagnetic CA (A–C) revealed apositive contrast, while T2w images of the USPIO revealed a negative contrast (D, E). Comparison of the signal enhancement inarbitrary units (a.u.) in the region of interest of ultrasound focal point (ROIspot, n11) and that in the control contralateral region(ROIcontra, n12) is given next to the scan corresponding to each CA (n = 1 rat for each CA). The error bars correspond to the standarddeviation observed within each ROI. Differences between the two regions were considered significant for P values < 0.01 (*) using aStudent’s t-test. ROI, region of interest.
Study of BBB closure after US-induced disruptionB Marty et al
1952
Journal of Cerebral Blood Flow & Metabolism (2012) 32, 1948–1958
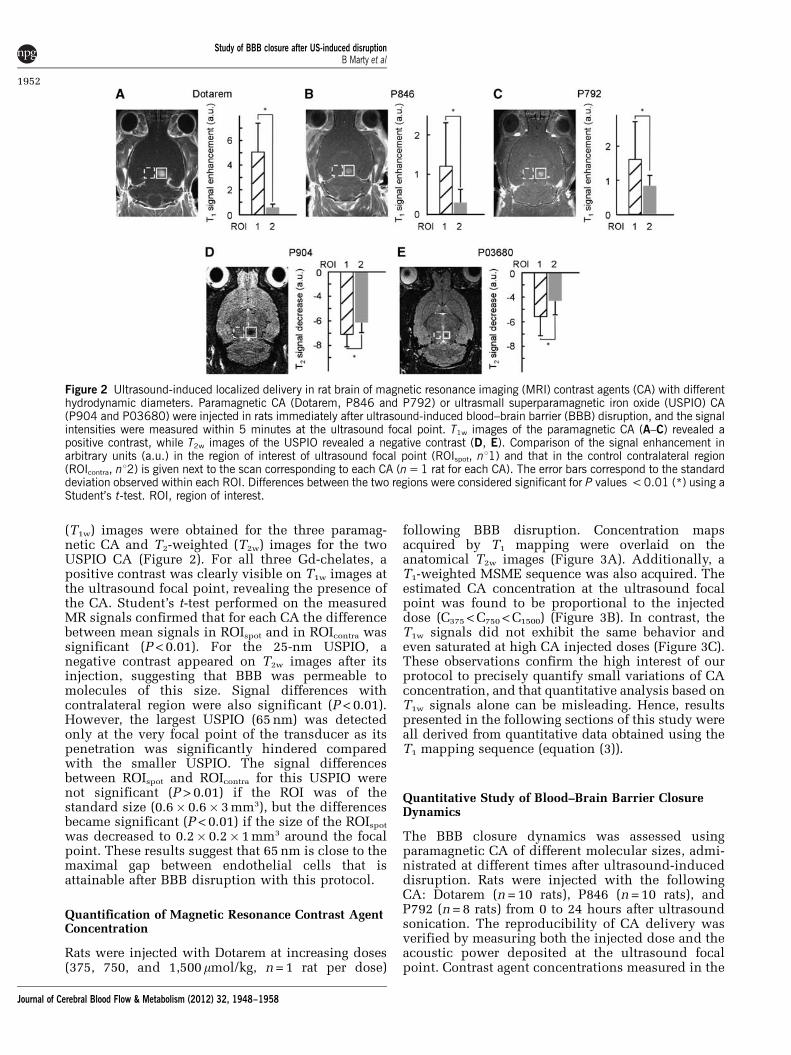
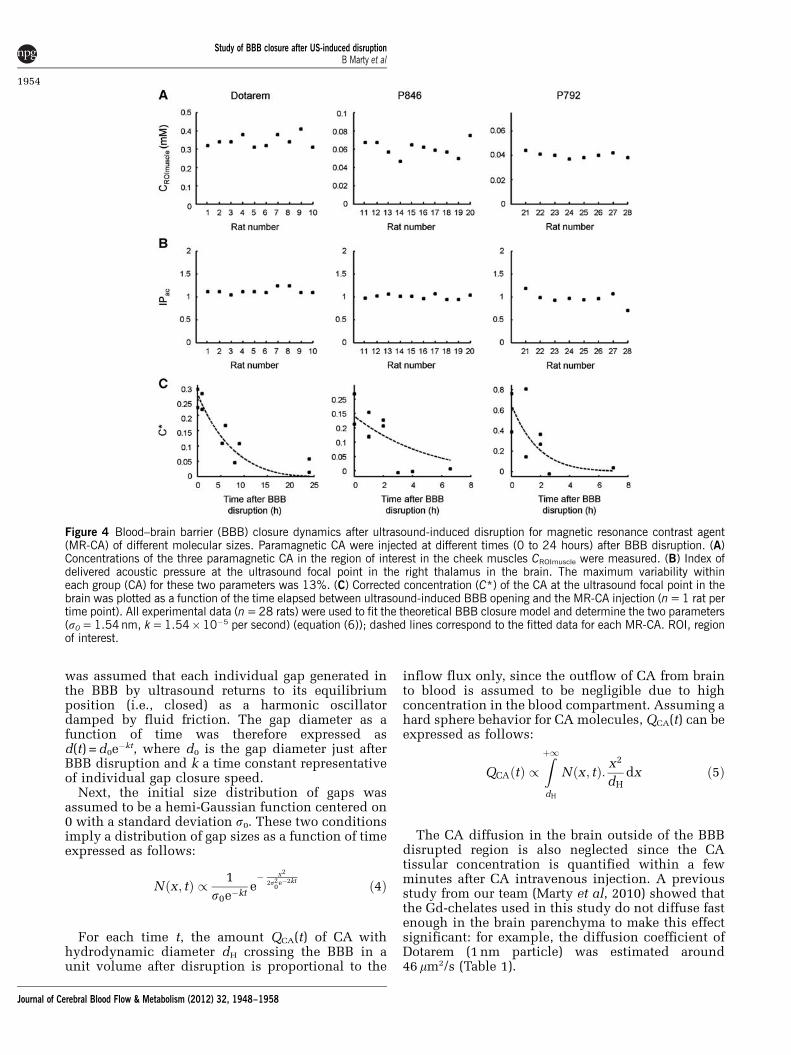
cheek muscles in each animal were directly corre-lated with the injected dose since no permeabilitybarrier like BBB exists in muscles (Figure 4A). Meanvalues were 0.345±0.034 mM for Dotarem group,0.061±0.008 mM for P846 group and 0.040±0.002 mM for P792 group. Variabilities observedwithin the above three groups (10%, 13%, and 5%,respectively) could be explained by experimentalerrors during injection and also by slight variationsin the weight or metabolism of the animals. Theindex of the acoustic pressure (IPac) deposited at thefocal point was estimated from ARFI sequence(Figure 4B) and was 1.13±0.06 for Dotarem group,1.00±0.05 for P846 group and 0.97±0.13 for P792group. Variabilities observed within the above threegroups (5%, 5%, and 13%, respectively) was mainlyexplained by slight differences in the placement ofthe transducer on the heads. Variations in theincidence angle of the ultrasound beam or in thethickness of the skull could have a significant impacton attenuation of the beam during its passagethrough the skull and lead to variations of thepeak-negative acoustic pressure at the focal point.
Corrected CA concentrations (C*) measured at theultrasound focal point were plotted as a functionof the time elapsed between BBB disruption and
MR-CA injection (Figure 4C). For Dotarem (1 nmparticle), the BBB was permeable for several hourspost-BBB disruption. A significant amount of CA wasdetectable in the brain even when injected 8 or 9hours after disruption. Around 24 hours afterdisruption, the BBB had apparently recovered itswhole integrity, as very few CA were detectable inthe brain tissues. P846 (4 nm particle) was deliveredacross the BBB only if injected within 2 hourspost-BBB disruption. For P792 (7 nm particle), theduration of CA delivery to the brain was even shorterthan for P846. One hour post-BBB disruption, theamount of CA crossing the BBB was about 30% of itsinitial value and dropped to undetectable levels after90 minutes.
These findings confirmed that the duration of BBBcrossing decreases when increasing CA hydrody-namic diameter. Second, it appears from the shape ofthe time-dependent concentration curve (Figure 4C)that the BBB permeability decreased at a faster rateinitially and at a lesser rate later on.
A Model for Blood–Brain Barrier Closure Dynamics
Based on the experimental observations, the BBBclosure dynamics was modeled as follows. First, it
Figure 3 Comparison of T1-weighted (T1w) and T1 mapping strategies to assess the amount of Gadolinium (Gd)-chelate crossingthe blood–brain barrier (BBB). Dotarem was injected at different doses just after ultrasound-induced BBB disruption inthe right thalamus, followed by the acquisition of one T1 mapping sequence (to produce a concentration map) and one T1w sequence.(A) Overlay of contrast agent (CA) concentration maps on the corresponding anatomical T2w images after injection of increasingdoses of Dotarem (375, 750, and 1,500mmol/kg, n = 1 rat per dose). Purple arrows indicate the ultrasound focal spot wherethe BBB was disrupted. (B) CA concentration as estimated using T1 mapping strategy at the ultrasound focal point showinglinear dependence on the injected dose. The error bars correspond to the standard deviation observed within the regions ofinterest (ROI). (C) T1w signal of the CA at the ultrasound focal point as a function of the injected dose showing a saturationeffect.
Study of BBB closure after US-induced disruptionB Marty et al
1953
Journal of Cerebral Blood Flow & Metabolism (2012) 32, 1948–1958
was assumed that each individual gap generated inthe BBB by ultrasound returns to its equilibriumposition (i.e., closed) as a harmonic oscillatordamped by fluid friction. The gap diameter as afunction of time was therefore expressed asd(t) = d0e
�kt, where d0 is the gap diameter just afterBBB disruption and k a time constant representativeof individual gap closure speed.
Next, the initial size distribution of gaps wasassumed to be a hemi-Gaussian function centered on0 with a standard deviation s0. These two conditionsimply a distribution of gap sizes as a function of timeexpressed as follows:
Nðx; tÞ / 1
s0e�kte� x2
2s20
e�2kt ð4Þ
For each time t, the amount QCA(t) of CA withhydrodynamic diameter dH crossing the BBB in aunit volume after disruption is proportional to the
inflow flux only, since the outflow of CA from brainto blood is assumed to be negligible due to highconcentration in the blood compartment. Assuming ahard sphere behavior for CA molecules, QCA(t) can beexpressed as follows:
QCAðtÞ /Zþ1dH
Nðx; tÞ: x2
dHdx ð5Þ
The CA diffusion in the brain outside of the BBBdisrupted region is also neglected since the CAtissular concentration is quantified within a fewminutes after CA intravenous injection. A previousstudy from our team (Marty et al, 2010) showed thatthe Gd-chelates used in this study do not diffuse fastenough in the brain parenchyma to make this effectsignificant: for example, the diffusion coefficient ofDotarem (1 nm particle) was estimated around46 mm2/s (Table 1).
Figure 4 Blood–brain barrier (BBB) closure dynamics after ultrasound-induced disruption for magnetic resonance contrast agent(MR-CA) of different molecular sizes. Paramagnetic CA were injected at different times (0 to 24 hours) after BBB disruption. (A)Concentrations of the three paramagnetic CA in the region of interest in the cheek muscles CROImuscle were measured. (B) Index ofdelivered acoustic pressure at the ultrasound focal point in the right thalamus in the brain. The maximum variability withineach group (CA) for these two parameters was 13%. (C) Corrected concentration (C*) of the CA at the ultrasound focal point in thebrain was plotted as a function of the time elapsed between ultrasound-induced BBB opening and the MR-CA injection (n = 1 rat pertime point). All experimental data (n = 28 rats) were used to fit the theoretical BBB closure model and determine the two parameters(s0 = 1.54 nm, k = 1.54�10�5 per second) (equation (6)); dashed lines correspond to the fitted data for each MR-CA. ROI, regionof interest.
Study of BBB closure after US-induced disruptionB Marty et al
1954
Journal of Cerebral Blood Flow & Metabolism (2012) 32, 1948–1958
Integration of equation (5) gives:
QCAðtÞ /s2
0e�2kt
dH
�ffiffiffip2
r1�erf
dHffiffiffi2p
s0e�kt
� �� �þ dH
s0e�kte�
d2H
2s20
e�2kt
!
ð6Þ
All experimental data (n = 28 rats) were pooled tobe fitted by this theoretical BBB closure model usinga Levenberg–Marquart algorithm. A characteristicgap diameter s0 = 1.54±0.04 nm, and a BBB closurerate k = 1.54±0.08� 10�5 per second were estimated.The Pearson correlation coefficient R was equal to0.79, demonstrating that the experimental data werereasonably well fitted by the proposed theoreticalmodel. A typical standard deviation of 10% wasobserved on experimental concentration measure-ments within all regions of interest around theultrasound focal point. From this observation, theuncertainties on s0 and k estimations were assessedby Monte Carlo simulations on 106 datasets.
The half closure time (t1/2) was then defined as thetime after disruption when the concentration of CAcrossing the BBB was 50% of the maximal concen-tration obtained immediately after disruption. t1/2
was then calculated as the numerical solution of thefollowing equation:
1
2
ffiffiffip2
r1�erf
dHffiffiffi2p
s0
� �� �þ dH
s0e�
d2H
2s20
!
¼e�2kt1=2
�ffiffiffip2
r1�erf
dHffiffiffi2p
s0e�kt1=2
� �� �þ dH
s0e�kt1=2e�
d2H
2s20
e�2kt1=2
0@
1Að7Þ
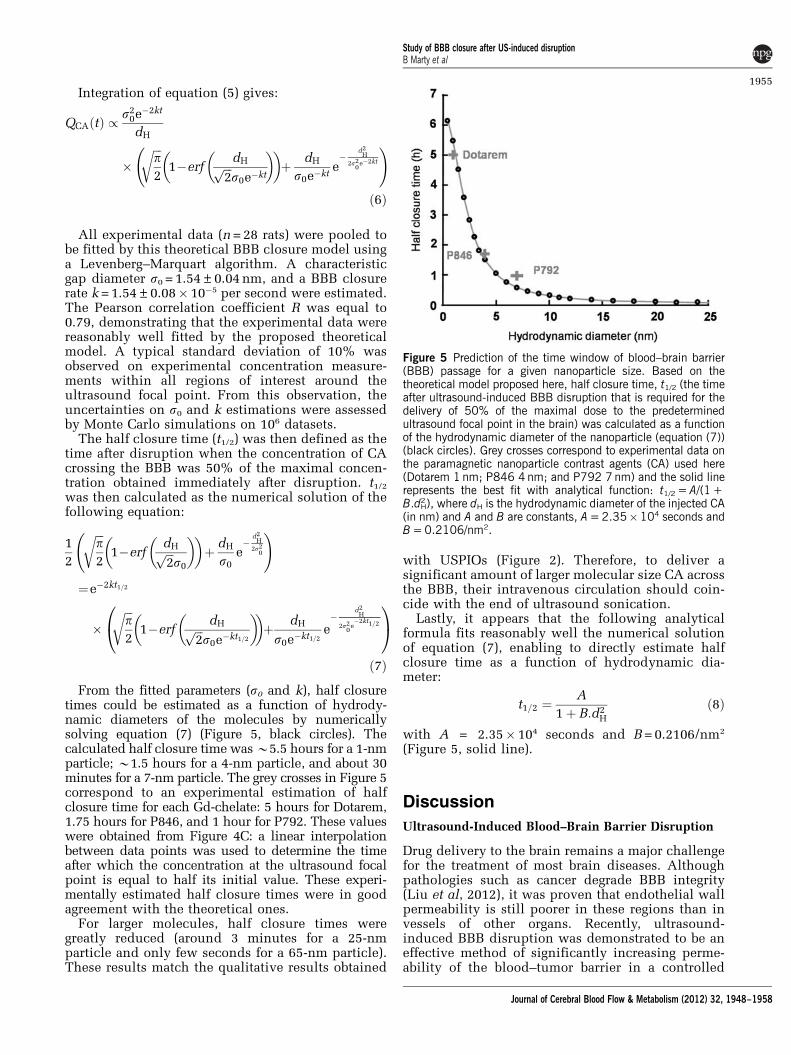
From the fitted parameters (s0 and k), half closuretimes could be estimated as a function of hydrody-namic diameters of the molecules by numericallysolving equation (7) (Figure 5, black circles). Thecalculated half closure time was B5.5 hours for a 1-nmparticle; B1.5 hours for a 4-nm particle, and about 30minutes for a 7-nm particle. The grey crosses in Figure 5correspond to an experimental estimation of halfclosure time for each Gd-chelate: 5 hours for Dotarem,1.75 hours for P846, and 1 hour for P792. These valueswere obtained from Figure 4C: a linear interpolationbetween data points was used to determine the timeafter which the concentration at the ultrasound focalpoint is equal to half its initial value. These experi-mentally estimated half closure times were in goodagreement with the theoretical ones.
For larger molecules, half closure times weregreatly reduced (around 3 minutes for a 25-nmparticle and only few seconds for a 65-nm particle).These results match the qualitative results obtained
with USPIOs (Figure 2). Therefore, to deliver asignificant amount of larger molecular size CA acrossthe BBB, their intravenous circulation should coin-cide with the end of ultrasound sonication.
Lastly, it appears that the following analyticalformula fits reasonably well the numerical solutionof equation (7), enabling to directly estimate halfclosure time as a function of hydrodynamic dia-meter:
t1=2 ¼A
1þ B:d2H
ð8Þ
with A = 2.35� 104 seconds and B = 0.2106/nm2
(Figure 5, solid line).
Discussion
Ultrasound-Induced Blood–Brain Barrier Disruption
Drug delivery to the brain remains a major challengefor the treatment of most brain diseases. Althoughpathologies such as cancer degrade BBB integrity(Liu et al, 2012), it was proven that endothelial wallpermeability is still poorer in these regions than invessels of other organs. Recently, ultrasound-induced BBB disruption was demonstrated to be aneffective method of significantly increasing perme-ability of the blood–tumor barrier in a controlled
Figure 5 Prediction of the time window of blood–brain barrier(BBB) passage for a given nanoparticle size. Based on thetheoretical model proposed here, half closure time, t1/2 (the timeafter ultrasound-induced BBB disruption that is required for thedelivery of 50% of the maximal dose to the predeterminedultrasound focal point in the brain) was calculated as a functionof the hydrodynamic diameter of the nanoparticle (equation (7))(black circles). Grey crosses correspond to experimental data onthe paramagnetic nanoparticle contrast agents (CA) used here(Dotarem 1 nm; P846 4 nm; and P792 7 nm) and the solid linerepresents the best fit with analytical function: t1/2 = A/(1 +B.dH
2), where dH is the hydrodynamic diameter of the injected CA(in nm) and A and B are constants, A = 2.35�104 seconds andB = 0.2106/nm2.
Study of BBB closure after US-induced disruptionB Marty et al
1955
Journal of Cerebral Blood Flow & Metabolism (2012) 32, 1948–1958
manner (Chen et al, 2010). Another study reportedthat vessel wall permeability after ultrasound-induced BBB disruption was comparable to perme-ability values for unprotected organs (Vlachos et al,2010). Our study further demonstrates that ultra-sound combined with intravenous injection ofmicrobubbles is a reliable, reproducible and non-invasive technique to deliver nanoparticles withhydrodynamic diameters up to 65 nm. Moreover, inour protocol, no edema or hemorrhages were de-tected on T2w images following ultrasound sonica-tion up to 24 hours after BBB disruption. Animalskept alive for several weeks after undergoing BBBdisruption showed no adverse effects. The observa-tion of a return to basal permeability within 24 hoursfor the smallest available CA (1 nm) further provedthat the disruption was transient and reversible.
Magnetic Resonance Guidance
The ultrasound-induced BBB disruption describedhere was performed entirely under high-field MRIguidance. This is a challenge as it requires integrat-ing a stereotactic frame, a MR-compatible ultrasoundtransducer adapted to the geometry of the rodenthead and a dedicated RF (radiofrequency) coil intothe 8.5-cm bore of a preclinical MRI scanner. Theoptimized RF coil allowed the quantification of GdMR-CA at a micromolar range, with sufficient signalhomogeneity over the whole brain and the ability forthe ultrasound beam to propagate through the coil.
The anesthetized animal was placed inside theMRI scanner just before the start of the BBBdisruption procedure till recovery. Thus, it waspossible to obtain an acoustic intensity map beforeBBB disruption. This ensured a proper positioning ofthe ultrasound focal spot in the right thalamus and aprecise in situ calibration of the acoustic pressureto avoid irreversible tissue damage. Furthermore,microbubbles were injected to cause ultrasound-induced BBB disruption followed by injection ofMR-CA via the same catheter, which allowed imagingof the early events post-BBB disruption.
Maximum Gap Obtained Between Endothelial Cells
Contrast agents of increasing hydrodynamic sizeswere tested, and the maximum gap width generatedbetween endothelial cells after BBB disruption wasestimated with our acoustic parameters. Gaps slightlyabove 65 nm could be generated safely, and the BBBrecovered full integrity within 24 hours. The me-chanical index of our setup was 0.37 which is belowthe standard value proposed by other studies forreversible BBB opening (McDannold et al, 2008). Thisresult is particularly interesting from the view ofdevelopment of targeted CA. Using a similar sono-poration protocol, it would be possible to delivernanoparticles such as USPIOs, functionalized totarget tissular biomarkers. In contrast, larger objects
like emulsions or liposomes that typically havehydrodynamic diameters > 100 nm, would be diffi-cult to deliver to the brain using this technique,assuming a purely paracellular pathway. In general,an estimate of the maximum possible gap diameterwould be helpful when the technique is applied todeliver therapeutic molecules. Several therapeuticdrugs could benefit from this information: forinstance, chemotherapeutic drugs such as Avastin(dHB10 nm), recombinant adeno-associated virus(rAAV) vectors for gene therapy (dHB20 nm), mono-clonal antibodies such as anti-b-amyloid (dH of fewnm), and vectorized short interfering RNA used forgene expression modulation (dHB50 nm).
The maximum gap diameter measured in thisstudy is probably dependent of the sonicationparameters, in particular ultrasound frequency, pulseduration and duty cycle, total sonication time, andsize distribution of injected microbubbles (Sonovuehas a broad distribution between 1 and 8mm). Here,we chose well-established parameters that have beenproposed by others (Choi et al, 2011). Several groupshave studied the influence of acoustic parameters(O’Reilly et al, 2011a) and microbubbles size (Sa-miotaki et al, 2011) on BBB opening. An optimiza-tion of parameters based on the knowledge gainedfrom these studies may allow generation of poreslarger than 65 nm wide.
Blood–Brain Barrier Closure Dynamics
In this study, the concentration of paramagnetic CAdelivered at the ultrasound focal point was quantita-tively measured, based on which, the duration ofpassage across the BBB was estimated for moleculesof different sizes. This duration decreased rapidly asa function of hydrodynamic diameter of the CA. Forinstance, small molecules (around 1 nm) continuedto cross the BBB for > 10 hours, whereas large ironoxide particles (around 25 nm) had a time window ofonly a few minutes. Therefore, to maximize theamount of extravasation in the brain, large moleculesshould be injected right after or even during ultra-sound sonication.
The results presented here also suggest a closure ofthe BBB at a progressively decreasing rate. Wepresent a simple, damped, elastic model assumingan exponential decay of individual gap sizes to semi-quantitatively describe the observed dynamics ofBBB closure. The experimental data were fed in themodel to derive important physiological parameters,such as the typical closure time constant k that wasestimated to be 1.54� 10�5 per second. This para-meter is an indirect measurement of the rate ofendothelial cell relaxation after contraction. It couldbe used as a physio-pathological index of vesselintegrity.
This model assumes a paracellular passage ofinjected molecules with an inflow limited by thesize of the molecule relative to the size of the pores.
Study of BBB closure after US-induced disruptionB Marty et al
1956
Journal of Cerebral Blood Flow & Metabolism (2012) 32, 1948–1958
Our results support the notion that most of thecrossing happens between endothelial cells ratherthan through them. This reinforces the hypothesisthat during ultrasound-induced BBB opening, soni-cated microbubbles exert a mechanical stress onendothelial cells, which makes them contract onthemselves and loosen the junctions between themcreating gaps (Vykhodtseva et al, 2008).
Limitations of the Study
The proposed BBB closure model has certain limita-tions. It does not take into account potentialincreased permeability of endothelial cell mem-branes (transcellular BBB crossing). It does notdistinguish between hydrophilic and lipophilicmolecules although it is known that lipophilic agentspresent an increased ability to cross the BBB viatranscytosis (Pardridge, 2005). This concurrent re-lease pathway could explain the observed differ-ences between experimental data of P846 and P792and predictions from the theoretical model.
The three Gd-chelates compared in this study havesimilar but not equal vascular remanences (Table 1).The tissular concentrations were measured within12.5 minutes after CA injection, which is not anegligible time delay as the plasmatic half-life of theCA are between 26 and 51 minutes (Fries et al, 2009).Although during data processing the differences inoverall injected plasmatic concentration were cor-rected for each CA (equation (3)), temporal variationsof vascular concentrations during the T1 mappingacquisition could be different from one CA to theother, none of them remaining strictly steady. Theimpact of these variations may be low since the MRImapping acquisition was performed with a centricencoding scheme. Nevertheless, it may explain thedifferences between the theoretical model andthe experimentally measured closure dynamics forthe different molecules.
Conclusion
In this study, we developed a complete methodologyfor noninvasive, reversible and controlled ultra-sound-induced BBB disruption under MR guidancethat permitted precise quantification of the amountof MR-CA delivered to the brain parenchyma in a ratmodel. The two key parameters in designing drugdelivery across the BBB, namely, the largest deliver-able molecular size of the agent, and the timewindow for delivery of an agent of a given molecularsize, were estimated for the first time.
Acknowledgements
The authors thank M Leopoldie for providing animalcare, B Bresson for RF coil support, and Dr A Alaharifor editing this manuscript.
Disclosure/conflict of interest
The authors declare no conflict of interest.
References
Chen PY, Liu HL, Hua MY, Yang HW, Huang CY, Chu PC,Lyu LA, Tseng IC, Feng LY, Tsai HC, Chen SM, Lu YJ,Wang JJ, Yen TC, Ma YH, Wu T, Chen JP, Chuang JI, ShinJW, Hsueh C, Wei KC (2010) Novel magnetic/ultrasoundfocusing system enhances nanoparticle drug deliveryfor glioma treatment. Neuro-Oncology 12:1050–60
Choi JJ, Selert K, Gao Z, Samiotaki G, Baseri B, KonofagouEE (2011) Noninvasive and localized blood-brain barrierdisruption using focused ultrasound can be achieved atshort pulse lengths and low pulse repetition frequen-cies. J Cereb Blood Flow Metab 31:725–37
Choi JJ, Small SA, Konofagou EE (2006) Optimization ofblood-brain barrier opening in mice using focusedultrasound. IEEE Ultrasonics Symposium, Vancouver,Canada
Choi JJ, Wang S, Tung YS, Morrison III B, Konofagou EE(2010) Molecules of various pharmacologically-relevantsizes can cross the ultrasound-induced blood-brainbarrier opening in vivo. Ultrasound Med Biol 36:58–67
Chopra R, Vykhodtseva N, Hynynen K (2010) Influence ofexposure time and pressure amplitude on blood brain-barrier opening using transcranial ultrasound expo-sures). ACS Chem Neurosci 1:391–8
Deichmann R, Haase A (1992) Quantification of T1 valuesby Snapshot-Flash NMR imaging. J Mag Reson 96:608–12
Deichmann R, Hahn D, Haase A (1999) Fast T1 mapping ona whole-body scanner. Magn Reson Med 42:206–9
Fries P, Runge VM, Bucker A, Schurholz H, Reith W, RobertP, Jackson C, Lanz T, Schneider G (2009) Brain tumorenhancement in magnetic resonance imaging at 3 teslaintraindividual comparison of two high relaxivitymacromolecular contrast media with a standard extra-cellular Gd-chelate in a rat brain tumor model. InvestRadiol 44:200–6
Hawkins BT, Davis TP (2005) The blood-brain barrier/neurovascular unit in health and disease. PharmacolRev 57:173–85
Hynynen K, McDannold N, Sheikov NA, Jolesz FA,Vykhodtseva N (2005) Local and reversible blood-brainbarrier disruption by noninvasive focused ultrasound atfrequencies suitable for trans-skull sonications. Neuro-image 24:12–20
Hynynen K, McDannold N, Vykhodtseva N, Jolesz FA(2001) Noninvasive MR imaging-guided focal openingof the blood-brain barrier in rabbits. Radiology 220:640–46
Hyodo F, Chandramouli GVR, Matsumoto S, Matsumoto K-I,Mitchell JB, Krishna MC, Munasinghe JP (2009) Estima-tion of tumor microvessel density by MRI using a bloodpool contrast agent. Int J Oncol 35:797–804
Jordao JF, Ayala-Grosso CA, Markham K, Huang Y, ChopraR, McLaurin J, Hynynen K, Aubert I (2010) Antibodiestargeted to the brain with image-guided focusedultrasound reduces amyloid-beta plaque load in the
Study of BBB closure after US-induced disruptionB Marty et al
1957
Journal of Cerebral Blood Flow & Metabolism (2012) 32, 1948–1958
TgCRND8 mouse model of Alzheimer’s disease. PloSOne 5:e10549
Kang CK, Park CA, Kim KN, Hong SM, Park CW, Kim YB,Cho ZH (2010) Non-invasive visualization of basilarartery perforators with 7T MR angiography. J MagnReson Imaging 32:544–50
Larrat B, Marty B, Pernot M, Tanter M, Lethimonnier F,Meriaux S (2011) MR-Acoustic Radiation Force Map-ping Can Quantitatively Predict Drug Delivery FollowingUltrasound-Induced Blood Brain Barrier Disruption inRats at High Field. Montreal, Canada: ISMRM
Larrat B, Pernot M, Aubry JF, Dervishi E, Sinkus R,Seilhean D, Marie Y, Boch AL, Fink M, Tanter M(2010) MR-guided transcranial brain HIFU in smallanimal models. Phys Med Biol 55:365–88
Liu HL, Hua MY, Chen PY, Chu PC, Pan CH, Yang HW,Huang CY, Wang JJ, Yen TC, Wei KC (2010) Blood-brainbarrier disruption with focused ultrasound enhancesdelivery of chemotherapeutic drugs for glioblastomatreatment. Radiology 255:415–25
Liu HL, Yang HW, Hua MY, Wei KC (2012) Enhancedtherapeutic agent delivery through magnetic resonanceimaging-monitored focused ultrasound blood-brain bar-rier disruption for brain tumor treatment: an overview ofthe current preclinical status. Neurosurg Focus 32:E4
Marty B, Flament J, Giraudeau C, Robic C, Port M,Lethimonnier F, Boumezbeur F, Valette J, Le Bihan D,Meriaux S (2010) Apparent Diffusion Coefficient of Gd-Based Contrast Agents Assessed in Vivo in the Rat BrainUsing Dynamic T1 Mapping. Stockholm, Sweden: ISMRM
McDannold N, Maier SE (2008) Magnetic resonanceacoustic radiation force imaging. Med Phys 35:3748–58
McDannold N, Vykhodtseva N, Hynynen K (2008) Blood-brain barrier disruption induced by focused ultrasoundand circulating preformed microbubbles appears to becharacterized by the mechanical index. Ultrasound MedBiol 34:834–40
Mendonca Dias MH, Lauterbur PC (1986) Ferromagneticparticles as contrast agents for magnetic resonanceimaging of liver and spleen. Mag Reson Med 3:328–30
O’Reilly MA, Huang Y, Hynynen K (2010) The impact ofstanding wave effects on transcranial focused ultra-sound disruption of the blood-brain barrier in a ratmodel. Phys Med Biol 55:5251–67
O’Reilly MA, Waspe AC, Ganguly M, Hynynen K (2011a)Focused-Ultrasound disruption of the Blood-BrainBarrier using closely-timed short pulses: influence ofsonication parameters and injection rate. UltrasoundMed Biol 37:587–94
O’Reilly MA, Yuexi H, Hynynen K (2011b) Standing wavesin small animal models investigating ultrasound dis-ruption of the blood-brain barrier. AIP ConferenceProceedings 1359
Pardridge WM (2005) The blood-brain barrier: bottleneckin brain drug development. NeuroRx 2:3–14
Philippens MEP, Garnbarota G, Pikkemaat JA, PeetersWJM, van der Kogel AJ, Heerschap A (2004) Character-
ization of late radiation effects in the rat thoracolumbarspinal cord by MR imaging using USPIO. MAGMA 17:303–12
Protti A, Sirker A, Shah AM, Botnar R (2010) Lategadolinium enhancement of acute myocardial infarctionin mice at 7T: cine-FLASH versus inversion recovery.J Magn Reson Imaging 32:878–86
Raymond SB, Treat LH, Dewey JD, McDannold NJ,Hynynen K, Bacskai BJ (2008) Ultrasound enhanceddelivery of molecular imaging and therapeutic agents inAlzheimer’s disease mouse models. Plos One 3:e2175
Renshaw PF, Owen CS, McLaughlin AC, Frey TG, Leigh JS(1986) Ferromagnetic contrast agents – a new approach.Magn Reson Med 3:217–25
Rubin LL, Staddon JM (1999) The cell biology of the blood-brain barrier. Ann Rev Neurosci 22:11–28
Samiotaki G, Vlachos F, Tung Y-S, Konofagou EE (2011) Aquantitative pressure and microbubble-size dependencestudy of focused ultrasound-induced blood-brain bar-rier opening reversibility in vivo using MRI. Magn ResonMed 67:769–77
Sheikov N, McDannold N, Sharma S, Hynynen K (2008)Effect of focused ultrasound applied with an ultrasoundcontrast agent on the tight junctional integrity of thebrain microvascular endothelium. Ultrasound Med Biol34:1093–104
Swift TJ, Connick RE (1962) NMR-relaxation mechanismsof 017 in aqueous solutions of paramagnetic cations andlifetime of water molecules in first coordination sphere.J Chem Phys 37:307–20
Treat LH, Zhang Y, McDannold N, Hynynen K (2008)Impact of Focused Ultrasound-Enhanced Drug Deliveryon Survival in Rats with Glioma. Minneapolis, USA:ISTU
Vlachos F, Tung YS, Konofagou EE (2010) Permeabilityassessment of the focused ultrasound-induced blood-brain barrier opening using dynamic contrast-enhancedMRI. Phys Med Biol 55:5451–66
Vlachos F, Tung Y-S, Konofagou E (2011) Permeabilitydependence study of the focused ultrasound-inducedblood-brain barrier opening at distinct pressures andmicrobubble diameters using DCE-MRI. Magn ResonMed 66:821–30
Vykhodtseva N, McDannold N, Hynynen K (2008) Progressand problems in the application of focused ultrasoundfor blood-brain barrier disruption. Ultrasonics 48:279–96
Yankeelov TE, DeBusk LM, Billheimer DD, Luci JJ, Lin PC,Price RR, Gore JC (2006) Repeatability of a referenceregion model for analysis of murine DCE-MRI data at 7T.J Magn Reson Imaging 24:1140–7
Study of BBB closure after US-induced disruptionB Marty et al
1958
Journal of Cerebral Blood Flow & Metabolism (2012) 32, 1948–1958