Dynamic Systems, Neural Networks Picker Engineering Program Smith College EGR 301 January 25, 2005 Judith Cardell Overview • Course administration • The purpose of modeling & simulation • What is a dynamic system? – Policy: Aid to developing countries – Engineering: Electric power system • How are neural networks and dynamic systems studies related? • Pendulum man
Transcript
1
Dynamic Systems, Neural Networks
Picker Engineering Program Smith College
EGR 301
January 25, 2005Judith Cardell
Overview
• Course administration• The purpose of modeling & simulation• What is a dynamic system?
– Policy: Aid to developing countries– Engineering: Electric power system
• How are neural networks and dynamic systems studies related?
• Pendulum man
2
Modeling and Simulation
Systems
Experiment withactual system
Experiment with a model of a
system
Physical model Mathematical model
Analytic Solution Computer Simulation
Systems to Model & Simulate
• Dynamic system– System
• A combination of interacting elements• …that act together to perform a specific objective
– Dynamic • Systems or phenomena that produce time-changing
patterns• ... that evolve or change with time
• Policy analysis• Engineering analysis
3
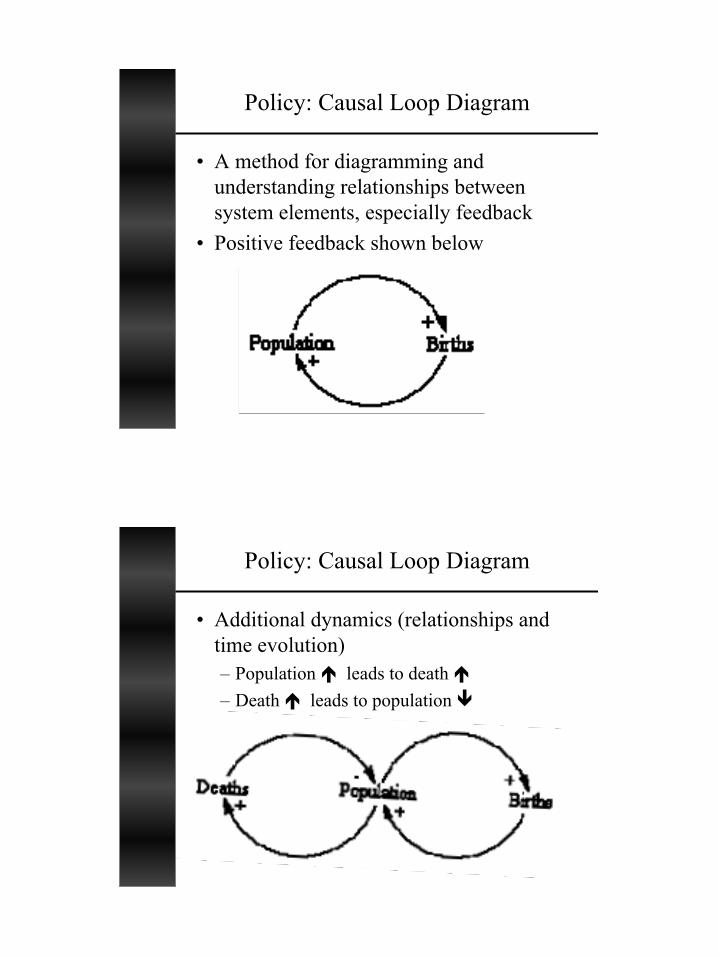
Policy: Causal Loop Diagram
• A method for diagramming and understanding relationships between system elements, especially feedback
• Positive feedback shown below
Policy: Causal Loop Diagram
• Additional dynamics (relationships and time evolution)– Population leads to death – Death leads to population
4
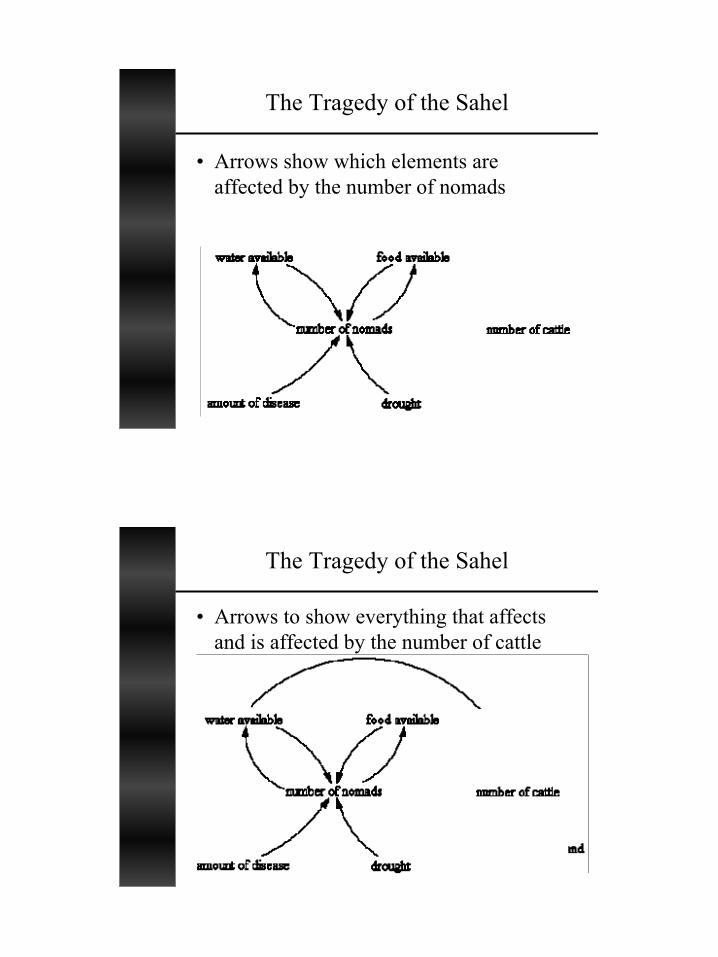
The Tragedy of the Sahel
• Narrow strip of land south of the Sahara desert• Limited resources have limited the size of both nomad
and grazing animal populations– Every 20-30 years drought killed many– Populations maintained at viable levels
• Nomad survival system – Depended upon moving grazing animals often
• In the 1960s aid organizations tried to help the nomad population
• Steps taken by organizations– Introduce modern medicine