16 TRANSPORTATION RESEARCH RECORD 1178 Dynamic Testing: Density on the Run DONALD J. SEAMAN* Presented herein Is a discussion of a new nondestructive device that will measure density continuously while hot asphaltic concrete is being compacted by the contractor. Den- sity on the run consists of a nuclear source and detectors mounted inside a rotating drum, 6 5 /s In. In diam by 18 in. long. It is placed directly on a steel wheel roller compactor so that density can be reported Instantly to the operator, density that may change (intentionally or unintentionally) because of changes in ballast, rolling speed, frequency, and amplitude of vibration and temperature. This device can be removed from the roller in minutes and mounted on a two-wheeled cart to measure and optimize density performance of the asphalt paver. It can also be used to take stationary readings and provide moisture data for base course construction. Density on the run may be used to (a) deal with shortcomings of nuclear and conventional coring specifications in which one test In 1,200 lane-ft is often considered adequate agency accep- tance; (b) reduce rolling hours and optimize asphaltlc con- crete paver performance to avoid penalties and solve problem variables of compaction; (c) measure density of large areas, furnishing the added data to statistically analyze uniformity of density and its relationship to quality In flexible pavements; (d) offset the shortcomings of stationary nuclear density meters; and (e) Implement high-speed nuclear testing and pneumatic roller compaction testing and measure the density of thin lift overlays as small as 3 /4 In. In 1-in. increments. With the advent of nuclear density gauges in the late 1950s, and end result density specifications for quality assurance of road and airport construction, both nuclear gauges and end result specifications appeared to enhance one another. More end result specifications meant more nuclear gauges and vice versa. Which came first-the gauge or the specifications-is still debatable. Without a doubt, end result density specifica- tions resulted in better quality at a lower cost and contributed to an era of contractor competitiveness. This competitiveness demanded innovative, state-of-the-art instrumentation along with appropriate compaction and paving equipment to sustain pursuit of the market The first stationary nuclear systems found a home with federal, state, county, city, and other testing agencies. Their intended use was to measure density for acceptance purposes after compaction and to handle the higher production rates demanded by contractors. The nuclear method is easily 10 times faster than conventional sand cone or core testing. At that time most contractors considered nuclear testing a threat. *Deceased. Seaman Nuclear Corporation, 7315 South First Street, Oak Creek, Wis. 53154-2095. Only a few of the more progressive contractors considered the purchase of nuclear density meters. DESCRIPTION OF DENSITY ON THE RUN Density on the run (DOR) consists of a nuclear source and detectors mounted inside a rotating drum 6S/s in. in diam by 18 in. long (see Figure 1). The radioactive source, lead shielding, and detectors are stationary. Only the outer drum revolves and is held to a rotating concentricity of 0.002 in. The source and detectors are always at a fixed height above the test surface, as described in ASTM D2922 and D2950 for stationary gauges. The calibra- tion technique employs the air-gap backscatter method. The air-gap reading cancels the chemical effect, compensating for temperature changes from ambient through 375°F and changes in background radiation. The microprocessor and display unit, within view of the operator, present raw data in counts per minute, intermediate data in pounds per cubic foot, and finally in terms of percent compaction (see Figure 2). All of these data can be recorded for later printout and evaluation. The microprocessor offers a selection of test time periods from 1 sec to 9,999 sec. For example, if 20 sec is selected, the density displayed is the average for the distance traveled in 20 sec. Other usable test times are 5-, 10-, 12-, and 15-sec periods when precision is not critical, for example, at the start of the job when the focus is on whether the density increases or decreases with changes in roller variables. The DOR system may also be mounted on a two-wheeled cart to measure paver density output (see Figure 3). The cart may be motorized when speed control is essential, for exam- ple, in the production of computerized density contour maps (see Figure 4). Speeds as low as 18 ft/min and 6- or 12-sec readings are typical, producing data every 1.8 to 3.6 ft. The microprocessor may be programmed for thin-lift overlay den- sities from 3 /4 in. and up in 1-in. increments. When the DOR is mounted inside the wheelbase of a com- pactor, the ideal surface is prepared for the DOR to measure (see Figure 3). Furthermore, the DOR drum requires only line contact for an accurate reading. Thus, when cart- mounted, density in wheel tracks of a pneumatic roller can be easily measured. This is not possible with flat-bottomed stationary gauges. Also, the excess running surface water often left by tandem steel wheel rollers when compacting asphaltic con- crete does not affect DOR densities. The rolling drum dis- places this water when measuring the asphaltic concrete. In comparison with stationary gauges, surface preparation for the DOR is only minimal, even when used as a stationary gauge. One DOR can replace two to three fiat-bottomed sta- tionary gauges.
Transcript
16 TRANSPORTATION RESEARCH RECORD 1178
Dynamic Testing: Density on the Run
DONALD J. SEAMAN*
Presented herein Is a discussion of a new nondestructive device that will measure density continuously while hot asphaltic concrete is being compacted by the contractor. Density on the run consists of a nuclear source and detectors mounted inside a rotating drum, 65/s In. In diam by 18 in. long. It is placed directly on a steel wheel roller compactor so that density can be reported Instantly to the operator, density that may change (intentionally or unintentionally) because of changes in ballast, rolling speed, frequency, and amplitude of vibration and temperature. This device can be removed from the roller in minutes and mounted on a two-wheeled cart to measure and optimize density performance of the asphalt paver. It can also be used to take stationary readings and provide moisture data for base course construction. Density on the run may be used to (a) deal with shortcomings of nuclear and conventional coring specifications in which one test In 1,200 lane-ft is often considered adequate agency acceptance; (b) reduce rolling hours and optimize asphaltlc concrete paver performance to avoid penalties and solve problem variables of compaction; (c) measure density of large areas, furnishing the added data to statistically analyze uniformity of density and its relationship to quality In flexible pavements; (d) offset the shortcomings of stationary nuclear density meters; and (e) Implement high-speed nuclear testing and pneumatic roller compaction testing and measure the density of thin lift overlays as small as 3/4 In. In 1-in. increments.
With the advent of nuclear density gauges in the late 1950s, and end result density specifications for quality assurance of road and airport construction, both nuclear gauges and end result specifications appeared to enhance one another. More end result specifications meant more nuclear gauges and vice versa. Which came first-the gauge or the specifications-is still debatable. Without a doubt, end result density specifications resulted in better quality at a lower cost and contributed to an era of contractor competitiveness. This competitiveness demanded innovative, state-of-the-art instrumentation along with appropriate compaction and paving equipment to sustain pursuit of the market
The first stationary nuclear systems found a home with federal, state, county, city, and other testing agencies. Their intended use was to measure density for acceptance purposes after compaction and to handle the higher production rates demanded by contractors. The nuclear method is easily 10 times faster than conventional sand cone or core testing. At that time most contractors considered nuclear testing a threat.
*Deceased. Seaman Nuclear Corporation, 7315 South First Street, Oak Creek, Wis. 53154-2095.
Only a few of the more progressive contractors considered the purchase of nuclear density meters.
DESCRIPTION OF DENSITY ON THE RUN
Density on the run (DOR) consists of a nuclear source and detectors mounted inside a rotating drum 6S/s in. in diam by 18 in. long (see Figure 1).
The radioactive source, lead shielding, and detectors are stationary. Only the outer drum revolves and is held to a rotating concentricity of 0.002 in. The source and detectors are always at a fixed height above the test surface, as described in ASTM D2922 and D2950 for stationary gauges. The calibration technique employs the air-gap backscatter method. The air-gap reading cancels the chemical effect, compensating for temperature changes from ambient through 375°F and changes in background radiation. The microprocessor and display unit, within view of the operator, present raw data in counts per minute, intermediate data in pounds per cubic foot, and finally in terms of percent compaction (see Figure 2). All of these data can be recorded for later printout and evaluation.
The microprocessor offers a selection of test time periods from 1 sec to 9,999 sec. For example, if 20 sec is selected, the density displayed is the average for the distance traveled in 20 sec. Other usable test times are 5-, 10-, 12-, and 15-sec periods when precision is not critical, for example, at the start of the job when the focus is on whether the density increases or decreases with changes in roller variables.
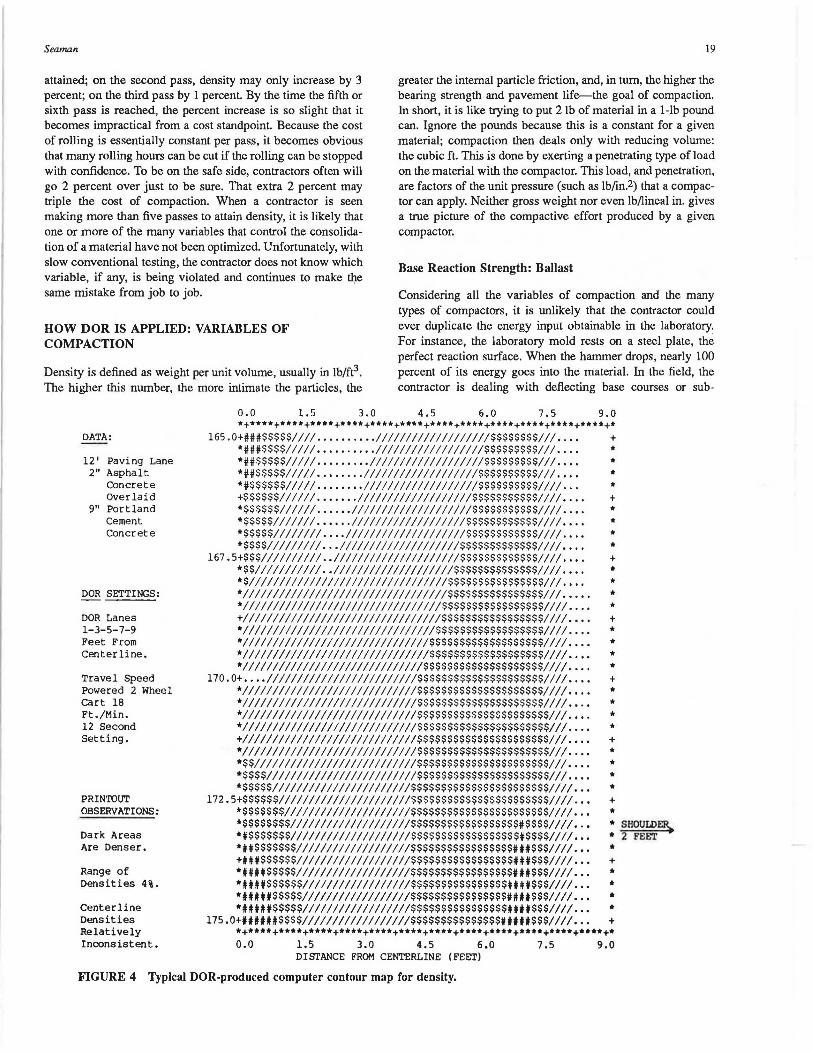
The DOR system may also be mounted on a two-wheeled cart to measure paver density output (see Figure 3). The cart may be motorized when speed control is essential, for example, in the production of computerized density contour maps (see Figure 4). Speeds as low as 18 ft/min and 6- or 12-sec readings are typical, producing data every 1.8 to 3.6 ft. The microprocessor may be programmed for thin-lift overlay densities from 3/4 in. and up in 1-in. increments.
When the DOR is mounted inside the wheelbase of a compactor, the ideal surface is prepared for the DOR to measure (see Figure 3). Furthermore, the DOR drum requires only line contact for an accurate reading. Thus, when cart- mounted, density in wheel tracks of a pneumatic roller can be easily measured. This is not possible with flat-bottomed stationary gauges. Also, the excess running surface water often left by tandem steel wheel rollers when compacting asphaltic concrete does not affect DOR densities. The rolling drum displaces this water when measuring the asphaltic concrete.
In comparison with stationary gauges, surface preparation for the DOR is only minimal, even when used as a stationary gauge. One DOR can replace two to three fiat-bottomed stationary gauges.
Seaman 17
I SHIELDED
1 r OPERATE TUBE - 6-5/8" diameter x 18" Long
A-1
~ ·: !l
~·
NOTES:
SOURCE 4. 5 mC 1 RilBe
LEAD SOURCE WHEEL ROTATES 90° - 2" Diameter
- LEllD SlllELD 1/2" THICK U-CllAIUIH
WHEN DOR IS REMOVED FROM COMPACTOR, A PIN IS AUTOMATICALLY PULLEU AND A SPRING RETURNS THE SOURCE TO SHIELDED POSITION.
FIGURE 1 Details of model DOR showing source and shielding.
"STAGE II": ASPHALTIC CONCRETE
Late in the 1960s, asphaltic concrete density specifications caused a rapid rise in the nuclear testing industry. Known as "Stage II," this period brought about a natural and mutual relationship with end result density specifications. All the benefits of nuclear testing were needed here. Density could be determined while the asphalt was still hot and while rolling patterns could still be corrected. Coring, the conventional method, could not be done while the asphalt was hot; therefore, results were not known for days, and were known only after the fact, leading to contractor penalties. Furthermore, asphalt paver and compactor production was approaching 5,000 tons/day. Conventional testing was too slow to accommodate this volume. Thus, nuclear density meters came to be in demand by the volume users-the contractors.
Of greatest interest to the contractor was being able to obtain immediate test results while the asphalt was still hot. Subsequently, other advantages became apparent, such as the ability to save rolling hours by optimizing the variables of compaction (i.e., the ballast weight, travel speed, frequency and amplitude of vibration, and temperature control). The day contractors discovered that the Jackknife and Heel-of-Shoe tests were inadequate was the day they realized the importance and value of nuclear testing for competitive survival. At this point, although the testing agencies continued to increase the use of the nuclear meter for reasons of speed and ease of use, the contractors' need became exponential because of the need to control costs.
STAGE III: DYNAMIC TESTING-DOR
During Stage Il it became obvious that another generation of nuclear meters would be needed. In 1984 the first DOR device was produced, allowing a continuous display of density while in motion. This device could be attached at midpoint to any tandem type of steel wheel roller (vibratory or static), or could be quickly removed and mounted on a two-wheeled handcart
for walking on the job (see Figures 3 and 5). The device consists of a 65/s-in.-diam drum approximately 18 in. long that can read density performance of the compactor as the material is being consolidated. The principle of operation is similar to stationary nuclear gauges using the air-gap ratio method: a radioactive source and a gamma detector are mounted below the axle shaft a fixed distance from the inner surface of the drum (see Figure 1). The detector is coupled to a counter and a microprocessor, which converts the raw count data to density and percent compaction.
With the advent of stricter density specifications by federal and state agencies for road and (in particular) airport construction, the penalties being assessed increased rapidly to the point that they were putting smaller contractors out of business. It has been estimated that more penalties have been assessed and paid in the last 4 yr than in the total for the previous 10 yr. In their pursuit of longer life and stronger flexible pavements, the agencies are upgrading specifications to attain pavement quality never before specified. This goal is reasonable and the penalties provide the incentive to accelerate the learning curve of paving contractors.
Asphalt paving is highly competitive, and contractors who do not survive are not taking advantage of the state-of-the-art tools available. These instruments can isolate that one problem variable among the many possible ones existing in paving and compacting. Further, even stationary nuclear gauges are too slow and are unable to provide the volume of timely information to fine-tune the compaction techniques required to meet specifications and avoid penalties. Thus, a more prolific test method such as DOR is needed.
It was soon recognized that, to meet specifications and avoid penalties, not only would the variables of the compactor have to be optimized, those of the asphalt paver would also (1). In the past, paver density was virtually ignored. As long as smoothness and thickness were obtained, the rest was left up to the compaction equipment. Ignoring the density produced by the paver itself was one of the chief causes of compaction
18
FIGURE 2 Operator view of microprocessor mounted on compactor.
penalties. Maximizing the density output of the paver is essential.
The more progressive contractors would optimize the paver vibratory screed frequency for a given forward travel speed to attain as much density as possible from the paver. Merely running full-throttle screed frequency and amplitude is no guarantee that the density will be maximized. It has been noted that some of the newer pavers (2, 3) equipped with highdensity screeds (1) can attain 98 percent (50 blow Marshall) with the high-density vibratory screed only, and that further rolling would not be required if it were not for smoothness and sealing requirements. A high-density screed incorporates both a vibratory plate screed and one or more rows of tamper bars (3, 4). Through the use of the nuclear meter it is not unusual to find contractors attaining specified density with only two passes of a dual drum, self-propelled vibratory roller behind the paver (3). In this case the meter is used again to optimize the frequency and amplitude of the roller with the forward travel speed.
Although Stage II stationary nuclear meters were optimizing the compactor fairly successfully, the new end result specifications for density led to further refinement needs. Although stationary meters were fast, they were not fast enough to handle the refinement of the compaction variables necessary to avoid penalties. The density on the run meter
TR.4NSPORTATfON RESEAR.CH RECORD 1178
FIGURE 3 DOR system mounted on a two-wheeled cart. Cart may or may not be motorized.
allowed the frequency, amplitude, travel speed, and temperature to be analyzed individually during the compaction process. For example, it was possible (with DOR) for the operator to see the results of increasing or decreasing the rolling speed inunediately, while keeping the amplitude and frequency constant, or conversely, with speed and amplitude unchanged, to monitor the effect of changes in frequency.
Another important capability of the meter is its ability to monitor the increase in density with each pass of the compactor, thereby knowing when to stop rolling. Over-rolling (reaching density and then decompacting by continued rolling) can be a problem. The new high-performance vibratory rollers are more susceptible to over-rolling than static rollers. Overrolling is caused by simply exceeding the bearing strength of the material. With each succeeding pass of the roller, the roller contact area becomes increasingly smaller until the contact pressure climbs to exceed the bearing strength of the material. At this point the material breaks up and loses density because of displacement.
Another interpretation of the term over-rolling is that it is not the problem of attaining and then losing density but simply rolling more than is necessary by not knowing when to stop. The typical density growth curve rapidly reaches the point of diminishing returns, after about the third pass. For instance, on the first pass, 90 percent of Marshall may have been already
Seaman 19
attained; on the second pass, density may only increase by 3 percent; on the third pass by 1 percent. By the time the fifth or sixth pass is reached, the percent increase is so slight that it becomes impractical from a cost standpoint. Because the cost of rolling is essentially constant per pass, it becomes obvious that many rolling hours can be cut if the rolling can be stopped with confidence. To be on the safe side, contractors often will go 2 percent over just to be sure. That extra 2 percent may triple the cost of compaction. When a contractor is seen making more than five passes to attain density, it is likely that one or more of the many variables that control the consolidation of a material have not been optimized. Unfortunately, with slow conventional testing, the contractor does not know which variable, if any, is being violated and continues to make the same mistake from job to job.
greater the internal particle friction, and, in turn, the higher the bearing strength and pavement life--the goal of compaction. In short, it is like trying to put 2 lb of material in a 1-lb pound can. Ignore the pounds because this is a constant for a given material; compaction then deals only with reducing volume: the cubic ft. This is done by exerting a penetrating type of load on the material with the compactor. This load, and penetration, are factors of the unit pressure (such as lb/in.2) that a compactor can apply. Neither gross weight nor even lb/lineal in. gives a true picture of the compactive effort produced by a given compactor.
Base Reaction Strength: Ballast
HOW DOR IS APPLIED: VARIABLES OF COMPACTION
Considering all the variables of compaction and the many types of compactors, it is unlikely that the contractor could ever duplicate the energy input obtainable in the laboratory: For instance, the laboratory mold rests on a steel plate, the perfect reaction surface. When the hammer drops, nearly 100 percent of its energy goes into the material. In the field, the contractor is dealing with deflecting base courses or sub-
Density is defined as weight per unit volume, usually in lb/ft3 .
The higher this number, the more intimate the particles, the
FIGURE 4 Typical DOR-produced computer contour map for density.
20
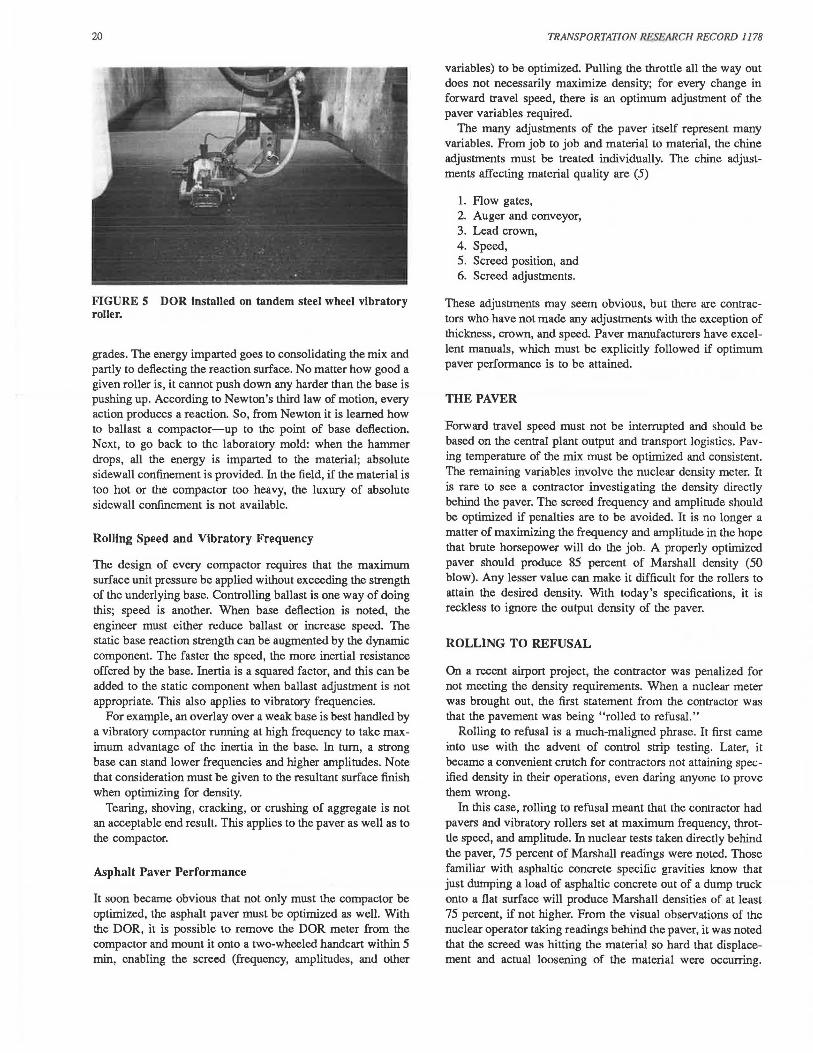
FIGURE S DOR Installed on tandem steel wheel vibratory roller.
grades. The energy imparted goes to consolidating the mix and partly to deflecting the reaction surface. No matter how good a given roller is, it cannot push down any harder than the base is pushing up. According to Newton's third law of motion, every action produces a reaction. So, from Newton it is learned how to ballast a compactor-up to the point of base deflection. Next, to go back to the laboratory mold: when the hammer drops, all the energy is imparted to the material; absolute sidewall confinement is provided. In the field, if the material is too hot or the compactor too heavy, the luxury of absolute sidewall confinement is not available.
Rolling Speed and Vibratory Frequency
The design of every compactor requires that the maximum surface unit pressure be applied without exceeding the strength of the underlying base. Controlling ballast is one way of doing this; speed is another. When base deflection is noted, the engineer must either reduce ballast or increase speed. The static base reaction strength can be augmented by the dynamic component. The faster the speed, the more inertial resistance offered by the base. Inertia is a squared factor, and this can be added to the static component when ballast adjustment is not appropriate. This also applies to vibratory frequencies.
For example, an overlay over a weak base is best handled by a vibratory compactor running at high frequency to take maximum advantage of the inertia in the base. In tum, a strong base can stand lower frequencies and higher amplitudes. Note that consideration must be given to the resultant surface finish when optimizing for density.
Tearing, shoving, cracking, or crushing of aggregate is not an acceptable end result. This applies to the paver as well as to the compactor.
Asphalt Paver Performance
It soon became obvious that not only must the compactor be optimized, the asphalt paver must be optimized as well. With the DOR, it is possible to remove the DOR meter from the compactor and mount it onto a two-wheeled handcart within 5 min, enabling the screed (frequency, amplitudes, antl other
TRANSPORTATION RESEARCH RECORD 1178
variables) to be optimized. Pulling the throttle all the way out does not necessarily maximize density; for every change in forward travel speed, there is an optimum adjustment of the paver variables required.
The many adjustments of the paver itself represent many variables. From job to job and material to material, the chine adjustments must be treated individually. The chine adjustments affecting material quality are (5)
1. Flow gates, 2. Auger and conveyor, 3. Lead crown, 4. Speed, 5. Screed position, and 6. Screed adjustments.
These adjustments may seem obvious, but there are contractors who have not made any adjustments with the exception of thickness, crown, and speed Paver manufacturers have excellent manuals, which must be explicitly followed if optimum paver performance is to be attained.
THE PAVER
Forward travel speed must not be interrupted and should be based on the central plant output and transport logistics. Paving temperature of the mix must be optimized and consistent. The remaining variables involve the nuclear density meter. It is rare to see a contractor investigating the density directly behind the paver. The screed frequency and amplitude should be optimized if penalties are to be avoided. It is no longer a matter of maximizing the frequency and amplitude in the hope that brute horsepower will do the job. A properly optimized paver should produce 85 percent of Marshall density (50 blow). Any lesser value can make it difficult for the rollers to attain the desired density. With today's specifications, it is reckless to ignore the output density of the paver.
ROLLING TO REFUSAL
On a recent airport project, the contractor was penalized for not meeting the density requirements. When a nuclear meter was brought out, the first statement from the contractor was that the pavement was being "rolled to refusal."
Rolling to refusal is a much-maligned phrase. It first came into use with the advent of control strip testing. Later, it became a convenient crutch for contractors not attaining specified density in their operations, even daring anyone to prove them wrong.
In this case, rolling to refusal meant that the contractor had pavers and vibratory rollers set at maximum frequency, throttle speed, and amplitude. In nuclear tests taken directly behind the paver, 75 percent of Marshall readings were noted. Those familiar with asphaltic concrete specific gravities know that just dumping a load of asphaltic concrete out of a dump truck onto a flat surface will produce Marshall densities of at least 75 percent, if not higher. From the visual observations of the nuclear operator taking readings behind the paver, it was noted that the screed was hitting the material so hard that displacement and actual loosening of the material were occurring.
Seaman
There was never a chance that the rollers would raise a 75 percent Marshall to 100 percent. When paver frequency was reduced to 75 percent and amplitude to 50 percent, paver densities went to 85 percent of Marshall, enabling the required compaction to be easily obtained by the rollers. Penalties were thus eliminated.
UNIFORMITY VERSUS DENSITY
Although one criterion for a high-quality bituminous pavement has traditionally been the attainment of a minimum level of density, some of the more progressive states have now recognized the value of uniformity. Pay schedules now reward uniformity (i.e, low standard deviation of density results in a given lot) as well as absolute levels of compaction. Of course, the only way for the contractor to take advantage of this is by continuously monitoring the densities being produced during paving and compacting.
In the state of Wyoming a contractor can be paid 110 percent of the contract price if the range of densities for the average of five density tests in 1,500 tons meets their minimum range and a minimum of 92 percent of maximum theoretical density via the Rice method (5). Penalties should be expected not only for low density, but for densities that are too high. Successful flexible pavements demand uniformity of density more than they do higher density specifications.
INTERVALS FOR ACCEPTANCE TESTING
If any weight is going to be given to the importance of increased uniformity, the states and other agencies themselves will need to look at the number of tests needed to ensure this uniformity. A look at current practice among the states (6) shows a startling variation in the number of nuclear density tests required for acceptance of asphaltic concrete compaction: based on an assumed plant output of 1,000 tons/day going into a 12-ft lane 2 in. thick, the distance between each nuclear test varied from 100 to 5,280 ft, the average being 1,250 ft/nuclear density test. This is for 2 in. of asphalt. At 1 in., it is twice the distance, or one test/1h mi.
When core tests were used for acceptance, the intervals varied from 750 to 7,140 ft, with an average of 3,283/lane. From the owner's point of view, such a low number of tests will give little reliable information about the uniformity of the paving job. From the contractor's point of view, yet another incentive for increased coverage of density tests is this: because contractors' pay may be based on a relatively small number of tests taken at randomly selected locations, they must be assured that any location selected by the inspector will be of proper density.
It seems almost ridiculous to find the average state accepting a job on the basis of four nuclear tests/mi or three cores/mi. Although the newer and stricter density specifications are providing more and better acceptance testing, it is still inadequate from known sampling and statistical techniques. Dynamic density testing, or DOR, now makes it possible to consider 100 percent inspection.
In terms of testing, it is not intended to imply that all nuclear methods are accurate without shortcomings. This is not true. The accuracy, production, and initial price vary greatly from
21
one nuclear system to another. In order for the cost of any nuclear density system to be justified, there are certain minimum criteria to be used in its selection:
1. The system should make use of single-density calibration from the factory for soils and asphaltic concrete. Running conventional field density tests to allow correlation with variations in material type, asphalt content, or gradation is not desirable. Certainly, instruments allowing the operator to "bias" or "offset" the density calibration from the operator's panel are unacceptable.
2. The test method should be totally nondestructive. Now that pneumatic rolling for asphalt is coming back to minimize rutting, there is a need to measure density in the wheel tracks and on the ridges during density growth testing. The DOR device described will measure pneumatic rolling when mounted on the handcart. Only line contact (i.e., the line formed by the tangency of the surface of the material to the bottom of the cylinder of the DOR) is needed for a test. Flatbottomed nuclear gauges cannot measure pneumatic rolled densities.
3. Contractors require a factory density calibration that is fail-safe. Any operator error or carelessness must result in too low a reading. A device that could read high would cause a penalty when agency testing occurred.
4. The density gauge must be capable of accurately measuring densities on thin lift overlays (3/4 in.), independently of base density.
5. To minimize the effect of open-graded surface voids requiring the use of fines, nuclear meters should be able to determine density without actually touching the test material through a small controlled air gap of 1/4 in. to eliminate the use of fine filler material-a problem area for operators.
CONCLUSION AND PROJECTIONS
Higher quality and longer life construction always require more attention to specifications. Laboratory testing takes place in a controlled and precise atmosphere. Field testing does not. More field testing is required, not only for acceptance purposes but also for control purposes (i.e., to allow contractors to refine the paver and compactor performance in a timely way) (6). Contractors should require devices that can quickly isolate problems in their construction methods. Speed and controlling rolling hours are needed to perform high-quality work at a competitive rate. Devices such as DOR fill this need.
More specifications should recognize the importance of uniformity of density. More testing will be required to accomplish this. The number of DOR devices will grow to meet this requirement.
REFERENCES
1. Construction Report. Nos. 22, 23, 24, 39, and 40, Hameln, Federal Republic of Germany, Oct 1985.
2. Vibro-Duo Tamp High-Density Screed Paver. Bulletin 101.1084, A.B.G. Strassen-Baumaschinen, Hameln, Federal Republic of Germany.
6. Transportation Research Circular 321: Nuclear Density Gauge Monitoring of Asphalt Concrete Compaction. TRB, National Research Council, Washington, D.C., June 1987.
Publication of this paper sponsored by Committee on Flexible Pavement Construction and Rehabilitation.