1 4th International Colloquium "Transformer Research and Asset Management” TUTORIAL Dynamic Testing for On Load Tap Changer Condition Assessment Dr. Raka Levi, AMforum Abstract The tutorial covers different tap changer constructions and principles of operation. Further, it explains procedure of the dynamic measurements for resistor and reactor types of tap changers, and a resulting graph analysis. Advantages and disadvantages of different methods and connections are presented. Several interesting cases from the knowledge base shown, demonstrate diagnostic power of the test-current and motor-current graph analysis. Introduction The AMforum association, an independent asset managers’ forum of TSO experts in Europe, formed a working group in 2010 to investigate and standardize the DRM (dynamic resistance measurement) for OLTC condition assessment. Producers of tap changers, manufacturers of test instruments, and utility and service companies using this method collected their experience into a significant knowledge-base. This presentation is based on their practical experience and case examples collected, where some of these were published in technical papers elsewhere. On Load Tap Changers The On Load Tap Changer principle was patented in 1927 by Dr. Jansen, and its premise is very simple: “make before break” or connect with the next tap before breaking with the previous one. This is still true today and modern tap changers are still designed following this approach. As this is a tap changer that operates under transformer full load condition, as opposed to De-Energized Tap-Changer (DETC), the circuit should never be broken. Thus, opening the circuit is one of the biggest OLTC problems. It creates gases and can cause transformer tripping or even failure. Detecting this was impossible using old fashioned static measurement techniques. There are many different designs and principles of OLTC operation. They can be in the tank or in a separate compartment attached to the tank. They can use reactors (preventive autotransformer - PA) or resistors in its operation to lower the circulating current. The switching can be in oil or contained in the vacuum bottles. For high currents a booster or a series transformer may be added to lower the current while increasing the voltage the OLTC deals with. The current switching and selection of taps can be performed using the same pair of contacts (arcing tap switch), or using two sets of contacts (a selector, and a separate transfer or diverter switch). Then, two or three tap changers can operate on the same mechanism in one transformer and their synchronization needs to be verified. Many variations of OLTCs require the knowledge of exact tap changer type in order to analyze the result. Reactor OLTC The reactor type tap changers are predominant in the USA networks, while European tap changers use resistors for circulating current limitation during the tap transition. These reactor OLTC constructions rely on
Transcript
1
4th International Colloquium "Transformer Research and Asset Management”
TUTORIAL
Dynamic Testing for On Load Tap Changer
Condition Assessment
Dr. Raka Levi, AMforum
Abstract
The tutorial covers different tap changer constructions and principles of operation. Further, it explains procedure
of the dynamic measurements for resistor and reactor types of tap changers, and a resulting graph analysis.
Advantages and disadvantages of different methods and connections are presented. Several interesting cases
from the knowledge base shown, demonstrate diagnostic power of the test-current and motor-current graph
analysis.
Introduction
The AMforum association, an independent asset managers’ forum of TSO experts in Europe, formed a
working group in 2010 to investigate and standardize the DRM (dynamic resistance measurement) for OLTC
condition assessment. Producers of tap changers, manufacturers of test instruments, and utility and service
companies using this method collected their experience into a significant knowledge-base. This presentation is
based on their practical experience and case examples collected, where some of these were published in
technical papers elsewhere.
On Load Tap Changers
The On Load Tap Changer principle was patented in 1927 by Dr. Jansen, and its premise is very simple:
“make before break” or connect with the next tap before breaking with the previous one. This is still true today
and modern tap changers are still designed following this approach. As this is a tap changer that operates under
transformer full load condition, as opposed to De-Energized Tap-Changer (DETC), the circuit should never be
broken. Thus, opening the circuit is one of the biggest OLTC problems. It creates gases and can cause
transformer tripping or even failure. Detecting this was impossible using old fashioned static measurement
techniques.
There are many different designs and principles of OLTC operation. They can be in the tank or in a separate
compartment attached to the tank. They can use reactors (preventive autotransformer - PA) or resistors in its
operation to lower the circulating current. The switching can be in oil or contained in the vacuum bottles. For
high currents a booster or a series transformer may be added to lower the current while increasing the voltage
the OLTC deals with. The current switching and selection of taps can be performed using the same pair of
contacts (arcing tap switch), or using two sets of contacts (a selector, and a separate transfer or diverter switch).
Then, two or three tap changers can operate on the same mechanism in one transformer and their
synchronization needs to be verified. Many variations of OLTCs require the knowledge of exact tap changer
type in order to analyze the result.
Reactor OLTC
The reactor type tap changers are predominant in the USA networks, while European tap changers use
resistors for circulating current limitation during the tap transition. These reactor OLTC constructions rely on
2
Preventive Autotransformers (PA) to limit this current, and provide double the number of tap positions,
compared with resistor ones, for the same number of taps brought-out from the regulating winding. The PA is a
gapped core reactor with dual windings, wound in opposite directions; in fact an additional smaller transformer
inside the main transformer tank. As the PA does not permit the current to circulate, a bridging position is
allowed with reactor OLTC indefinitely. For resistor types, the bridging “position” lasts only 5-20 msec. It is not
really a position, just a quick transition.
Dynamic Recording
Dynamic recording and measurement (DRM) test is an off-line, non-destructive test in which a DC current is
injected through a winding and tap changer as it moves through all of its positions. Results from the current
signatures recorded at a high sampling rate of at least 10kHz are examined and compared against previous tests
or similar-unit test results. Variations of this method may be called a Dynamic Resistance Measurement (the
same acronym DRM). However, here the resistance is measured in the static mode, while the transition graph is
recorded during the dynamic portion, i.e. transitions from tap to tap.
This test has been used to detect various problems such as slow transition time, discontinuity, contact
problems, and open circuits [1]. Major failures, as defined by CIGRE [2] or IEEE [3] such as a transformer
tripping out on gas relay, or minor failures, such as a problem detected during diagnostic testing and rectified
during maintenance, require pinpointing the cause of a problem (for major) or detecting (for minor) prior to
causing an environmental disaster. As outlined in the WECC meeting presentation [4], one in 20 tap changer
failures lead to a transformer main tank failure.
At TechCon USA in 2011 [5] this method was introduced for reactor type OLTCs, and in 2012 the paper
titled “TDA: Tap-changer Dual Assessment” [6] reported on the synergy between Dissolved Gas Analysis
(DGA), and dynamic test, and presented some interesting cases. This presentation outlines cases of dynamic
test in condition assessment of OLTCs.
The dynamic graph can be explained in simple terms: each time there is a change in the circuit, a drop in the
current trace is recorded. When the OLTC operates, resistors or reactors are introduced in the circuit and this is
recorded as ripples in the graph. One graph of a resistor tap changer is shown in the figure 1. The reactor graph
is shown in the figure 2. The difference in the overall shape or envelope of these graphs is due to the different
regulation principles used in the transformer construction. The figure 1 shows a fine-coarse regulation while the
figure 2 shows a plus-minus regulation connection.
Figure 1.
Dynamic graph of a resistor tap changer
fine-coarse regulation
Figure 2.
Dynamic graph of a reactor tap changer
plus-minus regulation
3
If the graphs are magnified using zoom function to see each transition of the tap changer, behavior of
resistors or reactors could be observed and analyzed. Figure 3 shows a transition of simple resistor tap changer
with two transition resistors. However, for heavier loads tap changers may employ four resistors to perform this
transition from tap to tap smoother. A transition graph of such a tap changer with 4 resistors is shown in the
figure 3. Another transitions, this time of a reactor tap changer is shown in the figure 4. Two traces are visible
there: the blue one is the test current, while the green one is the OLTC motor current trace. The motor current is
very useful parameter is diagnosing the OLTC performance.
The transition time is a time difference from the tap changer initial switching to the final position or
beginning of the recovery period on the graph. A ripple is expressed in percent (%) and represents a drop of
current value from the steady state during the tap change to its minimum.
Figure 3.
Resistance OLTC with 4 resistors, transition graph
Case Studies
Several case examples of OLTC failures detected using this powerful diagnostic method are provided in the
following text. They are from the knowledge base created by the AMforum working group on DRM for
OLTC[7]. The beauty of the method is that all problems are easily observed by simple visual analysis of the
test-current graph.
Figure 4.
Reactor tap changer – four transitions
Initial OLTC questionable conditions may be inferred from a DGA performed on a sample of oil from the tap
changer compartment. Any significant change in characteristic gas ratios (ethylene/acetylene or
4
ethane/methane) may point to a developing problem as per Weidmann guidelines outlined by N. Field[8].
Certain tap changer constructions may allow for better DGA diagnostics than the others, as explained by Hinz of
MR [9]. In all cases, using the DRM analysis incipient problems may be pinpointed to the exact phase or
particular switch, contact, or resistor.
Case 1 Coking on Transfer Switch (McGraw Edison 394)
A case of heavy coking on the lower stationary transfer switch of the phase X1 was detected by DRM, where
investigation was initiated based on increased DGA ratio results. The exact position of the troublesome switch
was indicated by carefully analyzing the DRM graphs of all three phases. The overlay of the phases X1 and X3
in the graph of Figure 5 shows the deviation of the phase X1 current line (in the red circle), pinpointing the
defect to the particular phase and operation of a particular transfer switch. The coking of the transfer switch is
visible on the photograph shown in Figure 6, courtesy of Ameren Corporation (an electric utility).
Figure 5.
DRM Trace Indicating Coking on a Transfer Switch
Figure 6.
Coking on the Left Phase TS is Obvious Compared with the Middle Phase
Case 2 Mechanism Defect (Elin Type S)
The analysis of tap changer motor current showed to be a powerful diagnostic tool to detect mechanical binding
and motor control malfunctions, as well as irregular operation around neutral where the reversal switch operates.
5
This case was detected by comparing the position of transition ripple on the motor current trace. Figure 7 shows
the motor current in green, and three ripples superimposed on the same graph. Two ripples are of the OLTC
operation before the repair, and the third ripple is the good one after the repair. The gear mechanism was
maladjusted, and quick adjustment of the gear box provided a simple corrective action.
Figure 7.
Motor Current and DRM Graphs of Good and Bad Transitions
Case 3 Jammed Spring (MR Type M)
The energy accumulator in an OLTC is a spring that is charged and once this energy is released, the spring
operates the tap changer at a very fast speed through the transition—usually around 50-60 milliseconds.
.
Figure 8.
Transition Time in Excess of 1 Second
6
Figure 8 shows a situation where the transition time was excessive—over 1 second. This created a lot of gasses
and tripped the transformer on the gas relay. Analysis of the DRM graph shows a problem with the diverter
speed of operation. Opening the diverter switch showed a bolt jammed in the energy accumulator that made it
operate at very low speed
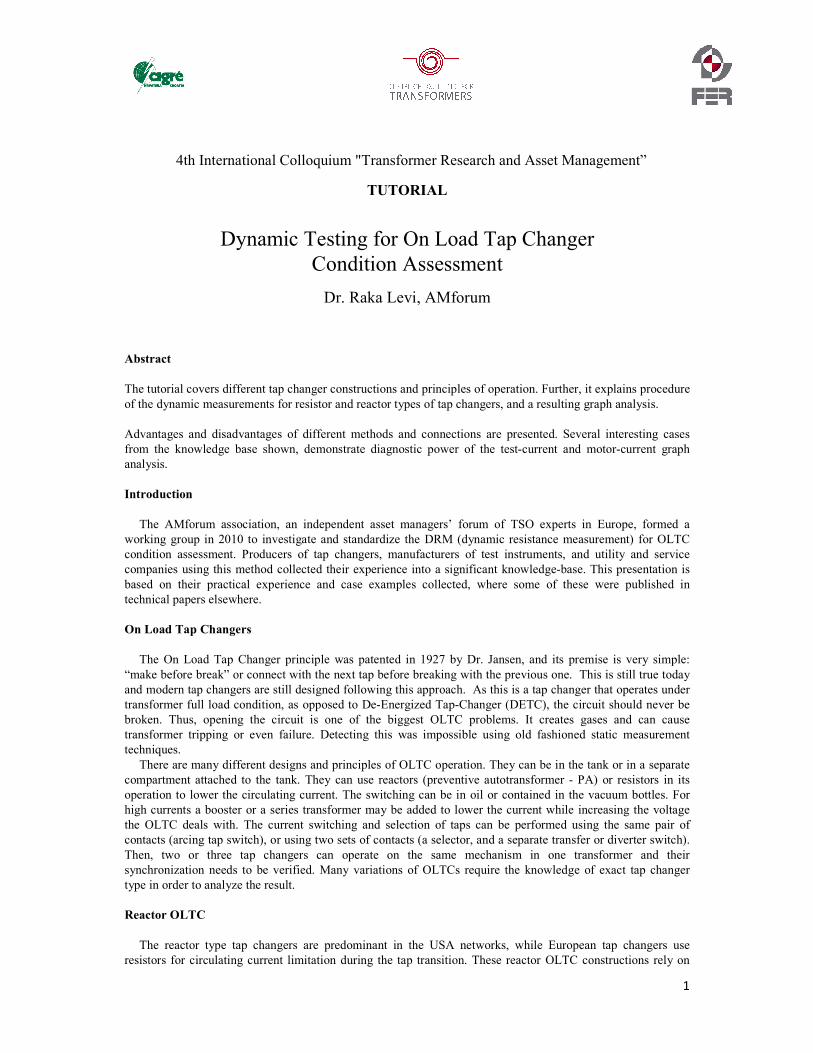
Case 4 Opening (MR Type D, Siemens TLH 21)
One of the biggest problems with on-load tap changers is when they don’t perform their “make before break”
duty. This means that a break in the circuit is opening the transformer winding while it is carrying a potentially
full load. The main patent claim of Dr. Jansen back in 1927 was that the OLTC should make with the next tap
before breaking from the previous one.
Figure 9.
The Second Resistor Does Not Make, Creating an Open Circuit
Figure 9 shows a case where the contact of one resistor did not make during the transition. The red trace on the
graph is the bad phase with the contact opening, or technically speaking Ripple=100%. The blue trace is a
reference ripple graph of a good phase on the same unit. This unit was tripping on the gas relay.
Detecting this type of opening in the circuit was not possible without the DRM method, and investigation
including opening the tap changer and visually looking for a problem would not provide the desired effect.
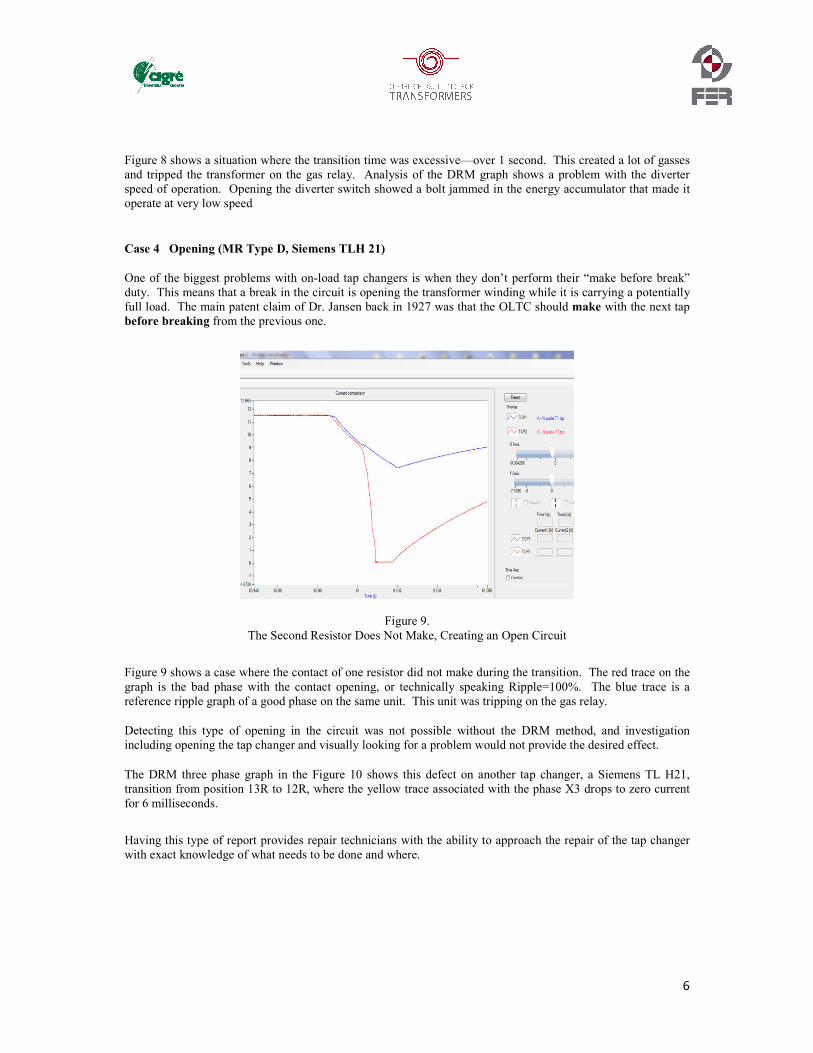
The DRM three phase graph in the Figure 10 shows this defect on another tap changer, a Siemens TL H21,
transition from position 13R to 12R, where the yellow trace associated with the phase X3 drops to zero current
for 6 milliseconds.
Having this type of report provides repair technicians with the ability to approach the repair of the tap changer
with exact knowledge of what needs to be done and where.
7
Figure 10.
X3 Current Dropping to Zero Indicates Opening of the Circuit
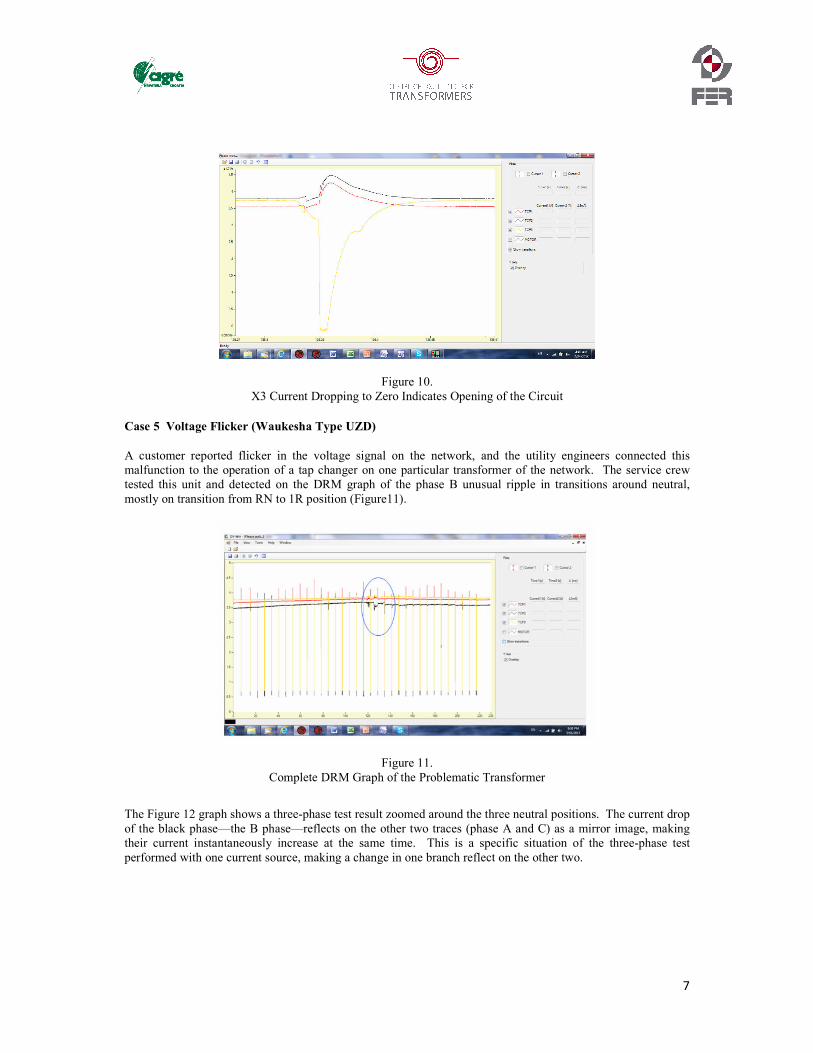
Case 5 Voltage Flicker (Waukesha Type UZD)
A customer reported flicker in the voltage signal on the network, and the utility engineers connected this
malfunction to the operation of a tap changer on one particular transformer of the network. The service crew
tested this unit and detected on the DRM graph of the phase B unusual ripple in transitions around neutral,
mostly on transition from RN to 1R position (Figure11).
Figure 11.
Complete DRM Graph of the Problematic Transformer
The Figure 12 graph shows a three-phase test result zoomed around the three neutral positions. The current drop
of the black phase—the B phase—reflects on the other two traces (phase A and C) as a mirror image, making
their current instantaneously increase at the same time. This is a specific situation of the three-phase test
performed with one current source, making a change in one branch reflect on the other two.
8
Figure 12.
Zoomed in Portion of the Graph in Figure 11 Around the Neutral Positions
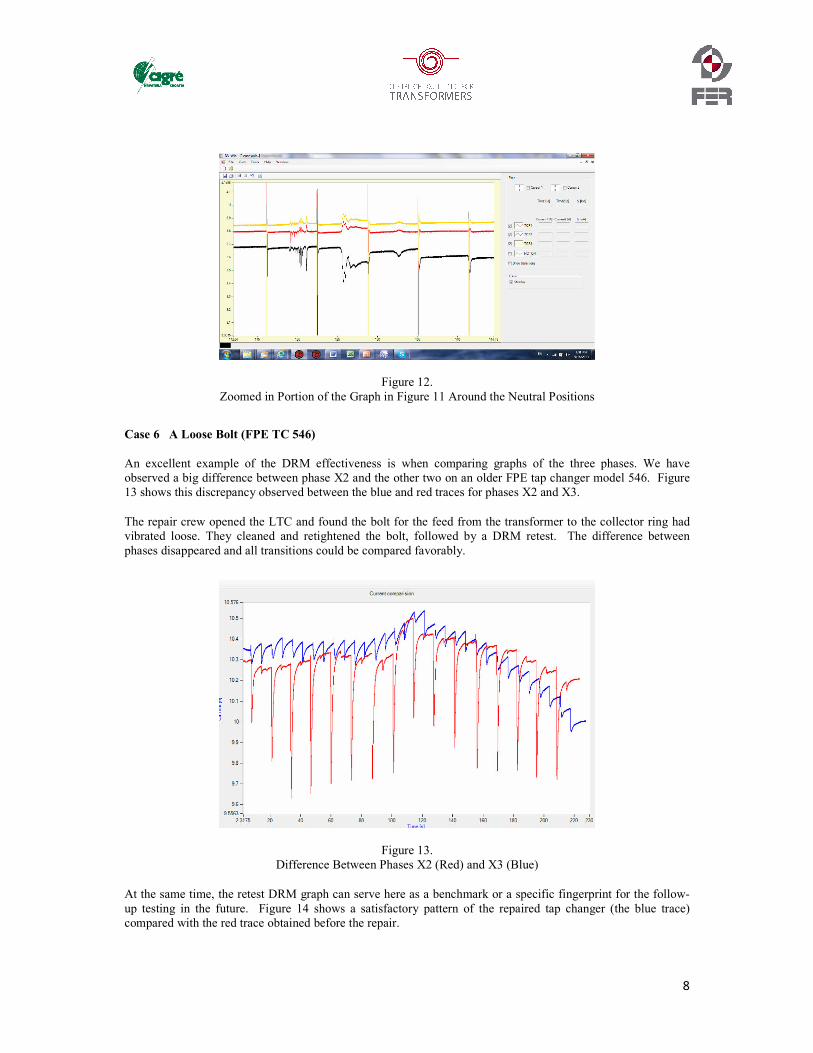
Case 6 A Loose Bolt (FPE TC 546)
An excellent example of the DRM effectiveness is when comparing graphs of the three phases. We have
observed a big difference between phase X2 and the other two on an older FPE tap changer model 546. Figure
13 shows this discrepancy observed between the blue and red traces for phases X2 and X3.
The repair crew opened the LTC and found the bolt for the feed from the transformer to the collector ring had
vibrated loose. They cleaned and retightened the bolt, followed by a DRM retest. The difference between
phases disappeared and all transitions could be compared favorably.
Figure 13.
Difference Between Phases X2 (Red) and X3 (Blue)
At the same time, the retest DRM graph can serve here as a benchmark or a specific fingerprint for the follow-
up testing in the future. Figure 14 shows a satisfactory pattern of the repaired tap changer (the blue trace)
compared with the red trace obtained before the repair.
9
Figure 14.
DRM Graphs of Phase X2 Before and After Repair
The difference between ripple shapes on graphs of Figures 14 and 15 is due to the fact that DRM testing was
performed in direction from 16L to 16R position, while the other one in opposite direction from 16R to 16L. For
that reason, when recording DRM graphs for a fingerprinting purpose, it is always recommended to obtain
records of both directions, “up” and “down.”
Case 7 Undesired Arcing of a Tap Changer
If a layer of coke or any other insulating film material is preventing normal current flow through the OLTC, an
arc will occur. This happens especially in a design where a moving contact slides over the fixed one while the
other is being opened by the diverter, as shown in Figure 16. We have recorded the DVtest graph in a situation
where arcing was present, and this can be seen as very long ripple traces in Figure 15.
Those four abnormal ripples shown in Figure 15 are created when the tap changer was operated in both up and
down directions two times to verify the problem.
Figure 15.
DVtest Graph Showing Longer Than Normal Ripple Due to an Arc
10
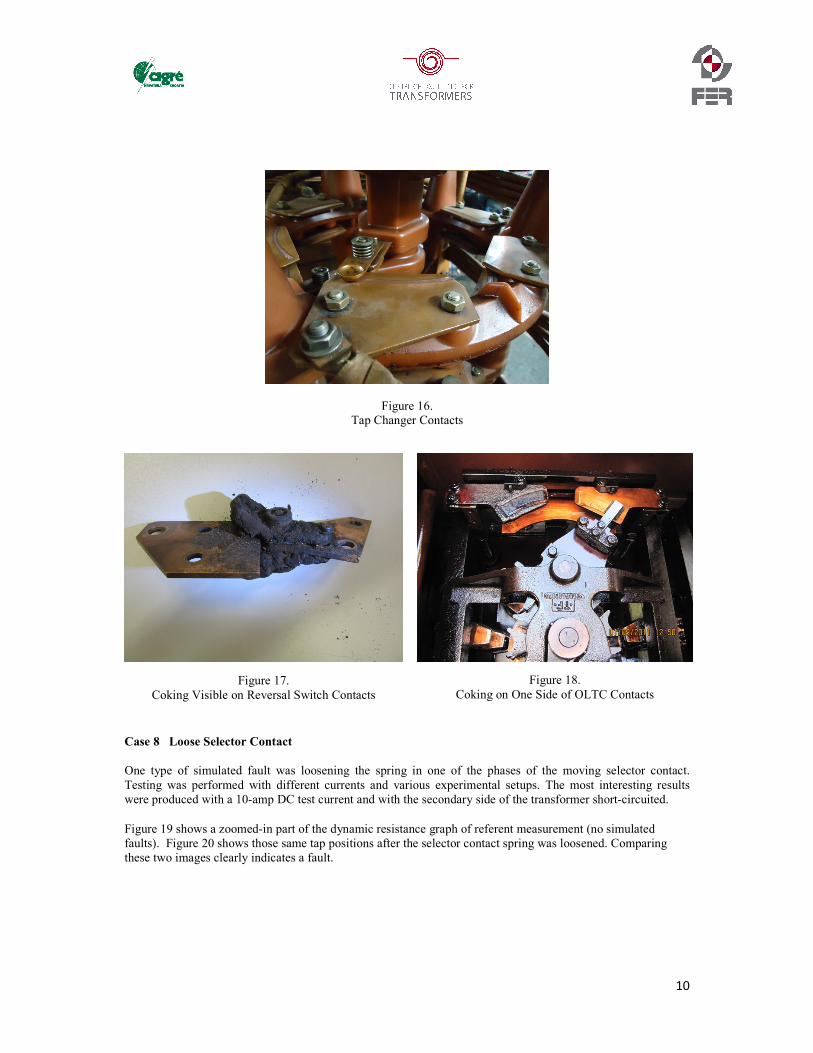
Figure 16.
Tap Changer Contacts
Figure 17.
Coking Visible on Reversal Switch Contacts
Figure 18.
Coking on One Side of OLTC Contacts
Case 8 Loose Selector Contact
One type of simulated fault was loosening the spring in one of the phases of the moving selector contact.
Testing was performed with different currents and various experimental setups. The most interesting results
were produced with a 10-amp DC test current and with the secondary side of the transformer short-circuited.
Figure 19 shows a zoomed-in part of the dynamic resistance graph of referent measurement (no simulated
faults). Figure 20 shows those same tap positions after the selector contact spring was loosened. Comparing
these two images clearly indicates a fault.
11
Figure 19.
Coking Visible on Reversal Switch Contacts
Figure 20.
OLTC with Faulty Moving Selector Contacts
Case 9 Misadjusted Changeover Selector Contacts
On the MW350, changeover selector contacts were found to be misadjusted. They would not connect
at the right moment during the neutral switching from raised to lowered. The DRM graph of two
phases showed discontinuity, while the third phase shown in Figure 21 below indicated
overwhelmingly long transition time. The difference between the other two transitions on the graph
(circled in red) is easily observable. Following a proper adjustment, the DRM graph looked completely
normal without any singularities.
Figure 21.
Neutral Transition Different from the Adjacent Ones
Figure 22.
Following the Repair, a Normal Graph Was Recorded
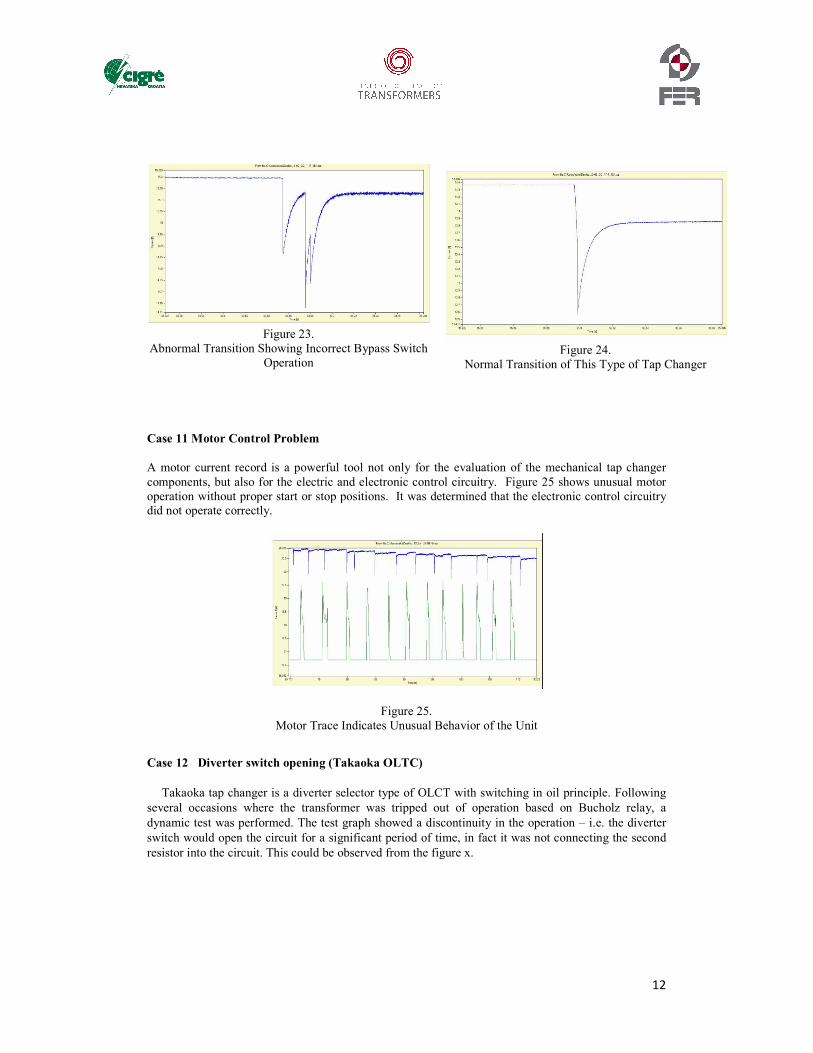
Case 10 Gassing Vacuum Tap Changer
A reactance tap changer with bypass switches and vacuum interrupters should not produce any gassing
during the operation. Following a gassing alarm, we performed the test on this tap changer. Bypass
switch operation was not synchronized with the vacuum interrupter operation.
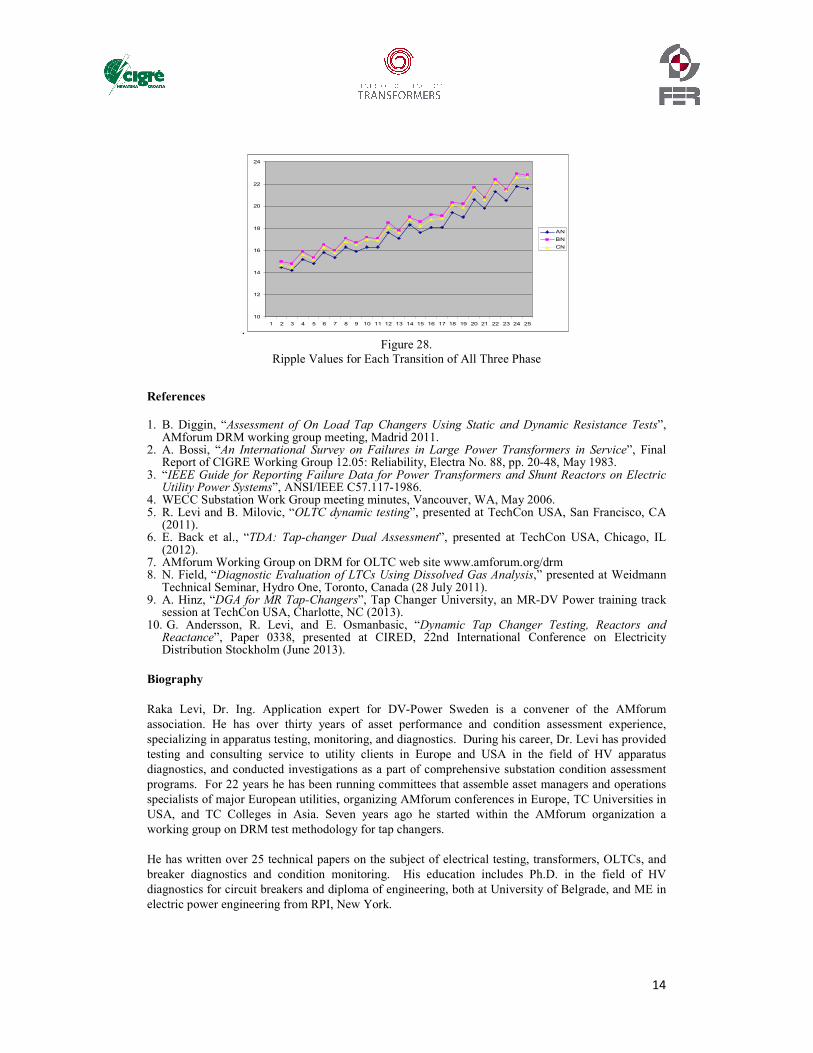
Ripple Values for Each Transition of All Three Phase
References
1. B. Diggin, “Assessment of On Load Tap Changers Using Static and Dynamic Resistance Tests”, AMforum DRM working group meeting, Madrid 2011.
2. A. Bossi, “An International Survey on Failures in Large Power Transformers in Service”, Final Report of CIGRE Working Group 12.05: Reliability, Electra No. 88, pp. 20-48, May 1983.
3. “IEEE Guide for Reporting Failure Data for Power Transformers and Shunt Reactors on Electric Utility Power Systems”, ANSI/IEEE C57.117-1986.
4. WECC Substation Work Group meeting minutes, Vancouver, WA, May 2006. 5. R. Levi and B. Milovic, “OLTC dynamic testing”, presented at TechCon USA, San Francisco, CA
(2011). 6. E. Back et al., “TDA: Tap-changer Dual Assessment”, presented at TechCon USA, Chicago, IL
(2012). 7. AMforum Working Group on DRM for OLTC web site www.amforum.org/drm 8. N. Field, “Diagnostic Evaluation of LTCs Using Dissolved Gas Analysis,” presented at Weidmann
Technical Seminar, Hydro One, Toronto, Canada (28 July 2011). 9. A. Hinz, “DGA for MR Tap-Changers”, Tap Changer University, an MR-DV Power training track
session at TechCon USA, Charlotte, NC (2013). 10. G. Andersson, R. Levi, and E. Osmanbasic, “Dynamic Tap Changer Testing, Reactors and
Reactance”, Paper 0338, presented at CIRED, 22nd International Conference on Electricity Distribution Stockholm (June 2013).
Biography
Raka Levi, Dr. Ing. Application expert for DV-Power Sweden is a convener of the AMforum
association. He has over thirty years of asset performance and condition assessment experience,
specializing in apparatus testing, monitoring, and diagnostics. During his career, Dr. Levi has provided
testing and consulting service to utility clients in Europe and USA in the field of HV apparatus
diagnostics, and conducted investigations as a part of comprehensive substation condition assessment
programs. For 22 years he has been running committees that assemble asset managers and operations
specialists of major European utilities, organizing AMforum conferences in Europe, TC Universities in
USA, and TC Colleges in Asia. Seven years ago he started within the AMforum organization a
working group on DRM test methodology for tap changers.
He has written over 25 technical papers on the subject of electrical testing, transformers, OLTCs, and
breaker diagnostics and condition monitoring. His education includes Ph.D. in the field of HV
diagnostics for circuit breakers and diploma of engineering, both at University of Belgrade, and ME in