Interservice/Industry Training, Simulation, and Education Conference (I/ITSEC) 2016 2016 Paper No. 16248 Page 1 of 11 Dynamic Trend Detection in U.S. Border Security Social-Media Networks Wingyan Chung BingBing Rao, Liqiang Wang Institute for Simulation and Training University of Central Florida Department of Computer Science University of Central Florida Orlando, Florida Orlando, Florida [email protected][email protected], [email protected]ABSTRACT Detecting temporal trends in large networks has strategic importance in many domains, such as cybersecurity and social media analytics, where the activities of key actors (e.g., activists, terrorists, leaders) are concerned. In a large evolving network, the relationships of actors in the network often change over time. Characterizing these changes can provide important insight on individual- and group-level activities. This insight can inform situational understanding and intelligence analysis in the cyber domain. This research developed and validated a dynamic network activity model to characterize temporal trends in a large social-media network of interactive human agents. The model supports prediction of agent activities over time through modeling agents’ network interactions and network growth. We argue that large social-media networks exhibit significant effects of randomness and exponential growth due to community size, low connection cost, and high reachability. To study its predictive accuracy, the model was compared against an existing model that is based on exponential aggregation of agent activities. The two models were validated using a social-media community focused on U.S. border and immigration security. The community consists of 210,921 human agents who posted 533,246 messages and formed 453,552 links among agents. Temporal networks were extracted from the community, where each network captures a pre-defined temporal length of activities. Each model was used to predict activities of human agents given their historical activity levels. We implemented these prediction using Apache Spark, a distributed big- data platform, and its graph computation package, GraphX. The experimental results show that the proposed model achieved significantly better accuracy than the baseline model. This research should contribute to providing new approaches and system artifacts for dynamic trend detection in social-media networks, reporting new findings of network trend detection, and providing new technical approaches to process large graph-based data. ABOUT THE AUTHORS Dr. Wingyan Chung is an Associate Professor in the Institute for Simulation and Training at the University of Central Florida. His scholarly interests and expertise include cybersecurity, social media analytics, business intelligence, data and text mining, Web analytics, knowledge management, information visualization, and human-computer interaction. His research addresses challenges in managing big data in organizations by designing, developing, and evaluating new IT solutions. He received multiple honors and awards, such as NSF research grants, Outstanding Researcher Award, Outstanding Performance Award, Best Research Paper Award, and DARPA Young Investigators Initiative Award. Mr. BingBing Rao is pursuing a Ph.D. degree in Computer Science at the University of Central Florida. He received a B.S. degree in Electrical and Information Engineering from Wuhan University of Science and Technology and the second B.S. from Huazhong University of Science and Technology. He has received the "22th R&D Honor Award" for independently developing DMA module and for optimizing code and improving system performance in MacroSAN, China. Dr. Liqiang Wang is an Associate Professor in the Department of Computer Science at the University of Central Florida. His research interest is the design and analysis of parallel systems for big-data computing. For design, he works on optimizing performance, scalability, resilience, and load balancing of data-intensive computing, especially on Cloud, GPU, and multicore platforms. For analysis, he focuses on using program analysis to detect programming errors and performance defects in large-scale parallel computing systems. He received NSF CAREER Award, Castagne Faculty Fellowship, and NSFC Overseas Scholars Collaborative Research Award.
Transcript
Interservice/Industry Training, Simulation, and Education Conference (I/ITSEC) 2016
2016 Paper No. 16248 Page 1 of 11
Dynamic Trend Detection in U.S. Border Security Social-Media Networks
Wingyan Chung BingBing Rao, Liqiang Wang Institute for Simulation and Training
University of Central Florida
Department of Computer Science University of Central Florida
Detecting temporal trends in large networks has strategic importance in many domains, such as cybersecurity and social media analytics, where the activities of key actors (e.g., activists, terrorists, leaders) are concerned. In a large evolving network, the relationships of actors in the network often change over time. Characterizing these changes can provide important insight on individual- and group-level activities. This insight can inform situational understanding and intelligence analysis in the cyber domain. This research developed and validated a dynamic network activity model to characterize temporal trends in a large social-media network of interactive human agents. The model supports prediction of agent activities over time through modeling agents’ network interactions and network growth. We argue that large social-media networks exhibit significant effects of randomness and exponential growth due to community size, low connection cost, and high reachability. To study its predictive accuracy, the model was compared against an existing model that is based on exponential aggregation of agent activities. The two models were validated using a social-media community focused on U.S. border and immigration security. The community consists of 210,921 human agents who posted 533,246 messages and formed 453,552 links among agents. Temporal networks were extracted from the community, where each network captures a pre-defined temporal length of activities. Each model was used to predict activities of human agents given their historical activity levels. We implemented these prediction using Apache Spark, a distributed big-data platform, and its graph computation package, GraphX. The experimental results show that the proposed model achieved significantly better accuracy than the baseline model. This research should contribute to providing new approaches and system artifacts for dynamic trend detection in social-media networks, reporting new findings of network trend detection, and providing new technical approaches to process large graph-based data.
ABOUT THE AUTHORS Dr. Wingyan Chung is an Associate Professor in the Institute for Simulation and Training at the University of Central Florida. His scholarly interests and expertise include cybersecurity, social media analytics, business intelligence, data and text mining, Web analytics, knowledge management, information visualization, and human-computer interaction. His research addresses challenges in managing big data in organizations by designing, developing, and evaluating new IT solutions. He received multiple honors and awards, such as NSF research grants, Outstanding Researcher Award, Outstanding Performance Award, Best Research Paper Award, and DARPA Young Investigators Initiative Award. Mr. BingBing Rao is pursuing a Ph.D. degree in Computer Science at the University of Central Florida. He received a B.S. degree in Electrical and Information Engineering from Wuhan University of Science and Technology and the second B.S. from Huazhong University of Science and Technology. He has received the "22th R&D Honor Award" for independently developing DMA module and for optimizing code and improving system performance in MacroSAN, China. Dr. Liqiang Wang is an Associate Professor in the Department of Computer Science at the University of Central Florida. His research interest is the design and analysis of parallel systems for big-data computing. For design, he works on optimizing performance, scalability, resilience, and load balancing of data-intensive computing, especially on Cloud, GPU, and multicore platforms. For analysis, he focuses on using program analysis to detect programming errors and performance defects in large-scale parallel computing systems. He received NSF CAREER Award, Castagne Faculty Fellowship, and NSFC Overseas Scholars Collaborative Research Award.
Interservice/Industry Training, Simulation, and Education Conference (I/ITSEC) 2016
2016 Paper No. 16248 Page 2 of 11
Dynamic Trend Detection in U.S. Border Security Social-Media Networks
Wingyan Chung BingBing Rao, Liqiang Wang Institute for Simulation and Training
University of Central Florida
Department of Computer Science University of Central Florida
INTRODUCTION Detecting temporal trends in large networks has strategic importance in many domains. For instance, intelligence agencies examine organized networks of cyber-criminals to detect criminal activity trends. E-commerce marketers study customer networks to detect changes in consumer tastes and preferences. The U.S. border security agents analyze network relationships to identify terrorist activities and border crimes. Social media has emerged as an important source of intelligence in recent years (Tayouri, 2016) and is identified as one of three major elements in “the enemy’s battle terrain” in the complex cyber-environment (Section 9.4 of (Marble et al., 2015)). The relationships among actors in social media (SM) networks can reveal their affiliations and activities, which often change over time as new events and actors emerge. Gaining insight into these evolving SM network activities can help intelligence officers and security experts (among others) to stay abreast of the latest threats in the cyberspace. The intelligence can reveal potential development of adversarial online campaigns and can be used to project future trends. The result is also useful for training cyber-intelligence personnel and for conducting simulation to enhance cyber-situational understanding. Despite these benefits, there is scarce work in dynamic SM network trend detection. Social media analytics has been developed in many domains where SM data are available, such as product marketing, health informatics, national security, and intelligence gathering (Zeng, Chen, Lusch, & Li, 2010). A common feature of these domains is the dynamic nature of the data obtained in their social networks, such as customer networks, patient communities, and terrorist networks. Dynamic network analysis is a growing research area due to its multidisciplinary connections with social science, network analysis, and predictive analytics. Existing research on dynamic SM network trend detection focus on influence identification, modeling, and prediction. As computational power increases, graph analytics is increasingly used to facilitate complex calculation of graph metrics. However, research on dynamic trend detection in social networks is relatively scarce. This paper addresses the needs to accurately predict user activities in large-scale social networks. These needs arise from growing volume and velocity of intelligence gathering from online channels such as social media and forums. Specifically, we developed a new dynamic network prediction model that characterizes user interactions as they form relationships over time in networks. We implemented the models in a distributed computing environment and empirically evaluated the two models in terms of their predictive accuracy. The results should shed light on dynamic trend detection in social media networks and should be relevant to intelligence analysts, social network researchers, and border security practitioners. RELATED WORK In this section, we review related works on social media analytics, social network dynamics, and graph computation on social networks. Social media analytics is a growing field of importance to policy makers, intelligence analysts, and social researchers. Network dynamics, a specialty area in social network analysis, examines changes of network
Interservice/Industry Training, Simulation, and Education Conference (I/ITSEC) 2016
2016 Paper No.16248 Page 3 of 11
Social Media Analytics Social media analytics (SMA) is a rich set of tools and technologies most recently applied to various domains (Zeng et al., 2010). Traditional domains include business intelligence, online product review analysis, and security informatics (Chen, Chiang, & Storey, 2012; Chung, 2014; Chung & Tseng, 2012). Sentiment analysis and emotion extraction are important tools for understanding large amounts of social media data (Fan & Gordon, 2014; Feldman, 2013). Analyzing networks of users and user relationships has drawn much attention from researchers. Centrality computation, influence identification, and community structure analysis are some of the areas studied in recent research (Probst, Grosswiele, & Pfleger, 2013). A basic approach to identifying influence is to count the number of social actions taken by other people in response to one’s published message. For example, one study measured influence by counting the number of replies and retweets in Twitter, and exposure was measured by observing the tendency of a user to respond to another user and found that influence is highly concentrated among the top 1 percent of users (Berger & Strathearn, 2013). Follower count, reply count, and retweet count were also used to measure influence (Ye & Wu, 2010). Ratios calculated based on these counts and on user interaction were used to measure “social network potential” of users (Anger & Kittl, 2011). The interaction was studied on Facebook to reveal emotional contagion without direct human contact and nonverbal cues (Kramer, Guillory, & Hancock, 2014). These works illustrate the importance of examining user influence in a networked environment, and also bring up new questions on studying changes of influence over time. Temporal Network Dynamics in Emerging Media and Human Communities A rapidly growing field, temporal network dynamics is a confluence of social computing, network analysis, and predictive analytics. Researchers have developed dynamic influence models to study social learning and networking using fine-grained data obtained from social media websites and mobile devices (Pan et al., 2012). Influence is modeled as conditional dependence between entity’s current state and previous states based on a Markovian assumption. In another research, researchers developed two classes of dynamic network metrics, namely, emergence and persistence, and applied three widely-used models to predict network activities over time (Wei & Carley, 2015). Exponential aggregation model was found to outperform two other models (average aggregation and linear aggregation models) in predicting network activities. Studying the stability of network nodes, researchers have developed a method to identify active valuable nodes based on their static structural properties and spatio-temporal behavioral attributes extracted from the nodes’ activity records (Qiu, Li, & Li, 2014). Their experiments on two online social networks with thousands of nodes showed that the method identified valuable nodes in terms of node stability and influence. Another paper describes a simple probabilistic model to capture the probability of tweet-retweet-follow (TRF) events, which tend to co-evolve when social-media networks change over time (Antoniades & Dovrolis, 2015). The model provides descriptive statistics on TRF events but falls short of predictive power. These studies covered different aspects of temporal network dynamics and provided experimental results of testing real-world social networks. However, most studies tend to be descriptive and lack predictive capability of future network user activities, especially in social media networks of importance to international security. There is a lack of temporal models for dynamic trend modeling. More studies on dynamic SM network analysis are thus needed. Graph Analytics on Social Networks Social network analysis (SNA) is a broad strategy for investigating social structures based on the knowledge of network and graph theories (Otte & Rousseau, 2002). It uses the terms of vertices (individual people, actors, or nodes in the network and organizations) and the edges (ties, relationships or interactions between vertices) to represent the structure of a social community. Social and other networks are conveniently presented as a graph G = {V, E}, in which V represents the list of vertices and E represents a set of edges, each describing the interactions between a pair of vertices. We can define some kinds of objects attached to each vertex and edge to describe their characters and relationships between the vertices. We call this feature a property graph (Robinson, Webber, & Eifrem, 2015), which is derived from real-world phenomena such as social network and web graphs that have power-law degree distributions and orders of magnitude more edges than vertices (Leskovec, Lang, Dasgupta, & Mahoney, 2009). In response to the growing scalability and importance of graph data, numerous specialized graph processing systems have been developed, which include Pregel (Malewicz et al., 2010), GraphLab (Low et al., 2014) and PowerGraph (Gonzalez, Low, Gu, Bickson, & Guestrin, 2012). Pregel and GraphLab represent the vertex-centric computation model, in which vertex-programs defined by users can run iteratively and interact with neighbors along edges in the
Interservice/Industry Training, Simulation, and Education Conference (I/ITSEC) 2016
2016 Paper No.16248 Page 4 of 11
graph. PowerGraph is an optimized graph-parallel abstraction module based on the vertex-centric computation module, which splits the vertex-program into three data-parallel stages: Gather, Apply, and Scatter. In the Gather phase, the information about adjacent vertices and edges is collected. The framework will use the output of the Gather phase to update the state of central vertex in the Apply stage. Finally, Scatter distributes the new state of the central vertex to its in- or out- edges and update their data. Unfortunately, these novel and powerful graph-parallel computation frameworks are not yet applicable to the problem of graph construction and transformation in iterative graph computations. In order to address the challenges of data ETL (preprocessing and construction), we use Spark GraphX (Xin, Gonzalez, Franklin, & Stoica, 2013), which is an embedded graph processing system built on the top of Apache Spark (Zaharia, Chowdhury, Franklin, Shenker, & Stoica, 2010), to handle large-scale distributed social network graphs. In GraphX, we can use the perspective of general-purpose dataflow operations (e.g., map, join, and reduce) to express graph computation and graph algorithms (e.g., PageRank, Connected Components, and Shortest Paths) in a data-parallel abstraction efficiently (Gonzalez et al., 2014). In our implementation, we used Apache Spark to build a graph at each timestamp and execute the predictive models in parallel; in the network interaction model (described below), we used the GraphX API to re-construct a new graph based on the forecasting strategies. There are many metrics to measure the activity of a vertex in a graph or the influence between the vertices, such as density, degree, centrality, and clustering coefficient (Jackson, 2008; Scott, 2000). In this paper, we focus on Betweenness Centrality (BC) (Freeman, 1977) of a vertex to evaluate the performance of two predictive models. Betweenness Centrality is an indicator of a node's connectivity in a graph, which is measured by the number of shortest paths from all vertices to all others that pass through that node. Vertices with a high BC play an important role of connecting different groups. TEMPORAL MODELS FOR DYNAMIC TREND DETECTION IN SOCIAL-MEDIA NETWORKS The research on temporal models for dynamic network trend modeling has not been widely investigated. As social media are increasingly used in studying phenomena of importance to cyber security, examining trends in temporal SM networks has strategic importance to intelligence analysts and social researchers. In this research, we developed a new temporal network activity model, named “Network Interaction Model with Random Link Formation” to predict agent activities. We compared it with the benchmark model named “Exponential Aggregation Model.” These two models are described below. Exponential Aggregation Model The baseline model is the exponential aggregation model (EAM) developed by (Wei & Carley, 2015). The idea is to use a single exponential smoothing formula to predict agents’ activities at time t+1, given all the agents’ activities from all time steps at and before t. The transmission parameter (or smoothing parameter), a, controls the extent to which recent data are used in predicting future activities (when a approaches 1, recent data are weighed more heavily; when a approaches 0, older data are weighed more heavily). Network Interaction Model with Random Link Formation The network interaction model (NIM) attempts to create a simulated network of human agents based on the most recent known network configuration and a process that simulates randomness of agent interaction. Table 1 shows the steps of the model, which also uses the betweenness centrality formula to predict individual agents’ activities. While other centrality measures exist, we chose betweenness centrality because it offers robust representation of agents based on their positions and connectivity in a network (Freeman, 1977).
Interservice/Industry Training, Simulation, and Education Conference (I/ITSEC) 2016
2016 Paper No.16248 Page 5 of 11
Table 1. The high-level procedure of the Network Interaction Model
Steps of the Network Interaction Model
1. Initiation: Identify existing network’s configuration (numbers of human agents and relationships) at time t, and the time frame (w days) before t during which agent activities are considered in activity prediction.
2. Simulation of Network for time (t+1): based on existing network, predict the configuration (numbers of human agents and relationships) of the network at (t+1) by using a single exponential smoothing procedure. a. Derive the density of the network at time (t+1) based on the predicted network configuration.
b. Based on a random process of network interaction of agents, add or delete agents to the network. The
random process preserves the predicted network configuration while models randomness of interaction.
3. Predict activities of agents using the betweenness centrality formula (Freeman, 1977; Jackson, 2008):
EVALUATION OF THE MODELS To study the predictive performance, we compared the network interaction model (NIM) against the baseline model (EAM) of agent activities. The two models were validated using a social-media community focused on U.S. border and immigration security. The community consists of 210,921 human agents who posted 533,246 messages and formed 453,552 links among agents. Temporal SM networks were extracted from the community. Each network captures the past w days of activities, where w is the window size used in the experiment. Both EAM (Wei & Carley, 2015) and NIM were used to predict the activity of each agent at time t+1 in parallel. The experimental setup and evaluation methods are described below. Experimental Setup In our experiment, we used Apache Spark 1.5.1 (Zaharia et al., 2010) and Spark GraphX (Gonzalez et al., 2014) to implement two predictive models. The experiment was conducted in the following environment. 1. Hardware: Apache Spark Cluster consists one master which is Dell PowerEdge 2970 Server (Intel Xeon CPU
5160 @ 3.00GHz, 16GB main memory with 667MHz and 1 GigE Ethernet) and seven slaves which are Dell Optiplex 960 Servers (Intel Core 2 Duo CPU E8500 @ 3.16GHz, 8GB main memory with 667MHz and 1 GigE Ethernet).
Density of Network g
D(g) =Number of links in Network g
Maximum possible number of links in Network g
(1)
Betweenness Centrality of Node i
CeBi (g) =X
k 6=j:i/2{k,j}
Pi(kj)
P (kj)(2)
where
g = An undirected, unweighted network of participants represented as an
adjacency matrix
gij =
⇢1 if node i links with node j0 otherwise
n = Number of nodes in g
Ni(g) = Neighborhood of node i (set of nodes that i is linked to)
Pi(kj) = Number of geodesics (shortest paths) between node k and node j
Interservice/Industry Training, Simulation, and Education Conference (I/ITSEC) 2016
2016 Paper No.16248 Page 6 of 11
2. Dataset: The dataset consists of 533,246 messages collected from Twitter during May-August of 2013. The messages focus on the U.S. border security and immigration discussion. To build the data collection, we constructed carefully a list of queries by reviewing a list of literature published on the topic (Bush, McLarty III, & Alden, 2009; Gans, Replogle, & Tichenor, 2012; LeMay, 2004; U.S. Commission on Immigration Reform, 1994). Filtering and collection testing helped to reduce the original 14 queries to 8 domain-specific queries: “comprehensive immigration reform,” “illegal alien,” “illegal immigration,” “immigration debate,” “immigration policy,” “immigration reform,” “US border security,” and “US immigration.” Following Twitter’s guidelines of data collection, our automated system continually collected 4,773 tweets per day using the selected queries and then performs analysis on the data. Through the steps of searching, retrieving, parsing, filtering, and storing, the process converts unstructured social media data into a collection of structured social media data that are organized into messages, users, message-term associations, links, networks, and user-network associations.
To identify networks within the community, we model users as network nodes (or graph vertices) and user interaction as network links (or graph edges). A node in the network represents a user; a link represents an interaction between two users. The system identifies a link between User A and User B when User A sends a tweet targeted to User B, or re-tweets another tweet written by User B, or modifies and then sends out a tweet written by User B. Because user interaction changes over time, the user interaction network is changed as time progresses. We define an interaction window as a specific time frame. This time frame is a sliding window of a pre-defined number (w) of days. Our system automatically constructs a new user interaction network for most recent interaction window. We used several metrics to identify importance of users in a network and the overall characteristics of the network (Jackson, 2008; Wasserman & Faust, 1994). Degree measures the number of connections that a user has in a network. Density measures the proportion of the number of connections in a network to the maximum possible number of connections in the network. To assess the activity of a user, we used betweenness centrality (BC) that measures how well situated a node is in terms of the paths that it lies on. While other measures of centrality are available (Freeman, 1977; Jackson, 2008), BC identifies the extent to which a user serves as a bridge in the border security discussion, which heavily relies on the ability to find compromises and common grounds in participants of highly polarized views. We used a moving window (w) to obtain nodes (and their links) from the dataset to define temporal SM networks {G1, G2, …, Gn}. Each SM network (Gt) consists of user agents (nodes) who posted tweets during the time frame from t-w+1 to t (temporal granularity was day; each agent’s daily activity level was measured). A network link represents an interaction between two agents during the time frame (see description above). For each graph, we invoked the JUNG 2.0.1 API to calculate the BC value of each agent in the temporal SM network. The BC score represents the activity of an agent in bridging other users in the SM network of border security discussion, thus serving as the gold standard to evaluate our predictive models’ performance. Because the moving window separates SM networks of time steps t-w+1, t-w+2, …, t, we used Spark to perform calculations for each graph in parallel to achieve efficient prediction in large SM networks such as ours. Our implementation computed the daily BC scores of each agent and the numbers of vertices and edges from different temporal SM networks. Then we used EAM (Wei & Carley, 2015) and NIM (see Table 1) independently to predict the activity of each agent at time t+1. Finally, we evaluated the accuracies of the two predictive models by comparing their results with the gold standard (BC scores). Figure 1 illustrates the procedure of the experiment.
Interservice/Industry Training, Simulation, and Education Conference (I/ITSEC) 2016
Performance Evaluation Recently, there is increasing research work to find the most appropriate performance measures to evaluate predictive methods (Armstrong, 2001). In this paper, we tested three different evaluation metrics: Root Means Square Error (RMSE), Symmetric mean absolute percentage error (SMAPE) (Makridakis, 1993) and Logarithmic Median Absolute Percentage Error (LMAPE) to measure the accuracy of the predictive models. In the following formulas, At,i means that the actual BC score of agent i at time t, Ft,i represents its predicted value, and n represents the number of agents in the SM network. Root Mean Square Error (RMSE): it is a frequently used measure of the differences between values (sample and population values) predicted by a model or an estimator and the values actually observed and defined as follows:
Symmetric Mean Absolute Percentage Error (SMAPE): it is a variant of Mean Absolute Percentage Error (MAPE) to fix the deviation in error caused by the form “one divided by zero” and is defined as follows:
Logarithmic Median Absolute Percentage Error (LMAPE): To address the weaknesses of Mean Absolute Percentage Error (MAPE) (Tofallis, 2014), we developed a new metric by applying natural logarithmic smoothing to the actual and predictive values and by using the geometric mean of actual value. The formula is defined as follows:
RMSE(t) =
vuutnP
i=1(At,i � Ft,i)2
n(3)
SMAPE(t) =1
n
nX
i=1
��At,i � Ft,i
��(At,i + Ft,i)/2
(4)
LMAPE(t) =1
n
nX
i=1
��� ln(At,i)� ln(Ft,i)���
GM(At,i), where GM(At,i) =
nY
i=1
At,i
!1/n
(5)
ApacheSparkGraphX
Interservice/Industry Training, Simulation, and Education Conference (I/ITSEC) 2016
2016 Paper No.16248 Page 8 of 11
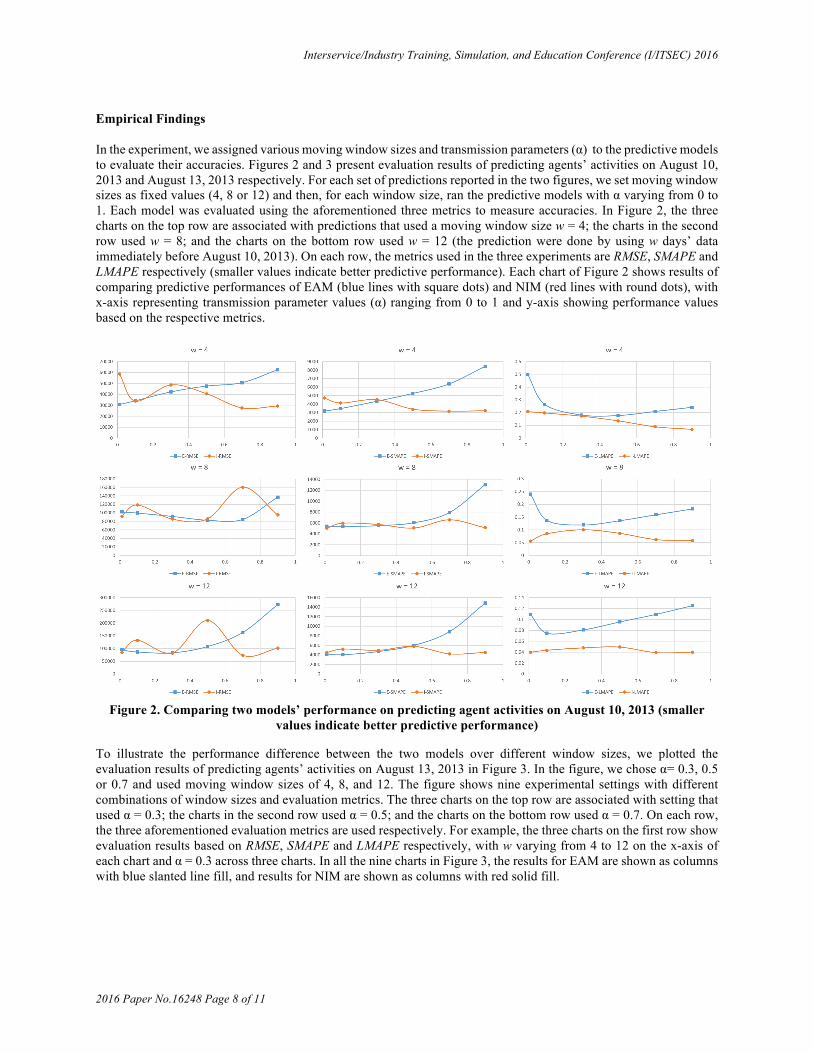
Empirical Findings In the experiment, we assigned various moving window sizes and transmission parameters (α) to the predictive models to evaluate their accuracies. Figures 2 and 3 present evaluation results of predicting agents’ activities on August 10, 2013 and August 13, 2013 respectively. For each set of predictions reported in the two figures, we set moving window sizes as fixed values (4, 8 or 12) and then, for each window size, ran the predictive models with α varying from 0 to 1. Each model was evaluated using the aforementioned three metrics to measure accuracies. In Figure 2, the three charts on the top row are associated with predictions that used a moving window size w = 4; the charts in the second row used w = 8; and the charts on the bottom row used w = 12 (the prediction were done by using w days’ data immediately before August 10, 2013). On each row, the metrics used in the three experiments are RMSE, SMAPE and LMAPE respectively (smaller values indicate better predictive performance). Each chart of Figure 2 shows results of comparing predictive performances of EAM (blue lines with square dots) and NIM (red lines with round dots), with x-axis representing transmission parameter values (α) ranging from 0 to 1 and y-axis showing performance values based on the respective metrics.
Figure 2. Comparing two models’ performance on predicting agent activities on August 10, 2013 (smaller
values indicate better predictive performance)
To illustrate the performance difference between the two models over different window sizes, we plotted the evaluation results of predicting agents’ activities on August 13, 2013 in Figure 3. In the figure, we chose α= 0.3, 0.5 or 0.7 and used moving window sizes of 4, 8, and 12. The figure shows nine experimental settings with different combinations of window sizes and evaluation metrics. The three charts on the top row are associated with setting that used α = 0.3; the charts in the second row used α = 0.5; and the charts on the bottom row used α = 0.7. On each row, the three aforementioned evaluation metrics are used respectively. For example, the three charts on the first row show evaluation results based on RMSE, SMAPE and LMAPE respectively, with w varying from 4 to 12 on the x-axis of each chart and α = 0.3 across three charts. In all the nine charts in Figure 3, the results for EAM are shown as columns with blue slanted line fill, and results for NIM are shown as columns with red solid fill.
Interservice/Industry Training, Simulation, and Education Conference (I/ITSEC) 2016
2016 Paper No.16248 Page 9 of 11
Figure 3. Comparing two models’ performance on predicting agent activities on August 13, 2013 (smaller
values indicate better predictive performance)
The results in Figure 2 show that the accuracy of NIM (red lines with round dots) increases generally as α increases from 0 to 1. In contrast, the accuracy of EAM (blue lines with square dots) decreases generally as α increases. The contrast is more stark when using LMAPE as the evaluation metric (see the charts on the right-most column of Figure 2), showing that NIM outperformed EAM for all window sizes and α values. In addition, NIM outperformed EAM based on SMAPE (when α > 0.5) and based on RMSE (when α > 0.6) for all window sizes. Figure 3 shows that the accuracies of both models improve as the window size increases. NIM (columns with red solid fill) outperformed EAM (columns with blue slanted line fill) in 12 of the 18 comparisons for w = 8 and w = 12 (especially when α ³ 0.5). In contrast, EAM achieved higher accuracies when w = 4 for all values of α. Discussion From the experimental results, we believe that the higher predictive accuracy achieved by NIM (see Figures 2 and 3) was due to its flexibility in modeling link formation and its realistic prediction of future network configuration. In contrast, EAM follows a predefined exponential function to predict network activities, resulting in less accurate prediction when more recent data are considered. In addition, the accurate predictions of network density and link formation by NIM translate to a superior forecast of temporal network activities due to both macroscopic and microscopic assessment of future trends. Larger window sizes tend to favor NIM significantly, because the additional information benefit the comprehensive modeling that NIM used in prediction. In terms of the three evaluation metrics, LMAPE described network activity trends and distribution the best because its logarithmic function and geometric mean denominator both served to gauge predictive accuracy in an unbiased manner. LMAPE had a similar computational complexity while it does not suffer from biases toward the mean or median values.
Interservice/Industry Training, Simulation, and Education Conference (I/ITSEC) 2016
2016 Paper No.16248 Page 10 of 11
SUMMARY AND FUTURE DIRECTIONS Detecting temporal trends in large networks has strategic importance in cybersecurity and social media analytics. Characterizing dynamic network changes can provide important insight on individual- and group-level activities. In this research, we developed and validated a dynamic network activity model to characterize temporal trends in a large social-media network of interactive human agents. The model, called Network Interaction Model (NIM), supports prediction of agent activities over time through modeling agents’ network interactions and network growth. To study its predictive accuracy, the model was compared against an exponential aggregation model (EAM). The two models were validated using a social-media community focused on U.S. border and immigration security. The community consists of 210,921 human agents who posted 533,246 messages and formed 453,552 links among agents. Temporal networks were extracted from the community. Experimental results show that NIM achieved higher predictive accuracy than EAM when emphasis is placed on recent trends (i.e., high a). NIM also has generally less fluctuation in predictive accuracy than EAM across different temporal span of networks. In addition, we compared the models using three evaluation metrics. The results confirmed our belief that NIM outperformed or is comparable to EAM in different settings. We developed a new metric known as Logarithmic Median Absolute Percentage Error (LMAPE) that was found to provide more intuitive measurement than existing metrics. This research should contribute to providing new approaches and system artifacts for dynamic trend detection in social-media networks, reporting new findings of network trend detection, and providing new technical approaches to process large graph-based data. Future directions include extending the experimental coverage of network spans, data sizes, and domain of study. It would be interesting to implement our model in a real-time predictive system that supports simultaneous prediction and evaluation. NIM also needs to be further enhanced by considering different methods of link formation, network property prediction, and addition or removal of agents in networks. ACKNOWLEDGEMENTS This work was partially supported by NSF CAREER (grant #1622292) and by Intel Corporation (grant #23568271). Any opinions, findings, and conclusions or recommendations expressed in this paper are those of the authors and do not necessarily reflect the views of the funding agencies. We thank the conference reviewers, editors, and coordinators for their assistance and valuable suggestions. REFERENCES Anger, I., & Kittl, C. (2011). Measuring Influence on Twitter. Paper presented at the Proceedings of the 11th
International Conference on Knowledge Management and Knowledge Technologies, New York, New York. Antoniades, D., & Dovrolis, C. (2015). Co-evolutionary dynamics in social networks: A case study of Twitter.
Computational Social Networks, 2(14). doi:DOI 10.1186/s40649-015-0023-6. Armstrong, J. S. (2001). Evaluating forecasting methods Principles of Forecasting (pp. 443-472): Springer. Berger, J. M., & Strathearn, B. (2013). Who Matters Online: Measuring influence, evaluating content, and countering
violent extremism in online social networks. London, UK: King's College London. Bush, J., McLarty III, T. F., & Alden, E. H. (2009). U.S. immigration policy. New York: Council on Foreign Relations. Chen, H., Chiang, R., & Storey, V. (2012). Business Intelligence and Analytics. MIS Quarterly, 36(4), 1165-1188. Chung, W. (2014). BizPro: Extracting and Categorizing Business Intelligence Factors from Textual News Articles.
International Journal of Information Management, 34(2), 272-284. Chung, W., & Tseng, T.-L. (2012). Discovering business intelligence from online product reviews: A rule-induction
framework. Expert Systems with Applications, 39(15), 11870-11879. Fan, W., & Gordon, M. D. (2014). The Power of Social Media Analytics. Communications of the ACM, 57(6), 74-81. Feldman, R. (2013). Techniques and applications for sentiment analysis. Communications of the ACM, 56(4), 82-89.
doi:10.1145/2436256.2436274. Freeman, L. C. (1977). A set of measures of centrality based on betweenness. Sociometry, 40(1), 35-41. Gans, J., Replogle, E. M., & Tichenor, D. J. (Eds.). (2012). Debates on U.S. Immigration: Sage Publications, Inc.
Interservice/Industry Training, Simulation, and Education Conference (I/ITSEC) 2016
2016 Paper No.16248 Page 11 of 11
Gonzalez, J. E., Low, Y., Gu, H., Bickson, D., & Guestrin, C. (2012). Powergraph: Distributed graph-parallel computation on natural graphs. Paper presented at the Presented as part of the 10th USENIX Symposium on Operating Systems Design and Implementation (OSDI 12).
Gonzalez, J. E., Xin, R. S., Dave, A., Crankshaw, D., Franklin, M. J., & Stoica, I. (2014). Graphx: Graph processing in a distributed dataflow framework. Paper presented at the 11th USENIX Symposium on Operating Systems Design and Implementation (OSDI 14).
Jackson, M. O. (2008). Social and Economic Networks. Princeton, NJ: Princeton University Press. Kramer, A. D., Guillory, J. E., & Hancock, J. T. (2014). Experimental evidence of massive-scale emotional contagion
through social networks. Proceedings of the National Academy of Sciences, 111(29), 8788-8790. LeMay, M. C. (2004). U.S. immigration: A reference handbook. Santa Barbara, Calif.: ABC-CLIO. Leskovec, J., Lang, K. J., Dasgupta, A., & Mahoney, M. W. (2009). Community structure in large networks: Natural
cluster sizes and the absence of large well-defined clusters. Internet Mathematics, 6(1), 29-123. Low, Y., Gonzalez, J. E., Kyrola, A., Bickson, D., Guestrin, C. E., & Hellerstein, J. (2014). Graphlab: A new
framework for parallel machine learning. arXiv preprint arXiv:1408.2041. Makridakis, S. (1993). Accuracy measures: Theoretical and practical concerns. International Journal of Forecasting,
9(4), 527-529. Malewicz, G., Austern, M. H., Bik, A. J., Dehnert, J. C., Horn, I., Leiser, N., & Czajkowski, G. (2010). Pregel: a
system for large-scale graph processing. Paper presented at the Proceedings of the 2010 ACM SIGMOD International Conference on Management of data.
Marble, J. L., Lawless, W. F., Mittu, R., Coyne, J., Abramson, M., & Sibley, C. (2015). The Human Factor in Cybersecurity: Robust & Intelligent Defense. In S. Jajodia, P. Shakarian, V. S. Subrahmanian, V. Swarup, & C. Wang (Eds.), Cyber Warefare: Building the Scientific Foundation (Vol. 56): Springer.
Otte, E., & Rousseau, R. (2002). Social network analysis: a powerful strategy, also for the information sciences. Journal of information Science, 28(6), 441-453.
Pan, W., Dong, W., Cebrian, M., Kim, T., Fowler, J. H., & Pentland, A. S. (2012). Modeling dynamical influence in human interaction. IEEE Signal Processing Magazine, 29(2), 77-86.
Probst, F., Grosswiele, L., & Pfleger, R. (2013). Who will lead and who will follow: Identifying Influential Users in Online Social Networks - A Critical Review and Future Research Directions. Business & Information Systems Engineering, 5(3), 179-193.
Qiu, D. H., Li, H., & Li, Y. (2014). Identification of Active Valuable Nodes in Temporal Online Social Network with Attributes. International Journal of Information Technology & Decision Making, 13(4), 839-864. doi:10.1142/S0219622014500618
Robinson, I., Webber, J., & Eifrem, E. (2015). Graph Databases: New Opportunities for Connected Data: " O'Reilly Media, Inc.".
Scott, J. (2000). Social Network Analysis: A Handbook: Sage Publications. Tayouri, D. (2016). Social media as an intelligence goldmine. Cyber Security Review (Spring), 27-30. Tofallis, C. (2014). A better measure of relative prediction accuracy for model selection and model estimation. Journal
of the Operational Research Society, 66(8), 1352-1362. U.S. Commission on Immigration Reform. (1994). U.S. immigration policy - Restoring credibility: A report to
Congress. Washington, DC (1825 Connecticut Ave., NW, Suite 511, Washington 20009): U.S. Commission on Immigration Reform.
Wasserman, S., & Faust, K. (1994). Social Network Analysis: methods and applications: Cambridge University Press. Wei, W., & Carley, K. M. (2015). Measuring Temporal Patterns in Dynamic Social Networks. ACM Transantions on
Knowledge Discovery from Data, 10(1), 1-27. doi:10.1145/2749465. Xin, R. S., Gonzalez, J. E., Franklin, M. J., & Stoica, I. (2013). Graphx: A resilient distributed graph system on spark.
Paper presented at the First International Workshop on Graph Data Management Experiences and Systems. Ye, S., & Wu, S. F. (2010). Measuring Message Propagation and Social Influence on Twitter.com. Paper presented
at the Second International Conference on Social Informatics, Laxenburg, Austria. Zaharia, M., Chowdhury, M., Franklin, M. J., Shenker, S., & Stoica, I. (2010). Spark: Cluster Computing with
Working Sets. HotCloud, 10, 10-10. Zeng, D., Chen, H., Lusch, R., & Li, S.-H. (2010). Social Media Analytics and Intelligence. IEEE Intelligent Systems,