Applied Geography 20 (2000) 1–16 www.elsevier.com/locate/apgeog Dynamics and patterns of deforestation in the western Amazon: the Napo deforestation front, 1986–1996 Rodrigo Sierra * Department of Geography, Arizona State University, Tempe, AZ 85287-0104, USA Received 12 October 1998; received in revised form 30 June 1999; accepted 30 June 1999 Abstract Although much emphasis has been given to the Brazilian Amazon in the analysis of tropical deforestation, information on other areas of the Amazon is scarce. This study examines the deforestation and level of forest fragmentation in one of the two deforestation fronts in the Amazon region outside Brazil: the Napo region of western Amazonia. Data were generated using satellite imagery for the years 1986 and 1996. Results show that while the extent and rate of deforestation in the region are important, they are less than previously reported. Forest fragmentation, however, adds a significant level of impact by affecting a very large proportion of the remaining forest cover. Better understanding of the dynamics and patterns of deforesta- tion at regional, national and global levels requires the study of a representative number of areas. A regional focus, like that used here, facilitates this because most deforestation occurs in a small number of high-intensity deforestation fronts. 2000 Elsevier Science Ltd. All rights reserved. Keywords: Colombia; Ecuador; Forest fragmentation; Satellite imagery; Tropical deforestation; Western Amazon Introduction While tropical deforestation is widespread globally, the bulk of it seems to be taking place in a relatively small number of regions. According to Myers (1993) * Fax: + 1-602-965-8313. E-mail address: [email protected](R. Sierra) 0143-6228/00/$ - see front matter 2000 Elsevier Science Ltd. All rights reserved. PII:S0143-6228(99)00014-4
Dynamics and patterns of deforestation in thewestern Amazon: the Napo deforestation front,
1986–1996
Rodrigo Sierra*
Department of Geography, Arizona State University, Tempe, AZ 85287-0104, USA
Received 12 October 1998; received in revised form 30 June 1999; accepted 30 June 1999
Abstract
Although much emphasis has been given to the Brazilian Amazon in the analysis of tropicaldeforestation, information on other areas of the Amazon is scarce. This study examines thedeforestation and level of forest fragmentation in one of the two deforestation fronts in theAmazon region outside Brazil: the Napo region of western Amazonia. Data were generatedusing satellite imagery for the years 1986 and 1996. Results show that while the extent andrate of deforestation in the region are important, they are less than previously reported. Forestfragmentation, however, adds a significant level of impact by affecting a very large proportionof the remaining forest cover. Better understanding of the dynamics and patterns of deforesta-tion at regional, national and global levels requires the study of a representative number ofareas. A regional focus, like that used here, facilitates this because most deforestation occursin a small number of high-intensity deforestation fronts. 2000 Elsevier Science Ltd. Allrights reserved.
While tropical deforestation is widespread globally, the bulk of it seems to betaking place in a relatively small number of regions. According to Myers (1993)
0143-6228/00/$ - see front matter 2000 Elsevier Science Ltd. All rights reserved.PII: S0143 -6228(99 )00014-4
2 R. Sierra / Applied Geography 20 (2000) 1–16
there are 14 deforestation fronts in the world. Few, however, have regional databasesproviding current information on the dynamics and patterns of land cover change(Bierregaard, Lovejoy, Kapos, Dos Santos & Hutchings, 1992; Grainger, 1993; Mey-ers, 1994). Adequate geographic detail is needed for studies about the causes andimpacts of tropical deforestation, for global climate models, for estimating the magni-tude of carbon flows and water cycles, and for informing national and internationalpolicy and conservation initiatives. For example, programmes such as credits forcarbon sequestration will require accurate data on the extent of cover by forest typeand the speed of cover change to estimate the value and direction of such credits.Estimates of the rate of carbon sequestration are directly dependent on the infor-mation on forest condition because a forest’s capacity to transform atmospheric car-bon into biomass is affected not only by forest clearing but also by logging, fragmen-tation and edge-related tree mortality (Phillips, Malhi, Higuchi, Laurence & Nu´nez,1998). Other objectives, such as the identification of global biodiversity conservationpriorities, also require additional information about forest cover change patterns, lev-els of fragmentation and ecosystem integrity (IGBP, 1990, 1992; Kummer & Turner,1994; Brooks, Pimm & Collar, 1997).
This study focuses on one of the deforestation fronts identified by Myers: theNapo region of western Amazonia, which is shared by Ecuador, Colombia and Peru.The objective is to estimate the extent and rate of deforestation and the level offorest fragmentation for the period 1986–96. The Napo rainforests are among themost biologically diverse and unique environments in the world and have been con-sidered one of the world’s 18 ‘hotspots’ — areas with high biodiversity and underhigh human pressure (Myers, 1988, 1990; Mittermeier, Myers, Thomsen, Da Fon-seca & Olivieri, 1998; Olson & Dinerstein, 1998). Interestingly, previous regional-level studies of forest cover change in the Amazon have focused exclusively on theBrazilian Amazon. Because more than one-third (2.3 million km2) of the Amazonbasin (Fearnside, 1990; Skole & Tucker, 1993; Stone, Schlesinger, Houghton &Woodwell, 1994) and two of the three deforestation fronts identified by Myers inthis region are not in Brazil, the available information does not provide a completepicture of what is happening to the Amazon rainforests as a whole. Stone et al.(1994) estimated the rainforest area in Bolivia, Brazil, Colombia, Ecuador, Peru andVenezuela at 6.5 million km2, including some 0.2 million km2 of Pacific lowlandforests. A similar estimate is given by Grainger (1993), while Fearnside (1990),Skole and Tucker (1993) and Stone et al. (1994) estimated the Brazilian Amazonrainforest area at 4 million km2. An accurate evaluation and understanding of thephysical and human dimension of deforestation in the whole of the Amazon basinalso needs to take into account rapidly changing areas outside Brazil.
An important contribution of the present work is its evaluation of the extent offorest degradation that accompanies forest fragmentation and how this is linked toland occupation patterns. The spatial patterns of deforestation, and not simply itsextent, are critical to the analysis because they affect the capacity of forests to surviveand recuperate (Malingreau & Tucker, 1990). Patch size, shape and isolation are keyfactors defining the potential for recolonization, mortality and dispersion. Hence,
3R. Sierra / Applied Geography 20 (2000) 1–16
forest fragmentation and border effects make the area affected by deforestation muchlarger than if it is just measured as forest clearing.
Although national deforestation statistics do exist for all the countries that sharethe Amazon basin, there are doubts about their reliability and whether they are upto date (with the exception of Brazil). National statistics have intrinsic limitationsrelated to: (a) the lack of information about within-country variability in process andpattern dynamics and an oversimplified biogeographical framework; (b) questionableconfidence levels and methodologies and very high variation from source to source;and (c) lack of information about patterns of land cover change and landscape struc-ture. Recent deforestation studies, which are increasingly based on more reliableregional land cover data and the use of satellite imagery, consistently show lowerestimates than previously for similar periods, using national surveys or projections.For example, estimates of deforestation in the Brazilian Amazon, the most studiedregion in the world, during the 1980s and early 1990s show a great variation, withthe latest estimates being significantly lower than earlier ones (Fearnside, 1990;Skole & Tucker, 1993; Pedlowski, Dale, Matricardi & Da Silva Filho, 1997; INPE,1998). In addition, because land cover change processes often span national frontiers,national-level assessments fail to address the problem at an ecosystem level or toidentify process characteristics (i.e. rate and extent) for a whole deforestation front.An alternative is to take a regional rather than a country approach, and this is themethod used here. This makes it possible to overcome national-boundary restrictionsand allows detailed analysis of cover changes by ecosystem type, including forestfragmentation, border impacts and ecosystem integrity assessment.
Research approach
The magnitude, rates and patterns of deforestation were studied for a 100 000 km2
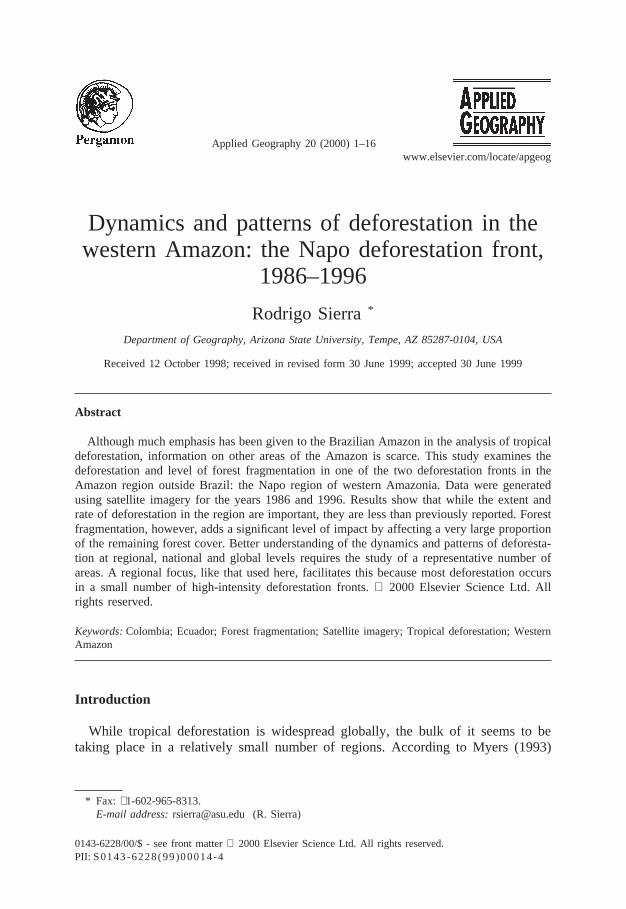
area in the Napo region of the western Amazon for the period 1986–96 (Fig. 1).This area is shared by Colombia, Peru and Ecuador (22%, 15% and 63% of thestudy region, respectively). Regional analysis of land cover characteristics used satel-lite imagery. Data for 1986 forest coverage were obtained from a mosaic of sixLandsat Multispectral Scanner (MSS) images. Data for 1996 were obtained from amosaic of eight Landsat Thematic Mapper (TM5) images. Areas covered by cloudin one or both periods and not resolved through image mosaics were eliminated fromthe analysis. Both datasets were registered and converted to a pixel resolution of100 m. Supervised classification within regions of interest was used to separateamong several land cover types. These were later aggregated into three major landcover classes: forest/natural vegetation, deforested and water. Initial land use typeswithin each region of interest were reclassified separately, facilitating a consistentdistinction of land use classes and, particularly, the removal of noise in the classi-fication process (i.e. error deforestation pixels appearing in known forested areas).Regions of interest were selected based on extensive fieldwork in the Ecuadorianportion of the study region. (Fieldwork was not carried out on the Colombian sidebecause of increased personal risks due to guerrilla activities.) The level of detail
4 R. Sierra / Applied Geography 20 (2000) 1–16
Fig. 1. The Napo region of western Amazonia.
used in this study, both in terms of resolution and areal extent, allows for a relativelyaccurate analysis. Larger-scale studies, often using coarse resolution data (e.g.AVHRR), tend to overestimate deforestation by as much as 50% (Skole & Tucker,1993). More detailed studies may provide more accurate information, but cost perunit of area tends to be much higher, both in personnel and in time requirements.Furthermore, while approximately 10% of the study region was not resolved due tocloud coverage, the deforestation statistics are a close approximation to realitybecause a significant fraction of the cloud-covered area corresponded to areas knownto have full forest coverage.
The definition of deforestation used in this study refers to the complete removalof forest cover for any reason (such as smallholder agriculture or oil extraction).Although some trees may remain, the spectral distinctiveness of these areas is unmis-takable. MAG/SUFOREN (n.d.) found that between 10 and 25 standing trees wereleft per hectare in clearings used for pasture (depending on the size of tree crowns)in the Ecuadorian section of the study region. For this reason, secondary forest inlater stages of succession, and other areas of degraded forest, are included in theforest category statistics. Hence, the deforestation estimates presented here shouldbe seen as conservative.
Forest fragmentation analysis allows for diagonal links in patch definition.
5R. Sierra / Applied Geography 20 (2000) 1–16
Although this level of connectivity underestimates the degree of fragmentation, with-out it the number of patches exceeded software capabilities (Fragstats cannot processmore than 32 000 different patches). Because the region studied includes a large areaof natural forests, and because areas of deforestation are concentrated, a moredetailed analysis of forest degradation resulting from forest fragmentation was carriedout in a subsection of 560 000 ha, where land cover change was found to be dynamicand spanned the period of analysis. In this study, the level of fragmentation wasassumed to approximate to the extent of forest degradation in the study region. Forestdegradation refers to changes in forest conditions leading to permanent modificationsin composition and structure. Forest fragments were grouped by size into variousgroups denoting a given (qualitative) level of degradation, which is inversely pro-portional to size. This information is particularly important for estimating the fullimpact of deforestation on biological resources. This approach is consistent withwork done in Peninsular Malaysia, the Philippines and the Brazilian Amazon(respectively: Brown, Iverson & Lugo, 1993; Liu, Iverson & Brown, 1993; Skole &Tucker, 1993).
Deforestation in the Napo region of the western Amazon, 1986–96
There are few studies of the dynamics of land cover changes and deforestation inwestern Amazonia in general, or in the Napo region in particular. Myers (1993,1994) estimated the area of the western Amazon deforestation front at 200 000 km2
and the area deforested in 1991 alone at 590 000 ha, or an annual deforestation rateof 3%. In the only study found for the Colombian Amazon, Ruiz (1989) estimatedthat by the late 1980s, 2.5×10⁶ ha of forests had been cleared in the departments ofCaqueta´, Guaviare and Putumayo (only the department of Putumayo is included inthis study). On the Ecuadorian side, Wunder (1997), using official agricultural sur-veys, estimated that the area deforested in this section of the study region increasedfrom 0.41× 10⁶ ha in 1972 to 1.1× 10⁶ ha in 1989. This means that 34 705 ha offorests were cleared every year during this period. Interestingly, none of these studiesprovide maps illustrating the geographic nature of the process.
Land cover change data in this study show that between 1986 and 1996, the areadeforested in the Napo region almost doubled, reaching 1.2× 10⁶ ha (Table 1). Thisis equivalent to 12.4% of the study region; up from 6.8% in 1986. On average,55 590 ha were cleared every year, a rate of 0.6% yr21, which is much lower thanMyers’s estimate. All the deforestation occurred in the Colombian and Ecuadorianportions of the study region. Isolation from major urban centres and the lack of roadshas hindered forest clearing on the Peruvian side. If the area inside Peru is nottaken into account, deforestation rates do not change significantly. Overall, however,deforestation was advancing faster on the Colombian side than on the Ecuadorianside (0.9% yr21 compared with 0.65% yr21). In Ecuador, the deforested areaincreased from 7.25% in 1986 to 13.4% in 1996, while in Colombia it increasedfrom 10.3% to 18.4%. In terms of area, deforestation estimates for the Ecuadorianportion are roughly half those obtained by Wunder (1997), but the rates are very
6 R. Sierra / Applied Geography 20 (2000) 1–16
Table 1Forest cover change in the Napo deforestation front of western Amazonia, 1986–96 (in hectares)
a Not including areas not resolved due to high cloud coverage.b Areas covered by clouds in one or both periods.
similar (38 288 ha yr21 in this study compared with 34 705 ha yr21 according toWunder). A comparison could not be made with the Colombian estimates of Ruiz(1989) because of differences in areal coverage and the lack of maps on the orig-inal reference.
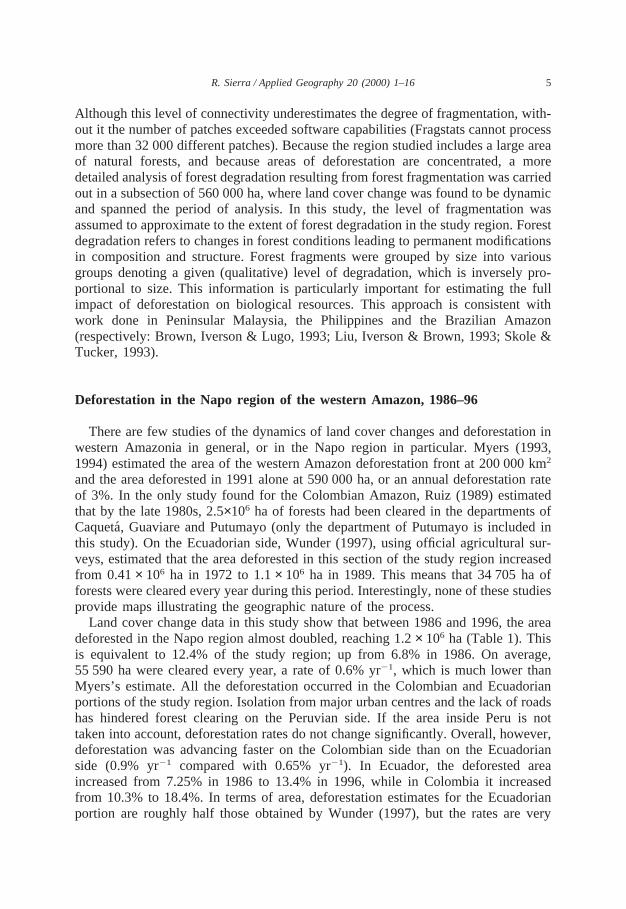
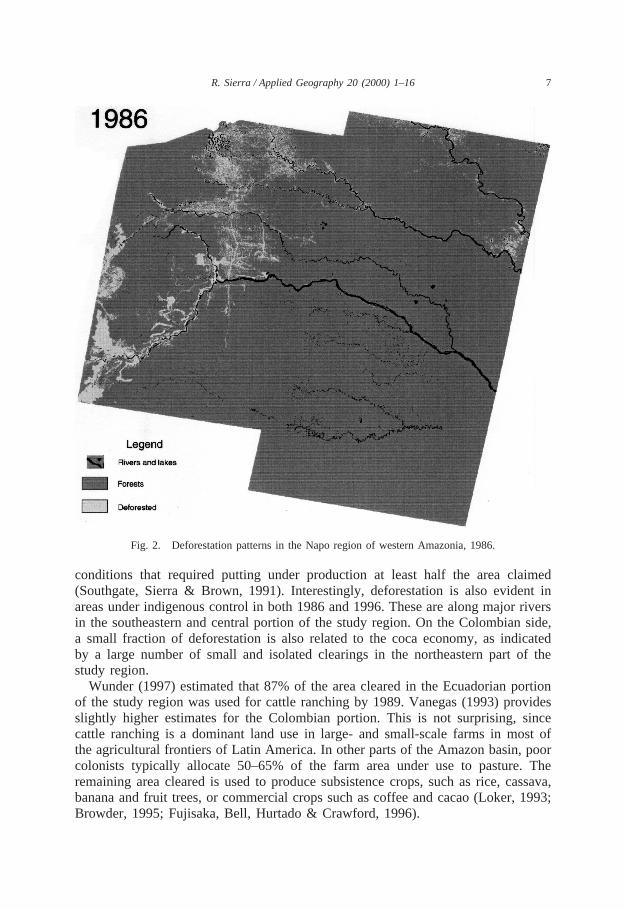
Figs 2 and 3 show that deforestation is relatively concentrated in the northwestcorner of the study region, near the foot of the Andes, from which much of thepopulation is coming. Much deforestation at the local level is tied to the spread ofsmallholdings and cattle ranching (Eastwood & Pollard, 1992; Vanegas, 1993; Mur-phy, Bilsborrow & Picho´n, 1997; Wunder, 1997). Colonization and development aretied to the expansion of oil extraction and exploration and government programmes,such as colonization schemes and military camps. This is illustrated in Figs 2 and3 by the presence of clearing axes, the colonization lines, along access roads. InEcuador, for example, oil exploration and production since the 1970s has openedthe region very rapidly through the construction of a large road network. By the1970s, colonization in other areas of Ecuadorian Amazonia had subsided as the com-bination of pull forces (oil jobs, increasing access to markets and cheap land) in thenorth took precedence over those in the south of the Ecuadorian Amazon or on thePacific side of the Andes (Brown & Sierra, 1994). In Ecuador, the population jumpedfrom 49 578 in 1974 to 82 676 in 1982 and to 103 387 in 1990. Rates of populationgrowth have been around 6–8% yr21 for several decades, at least twice the nationalrates. On the Colombian side, population has grown even faster, almost doublingbetween 1973 and 1985 to reach 119 815. By the last Colombian census, in 1993,the population on the Colombian side of the study area had reached 204 309, anincrease of more than 70% in 8 years. On the Peruvian side, the population is stillrelatively small, confined to a few villages and military posts. (The area studied inPeru falls within the Province of Maynas, which in 1993 had 384 063 people, three-quarters of whom lived in the city of Iquitos, several hundred km outside thestudy region.)
In addition, land assignations to colonists fostered clearing by imposing titling
7R. Sierra / Applied Geography 20 (2000) 1–16
Fig. 2. Deforestation patterns in the Napo region of western Amazonia, 1986.
conditions that required putting under production at least half the area claimed(Southgate, Sierra & Brown, 1991). Interestingly, deforestation is also evident inareas under indigenous control in both 1986 and 1996. These are along major riversin the southeastern and central portion of the study region. On the Colombian side,a small fraction of deforestation is also related to the coca economy, as indicatedby a large number of small and isolated clearings in the northeastern part of thestudy region.
Wunder (1997) estimated that 87% of the area cleared in the Ecuadorian portionof the study region was used for cattle ranching by 1989. Vanegas (1993) providesslightly higher estimates for the Colombian portion. This is not surprising, sincecattle ranching is a dominant land use in large- and small-scale farms in most ofthe agricultural frontiers of Latin America. In other parts of the Amazon basin, poorcolonists typically allocate 50–65% of the farm area under use to pasture. Theremaining area cleared is used to produce subsistence crops, such as rice, cassava,banana and fruit trees, or commercial crops such as coffee and cacao (Loker, 1993;Browder, 1995; Fujisaka, Bell, Hurtado & Crawford, 1996).
8 R. Sierra / Applied Geography 20 (2000) 1–16
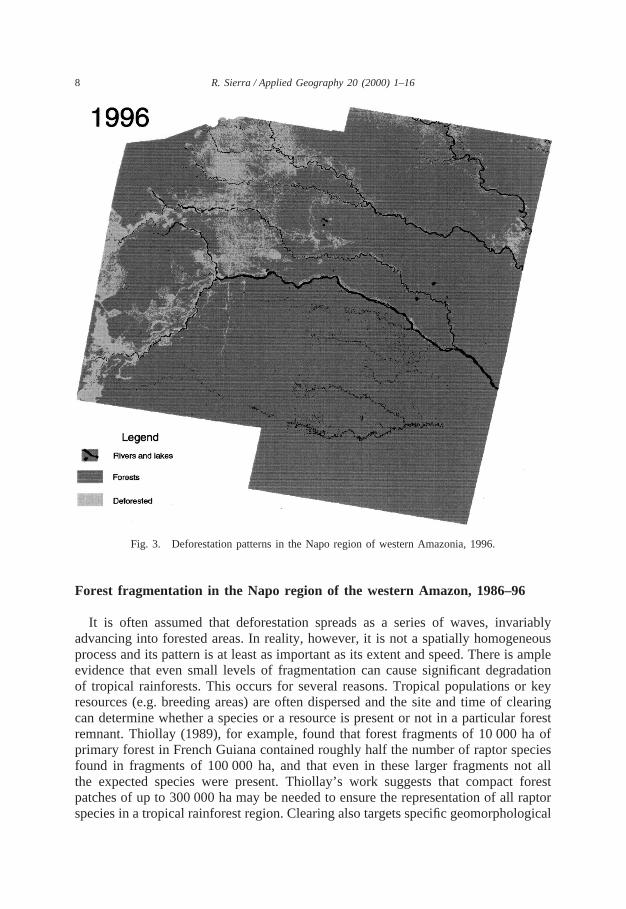
Fig. 3. Deforestation patterns in the Napo region of western Amazonia, 1996.
Forest fragmentation in the Napo region of the western Amazon, 1986–96
It is often assumed that deforestation spreads as a series of waves, invariablyadvancing into forested areas. In reality, however, it is not a spatially homogeneousprocess and its pattern is at least as important as its extent and speed. There is ampleevidence that even small levels of fragmentation can cause significant degradationof tropical rainforests. This occurs for several reasons. Tropical populations or keyresources (e.g. breeding areas) are often dispersed and the site and time of clearingcan determine whether a species or a resource is present or not in a particular forestremnant. Thiollay (1989), for example, found that forest fragments of 10 000 ha ofprimary forest in French Guiana contained roughly half the number of raptor speciesfound in fragments of 100 000 ha, and that even in these larger fragments not allthe expected species were present. Thiollay’s work suggests that compact forestpatches of up to 300 000 ha may be needed to ensure the representation of all raptorspecies in a tropical rainforest region. Clearing also targets specific geomorphological
9R. Sierra / Applied Geography 20 (2000) 1–16
conditions. Habitats that correlate with these become under-represented in the finalmosaic. For example, clearing for agriculture will tend to target well-drained areas(e.g. terrae firm forests) rather than poorly drained areas (e.g. flooded palm forests).Isolation is an additional factor affecting population viability and diversity withineach segment as it affects horizontal and vertical population and genetic movements.Work in the Brazilian Amazon shows that interruptions of as little as 80 m can bean important barrier (Bierregaard et al., 1992). Biophysical changes, such as micro-climate and soil modification, also affect forest diversity for at least 100–200 mfrom the border (Bierregaard & Lovejoy, 1989; Newmark, 1991; Saunders, Hobbs &Margules, 1991; Levey & Stiles, 1992; Kattan, Alvarez-Lopez & Giraldo, 1994).
In general, increased fragmentation affects the carrying capacity of a forest, the sumof fragment areas having a considerably lower capacity than a single patch of the samearea. Large animals are among the most vulnerable to forest fragmentation becausethey need larger areas for survival, have smaller populations and are hunted more oftenthan smaller animals (Terbourgh, 1992). Others are vulnerable because of their depen-dence on key resources. For example, large insectivore bird extinctions in small frag-ments have been related to the fast disappearance of army ants after fragmentation.Bierregaard et al. (1992) report vertical biomass changes among small rodents, fromgreater aerial biomass in continuous forests to greater terrestrial biomass in fragmentedforests. This seemed to have been a response to similar changes in insect biomassdistribution. Plants are also affected. Terbourgh (1992) has pointed out that the lack ofpredators and the subsequent increase in seed eaters may favour the expansion of someplant species while reducing others. Bierregaard et al. (1992) show that mortality ratesamong trees in the edge of fragments of up to 100 ha are almost twice as large as therates observed in continuous forests in the Amazon basin. At the centre of these frag-ments, tree recruitment also declines considerably.
Moreover, fragmentation also increases the area exposed to external pressure,primarily from people, which further affects forest structure and composition. Hunt-ing, for example, often eliminates large mammals (including those of great impor-tance for forest regeneration, such as monkeys and rodents) from forest near occupiedareas. A brief survey during this study showed no evidence of monkey populations,even in large forest fragments, in the deforestation core of the Ecuadorian portionof the study region. The impact of human pressure on animal resources in this regionwas studied more formally by Vickers (1988), who found that game populationsdecreased drastically with increases in hunting pressure. Sierra and Stallings (1998)have shown that selective logging in the lowland rainforests of western Ecuadortakes place up to 1 km from forest borders, even in the absence of penetration roads.
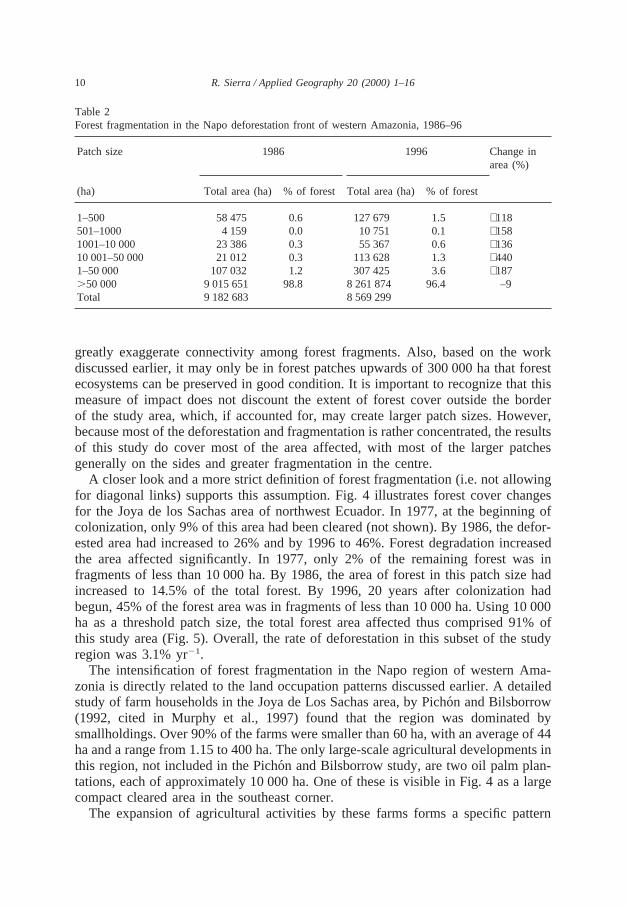
Hence, forest fragmentation in the Napo region adds an important dimension tothe direct impact resulting from the deforestation discussed earlier. Table 2 showsthat by 1986, 1.2% of the remaining forest area was in isolated patches of less than50 000 ha, almost half being in very small patches of less than 500 ha. By 1996,the area in patches of less than 50 000 ha had tripled, accounting for 3.6% of theremaining forest area. Thus, by 1996, 16% of the forest area in the Napo region canbe said to have been either cleared or heavily degraded. This is a conservative esti-mate. As noted earlier, patches were defined by allowing for diagonal links, which
10 R. Sierra / Applied Geography 20 (2000) 1–16
Table 2Forest fragmentation in the Napo deforestation front of western Amazonia, 1986–96
Patch size 1986 1996 Change inarea (%)
(ha) Total area (ha) % of forest Total area (ha) % of forest
greatly exaggerate connectivity among forest fragments. Also, based on the workdiscussed earlier, it may only be in forest patches upwards of 300 000 ha that forestecosystems can be preserved in good condition. It is important to recognize that thismeasure of impact does not discount the extent of forest cover outside the borderof the study area, which, if accounted for, may create larger patch sizes. However,because most of the deforestation and fragmentation is rather concentrated, the resultsof this study do cover most of the area affected, with most of the larger patchesgenerally on the sides and greater fragmentation in the centre.
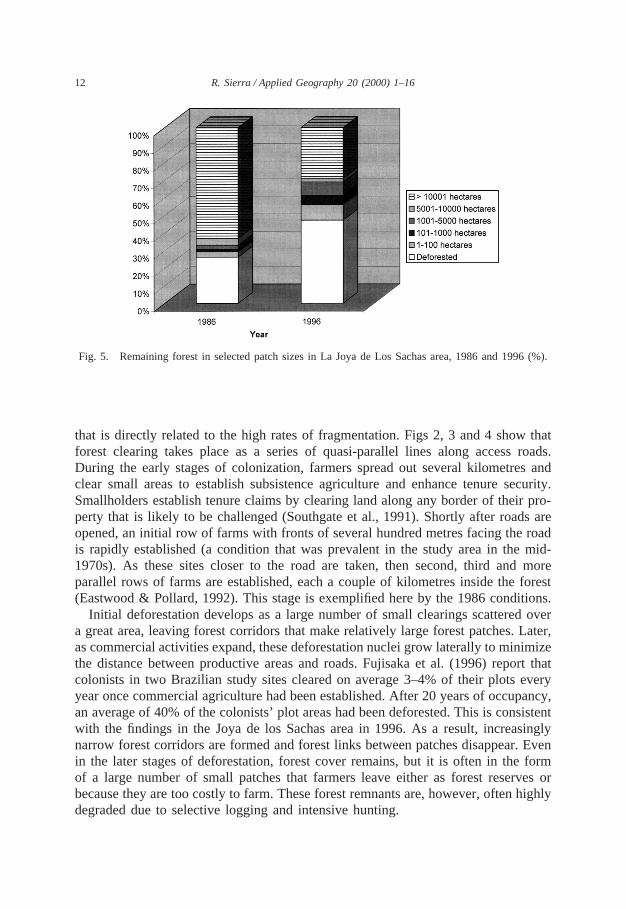
A closer look and a more strict definition of forest fragmentation (i.e. not allowingfor diagonal links) supports this assumption. Fig. 4 illustrates forest cover changesfor the Joya de los Sachas area of northwest Ecuador. In 1977, at the beginning ofcolonization, only 9% of this area had been cleared (not shown). By 1986, the defor-ested area had increased to 26% and by 1996 to 46%. Forest degradation increasedthe area affected significantly. In 1977, only 2% of the remaining forest was infragments of less than 10 000 ha. By 1986, the area of forest in this patch size hadincreased to 14.5% of the total forest. By 1996, 20 years after colonization hadbegun, 45% of the forest area was in fragments of less than 10 000 ha. Using 10 000ha as a threshold patch size, the total forest area affected thus comprised 91% ofthis study area (Fig. 5). Overall, the rate of deforestation in this subset of the studyregion was 3.1% yr21.
The intensification of forest fragmentation in the Napo region of western Ama-zonia is directly related to the land occupation patterns discussed earlier. A detailedstudy of farm households in the Joya de Los Sachas area, by Picho´n and Bilsborrow(1992, cited in Murphy et al., 1997) found that the region was dominated bysmallholdings. Over 90% of the farms were smaller than 60 ha, with an average of 44ha and a range from 1.15 to 400 ha. The only large-scale agricultural developments inthis region, not included in the Picho´n and Bilsborrow study, are two oil palm plan-tations, each of approximately 10 000 ha. One of these is visible in Fig. 4 as a largecompact cleared area in the southeast corner.
The expansion of agricultural activities by these farms forms a specific pattern
11R. Sierra / Applied Geography 20 (2000) 1–16
Fig. 4. Deforestation and forest fragmentation in La Joya de Los Sachas area, 1986 and 1996.
12 R. Sierra / Applied Geography 20 (2000) 1–16
Fig. 5. Remaining forest in selected patch sizes in La Joya de Los Sachas area, 1986 and 1996 (%).
that is directly related to the high rates of fragmentation. Figs 2, 3 and 4 show thatforest clearing takes place as a series of quasi-parallel lines along access roads.During the early stages of colonization, farmers spread out several kilometres andclear small areas to establish subsistence agriculture and enhance tenure security.Smallholders establish tenure claims by clearing land along any border of their pro-perty that is likely to be challenged (Southgate et al., 1991). Shortly after roads areopened, an initial row of farms with fronts of several hundred metres facing the roadis rapidly established (a condition that was prevalent in the study area in the mid-1970s). As these sites closer to the road are taken, then second, third and moreparallel rows of farms are established, each a couple of kilometres inside the forest(Eastwood & Pollard, 1992). This stage is exemplified here by the 1986 conditions.
Initial deforestation develops as a large number of small clearings scattered overa great area, leaving forest corridors that make relatively large forest patches. Later,as commercial activities expand, these deforestation nuclei grow laterally to minimizethe distance between productive areas and roads. Fujisaka et al. (1996) report thatcolonists in two Brazilian study sites cleared on average 3–4% of their plots everyyear once commercial agriculture had been established. After 20 years of occupancy,an average of 40% of the colonists’ plot areas had been deforested. This is consistentwith the findings in the Joya de los Sachas area in 1996. As a result, increasinglynarrow forest corridors are formed and forest links between patches disappear. Evenin the later stages of deforestation, forest cover remains, but it is often in the formof a large number of small patches that farmers leave either as forest reserves orbecause they are too costly to farm. These forest remnants are, however, often highlydegraded due to selective logging and intensive hunting.
13R. Sierra / Applied Geography 20 (2000) 1–16
Conclusions
This study shows that deforestation in the Napo region of western Amazonia hasaffected a significant area but that its extent and the speed at which it is increasingis less than previously reported. Myers’s (1993) estimate of 590 000 ha of deforest-ation per year in western Amazonia, although for an area twice as large as thatexamined here, seems to be a significant overestimation. Deforestation in the regionprobably stands at 100 000–200 000 ha yr21, an annual rate of less than 1%. Thisis considerably lower than the 3% rate reported by Myers, and is consistent withfindings in other areas of the Amazon, where recent estimates of deforestation ratesbased on satellite information are below 1%, which is also lower than earlier estimates.
Results also suggest that available national-level statistics overestimate deforest-ation. In Ecuador, for example, recent estimates put deforestation in the period 1990–5 at roughly 190 000 ha yr21, an annual rate of 1.6% (WRI, 1998). The presentstudy found that in the north of the Ecuadorian Amazon, one of the two maindeforestation fronts in the country, approximately 40 000 ha were cleared a year inthe period 1986–96, at an annual rate of 0.65%. An earlier study for northwest Ecu-ador, the other major deforestation front in Ecuador, found that in the period 1983–93, approximately 10 000 ha of natural forests were cleared every year. In this region,however, due to the small remnant forest area, the annual deforestation rate stoodat 1.9% for this period (Sierra & Stallings, 1998). If it is assumed that one-third ofthe deforestation in Ecuador occurs in these two deforestation fronts, the area ofnatural forest cleared in Ecuador every year would be approximately 150 000 ha, orthree-quarters of the previous estimate. The rate would also be at levels below 1–1.2% yr21, as opposed to 1.6% yr21. Because the area studied here that falls withinColombia and Peru is not representative of the process at a national scale, a similarassumption cannot be made for these countries. Locally, however, rates of deforest-ation may be much faster. In the Joya de los Sachas area, deforestation was veryclose to Myers’s estimate. Clearly, estimates of rates and extent are affected by thesize of the area studied and the level of detail. The smaller the area studied, themore extreme these measures are likely to be.
No comfort, however, can be derived from these comparisons. Even at these lowerrates deforestation is significant. Furthermore, its overall impact is in fact muchgreater than that suggested by conventional statistics such as extent and rates. Usingthe results from the Joya de Los Sachas region as a guide, it is reasonable to arguethat by the time 50% of the forest cover has been cleared, most of the remainingforest has also lost critical resources for conservation in general, and for biodiversityconservation in particular. By then, a significant fraction of the remaining forestconsists of many small forest remnants. This is especially important for conservationplanners who need to consider that as time passes forest fragmentation intensifiesmore than proportionally in relation to cleared area. Beyond a hitherto undefinedthreshold, even very large aggregate measures of forest cover do not provide a goodbasis for biodiversity conservation. At this point it can be expected that the aggregateforest area will comprise a large number of small forest patches. Designing andcreating new reserves of sufficient size, for example, would be very difficult oncethat threshold has passed.
14 R. Sierra / Applied Geography 20 (2000) 1–16
Finally, a critical implication of this work is that deforestation and forest degradationin the Amazon region outside Brazil is significant and merits study in its own right. Ifsimilar deforestation patterns are assumed for the rest of non-Brazilian Amazon, the areadeforested in the whole region by 1996 would be approximately 285 000 km2 (12.39%of 2.3 million km2). While this study does not provide direct support for such an assump-tion, there is evidence that the occupation process in the Napo region is representativeof processes in large areas of the western Amazon. Loker (1993), for example, reportssimilar farm sizes and Aramburu´ (1984) describes a similar occupation process for thePeruvian Amazon. Vanegas (1993) does the same for the Colombian Amazon.
Hence, deforestation and forest fragmentation in the non-Brazilian Amazon maybe as critical as in the Brazilian portion. The latest and probably most accurate andcomprehensive study of deforestation in the Brazilian Amazon (INPE, 1998) foundthat by 1996, 517 000 km2 had been converted to agriculture or some type of non-forest land use. This area, however, includes clearing of non-rainforest formations(e.g. cerrado) and it is unclear how much of it applies specifically to the Amazonrainforest. A reasonably low estimate is provided by Skole and Tucker (1993), whofound that by 1988 the total area deforested in the Brazilian Amazon was 230 000km2, equivalent to 5.7% of the original forest area. Higher estimates are providedby Fearnside (1990), who estimated the area deforested by 1988 at 348 000 km2,and Mahar (1989), who estimated 598 922 km2. If the estimates of Skole and Tuckerand Fearnside are used as a starting point to calculate lower and upper estimates,respectively, of the deforestation in the Brazilian Amazon proper in 1988, and theannual deforestation rates estimated by INPE (1998) for the period 1988–96 areapplied on a year-by-year basis, a low estimation of the deforested area in the Brazil-ian Amazon by 1996 would be 370 000 km2, or 9.25% of the original forest extent,and a high estimate would be 482 200 km2, or 12% of the original forest extent.Hence, proportionally, the level of deforestation in these two Amazon regions maybe very close and the environmental risks similar. Overall, it seems reasonable toassume that at least one-third of the deforestation in the Amazon occurs outside Brazil.
It is not possible to provide a better appraisal of this and other issues addressedhere for complete ecoregions, such as the whole Amazon rainforests or the rainforestson the western sides of the Andes, or at a global scale, until a representative numberof areas are studied in sufficient detail. Such regional coverage is also importantbecause it would provide the land cover and land cover change data that has beenconsidered a top priority for global environmental research (IGBP 1990, 1992; Mal-ingreau, Achard, D’Souza, Stibig & D’Souza, 1995). The definition of deforestationas a local, regional or even global problem depends on its magnitude and spatialdistribution (Malingreau & Tucker, 1990). For these reasons, more geographicallydiverse regional studies are also necessary to grasp the complexity of environmentalprocesses and to understand more about people–environment interactions.
Acknowledgements
The author wishes to acknowledge the support of US AID SUBIR Project in Ecu-ador, Wildlife Conservation Society, EcoCiencia, and ERMapper Inc. Landsat MSS
15R. Sierra / Applied Geography 20 (2000) 1–16
imagery was obtained from EROS DAAC. Michael Kuby and two anonymous ref-erees provided valuable comments on an earlier draft of this article. Jordan Chamber-lin helped with data processing and image analysis.
References
Aramburu, C. (1984). Expansion of the demographic and agrarian frontier in Peruvian selva. In M.Schmink, & C. Woods,Frontier expansion in Amazonia.. Gainesville, FL: University Presses of Flori-da.
Bierregaard, R., & Lovejoy, T. (1989). Effect of forest fragmentation on Amazonian understorey birdcommunities.Acta Amazonica, 19, 215–241.
Bierregaard, R., Lovejoy, T., Kapos, V., Dos Santos, A., & Hutchings, R. (1992). The biological dynamicsof tropical rainforest fragments.Bioscience, 42 (11), 859–866.
Brooks, T., Pimm, S., & Collar, N. (1997). Deforestation predicts the number of threatened birds ininsular South East Asia.Conservation Biology, 11 (2), 382–394.
Browder, J. (1995). Redemptive communities: indigenous knowledge, colonist farming systems, and con-servation of tropical forests.Agriculture and Human Values, Winter, 17–30.
Brown, L. A., & Sierra, R. (1994). Frontier migration as a multi-stage phenomenon reflecting the interplayof macro-forces and local conditions: the Ecuador Amazon.Papers in Regional Science, 73 (3), 1–22.
Brown, S., Iverson, L., & Lugo, A. (1993). Land use and biomass changes of forest in Peninsular Malaysiaduring 1972–1982: use of GIS. In V. Dale,Effects of land-use change on atmospheric CO2 concen-trations: southeast Asia as a case study. New York: Springer Verlag.
Eastwood, D., & Pollard, H. (1992). Amazonian colonization in eastern Ecuador: land use conflicts in aplanning vacuum.Singapore Journal of Tropical Geography, 13 (2), 103–117.
Fearnside, P. (1990). The rate and extent of deforestation in Brazilian Amazonia.Environmental Conser-vation, 17 (3), 213–226.
Fujisaka, S. E., Bell, W., Hurtado, L., & Crawford, E. (1996). Slash-and-burn agriculture, conversion topastures, and deforestation in two Brazilian Amazon colonies.Agricultural Ecosystems and Environ-ments, 59, 115–130.
Grainger, A. (1993). Rates of deforestation in the humid tropics: estimates and measurements.Geographi-cal Journal, 150, 33–44.
IGBP (1990).Global change.Stockholm: International Geosphere–Biosphere Program Secretariat (ReportNo. 12).
IGBP (1992).Improved global data for land applications.Stockholm: International Geosphere–BiosphereProgram Secretariat (Report No. 20).
INPE (Instituto Nacional de Pesquisas Espaciais), Amazonia (1988). Deforestamiento 1995–1997, , 12March.
Kattan, G., Alvarez-Lopez, H., & Giraldo, M. (1994). Forest fragmentation and bird extinctions: SanAntonio eighty years later.Conservation Biology, 8 (1), 138–146.
Kummer, D., & Turner, B. L. (1994). The human causes of deforestation in Southeast Asia.Bioscience,44 (5), 323–328.
Levey, D., & Stiles, F. (1992). Evolutionary precursors of long-distance migration: resource availabilityand movement patterns in neotropical landbirds.American Naturalist, 140, 447–476.
Liu, D., Iverson, L., & Brown, S. (1993). Rates and patterns of deforestation in the Philippines: applicationof geographic information systems analysis.Forest Ecology and Management, 57, 1–16.
Loker, W. (1993). The human ecology of cattle raising in the Peruvian Amazon: the view from the farm.Human Organization, 52 (1), 14–24.
MAG/SUFOREN (n.d.) Diagno´stico del Sector Forestal de la Provincia del Napo. Ministerio deAgricultura/Subsecretarı´a Forestal y de Recursos Naturales, Quito.
Mahar, D. (1989).Government policies and deforestation in Brazil’s Amazon region.Washington, DC:World Bank.
16 R. Sierra / Applied Geography 20 (2000) 1–16
Malingreau, J., & Tucker, C. (1990). Ranching in the Amazon basin: large-scale changes observed byAVHRR. International Journal of Remote Sensing, 11 (2), 187–189.
Malingreau, J., Achard, F., D’Souza, G., Stibig, H., D’Souza, J., Estreguil, C., & Eva, H. (1995). AVHRRfor global tropical forest monitoring: the lessons of the TREES project.Remote Sensing Reviews, 12(1/2), 29–40.
Mittermeier, R., Myers, N., Thomsen, J., Da Fonseca, G., & Olivieri, S. (1998). Biodiversity hotspots andmajor tropical wilderness areas: approaches to setting conservation priorities.Conservation Biology, 12(3), 516–520.
Murphy, L., Bilsborrow, R., & Picho´n, F. (1997). Poverty and prosperity among migrant settlers in theAmazon rainforest frontier of Ecuador.Journal of Development Studies, 34 (2), 35–66.
Myers, N. (1988). Threatened biotas: ‘hot-spots’ in tropical forests.The Environmentalist, 8, 187–208.Myers, N. (1990). The biodiversity challenge: expanded hot-spot analysis.The Environmentalist, 10,
243–256.Myers, N. (1993). Tropical forests: the main deforestation fronts.Environmental Conservation, 20 (1),
9–16.Myers, N. (1994). Tropical deforestation: rates and patterns. In K. Brown, & D. Pearce,The causes of
tropical deforestation(pp. 27–41). London: University College Press.Newmark, W. (1991). Tropical forest fragmentation and the local extinction of understorey birds in the
eastern Usambara Mountains, Tanzania.Conservation Biology, 11, 103–120.Olson, D., & Dinerstein, E. (1998). The global 200: a representation approach to conserving the Earth’s
most biologically valuable ecoregions.Conservation Biology, 12 (3), 502–515.Pedlowski, M., Dale, V., Matricardi, E., & Da Silva Filho, E. (1997). Patterns and impacts of deforestation
in Rondonia, Brazil.Landscape and Urban Planning, 38, 149–157.Phillips, O., Malhi, Y., Higuchi, N., Laurence, W., Nu´nez, P., Va´squez, R., Laurence, S., Ferreira, L.,
Stern, M., Brown, S., & Grace, J. (1998). Changes in the carbon balance of tropical forests: evidencefrom long-term plots.Science, 286 (5388), 439–442.
Pichon, F., & Bilsborrow, R. (1992). Land-use systems, deforestation and associated demographic factorsin the humid tropics: farm-level evidence from Ecuador. In R. Bilsborrow, & D. Hogan,Populationand deforestation in the humid tropics. Oxford: Oxford University Press.
Ruiz, J. (1989). Desarrollo regional en Colombia: ordenamiento ambiental y desarrollo regional.Cuad-ernos de Industria y Econonı´a Rural, 22.
Saunders, D., Hobbs, R., & Margules, C. (1991). Biological consequences of ecosystem fragmentation:a review.Conservation Biology, 5, 18–32.
Sierra, R., & Stallings, J. (1998). The dynamics and human organization of tropical deforestation innorthwest Ecuador, 1983–1995.Human Ecology, 26 (1), 135–161.
Skole, D., & Tucker, C. (1993). Tropical deforestation and habitat fragmentation in the Amazon: satellitedata from 1978 to 1988.Science, 260, 1905–1910.
Southgate, D., Sierra, R., & Brown, L. (1991). The causes of tropical deforestation in Ecuador: a statisticalanalysis.World Development, 10 (19), 1145–1152.
Stone, T., Schlesinger, P., Houghton, R., & Woodwell, G. (1994). A map of the vegetation of SouthAmerica based on satellite imagery.Photogrammetric Engineering and Remote Sensing, 60 (5),541–551.
Terbourgh, J. (1992). Maintenance of diversity in tropical forests.Biotropica, 24, 283–292.Thiollay, J. (1989). Area requirements for the conservation of rain forest raptors and game birds in French
Guiana.Conservation Biology, 3 (2), 128–137.Vanegas, D. (1993). Dina´mica de la ocupacio´n de la Amazonı´a Colombiana.Colombia Amazonica, 6 (2),
149–174.Vickers, W. (1988). Game depletion hypothesis of Amazonian adaptation: data from a native community.
Science, 239, 1521–1522.WRI (1998).World resources: a guide to the global environment, 1998–1999.Oxford: Oxford University
Press for World Resources Institute.Wunder, S., 1997. From dutch disease to deforestation: a macro-economic link. A case study from Ecuador
Copenhagen. Center for Development Research, (working paper No. 97.6).