Dynamics of Occupational Change: Implications for the Occupational Requirements Survey Michael J. Handel 1 July 15, 2016 Executive Summary The Bureau of Labor Statistics (BLS) is collecting the Occupational Requirements Survey (ORS) under an agreement with the Social Security Administration (SSA). Multiple years of ORS collected data will be used to evaluate whether the estimates meet SSA’s needs for the disability adjudication process. If so, BLS and SSA will have to determine how often the ORS data will have to be updated. As a first step to addressing this issue, BLS asked the question, “historically, how have jobs changed over time, and how frequently do we expect jobs to change in the future?” This report addresses this question in three parts: • total changes in job skill requirements from U.S. and international studies using data with modest sample sizes or not presenting shift-share decompositions. • between-occupation changes in job skill requirements focusing on long-run historical trends in the relative sizes of broad occupations in the U.S. and other OECD countries as a coarse, ordinal measure of skills and long-run trends in direct measures of skills based on the changing sizes of detailed occupations using scores from the Dictionary of Occupational Titles and O*NET. • within-occupation changes in job skill requirements including shift-share analyses of trends in workers’ personal education as an imperfect proxy for job required education, an evaluation of trends in actual and projected distribution of jobs across BLS education and training levels, and analysis of evidence from case studies. Most of the evidence reviewed suggested job skill requirements and other job demands do not change rapidly and that the effects of computer or other technologies are not necessarily far- reaching, including studies that focused on blue-collar jobs. Perhaps reflecting this fact, almost all multi-wave studies of job requirements, including O*NET, updated with a periodicity of 5-10 years. 1 Department of Sociology and Anthropology, Northeastern University, Boston, MA 02115 ([email protected]).
Transcript
Dynamics of Occupational Change: Implications for the Occupational Requirements Survey
Michael J. Handel 1
July 15, 2016
Executive Summary
The Bureau of Labor Statistics (BLS) is collecting the Occupational Requirements Survey (ORS) under an agreement with the Social Security Administration (SSA). Multiple years of ORS collected data will be used to evaluate whether the estimates meet SSA’s needs for the disability adjudication process. If so, BLS and SSA will have to determine how often the ORS data will have to be updated. As a first step to addressing this issue, BLS asked the question, “historically, how have jobs changed over time, and how frequently do we expect jobs to change in the future?” This report addresses this question in three parts:
• total changes in job skill requirements from U.S. and international studies using data withmodest sample sizes or not presenting shift-share decompositions.
• between-occupation changes in job skill requirements focusing on long-run historicaltrends in the relative sizes of broad occupations in the U.S. and other OECD countries asa coarse, ordinal measure of skills and long-run trends in direct measures of skills basedon the changing sizes of detailed occupations using scores from the Dictionary ofOccupational Titles and O*NET.
• within-occupation changes in job skill requirements including shift-share analyses oftrends in workers’ personal education as an imperfect proxy for job required education,an evaluation of trends in actual and projected distribution of jobs across BLS educationand training levels, and analysis of evidence from case studies.
Most of the evidence reviewed suggested job skill requirements and other job demands do not change rapidly and that the effects of computer or other technologies are not necessarily far-reaching, including studies that focused on blue-collar jobs. Perhaps reflecting this fact, almost all multi-wave studies of job requirements, including O*NET, updated with a periodicity of 5-10 years.
1 Department of Sociology and Anthropology, Northeastern University, Boston, MA 02115 ([email protected]).
2
2
Introduction
Existing labor force surveys in the United States and elsewhere provide strong cross-sectional and time series data on key variables, such as job-holding, job-seeking, hours worked, earnings, occupation, and industry. However, for numerous reasons, researchers in both the United States and other advanced economies have long sought standard metrics for a richer set of variables on job characteristics and job quality, including the nature of job tasks and job skill requirements, and a range of working conditions (e.g., environmental conditions). Unfortunately, despite some recent improvements, measures of detailed job characteristics remain scarce or thin, and there are no definitive or consensus models to follow. Measures are relatively unstandardized and few have been repeated over time, limiting researchers’ ability to measure change. The unsettled state of research and practice has become a more pressing concern now that the Social Security Administration (SSA) and the Bureau of Labor Statistics (BLS) are conducting the Occupational Requirements Survey (ORS) to populate a database that fills longstanding gaps in measuring job characteristics of the workforce. This report is intended to assist BLS understand (1) historical rates of change in job requirements, (2) potential rates of change in the future, (3) ORS-based metrics that might be used to track changes, and (4) thresholds or cut-points that could be used to define sensible levels of change rates (e.g., slow, moderate, rapid).
However, the paucity of data with long track records means there are no consensus understanding regarding precise rates of change, although there is rather more agreement on the general direction of changes in job requirements, though the evidence on trends in physical requirements is rather mixed. Likewise, the research literature provides few intuitive metrics on how to best measure occupational change and even fewer guidelines for defining categories such as slow, moderate, or rapid change, often relying instead on factor scores that have been standardized relative to the specific sample and survey measures that are available. Established economic indicators, such as the unemployment rate and productivity, have long historical series that give data users an intuitive sense of relative magnitudes and historical benchmarks against which more recent values may be compared. Concepts like unemployment and productivity also correspond to certain objective conditions that help users understand their meanings in absolute terms. For job tasks, skill demands, and other characteristics there are few time series for such benchmarking comparisons and the task of constructing objectively meaningful, canonical metrics remains largely open across the advanced economies. In many respects BLS’ efforts will be fundamental work regarding both best practices in measurement and data collection, and empirical patterns of temporal change.
Understanding rates of change is important for SSA and BLS on substantive grounds, as the agencies must decide which metrics to track and the standards to set for determining when quantitative change is qualitatively important. It is also important from a programmatic perspective insofar as the agencies need to anticipate the likely frequency with which the ORS database needs to be updated. In practice, this is likely to involve choosing between data
3
3
collection cycles that are somewhere between 3 and 10 years in duration, as is the case for related programs such as the NCS (3 years), O*NET (5 years), and the decennial Census (10 years). As the report will show, existing research on rates of occupational change suggests more frequent updating of the ORS along the lines of the annual March CPS is unlikely to be warranted. Likewise, a longer cycle, such as the approximate time between editions of the Dictionary of Occupational Titles (DOT) (13 years), is likely to generate some of the same unease among ORS stakeholders as have been expressed with respect to SSA’s continued use of the 1991 DOT over time. Based on existing research and data, this report suggests an ORS data collection cycle between five and ten years is reasonable, especially when combined with annual updating of the occupational weights based on CPS data regarding the changing sizes of occupations to bridge the gap between successive ORS waves that update the occupational skill scores themselves.
More frequent data collection may be necessary for a subset of fast-changing occupations, but identification of such occupations requires additional research. The rate of change within occupations more generally is a critical unknown and very poorly understood. One important action point that addresses both issues is to investigate within-occupation change rates using the small number of existing short times series with measure of occupational characteristics. For example, five-year change rates for selected measures can be derived from the two O*NET waves completed in 2008 and 2013. Such analyses using O*NET or other data should focus on the particular occupations, data elements, and drivers (e.g., technology) associated with very rapid change. This report discusses this and other proposed analyses that can help BLS gain leverage on issues related to occupational dynamics.
The first section of this report addresses general conceptual issues regarding the study of occupational dynamics relevant to the ORS. The second section reviews existing research and metrics used in the U.S. and other advanced economies, discussing the quality and suitability of different indicators, as well as substantive results regarding rates of change in job tasks. The third section discusses the implications of the preceding for the frequency with which the ORS is updated and discusses the metrics and thresholds BLS and SSA can use to track change in occupational requirements and evaluate their substantive significance.
I. Conceptual issues
A. Within- and between-occupation skill change BLS asks “historically, how have jobs changed over time, and how frequently do we expect jobs to change in the future?” There is a hidden duality of meaning in these questions because job requirements in the economy overall may be altered by either (1) growth/decline in the sizes of different occupations or (2) changes in the internal character of occupations, or some combination of the two. This distinction between between-occupation and within-occupation change is a critical and recurrent point in this report.
4
4
To take a limiting case, if the task content of occupations never changed, then only one wave of the ORS would be necessary to gather the information needed to measure skill change in the economy. In this scenario, all change in job skill requirements and job opportunities available to SSA claimants would be a simple function of changes in the sizes of occupations, which are currently well-tracked by longstanding data series, such as the CPS, decennial Census, and, more recently, the ACS. To meet SSA’s needs for the disability determination process, BLS could simply merge one wave of ORS measures onto occupational employment data to provide figures on the incidence of various kinds of jobs available to SSA claimants (e.g., low-skill sedentary) for the economy overall and by region. Keeping the ORS occupational data current would involve only updating the occupation weights on an annual or biennial basis, which is easily accomplished, and no updating of the ORS scores themselves. Thus, if the sizes of occupations change but not their character or task content, there would be no need to consider how frequently the ORS would need to be updated, as one wave of data in conjunction with regularly updated occupational employment weights would be sufficient. In some sense, then, the need to update the ORS is strictly a function of the extent to which occupations change their internal character. If job and task requirements within occupations never changed then all change in skill requirements overall would be a function of variations in the sizes or weights of different occupations over time.
Although this limiting case might appear unduly restrictive, it is worth noting that updating of occupational employment weights was never possible apparently under SSA’s prior practice. The disability determination process, which used occupation-level exertion and skill scores from the DOT, involved using only information on occupational characteristics to determine available work without any kind of weighting for occupation size. Exclusive reliance on the occupation-level scores reflected the absence of any recognized method for bridging the occupational coding schemes used in the DOT and in other Federal data programs that had information on occupational employment (e.g., CPS, Decennial Census, OES). While exclusive reliance on adjusting occupational employment weights is not a realistic prospect for ORS to provide up-to-date information on job skill requirements, SSA has been unable to incorporate any occupational employment weights in its determinations of available work because of the nature of the DOT. Because the ORS uses standard occupational codes, linking occupation weights and skill scores will not be a problem, and the ORS will capture effects of changes in occupational size over time for SSA’s eligibility determination process for the first time.
More realistically, changes in job skill requirements are a function of shifts in skill requirements within occupations as well as changes in employment shares between occupations. However, no one knows the relative importance of the two components because knowledge regarding the rate of change within occupations is sparse and unsystematic. Early attempts to use the third and fourth editions of the DOT for this purpose foundered with the recognition that the DOT’s data collection procedures fell far short of independent random sampling and measurement (Miller et al. 1980). More recently, many observers and researchers argue the introduction of computer
5
5
technology alters job skill requirements (for reviews, see Handel 2003, 2004). A smaller group believes changes in work organizations, such as employee involvement practices, have upgraded skill requirements within jobs (Handel and Levine 2004; Green 2012). However, research on these questions remains thin and the measures used are unstandardized across studies. No clear consensus has emerged regarding the magnitudes of within-occupation changes along various dimensions, such as physical demands, formal education, or specific cognitive skills. In effect, one of the two key components of a shift-share decomposition remains largely unknown. Data on the changing sizes of occupations are plentiful, but the ORS will be breaking relatively new ground in trying to address the knowledge gap regarding rates of change within occupations.
Both between- and within-occupation components are important for SSA’s eligibility determination process because the number of jobs available to claimants may be affected by any combination of changes in the size of occupations and changes in their character. If a non-sedentary occupation grows in size but is transformed into a sedentary occupation at the same time, then it adds to the stock of sedentary rather than non-sedentary jobs. The ORS seeks to develop a set of skill scores to assign to occupational titles that will be updated over time on a schedule reflecting the rate of meaningful change in the task content of occupations. The standard for what constitutes meaningful change remains to be defined. However, a key problem is that even descriptive information on the rate of within-occupation change is scarce, which constrains any discussion of the optimal periodicity of ORS waves. Indeed, rates of meaningful change are likely to vary by occupation, which adds a further complication for ORS program design. Therefore, the first conclusion from this brief discussion is that understanding rates of within-occupation change is critical both for substantive reasons and for planning the length of ORS data collection cycles and program budgeting.
A second conclusion, perhaps less intuitive, is that understanding and developing metrics for between-occupation shifts is equally necessary because the relative weights of the two components are unknown and both components are necessary for a full accounting of overall skill changes. Between-occupation shifts affecting the availability of jobs requiring different levels of skill and exertion are as relevant for SSA applicants and other users of BLS information as changes due to changing task content within occupations. BLS can use CPS and ACS data on occupational employment shares between ORS waves to update its estimates of the prevalence of different skill requirements to reflect changes in the relative size of occupations. BLS’ well-established occupational projections program can be used to anticipate the effects of changes due to between-occupation shifts in employment composition over a longer time frame, as well.
The effects of between-occupation shifts of job skill requirements have been the subject of significant research using single waves of DOT or O*NET data in conjunction with time series on occupational shares. However, the disparate methods, measures, and findings have not been summarized systematically. Section II.B will discuss in greater detail studies capturing between-occupation effects, employing what could be called incomplete accounting or “semi-shift-share” methods, including their various limitations with respect to ORS’ concerns.
6
6
In addition to being a necessary component for a complete accounting, data on between-occupation shifts have implications for understanding the relative magnitudes of within-occupation shifts and for planning the frequency of ORS waves. Given the unavoidable uncertainty regarding rates of within-occupation skill change, time series changes in occupation sizes and their effects on economy-wide skill levels provide useful benchmarks for “order of magnitude” calculations regarding plausible within-occupation rates of skill change. Different “what-if” scenarios assuming within-occupation skill changes are half as large, equal to, and twice as large as between-occupation shifts would enable one to “back out” a range of likely magnitudes for within-occupation change rates and, by extension, total rates of change. Presumably, there is a limit on how much within-occupation changes can exceed between-occupation changes, if only because very large changes in the task content of jobs would prompt reclassification or redefinition of those jobs as different occupations, like the labeling of some jobs as administrative assistants rather than secretaries in the past twenty-five years. Information on rates of between-occupation change provides useful reference points for what can be expected regarding rates of within-occupation change, as well as providing information on their own impacts on job requirements. If analyses show the effects of between-occupation change are much larger than within-occupation changes, SSA and BLS can be relatively confident that a relatively infrequent ORS data collection cycle with annual interpolations based on changing occupation weights will capture a large majority of the total change in job demands. In other words, if research shows most information on changing job skill requirements is captured by changes in the relative sizes of occupations, which is measured annually by existing programs, then measures of job content, like the ORS, can be updated less frequently as long as the occupation weights are updated frequently. Conversely, if research shows changes in job content within occupations are large then SSA and BLS will have to consider a more frequent data collection cycle for the ORS.
Relatedly, the growth of new and emerging occupations affects the distribution of job skill requirements. Some jobs may be identified as distinct occupations from virtually their initial appearance. Other new jobs are assigned to existing occupations before new titles are created for them, in which case they contribute to the growth of within-occupation heterogeneity before becoming sources of between-occupation change. In either case, new and emerging occupations are manifestations of occupational dynamics by definition because the tasks involved were not performed previously or not in the ways identified currently. The creation of the titles is itself, on its face, evidence of occupational change. Presumably, these jobs represent some of the most dynamic jobs. Therefore, it is natural to use the size and growth rate of occupations that BLS has identified recently as “new and emerging” as another indicator of the speed of between-occupational change. Likewise, the extent to which the task content of these jobs differs from averages calculated using only established occupations would give another indication of the extent to which these jobs are altering overall skill requirements of jobs. Stated simply, to the extent new and emerging occupations remain numerically small and look very similar to existing jobs in terms of skill and exertional demands there is less need for BLS to be concerned with
7
7
updating the ORS on a very frequent schedule. Conversely, to the extent such jobs are numerous and their task content differs greatly from existing mean scores the ORS database will need to be updated more frequently, at least with respect to these jobs. Therefore, a final conclusion of this section is that BLS should integrate information from its studies of new and emerging occupations into the ORS on an ongoing basis to the extent feasible, including both their sizes and job task requirements.
Some indication of the likely importance of new and emerging occupations can be gained by examining the current sizes, decadal growth rates, and relative skill demands of occupations BLS identified as new and emerging ten or more years ago. The data on occupational size and growth rates is available presumably from the decennial Census and CPS, while data on job content could be broken out for comparison with established occupations from the initial wave of ORS data collection when it becomes available. These analyses could provide guidance for BLS in understanding a potentially significant component of change in occupational requirements. Because new and emerging occupations often garner disproportionate interest and attention from various quarters information on the growth and job requirements of new and emerging occupations from 2004-2014 can serve as interim evidence for stakeholders wondering whether SSA and BLS will miss important developments if they were to decide to update the ORS on a longer cycle. Likewise, if analyses show new and emerging occupations can grow large over the course of a decade and differ significantly in skill and exertional requirements from existing occupations, this would argue for more frequent updating of the ORS, at least with respect to new and emerging occupations.
B. Understanding within-occupation skill change and its drivers The most readily available indicator of long-run changes within occupations is the education level of workers within occupations, which can be measured in average years of education or as a distribution across educational categories. Changes in mean years of education are more tractable than comparing distributions over time, but averages can mask important shifts. For example, a significant increase in the proportion of workers in an intermediate-skill occupation who have an associate’s degree as opposed to only graduating high school might appear much smaller when represented as average years of education.2 Because SSA uses only a limited number of educational categories a categorical approach to measuring or reporting educational requirements might be best.
In this and all other recommendations regarding specific measures and cut points the basic principle is that ORS practice should conform to SSA definitions and cut points in the outputs it produces for SSA (e.g., limited education or less, high school graduate or above that does/does 2 For example, if the educational composition within an occupation shifted over ten years from 80% high school graduates and 20% associate’s degree holders to 60% high school graduates and 40% associate’s degree holders, the mean years of education would rise from 12.4 year to 12.8 years. Subjectively, an increase in less than half a year of education over ten years may seem much smaller than a shift of twenty percentage points across education categories, though both figures are representations of the same phenomenon.
8
8
not provide for direct entry into skilled work, etc.). Nevertheless, it is reasonable to assume that BLS would like to use the ORS data program to support its own goals, such as the Occupational Outlook Handbook and occupational skill projections. In this case, the number of educational categories used in reporting results could be more detailed while still remaining tractable.
However, the obvious problem with using trends in workers’ education to measure within-occupation change is that it violates IO Psychology’s cardinal principle that measures of job complexity should describe jobs in a manner that is uninfluenced by the characteristics of the persons who fill them, i.e., occupational skill scores should measure jobs, not the people holding them. The problem affects time series, as well as cross-sectional, studies because workforce education has generally trended upward over time. Insofar as the workforce trend reflects changes in job requirements, general upward trend should be retained in calculations of educational upgrading within occupations. However, to the extent that changes in workforce education reflect other social forces independent of changes in job requirements, the general workforce trend should be subtracted out of occupation-specific trends to capture genuine within-occupation changes in job requirements. If workforce trends reflect some mixture of the two, then an intermediate adjustment would be indicated. Unfortunately, there is no accepted method to determine the extent to which changes in worker education are a valid proxy for changes in job education requirements in the absence of such direct measures, whose availability would render the use of the proxy unnecessary in any case. This quandary illustrates the limitations of existing knowledge regarding occupational dynamics that can inform ORS planning, specifically the difficulty of finding direct measures of job content over long time periods. Issues regarding the use of workers’ own education as a proxy for the education required by their jobs are discussed further in Section II.C.2.
One way to address this issue in the absence of a long time series of job-side measures is to study whether workforce education changes more rapidly within occupations experiencing faster technological change, i.e., regress occupation-level changes in workers’ education on occupation-level changes in technology use. An example of such analyses is provided in Section II.C.2. While not definitive, this can serve as one empirical check on the common but problematic assumption that the growth of worker education reflects growth in the complexity of job demands. In addition, such analyses shed light on the extent to which technology is driving large changes in skills and working conditions, which is perhaps the most commonly-cited reason for believing the missing within-occupation component is important.3
Of course, one problem in trying to use technology to understand the validity of workers’ education as a measure of job change is the scarcity of technology indicators themselves. One source is the CPS supplements on computer and internet use at work, which are potentially very
3 In the context of the ORS, “technology” includes innovations in mechanical technologies (mechanization), which may affect physical job demands, as well as diffusion of information and communication technologies and various forms of automation and digitization.
9
9
useful due to the length of the series and large sample sizes for estimating occupation-level values for the independent and dependent variables. O*NET also contains information on technology use within occupations in its Technology and Tools database, but its utility may be limited because there is no information collected on prevalence or rates of use.
Another strategy is to identify individual occupations believed to be subject to high levels of technological change and examine changes in their job requirements in depth as critical case studies in order to infer plausible upper-bound rates of change within occupations. Assuming technology is the primary driver of skill change, then finding educational attainment among relatively young workers (e.g., ages 25-34) in technologically dynamic occupations change relatively slowly would permit one to infer reasonably that less dynamic occupations probably change even more slowly. For example, it is commonly believed that job requirements have increased significantly for auto mechanics because they interface with microelectronic devices, and that operators and machinists operating or programming computer-controlled machine tools need much higher skills than traditional machine operators or machinists. Likewise, there is a long line of research, though few hard metrics, on the implications of continuous process production technology for the skill requirements of operators working in control rooms in industries such as utilities, chemicals, and steel (cf. Zuboff 1988). These and other well-chosen detailed occupations (“critical cases”) can serve as useful benchmarks for inferring likely rates of change for other occupations in the absence of more comprehensive information.
Another indicator potentially relevant for within-occupation skill change are trends in occupational certification and licensing. There is debate over the extent to which trends in formal credentialing represent rising performance standards for job tasks that remain largely unchanged, genuine job skill increases, or some form of credentialism. However, there is no question that the use of occupational credentials and changes in credentialing are easily collected and objective measures of occupational standards that job-seekers are likely to face in the labor market, even if the narrowly technical rationale for some of them may be unclear or questioned. Clearly, the emergence of even non-binding occupational certifications is relevant for SSA’s eligibility determination process and needs to be incorporated into any system for monitoring changing job requirements within occupations. Presumably, new and emerging occupations are likely to be among the most active in the development of new credentials, as well (e.g., Microsoft network certification).
While data are scarce, there are a number of potentially useful sources of information on skill, technology, and credentialing shifts within occupations that have not been fully exploited. Canvassing state workforce commissions that set or monitor occupational standards with a flexible but standardized protocol may yield information on trends in certifications and changing curriculum guidelines for vocational, technical, and career education at the secondary and post-secondary levels that are indicative of skill shifts. Additional information is available for select occupations from industry and occupational skill standards boards and other sources consulted by teams working on the Occupational Outlook Handbook (OOH), O*NET, and other placement
10
10
services offered by the Employment and Training Administration (ETA). Indeed, successive editions of OOH contain information on formal credentialing, training times, physical tasks, and technology use within occupations that can be used for critical case study analyses and possibly used for trend analyses across all occupation covered if the information can be formatted easily into a standardized, electronic database across years.
A recommendation that emerges from considering this issue is that BLS should work to centralize and standardize information on training, credentialing, and technological change that is currently collected in different programs inside BLS and ETA. BLS might explore ways to expand the collection of data on technology diffusion in cooperation with the Economic Census program at the Department of Commerce, following its Surveys of Manufacturing Technology conducted in 1988 and 1993. Insofar as technology drives changes in job task content, as well as changes in the sizes of occupations, rates of technology adoption should be considered key indicators of the number and kinds of jobs that are facing potential changes in a given time interval. Monitoring occupations subject to technological changes will also give ORS an early warning system indicating particular, faster-changing occupations that may need to be updated on a shorter cycle than the vast majority of occupations.
The preceding has indicated that workers’ personal education is the most easily available indicator of job requirements with the longest historical time series. Trend analyses using worker education as a proxy for job education requirements can easily capture the impacts of both between- and within-occupation changes. There are some methods for assessing the validity of using worker education in this fashion, such as relating it to the few long-run series on job tasks that are available (e.g., changes in computer use within occupations). Other methods of assessing within-occupation change include changes in credentialing and other measures available from OOH and other sources, as well as case studies of occupations believed to be undergoing particularly rapid change. However, the main object of interest for ORS is direct measures of job requirements and task content. Most of the remainder of this report considers existing direct measures of job requirements and what can be learned about occupational dynamics from them, as well as action recommendations for ORS.
11
11
II. Trends in job requirements using existing measures This section reviews and evaluates direct measures of job requirements used in major surveys in the U.S. and other advanced economies that can shed light on occupational dynamics and help inform ORS planning. It is important to note at the outset that many of the measures used in research reviewed below differ significantly from those used by ORS. Indeed, dissatisfaction with existing measures is a key driver of the ORS program. The applicability of previous research findings may be conditioned by the fact that the measures used have comparability issues with respect to measures used in the ORS. This issue is explored below when relevant.
Following the shift-share framework described earlier, section A describes overall trends, section B reviews research capturing effects of between-occupation changes, and section C discusses research on within-occupation change, as well as offering recommendations for additional research that can give ORS greater leverage on this key issue.
A. Research on rates of overall change in job requirements This section reviews research using microdata that permits description of overall trends in job requirements but whose sample sizes, level of occupational coding, or presentation in the original sources do not permit meaningful decomposition of trends into components measuring changes in the relative sizes of detailed occupations and changes in task content within them. Because the effects of the two components cannot be untangled easily, this research gives a general understanding of rates of change and expected overall magnitudes, but does not speak directly to the issue of how frequently occupational skill scores such as ORS must be updated, as opposed to the occupational employment weights associated with them.
The Quality of Employment Surveys (QES) (1969-1977) and two waves of the Panel Study of Income Dynamics (PSID) (1976, 1985) asked respondents the level of formal education needed for their jobs.4 This item is highly comparable to ORS and these data are the only sources of repeated measures for representative samples covering the period 1969 to 1985. However, comparability issues across the two data sets argues for caution in treating them as a single series.5 Table 1 reproduced from Handel (2000b) shows trends in the percentage distribution of job required education using a consistent coding across surveys and waves. Cases were restricted to workers over age 25 working at least 20 hours per week to make samples from the two surveys as comparable as possible, but some differences in the universes of respondents likely remain. In terms of absolute levels, the distribution of jobs in the PSID 1976 sample is in some ways more similar to the QES 1969 than to the essentially contemporaneous QES 1977.
4 The first wave of the QES was named the Survey of Working Conditions (SWC) (1969). All three waves of the SWC/QES were funded in whole or in part by the Employment Standards Administration, United States Department of Labor. 5 Nevertheless, while the PSID design differs from the QES in being a panel study, the survey weights should make each cross-section representative of the population and neutralize that source of difference, at least to a substantial degree.
12
12
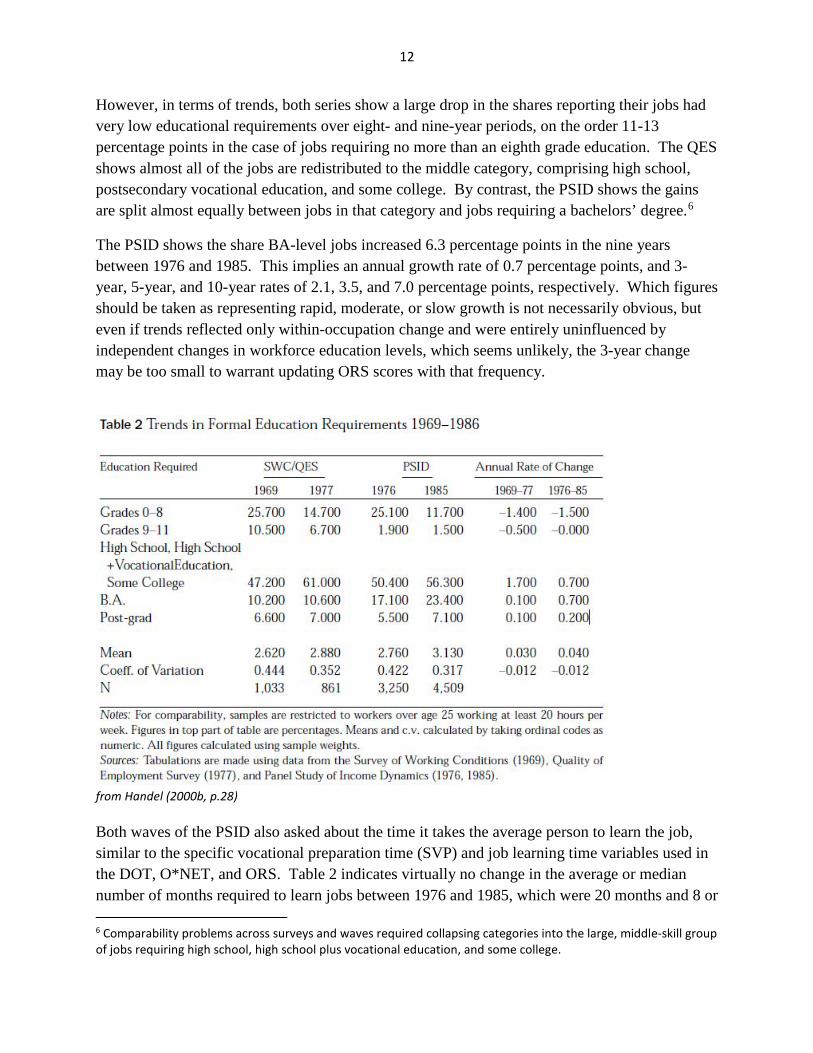
However, in terms of trends, both series show a large drop in the shares reporting their jobs had very low educational requirements over eight- and nine-year periods, on the order 11-13 percentage points in the case of jobs requiring no more than an eighth grade education. The QES shows almost all of the jobs are redistributed to the middle category, comprising high school, postsecondary vocational education, and some college. By contrast, the PSID shows the gains are split almost equally between jobs in that category and jobs requiring a bachelors’ degree.6
The PSID shows the share BA-level jobs increased 6.3 percentage points in the nine years between 1976 and 1985. This implies an annual growth rate of 0.7 percentage points, and 3-year, 5-year, and 10-year rates of 2.1, 3.5, and 7.0 percentage points, respectively. Which figures should be taken as representing rapid, moderate, or slow growth is not necessarily obvious, but even if trends reflected only within-occupation change and were entirely uninfluenced by independent changes in workforce education levels, which seems unlikely, the 3-year change may be too small to warrant updating ORS scores with that frequency.
from Handel (2000b, p.28) Both waves of the PSID also asked about the time it takes the average person to learn the job, similar to the specific vocational preparation time (SVP) and job learning time variables used in the DOT, O*NET, and ORS. Table 2 indicates virtually no change in the average or median number of months required to learn jobs between 1976 and 1985, which were 20 months and 8 or 6 Comparability problems across surveys and waves required collapsing categories into the large, middle-skill group of jobs requiring high school, high school plus vocational education, and some college.
13
13
9 months, respectively. A percentage breakdown of respondents by intervals of training time in the second panel also shows remarkable stability. Medians within levels of job required education and broad occupation groups show almost no change, as well. The large decline in the median SVP for workers with postgraduate degrees reflects a clustering of cases around the median; the mean shows no meaningful change (Handel 2000b, p.32). The stability is notable because the data cover the period during which upper and lower white-collar jobs experienced a surge of computer use. However, there is no increase in training time for these jobs even though few workers could have learned to use computers in school this early in the diffusion process. If the first large-scale appearance of computers in the workplace increased job training requirements dramatically, it fails to register in these data.
from Handel (2000b, p.31)
14
14
More recent data from the European Union on job tasks and working conditions also shows great stability. The European Working Conditions Survey (EWCS) is conducted by the European Foundation for the Improvement of Living and Working Conditions, an official EU agency, every five years since 1995. The pilot conducted in 1990 also extends the time series for a small number of items even earlier. The EWCS contains measures relating to cognitive, interpersonal, and physical job requirements but its central focus is more quality of work life, like the QES, than job analysis or skills measurement, like the DOT, O*NET, and ORS. Consequently, the items are less concrete and more subjective than desirable for the ORS. Unfortunately, such basic items as education required for job and SVP are absent, as well. Nevertheless, the series is highly unusual for its historical depth, continuity of the items, and breadth of country coverage. The EWCS includes self-employed workers, but all figures in the tables below refer to wage and salary workers only. Country data are reported here for the EU-15 only in order to maximize comparability with the United States. Table 3 presents trends for three questions in the EWCS regarding cognitive job requirements. A series of yes-no questions asked workers whether their job involved complex tasks, solving unforeseen problems on their own, and learning new things. Figures in the table show the weighted percentage responding “yes.” Results for the EU-15 as a whole are sample averages in which person weights were adjusted by the size of each country’s workforce in that year, derived from the European Labour Force Surveys (author’s calculations). The figures for the EU-15 and individual countries show no positive trend between 1995 and 2005. For problem solving and learning new things the trend appears to be negative. Some means for individual countries, such as complex tasks in Sweden, show some implausibly large swings, while the patterns for others are less erratic. The pattern continued for the 2010 wave. The report of top-line results noted with some disappointment,
A fundamental aspect of developing in a job is having the opportunity to tackle cognitive challenges at work—for instance, learning new things, solving unforeseen problems on one’s own, or performing complex tasks. This is important both for workers’ own well-being, and for companies to ensure that they continually upgrade their in-house capacity to create and innovate. Broadly speaking, there has been no marked improvement over time in this respect.7
7 From “Changes over time – First findings from the fifth European Working Conditions Survey.” European Foundation for the Improvement of Living and Working Conditions. Available at http://www.eurofound.europa.eu/pubdocs/2010/74/en/1/EF1074EN.pdf (accessed 2012).
Note: Figures are percentages responding “yes” to questions on whether their main job involves “complex tasks,” “learning new things,” and “solving unforeseen problems on your own.” Wage and salary workers only. Country means use country- and year-specific post-stratification weights; EU-15 means adjust those weights by the relative size of each country’s workforce for each year derived from the European Labour Force Survey.
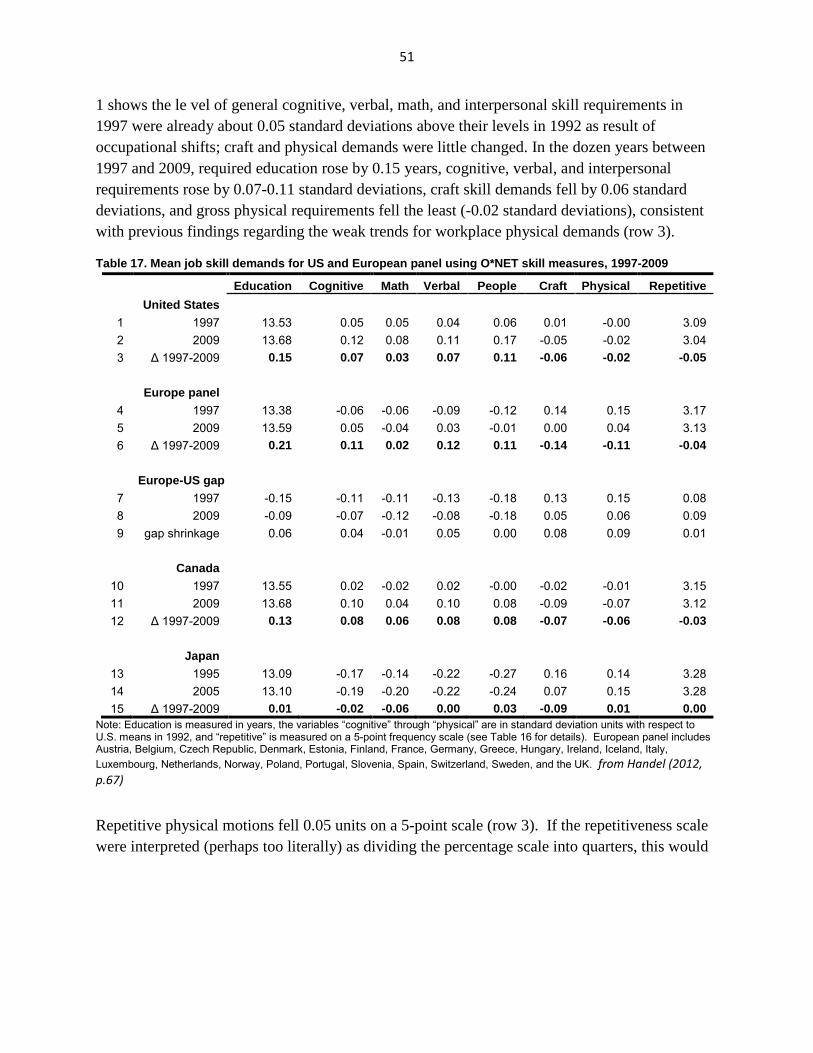
from Handel (2012, p.51) It is also interesting to note that respondents are much less likely to say their work involves complex tasks than problem-solving or learning new things. For example, in 2005 the simple country average differences were 21 and 14 percentage points, respectively. The disparate level of positive responses to these items could be taken as an indication of the importance of using multiple-item scales, as well as the dangers of drawing inferences that extend beyond the data. It is possible that many jobs require problem solving and continuous learning at a sufficiently low level that they do not contribute a great deal to job complexity. However, it is also possible that the real problem is the greater vagueness of the questions on problem-solving and learning new things, which permits more elastic interpretations on the part of respondents than the item on complexity, which explicitly references the concept of difficulty level. The survey does not give respondents standardized guidelines or objective benchmarks for what constitutes an “unforeseen problem” or a “new thing,” while the item on complexity contains an explicit indication that a significant, albeit undefined, threshold must be cleared for an affirmative response.
16
16
Not all indicators in the EWCS that might be associated with cognitive demands show such stability. Table 4 shows trends in the percentage of employees spending at least one-quarter of their work time using a computer on the job. Both the question and the response options relating to time spent are admirably concrete. Computer use rose nearly one percentage point per year between 1990 and 2005 in the EU and is the strongest trend among all the EWCS measures examined here.8 Whereas 35.7% of employees in EU countries used computers in 1990, the share rises to 49.1% in 2005. There is significant cross-sectional variation across countries in generally expected patterns, as well. Obviously, the computer item differs from the others in referring to a specific, material object and is unlikely to suffer from the same level of variable, Table 4. Trends in computer use and interpersonal job requirements in the EU, 1990-2005 from Handel (2012, p.52)
Note: Figures are percentages saying they spend at least one-quarter of their time working with computers and dealing directly with people who are not employees at their workplace, such as customers, pupils, and patients. Wage and salary workers only. Country means use country- and year-specific post-stratification weights; EU-15 means adjust those weights by the relative size of each country’s workforce for each year derived from the European Labour Force Survey. Only EU-12 countries participated in the 1990 survey wave.
8 Although the EU averages for 1990 and 1995-2005 refer to slightly different groups of countries, restricting the latter to the EU-12 barely alters the results.
17
17
subjective interpretations as the more general items in Table 3. Nevertheless, computers are considered one of the main drivers of recent skill changes and it is notable that the strong growth in computer use in these data is not accompanied by a parallel trend in cognitive job demands using the previous measures. Table 4 also shows trends in the principal item on interpersonal demands in the EWCS, the percentage of employees spending at least one-quarter of their work time dealing directly with people who are not employees at their workplace, such as customers, pupils, and patients. Dealing with the public is the main longitudinal indicator of general interpersonal requirements in the EWCS. Again, and rather unexpectedly, there is no obvious trend in the percentage of workers having contact with the public between 1995 and 2005. Table 5 shows trends for five indicators of physical job requirements from the EWCS. These questions are generally more concrete than the cognitive skill items, which may account for the generally lower rates of positive responses. The first three are closely connected to blue-collar jobs: (1) spending at least half of work time carrying or moving heavy loads, (2) machine-paced work (1=yes), and (3) exposure to vibrations from tools and machinery for at least one-quarter of work time. Although the failure to define “heavy loads” in terms of actual weight represents a missed opportunity, the EWCS response options relating to time spent for the first and third items are much better than other common alternatives that are less concrete (e.g., rarely, sometimes, often, always). These items have relatively high comparability to ORS items, especially relative to the items in Table 3. Table 5 indicates approximately 15-25% of EU workers carry heavy loads for at least half of their work time, experience machine-paced work, or work with machinery exposing them to vibrations for at least one-quarter of work time. Focusing specifically on changes rates, there appears to be no trend for carrying heavy loads for 1990-2005. Jobs in the EU-15 that are machine-paced and exposed to machine vibrations decreased modestly by 4.0 and 2.6 percentage points for the ten-year period 1995-2005, respectively. The 5-year rates implied by these figures are 2.0 and 1.3 percentage points, while the 3-year figures are 1.2 and 0.8 percentage points. Again, even assuming none of the latter two trends reflect changes in occupational composition, the implications of these results for the length of the ORS collection cycle is a matter of judgment and resources. If SSA considers changes on the order of the 3-year rates shown here to be large enough to warrant close monitoring, then readministering the ORS on a three-year basis may be pursued.
Note: Figures are percentages saying they spend at least one-half of their time working carrying or moving heavy loads and making repetitive hand or arm movements, at least one-quarter of their time “exposed to vibrations from hand tools, machinery, etc.,” and answered “yes” to questions asking whether their work pace is “dependent on the automatic speed of a machine or moving of a product” and whether their job involved “monotonous tasks” or not. Wage and salary workers only. Country means use country- and year-specific post-stratification weights; EU-15 means adjust those weights by the relative size of each country’s workforce for each year derived from the European Labour Force Survey. Only EU-12 countries participated in the 1990 survey wave.
19
The final two EWCS physical demand measures are less closely tied to blue-collar occupations, (4) spending at least half of work time making repetitive hand or arm movements and (5) whether the job involves monotonous tasks (1=yes). Approximately 40-50% of employees report that their jobs require repetitive motions for at least half of their workday or that their jobs involve monotonous tasks. Although one might expect the repetitive motion item is particularly applicable to assembly-line and similar physical work, the item clearly elicits more general assent. It is likely that computer users, clerical workers, and workers in retail, food service, and other routine services responded positively to both of these items.9 Most relevant for the ORS, neither of these measures show clear trends for 1995-2005. For all of the physical demand measures in Table 5, top line results from the EWCS 2010 wave also indicated trends were either flat or moved in the opposite direction from what would be expected from the skills upgrading perspective except for a slight decline in the prevalence of machine-paced work.10 The General Social Survey (GSS) modules on quality of work life have a number of items relevant for ORS, some asked every four years between 2002 and 2014. Some indication of the results relevant for ORS are the distributions for the two years when respondents were asked to “rate the overall physical effort at the job you normally do.” Table 6 shows about 20% of workers in both 2010 and 2014 says their job involves “very hard” or “hard” physical effort and about another quarter says their physical effort level at work is “somewhat hard.” Interestingly, the proportions giving the polar responses have declined and more workers say the physical effort is “hard” or “somewhat hard” compared to the other options. Nevertheless, the changes over the four years are relatively modest and reinforce the conclusions from the EWCS. Table 6. Trends in Overall Physical Effort on the Job in the U.S. (2010-2014)
2010 2014 Change Very hard 8.7 7.2 -1.5 Hard 11.5 13.2 1.7 Somewhat hard 25.4 27.2 1.9 Fairly light 28.4 27.7 -0.7 Very light 26.1 24.7 -1.4
Total 100.0 100.0
N 1,159 1,241 Note: Author’s calculations from General Social Survey (Smith, Marsden, Hout 2016, p.1495).
9 The item on monotony may be better considered as a measure of cognitive job skill requirements and perhaps job satisfaction, as well, given the inevitably subjective quality of the judgment it seeks from respondents. 10 See fn. 7.
20
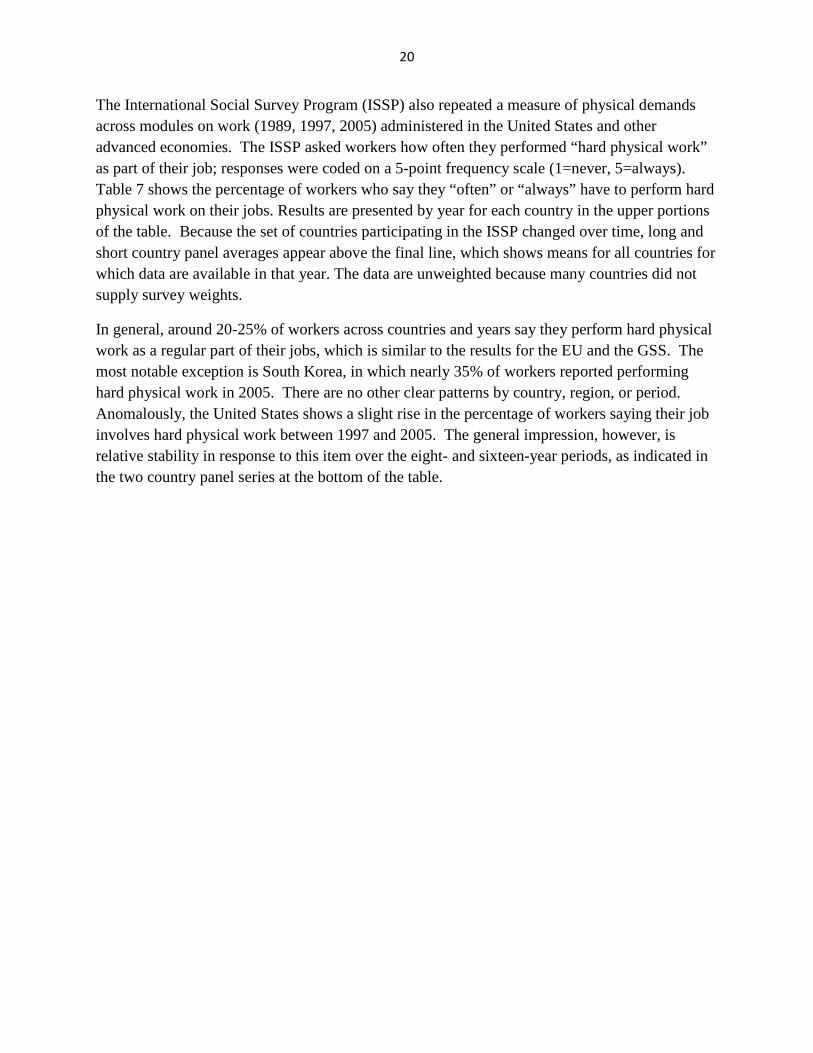
The International Social Survey Program (ISSP) also repeated a measure of physical demands across modules on work (1989, 1997, 2005) administered in the United States and other advanced economies. The ISSP asked workers how often they performed “hard physical work” as part of their job; responses were coded on a 5-point frequency scale (1=never, 5=always). Table 7 shows the percentage of workers who say they “often” or “always” have to perform hard physical work on their jobs. Results are presented by year for each country in the upper portions of the table. Because the set of countries participating in the ISSP changed over time, long and short country panel averages appear above the final line, which shows means for all countries for which data are available in that year. The data are unweighted because many countries did not supply survey weights.
In general, around 20-25% of workers across countries and years say they perform hard physical work as a regular part of their jobs, which is similar to the results for the EU and the GSS. The most notable exception is South Korea, in which nearly 35% of workers reported performing hard physical work in 2005. There are no other clear patterns by country, region, or period. Anomalously, the United States shows a slight rise in the percentage of workers saying their job involves hard physical work between 1997 and 2005. The general impression, however, is relative stability in response to this item over the eight- and sixteen-year periods, as indicated in the two country panel series at the bottom of the table.
21
Table 7. Percentage of employees performing hard physical work (International Social Survey Program)
1989 1997 2005
percent N percent N percent N
1a. Anglo-Saxon
United Kingdom 23.7 699 21.8 569 20.4 486 Ireland 23.4 475 -- -- 22.4 563 United States 21.6 849 21.7 824 24.2 1,012 1b. Continental Austria 19.5 865 -- -- -- --
2a. Anglo-Saxon Canada 26.2 645 18.3 590 New Zealand 25.6 738 22.9 883 2b. Continental France 19.1 698 21.6 1,065 Germany-East 22.3 283 21.2 307 Switzerland 17.5 1,771 19.8 683 2c. Nordic Denmark 21.9 690 26.1 1,216 Sweden 26.0 813 26.1 843 2d. South’n Europe Portugal 26.5 884 25.8 1,077 Spain 24.4 406 27.8 564 2e. East Asia Japan 17.2 772 18.7 568 3a. Anglo-Saxon
Australia 20.1 1,152 3b. Continental Belgium (Flanders) 19.3 782 3c. Nordic Finland 23.5 727 3d. East Asia South Korea 34.9 885 Country panels
1989-2005 22.0 3,338 22.2 3,750 22.5 3,123
1997-2005 22.0 7,700 23.3 7,796
All countries 21.0 6,250 21.5 13,108 23.3 15,028
Note: Survey question asked about job, “How often do you have to perform hard physical work?” (1=never, 2=hardly ever, 3=sometimes, 4=often, 5=always) and figures are percentage responding “often” or “always.” Countries are grouped in the table by first year of participation in the ISSP. Data are unweighted because many countries did not supply survey weights. Country panels 1989-2005: Germany (West), United Kingdom, Norway, United States; 1997-2005: Canada, Denmark, France, Germany (East), Japan, New Zealand, Portugal, Spain, Sweden, Switzerland from Handel (2012, p.46)
22
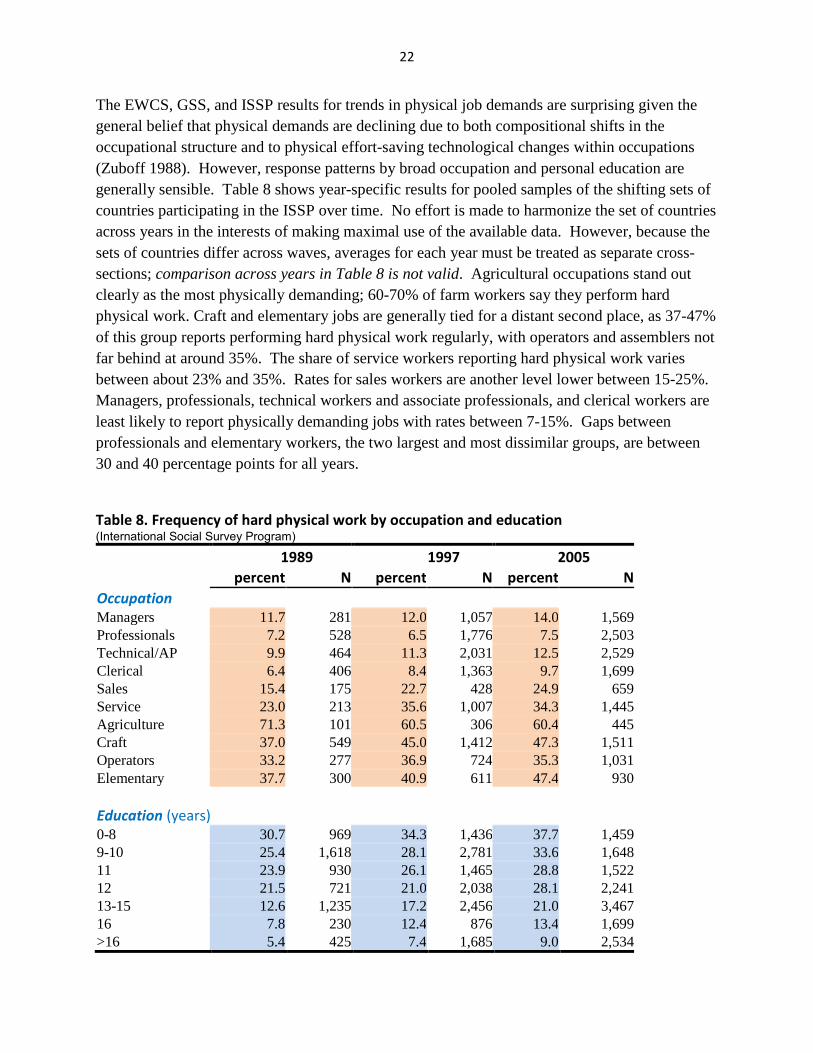
The EWCS, GSS, and ISSP results for trends in physical job demands are surprising given the general belief that physical demands are declining due to both compositional shifts in the occupational structure and to physical effort-saving technological changes within occupations (Zuboff 1988). However, response patterns by broad occupation and personal education are generally sensible. Table 8 shows year-specific results for pooled samples of the shifting sets of countries participating in the ISSP over time. No effort is made to harmonize the set of countries across years in the interests of making maximal use of the available data. However, because the sets of countries differ across waves, averages for each year must be treated as separate cross-sections; comparison across years in Table 8 is not valid. Agricultural occupations stand out clearly as the most physically demanding; 60-70% of farm workers say they perform hard physical work. Craft and elementary jobs are generally tied for a distant second place, as 37-47% of this group reports performing hard physical work regularly, with operators and assemblers not far behind at around 35%. The share of service workers reporting hard physical work varies between about 23% and 35%. Rates for sales workers are another level lower between 15-25%. Managers, professionals, technical workers and associate professionals, and clerical workers are least likely to report physically demanding jobs with rates between 7-15%. Gaps between professionals and elementary workers, the two largest and most dissimilar groups, are between 30 and 40 percentage points for all years.
Note: AP=associate professionals. Note that the changing set of countries in the ISSP samples across years means that values cannot be compared across columns. Due to problems in occupational codes the following countries in the prior table are excluded from the upper panel of this table for some years: United Kingdom, Ireland, Italy, and Netherlands (1989) and Netherlands and Japan (1997). Countries in the lower panel are the same as in the main table.
from Handel (2012, p.48)
Results in the bottom panel show personal education has a consistent negative relationship with physical job demands in all years. When the lowest and highest educational categories are compared in terms of the original 5-point scale, the difference is approximately 1.1 scale points or 0.9 standard deviations (not shown). However, personal education is not as important as occupation. In a simple OLS model for the long panel countries, 4-digit ISCO11 occupation entered alone yields an adjusted R2 of 0.41, while a model with only education, experience, gender, and marital status (and their interaction) has an adjusted R2 of 0.13 (Handel 2012, p.47). From a cross-sectional perspective, the item seems to function sensibly when cross-validated against broad occupation and personal education, showing a much stronger relationship with occupation than personal education, as one would hope. Trend analyses using ordinal logit models confirm self-reported physical job demands did not decline over time for ISSP respondents in the United States and were either flat or trended downward modestly for other countries (Handel 2012, p.47). Though unexpected, these weak findings are within the range found in other studies for this period for the U.S. (Johnson, 2004; Steuerle, Spiro, and Johnson 1999) and UK (Felstead et al. 2007, pp.87ff. and see below). However, it is quite possible that there are methodological problems with the items in the ISSP and EWCS, which appear rather vague, overly general, and consequently open to varying interpretations by respondents.12 Survey items that are more concrete and carefully crafted might show different temporal patterns, but there are few other repeated cross-sectional surveys in any country with a consistent set of job measures. More consistent with expectations, results in the next section using a single cross-section of job scores and changing occupation employment weights show clear negative trends for job physical requirements in the U.S. and other OECD countries. Nevertheless, the magnitudes are difficult to assess given the arbitrary scalings of the DOT and O*NET variables. Consequently, it is possible the declines might be sufficiently modest in practical terms as to be compatible with the results presented in this section. Finally, the UK Skills Survey (UKSS) and its predecessors is a broad spectrum survey of job requirements covering 1986-2012 for job required education and SVP and 1997-2012 for a more detailed set of job skill and task items (see, e.g., Felstead et al. 2007). A full report of top-line
11 ISCO = International Standard Classification of Occupations. 12 Some of these problems and other challenges of cross-national surveys are recognized (Parent-Thirion et al. 2007, p.97).
24
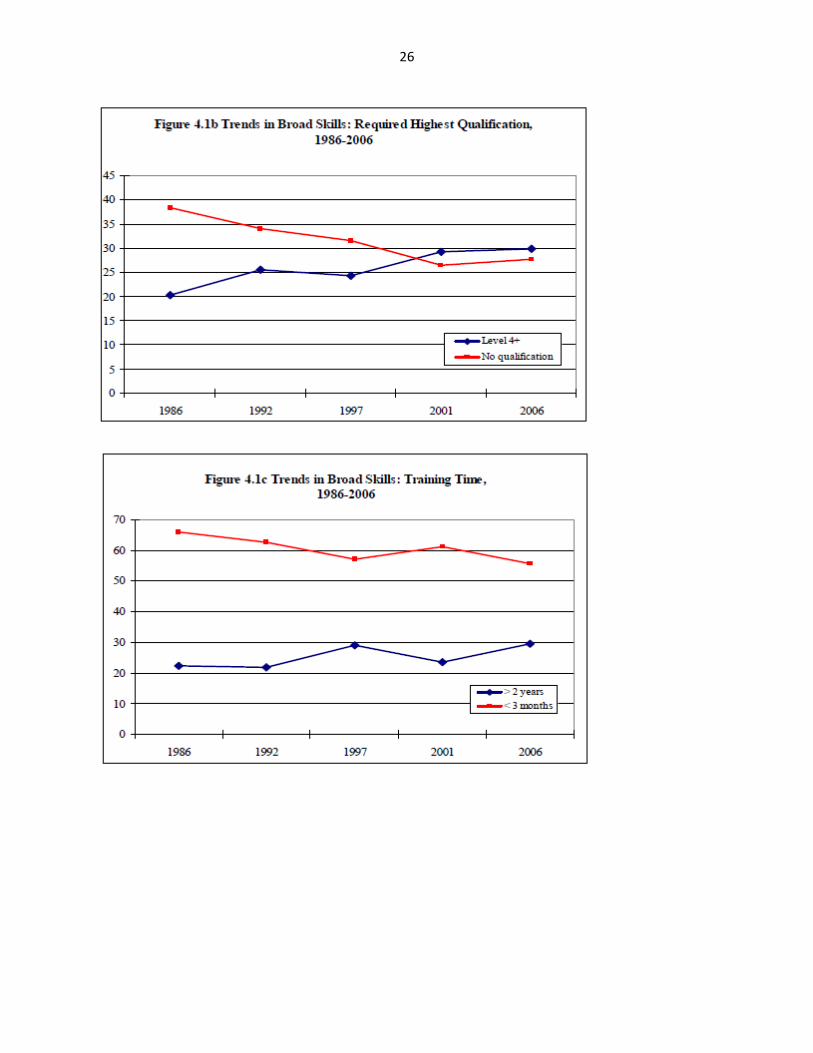
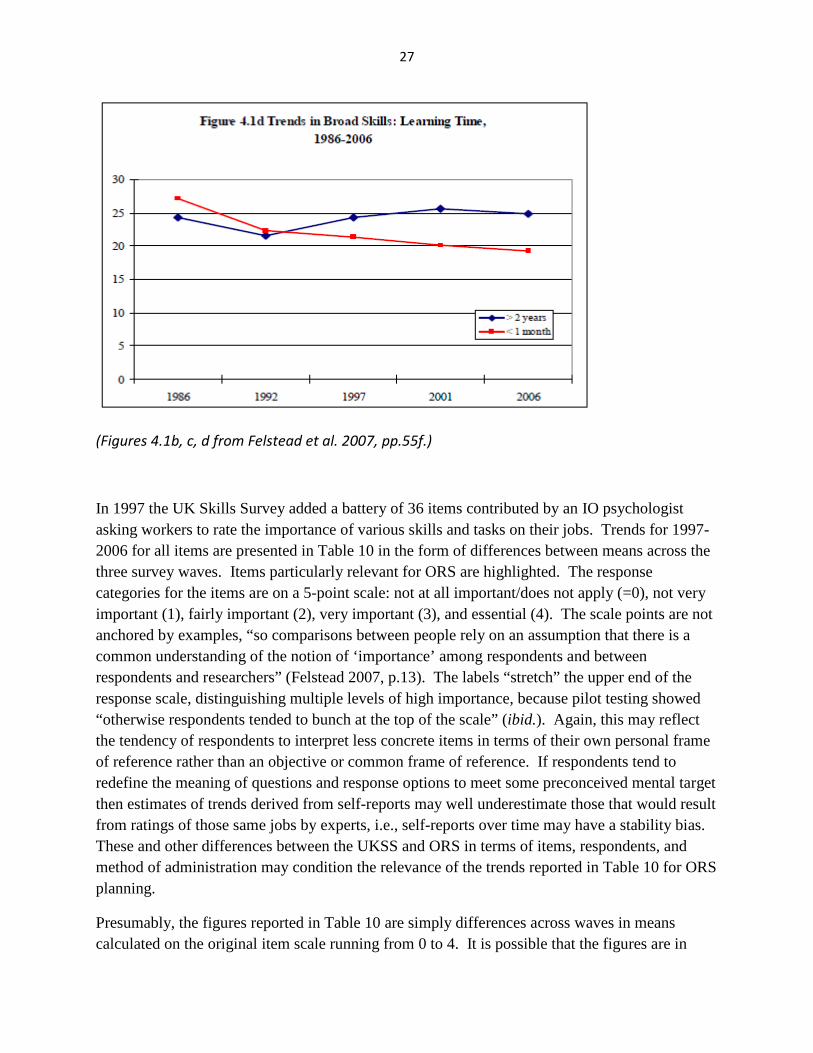
findings from the 2012 wave has not appeared yet, so figures below end at 2006 except for those supplemented by a short brief reporting on the 2012 results (Feldstead et al. 2013). Trends in required education, pre-employment training, and job learning times, which overlaps with the SVP concept, are presented in Table 9 and the figures labeled 4.1b, 4.1c, and 4.1d. The item on job required education is, “If they were applying today, what qualifications, if any, would someone need to get the type of job you have now?” The levels have been characterized as “no qualifications, poor lower secondary, lower secondary, upper secondary, non-degree higher education and degree-level higher education” (Gallie, Felstead, Green 2003, p.408). Table 9 (panel a) and Figure 4.1b show clear, if somewhat halting, upward trends in job education requirements. The period 1997-2001 shows the most rapid change, with the share of jobs requiring the top education category growing by 1.23 percentage points annually and the share requiring no educational qualifications declining by 1.25 percentage points annually. The most recent wave shows roughly similar, slightly faster rates of change over the six years 2006-2012 (Feldstead et al. 2013). The shares in the other three education levels were little changed, which conveniently permits most change across the five categories to be captured by examining trends in just the two extremes. Whether trends in ORS responses can be captured equally parsimoniously remains to be seen. The pattern also indicates a general upgrading of education requirements rather than polarization, as sometimes suggested. Again, whether even the most rapid recent annual change rates argue for a 3- or 5-year cycle for ORS frequency is best answered by SSA relative to their needs and resources. The item on pre-employment training times are, “Since completing full-time education, have you ever had or are you currently undertaking, training for the type of work you currently do?” Respondents answering positively indicated the length of training in terms of duration intervals (< 1 month, < 3 months, 3-6 months, 6-12 months, one to two years, > two years). Table 9 (panel b) and Figure 4.1c show much more erratic trends for this indicator. When the share of jobs requiring long training times grew most rapidly, the implied annual growth rate was 1.4 percentage points, while the share of jobs requiring little training also declined most rapidly at an annual rate of 1.1 percentage points (1992-1997). The item most comparable to SVP asked respondents, “How long did it take for you after you first started doing this type of job to learn to do it well?” and offered a similar set of response options as the pre-employment training item. Table 9 (panel c) and Figure 4.1d show no real trend over time in the percentage of jobs requiring more than 2 years of learning once data for 1992 are excluded. By contrast, the trend is consistently negative for the share of jobs requiring very short learning times. However, the most rapid period of decline was 1986-1992, when the average annual rate was -0.8 percentage points, after which the rate decelerated to merely -0.21 percentage points for the four waves over the fourteen years, 1992-2006.
25
Preliminary results suggest trends toward longer training and learning times have halted or even reversed somewhat between 2006 and 2012. Although education and training/learning are partial substitutes, the recent trend cannot be explained solely on the basis of compositional shifts that have increased the proportion of more educated workers and jobs because the halting and reversals are found within those groups, as well (Feldstead et al. 2013).
Table 9. Trends in Broad Skills in the UK, percentage distribution
(Figures 4.1b, c, d from Felstead et al. 2007, pp.55f.)
In 1997 the UK Skills Survey added a battery of 36 items contributed by an IO psychologist asking workers to rate the importance of various skills and tasks on their jobs. Trends for 1997-2006 for all items are presented in Table 10 in the form of differences between means across the three survey waves. Items particularly relevant for ORS are highlighted. The response categories for the items are on a 5-point scale: not at all important/does not apply (=0), not very important (1), fairly important (2), very important (3), and essential (4). The scale points are not anchored by examples, “so comparisons between people rely on an assumption that there is a common understanding of the notion of ‘importance’ among respondents and between respondents and researchers” (Felstead 2007, p.13). The labels “stretch” the upper end of the response scale, distinguishing multiple levels of high importance, because pilot testing showed “otherwise respondents tended to bunch at the top of the scale” (ibid.). Again, this may reflect the tendency of respondents to interpret less concrete items in terms of their own personal frame of reference rather than an objective or common frame of reference. If respondents tend to redefine the meaning of questions and response options to meet some preconceived mental target then estimates of trends derived from self-reports may well underestimate those that would result from ratings of those same jobs by experts, i.e., self-reports over time may have a stability bias. These and other differences between the UKSS and ORS in terms of items, respondents, and method of administration may condition the relevance of the trends reported in Table 10 for ORS planning.
Presumably, the figures reported in Table 10 are simply differences across waves in means calculated on the original item scale running from 0 to 4. It is possible that the figures are in
28
some kind of standard deviation units but this is not evident from the explanation of the table in the original report (Felstead et al. 2007, pp.90f.). Even accepting the differences represent changes along the raw scale, problems of interpretation remain, as levels of importance is not a concrete, standard, or self-explanatory metric. This is one example of a more general problem of finding metrics for understanding the substantive significance of differences of social science scales. One approach relevant for ORS that will be discussed further in a subsequent section is to use 1-digit occupations or certain well-known detailed occupations as illustrative anchors. For example, it would be useful to know the mean ratings of Dealing with people that were given by managers, supervisors, physicians, secretaries, machine operators, and janitors. Understanding the distances between these groups in terms of the 0-4 scale would give some context for understanding how large one might view the 0.12 point growth in the overall mean between 1997 and 2006, i.e., how far did the entire workforce go with respect to the scale distances separating these prototypical jobs.
Despite problems of interpretation, some important points from Table 10 are evident. Almost all differences in item averages, including those highlighted, indicate statistically significant job upgrading over 1997-2006, which, again, reflects the combined effects of changes in occupational composition and in ratings within occupations. One exception, consistent with prior results in this section, is the absence of significant change in the physical strength and stamina requirements between 1997 and 2006, though the importance of using and/or operating tools, equipment, and machinery declined. Most of the knowledge and problem-solving items highlighted showed gains over time, as did the reading, writing, and numeracy questions. Further clarification of the units is needed, but whether they represent fractions of scale points or fractions of a standard deviation, the changes never totaled more than 0.32 for any item other than computer use over the nine-year period. Thus, implied total changes over 3- and 5-year periods did not exceed 0.11 and 0.17, respectively. While these estimates may be attenuated by stability biases in item responses, these results do not suggest the need for more frequent updating of skill scores than the UKSS already practices, generally every 5-6 years.
29
Table 10 Trends in Detailed Skills in Difference Form, 1997-2006
Detailed Skills 2006 average - 1997 average
2006 average - 2001average
Paying close attention to detail 0.01 0.03 Dealing with people 0.12* 0.11* Instructing, training or teaching people 0.23* 0.11* Making speeches or presentations 0.29* 0.17* Persuading or influencing others 0.24* 0.17* Selling a product or service 0.00 0.05 Counselling, advising or caring for customers or clients
0.17*
0.01
Working with a team of people 0.17* 0.10*
Listening carefully to colleagues 0.18*
0.03
Physical strength 0.03 0.06 Physical stamina 0.04 0.05 Skill or accuracy in using hands or fingers 0.04 -0.14* How to use or operate tools/equipment/machinery
-0.15*
-0.17*
Knowledge of particular products or services
0.18*
0.09*
Specialist knowledge or understanding 0.31* 0.12* Knowledge of how your organisation works
0.32*
0.10*
Using a computer, PC, or other types of computerised equipment
0.62*
0.24*
Spotting problems or faults 0.00 -0.05* Working out the causes of problems or faults
0.04
-0.06*
Thinking of solutions of problems or faults
0.17*
0.02
Analysing complex problems in depth 0.30* 0.22*
30
Table 10 Trends in Detailed Skills in Difference Form, 1997-2006 (cont’d)
Detailed Skills 2006 average - 1997 average
2006 average - 2001average
Checking things to ensure there are no errors
0.13*
0.06*
Noticing when there is a mistake 0.14* 0.04*
Planning your own activities 0.18* 0.05 Planning the activities of others 0.16* 0.07* Organising your own time 0.23* 0.06* Thinki ng ahead 0.18* 0.07* Reading written information such as forms notices or signs
0.10*
0.03
Reading short documents such as short 0.22*
0.10* reports, letters or memos
Reading long documents such as long 0.24*
0.13* reports, manuals, articles or books
Writing written information such as forms notices or signs
0.16*
0.03
Writing short documents such as short reports, letters or memos
0.30*
0.11*
Writing long documents such as long reports, manuals, articles or books
0.31*
0.11*
Adding, subtracting or dividing numbers 0.02 -0.04 Calculations using decimals, percentages or fractions
0.14*
-0.01
Calculations using more advanced mathematical or statistical procedures
0.20*
0.05
Items with particular relevance for the ORS are shaded. * statistically significant at the 5% level. (from Felstead et al. 2007, pp.90f.)
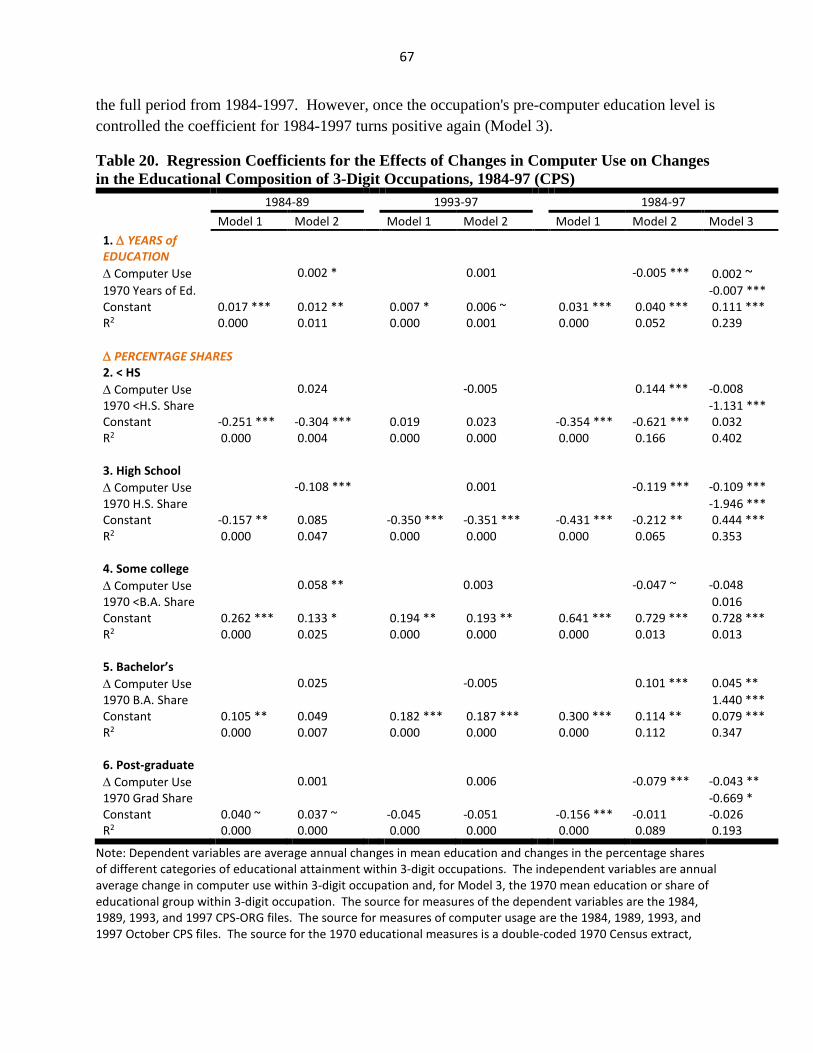
B. Research on rates of change due to between-occupation effects This section reviews research capturing effects of between-occupation changes. Whereas results in the previous section reflected both between- and within-occupation effects in unknown proportions, this research allows one to isolate the effects of between-occupation changes but does not reflect any changes that may be occurring within detailed occupations for which ORS collects ratings. Although these measures of skill change are partial, they do shed light on
31
underlying drivers in the form of the changing relative sizes of occupations, which the overall trend results do not. Given the stronger evidence base on trends in the sizes of detailed occupations as opposed to their task content, research on between-occupation effects is positioned to contribute firmer knowledge to the understanding of drivers than research on within-occupation effects. Knowledge of past trends is relevant for anticipating the rate of future skill changes. Cross-sectional skill scores can also be weighted by BLS projected occupational employment at the detailed occupational level to provide more direct estimates of expected future trends. Finally, understanding the magnitude of the between-occupation effects provides a benchmark and frame of reference for expectations regarding plausible magnitudes of within-occupation effects, as well. This section considers the between-occupation component of skill change from two perspectives. At a very broad level, overall trends are driven by changes in the relative sizes of 1-digit occupations, which can be ranked in a rough and imperfect fashion with respect to many variables relevant to the ORS on the basis of prior knowledge (e.g., Table 8, above) and theoretical expectations. Examining the pace of change at this high level of aggregation is useful because long time series data are available for a relatively consistent set of broad occupation categories for many decades and countries. Broad occupation accounts for a substantial proportion of the variance of numerous skill scores measured at the individual and detailed occupation levels and changes in employment shares by broad occupation undoubtedly captures a significant portion of the total change over time. In addition, long historical series are generally necessary for putting recent trends into some kind of context. Whereas the QES, PSID, and other survey evidence examined previously covered generally short time spans, recent short-run trends in broad occupation can be compared to previous periods over a much longer time frame. Although some argue the pace of change has been unusually rapid recently and will accelerate in the future (e.g., Hassett and Strain 2016), it is impossible to know whether or to what extent this is the case in the absence of historical data on prior rates of change. In sum, because broad occupation is generally informative with respect to skill shifts, understanding long-run trends is a convenient proxy for gaining an initial perspective on skill trends themselves. Trend data on the sizes of detailed occupations provide much finer detail on changes over time. However, detailed occupation is a nominal variable that cannot be ranked reasonably well using informal methods, as can be done with 1-digit occupation. Merging a cross-section of occupation-level skill scores onto occupational employment information transforms detailed occupation from a variable that is nominal to one that is ordinal or better. The DOT and O*NET are the most common source of cross-sectional skill scores, but others are available, as well. These scores can also be merged onto BLS occupational projections to gain some sense of future trends. Of course, cross-sectional skill scores are emphasized here only because of the general scarcity of repeated measures of job skill requirements and working conditions relevant to ORS.
32
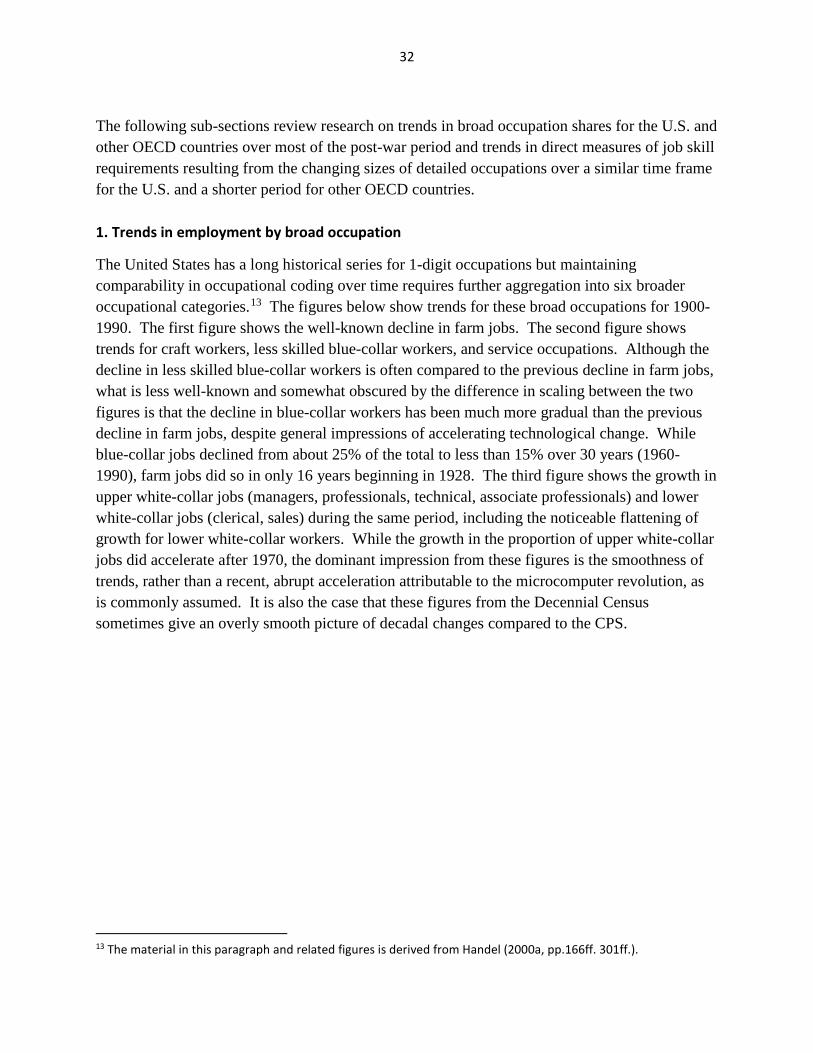
The following sub-sections review research on trends in broad occupation shares for the U.S. and other OECD countries over most of the post-war period and trends in direct measures of job skill requirements resulting from the changing sizes of detailed occupations over a similar time frame for the U.S. and a shorter period for other OECD countries. 1. Trends in employment by broad occupation
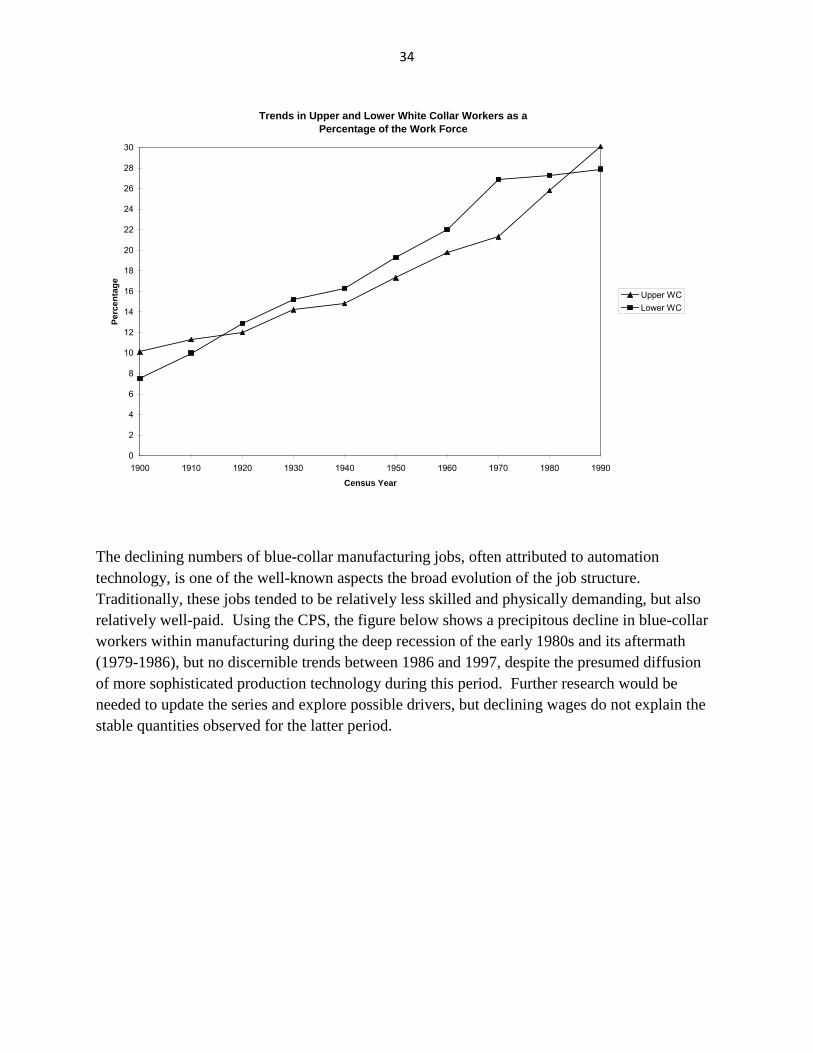
The United States has a long historical series for 1-digit occupations but maintaining comparability in occupational coding over time requires further aggregation into six broader occupational categories.13 The figures below show trends for these broad occupations for 1900-1990. The first figure shows the well-known decline in farm jobs. The second figure shows trends for craft workers, less skilled blue-collar workers, and service occupations. Although the decline in less skilled blue-collar workers is often compared to the previous decline in farm jobs, what is less well-known and somewhat obscured by the difference in scaling between the two figures is that the decline in blue-collar workers has been much more gradual than the previous decline in farm jobs, despite general impressions of accelerating technological change. While blue-collar jobs declined from about 25% of the total to less than 15% over 30 years (1960-1990), farm jobs did so in only 16 years beginning in 1928. The third figure shows the growth in upper white-collar jobs (managers, professionals, technical, associate professionals) and lower white-collar jobs (clerical, sales) during the same period, including the noticeable flattening of growth for lower white-collar workers. While the growth in the proportion of upper white-collar jobs did accelerate after 1970, the dominant impression from these figures is the smoothness of trends, rather than a recent, abrupt acceleration attributable to the microcomputer revolution, as is commonly assumed. It is also the case that these figures from the Decennial Census sometimes give an overly smooth picture of decadal changes compared to the CPS.
13 The material in this paragraph and related figures is derived from Handel (2000a, pp.166ff. 301ff.).
33
Trends in Farm Occupations as a Percentage of the Workforce
0
2
4
6
8
10
12
14
16
18
20
22
24
26
28
30
32
34
36
38
40
1900 1910 1920 1930 1940 1950 1960 1970 1980 1990
Census Year
Perc
enta
ge
Trends in Craft, Lower Blue Collar, and Service Employment as a Percentage of the Work Force
0
2
4
6
8
10
12
14
16
18
20
22
24
26
28
30
1900 1910 1920 1930 1940 1950 1960 1970 1980 1990
Census Year
Perc
enta
ge CraftLower BCService
34
The declining numbers of blue-collar manufacturing jobs, often attributed to automation technology, is one of the well-known aspects the broad evolution of the job structure. Traditionally, these jobs tended to be relatively less skilled and physically demanding, but also relatively well-paid. Using the CPS, the figure below shows a precipitous decline in blue-collar workers within manufacturing during the deep recession of the early 1980s and its aftermath (1979-1986), but no discernible trends between 1986 and 1997, despite the presumed diffusion of more sophisticated production technology during this period. Further research would be needed to update the series and explore possible drivers, but declining wages do not explain the stable quantities observed for the latter period.
Trends in Upper and Lower White Collar Workers as a Percentage of the Work Force
0
2
4
6
8
10
12
14
16
18
20
22
24
26
28
30
1900 1910 1920 1930 1940 1950 1960 1970 1980 1990
Census Year
Perc
enta
ge
Upper WCLower WC
35
Trends for broad occupation groups are updated within a comparative framework including other OECD countries in Table 11. Although there are a number of nuances, the general pattern is continuity in trends, rather than dramatic acceleration recently, as well. Where sharp changes for particular countries are observed they tend to be concentrated in a single year, suggesting a break in series due to classification changes rather than genuine change. In the early post-war period, production and related jobs represented the largest category in most developed economies, though farm jobs remained numerous in southern Europe, Japan, South Korea, and elsewhere. For many OECD countries, particularly the most advanced economies, the share of production and related workers peaked at 40-50% of the workforce in the 1950s or 1960s and declined thereafter to reach 20-25% in 2009. Occupational projections for most countries suggest very modest declines through 2020. The employment share of professionals, technical, and associate professionals grew rapidly in many, but not all, countries. This group has overtaken production workers as the largest of the seven broad occupational groups in most of the advanced OECD countries. Managers have grown less rapidly, but when the two groups are taken together, these high-skilled white-collar jobs account for about 32-40% of all jobs compared to 7-20% of jobs in 1960. In the United States, the share of these high-skilled jobs grew by 2.40 percentage points per decade prior to the personal computer revolution (1950-1980) and by 3.47 percentage points per decade
Trend in the Share of Blue Collar Workers in Manufacturing 1962-1997, March CPS (break in series between 1982 and 1983)
Note: Professionals include technical workers and associate professionals. From Handel (2012, p.34)
37
subsequently (1980-2010). For most other countries, recent and projected growth rates show continuity or deceleration relative to prior decades, rather than acceleration. This broad occupational group includes jobs spanning a wide range of the skill continuum, which speaks to the need for trend data based on skill scores in section 2 below. The strongest and most consistent growth is in the broad occupations of professionals, associate professionals, and technical workers, which reflects the relative growth of industries that make heavy use of those occupations (e.g., education, health, information, high tech, finance, professional and business services) and increasing employment of professionals within other industries. A shift-share analysis finds almost all of the increase in the U.S. between 1950 and 1980 reflected employment growth of the professional-intensive industries, while within-industry effects in staffing ratios exceeded the between-industry effects in the composition of employment for 1980-1988. The decline in the relative strength of the between-industry effect was driven largely by education’s declining share of employment, partly reflecting the maturation of the youngest members of the baby boom cohort (Sass 1990, p.46). These analyses could be updated to determine the relative importance of changing patterns of final demand and changing production functions. The trends for the proportions of jobs in clerical and sales occupations are relatively flat or generally shrinking somewhat in the case of clerical workers, in contrast to their robust growth in the first half of the post-war period. Projections suggest the share of clerical workers will shrink in most countries in coming years, but the fate of sales workers remains more uncertain in light of the continued growth of online retailing. From the perspective of SSA’s concerns, the direction of trends may be characterized as strong growth in highly skilled jobs, which tend to have low physical demands, and a strong decline in low-skilled blue-collar jobs, which are among the most physically demanding. The growth of various kinds of less-skilled sales and service work has partially substituted for these jobs, whose physical demands are generally intermediate but also possibly more heterogeneous. Sales and service occupations also require varying levels of interpersonal skills, in contrast to the jobs they replaced, which would probably score higher on the DOT’s measure of involvement with Things and lower on its measure of involvement with People. Middle-skill clerical jobs grew strongly in previous decades but their share of jobs has been declining gradually, reflecting in part the spread of information technology. In general, the rates of change indicate a long-term and gradual trend toward higher-skilled jobs, while evidence of significant acceleration due to the spread of computer technology is weaker. Although comparisons are made frequently between the recent transition from blue-collar jobs to services and knowledge-intensive work and the historical transition from farming to
38
manufacturing jobs, the historical record indicates that the previous decline in farm jobs was much faster than the more recent decline in blue-collar jobs even restricting the comparison to starting points when they accounted initially for comparable shares of jobs. The general conclusion is that following a rapid shift from farm to blue-collar jobs, most OECD countries are currently in the middle of a long secular transition to more skilled jobs. This trend appears to pre-date the computer era and is projected to continue for the foreseeable future. However, the shift to a post-industrial or knowledge economy has been more gradual than the one that marked the transition from an agricultural to an industrial economy and does not suggest ORS will miss abrupt shifts if the data collection cycle is five years rather than three years.
Recent BLS occupational projections to 2024 reinforce the general picture described above. They suggest broad occupation groups that are the most physically demanding (production, farming) will decline absolutely, while professionals, particularly in healthcare, will continue to grow. Other physical jobs expected to decline are in the Postal Service industry (e.g., mail sorters, mail carriers), which will increasingly feel the impact of the dramatic growth in computer-mediated, electronic communication. Less skilled jobs expected to grow strongly are in food service, retail, cleaning, and personal care and service, including health support and social assistance occupations (Hogan and Roberts 2015). Although not singled out in the discussion of the most recent projections, leisure and hospitality are other service occupations that have grown recently, as well. Workers who would have held production and other traditional blue-collar jobs in the past increasingly face a choice from among these occupations, as well as more manual jobs that remain in construction, transportation, installation/maintenance/repair, as well as production. Obviously, ORS will want to understand changes in the exertional demands and skill requirements in these growing less-skilled occupations given disproportionate representation of SSA claimants holding these kinds of jobs (Handel 2015, pp.25ff.).
BLS will also want to watch trends in the size of retail sales occupations especially closely, as this represents a large number of jobs and the speed with which e-commerce grows and displaces brick and mortar retail are key unknowns. The share of jobs in clerical and related occupations will continue to decline, probably concentrated more in the less-skilled detailed occupations within this broad occupation. This is due to the continued replacement of paperwork with electronic files, which frequently require fewer hours of simple labor for their creation, modification, and maintenance. Clearly, these are cases in which technological changes should be monitored in conjunction with occupational changes to anticipate the course of likely future job opportunities. The decline in the size of these occupations is important for SSA as it reduces the number of sedentary low-skill jobs, which is a category of particular interest to the agency.
Nevertheless, it is important to recognize that although 13 of the 15 detailed occupations with the greatest number of job losses require no more than a high school diploma, 9 of the 15 occupations with the greatest job gains also do not require post-secondary education (Hogan and
39
Roberts 2015, Tables 3 and 5). Therefore, the less-skilled jobs are not disappearing at a breathless pace, as is sometimes suggested. In addition, replacement needs are projected to account for 3.6 times the number of jobs as new positions (Hogan and Roberts 2015), and less skilled jobs have higher than average turnover and replacement needs. Therefore, the preceding account of trends in the sizes of broad occupations provide only a partial picture of the jobs potentially available to SSA claimants. Nevertheless, it is important to understand the basic contours of occupational change in the recent and more distant past, as well as projections for the near future.
Because BLS projections have been subject to external criticism, it is useful to compare them to actual trends at the broad occupational level. Indeed, changes in occupational coding make comparisons using more detailed occupations quite difficult. Projections and actual trends for 1988-2008 can be compared to give some sense of the reliability of projections while avoiding some of the most serious breaks in occupational coding and sampling. Table 12 shows 1998 BLS projections performed fairly well in anticipating relative growth of broad occupations to 2008, with the possible exception of service and farm workers. In addition, some portion of the discrepancies may be due to the onset of the deep recession, which represents the kind of unforeseeable developments that the projections were never designed to cover. The actual number of employed persons in 2008 was 6.1% below the projection made in 1999 (Table 13) and unemployment fell disproportionately on construction workers and less skilled occupations shown in lines 5 and 6 of Table 12.
The inclusion of figures from 1988 in Table 12, which were presumably made comparable with the later SOC codes for the report on the 1998 projections, underscore the gradual nature of changes in the occupational composition of employment at an aggregate level over this recent 20-year period. Because this was a period of significant technological change, including the emergence and maturation of the internet, one might expect significant acceleration of occupational change. The final two columns shows the growth in broad occupations over 1988-1998 and 1998-2008. The growth of service workers increased from 0.5 percentage points over the first decade to 3 percentage points over the second decade. The decadal decline of skilled blue-collar workers increased from 0.8 to 2.1 percentage points, while the growth of professional and technical workers rose from just under 2 percentage points in the first decade to 3 percentage points in the second decade. Other occupational aggregates showed even greater continuity in their growth over the two decades.
The extent to which BLS successfully projects changes in the sizes of detailed occupations is a much larger task that is beyond the scope of this report. Clearly, part of the success at the broad occupation level reflects the fact that random errors at the more detailed level tend to cancel one another, as well as the fact that the historical record indicates these aggregates typically do not change abruptly, net of coding changes.
40
Table 12. Occupational Employment for 1988-2008 and Projections for 2008 1988 1998 2008 (proj) 2008 (actual) Proj - Actual 1998-1988 2008-1998
Note: All figures are percentages. Shaded rows give breakdowns of higher-level categories. Negative values in the column Proj-Actual indicate under-predicted occupation shares and positive indicate over-predicted occupation shares. Sources: Douglas Braddock, “Occupational employment projections to 2008,” Monthly Labor Review (November 1999, p.52) and T. Alan Lacey and Benjamin Wright, “Occupational employment projections to 2018,” Monthly Labor Review (November 2009, p.84).
Table 13. Employment in 1988, 1998, and 2008, and Projected for 2008 (numbers in thousands) 1988 120,010 1998 140,514 2008 (projected) 160,795 2008 (actual) 150,932 Proj. minus Actual 9,863
Source: See previous table
41
A recommendation of this report is that ORS test how well it is able to anticipate future skill needs by merging the first wave of ORS data with actual employment weights for 1998 and 2008 and projected employment for 2008 to examine whether differences between actual and projected values of key constructs over a recent ten-year period are consequential in terms of values of interest, e.g., the proportion of sedentary low-skilled jobs. This is important because even if there are significant prediction errors with respect to the sizes of detailed occupations, as many external critics suggest, insofar as those errors are random with respect to exertional and skill levels and cancel out then overall estimates of the numbers of different kinds of jobs may be relatively unaffected. This consideration of anticipating skill change at the detailed occupational level is a natural bridge for considering the research record on skill change at the detailed occupational level.
2. Trends in direct measures of skill based on the changing sizes of detailed occupations
Broad occupational categories can give only a general sense of the magnitude of skill trends because occupational titles are not quantitative or even a fully orderable set of categories. These large groups also include a wide range of skill levels, so they do not reveal any shifts that might be occurring within them over time. Section II.A presented the existing survey evidence on direct measures of job skill requirements across U.S. and international surveys covering relatively short periods of time. The data are valuable as they are virtually the only sources of repeated measures of job skills, tasks, and related working conditions. However, the measures employed are not always as specific or concrete as desirable. In addition, their relatively small sample sizes, limited years available, and variable response rates pose potential problems of reliability and validity for detecting trends and analyzing subgroup differences.
Ideally, one would want job-level data that includes a rich set of skill measures administered to large samples of workers repeatedly and relatively frequently over a long time period. In the absence of such data, analysts have merged cross-sectional occupation-level skill scores from the DOT and O*NET onto Decennial Census, CPS, and labor force survey (LFS) data from other OECD countries. Naturally, this method can only capture skill trends resulting from changes in the shares of detailed occupations, rather than any shifts in task content within them.
It should be noted that in addition to the DOT and O*NET there is a set of somewhat more concrete scores from the January 1991 CPS supplement that could be used in a similar fashion. Unlike the surveys reviewed earlier, the sample size in the monthly CPS permits reliable estimates for the 450-500 detailed Census occupations. Table 14 shows the percentages performing different jobs tasks with varying frequency by worker education level. Because the large sample size permits calculation of proportions at the 3-digit occupation level, this data file could be used to track long-run changes in skill requirements that can be expected due to the changing occupational composition of jobs in the economy. One virtue of the CPS measures is
42
their relatively concrete and interpretable quality compared to the DOT and O*NET items. When the seven items are combined into a simple additive index, average values for 3-digit occupations correlate 0.80 with the DOT’s Data rating, whose meaning is not very concrete (Handel 2000, p.212). One drawback of the CPS items is their use of a frequency gradient to measure job tasks rather than a complexity gradient. The STAMP survey, discussed in Section III, used these items as a starting point and tried to define levels of reading, writing, math, and computer tasks (Handel 2016).
Table 14. Percentage of Workers Performing Various Tasks at Work by Years of Education January 1991 Current Population Survey High School or Less More Than High School Task Once or more/week Every Day Once or more/week Every Day Read letters, instruction manuals, news/magazine
articles 20.5 31.4 35.4 53.9 Write memo, reports 12.1 29.6 20.8 49.6 Use math/arithmetic 8.3 55.1 12.7 68.0 Use a computer 4.3 28.5 10.2 53.4 Read or use forms 9.6 46.0 14.1 66.3 Read or use diagrams, plans, blueprints 7.4 17.5 12.1 25.2 Percent of labor force 52.4 47.6 Note: Responses for "once or more per week" and "every day" are mutually exclusive. The percentages for "reading letters, instruction manuals, news/magazine articles" reflect combined responses to three separate items in the CPS. All percentages are weighted. from Handel (2000a, p.257)
Long-run trends in job skill requirements owing to the changing occupational composition of the workforce can be examined using six DOT skill measures:
• General Educational Development (GED)—job’s formal educational requirement (6-point scale)
• Specific Vocational Preparation (SVP)—time required to learn an occupation exclusive of schooling without specific vocational content (9-point scale)
• Level of involvement with Data, People, and Things (6-8 point scales) • Intelligence—required worker aptitude (4 point scale indicating percentile range of the
population from which members of the occupation are drawn)
43
Somewhat confusingly, the DOT codes all of these variables except GED and SVP in such a manner that lower values indicate higher levels of the particular skill or quality. This requires some care in interpreting the figure below that show trends for these six measures for 1960-90 using Decennial Census data to weight the occupation-level scores and derive mean values for U.S. jobs over three decades.14 GED and SVP slope upward, indicating increasing mean educational requirements and training times. Likewise, the trends for Data, People, and Intelligence slope downward, indicating increasing skill requirements. By contrast, the trend for Things slopes upward, indicating a declining share of jobs with significant manual skill requirements. However, except for the trend for Things after 1970, few of the trend lines suggests much acceleration in skill upgrading. In fact, the other five measures indicate skill upgrading was marginally more rapid in the 1960s than subsequently and least rapid in the 1980s, though the differences are not substantively important.
The next two figures show the same trends using the March CPS for 1968-1997, covering a more recent period and also allowing for annual detail. Clearly the series for Things indicates a more accelerated and sustained decline in manual skill requirements during the 1980s and continuing in the 1990s than the corresponding Census series. However, almost all of the other series indicate comparable or somewhat slower rates of upgrading for the period 1983-1997 compared to 1968-1979. The most distinctive feature of most of the series in these figures is the notably rapid changes during the recession years 1979-1983. Otherwise there is very little distinctive about the 1980s-90s despite expectations regarding the impacts of information technologies. For GED, SVP, Data, and Intelligence, in particular, the sharpest movements seem to be associated with recession years, not only 1979-83, but also 1972-74. One interesting point to note is that both the first and third figures show SVP rising during the period when the PSID showed no change, but the increases are quite modest (ca. 1-2%).
This raises the important issue of the interpretability of the magnitudes describing skill changes, similar to those raised previously for the UK Skills Survey. The scaling for all series in these figures is relative to base year values in 1960 and 1968. By the end of both thirty-year periods most series have trended from their original value by about 5-10%. Again, it is not obvious that this represents either rapid or gradual change in an absolute sense, though it seems fairly clear that there are no dramatic discontinuities in the trends. The ambiguity of using index values can be eliminated for SVP by imputing midpoints to intervals and an estimated mean for the open-ended top code, and something similar might be possible for GED and Intelligence. However, the values of the other three variables are “pure ratings” whose meanings can be made more concrete only by using values for illustrative occupations to convey some sense of the distance
14 The four figures discussed in this section are from Handel (2000a).
44
Trends in Mean DOT Skill Measures (1960=100), Decennial Census microdata(Note: Declining scores for Data, People, Things, and Intelligence mean increasing skill)
0.87
0.89
0.91
0.93
0.95
0.97
0.99
1.01
1.03
1.05
1.07
1.09
1960 1970 1980 1990
Year
Inde
x Va
lue
gedsvpdatapeoplethingsintell
45
Trends in Mean DOT Skill Measures (1968=100), March CPS microdata(Note: Declining scores indicate increasing skill)
0.91
0.92
0.93
0.94
0.95
0.96
0.97
0.98
0.99
1
1.01
1.02
1.03
1.04
1.05
1.06
1.07
1.0868 70 72 74 76 78 80 82 84 86 88 90 92 94 96
Year
Inde
x Va
lue data
people
things
intell
Trends in Mean GED and SVP Scores (1968=100), March CPS microdata
0.99
1
1.01
1.02
1.03
1.04
1.05
1.06
68 70 72 74 76 78 80 82 84 86 88 90 92 94 96
Year
Inde
x Va
lue ged
svp
46
traveled by the economy over this period. Some of these problems would be less severe if trends were measured as changes in the percentage distribution of jobs across the levels of items like those used in the January 1991 CPS. In this case there would be greater clarity regarding the meaning of the trend numbers and a more intuitive sense of their magnitudes. However, the problem of deciding how much movement constituted rapid, moderate, or gradual change would remain in this case, as well. The best that one can say with respect to the trends in key DOT skill scores in the form presented here is that there is little evidence of accelerating change more recently based on a full historical time series and the magnitude of the changes do not seem large on their face. There is little to suggest the need for the ORS to be updated on a particularly rapid basis, but the limitations of these results need to be kept in mind as well. For example, the measures differ from those used in ORS, the time series capture only the between-occupation component of change, and results need to be updated to cover years since 1997, though the latter concern is addressed below using O*NET skill scores.
As a sensitivity check and to further probe the SVP findings, occupational means for training time calculated from the PSID 1976, PSID 1985, and QES 1977 were merged onto microdata from the March CPS data for 1971-1997 and trends in mean values are shown in the figure below. In these cases, SVP is expressed in absolute units, months of training and learning required, rather than index numbers. The three series use common occupational employment from the arch CPS, so the only reason for differences between them is variation in the occupation-level means, which show some slightly concerning patterns. The QES and PSID 1976 were proximate in time but economy-wide estimates derived from the two series diverge by about one month by the end of the period. Also, occupation means for the PSID are lower in 1985 than in 1976, which is contrary to intuition but helps explain the puzzling stability noted in Table 2 when the trends in occupational composition were working to raise mean SVP. Whether these differences are large enough to warrant concern over the reliability of SVP-style items is unclear. The trends for both series based on the PSID show growth in mean SVP of approximately one month over the 26-year period, while the series based on the QES increases by about two months over the same period. Thus, the differences in the trends seem relatively small. However, somewhat more concerning is the fact that the differences in levels between the various series are sufficiently large that the mean value in 1997 implied by the PSID 1985 occupation scores is equivalent to the values for 1980 and 1985 implied by the QES 1977 and PSID 1976 occupation scores, respectively.
Leaving aside this issue of reliability, all three trends reinforce the point again that changes tend to be gradual. There is evidence of acceleration in the early 1980s and after the early 1990s, but the period of most rapid change is the early 1980s. There is no evidence that the period of greatest computer diffusion corresponds to a dramatic break with past trends in skill upgrading. Even using the series based on the QES77, which shows the most rapid growth, the total change over twenty years (1977-1997) is only about two months for the economy overall. However, fuller exploration of changes in different parts of the distribution are warranted, as well, because
47
means may mask important movements among jobs with very low SVP that are of particular interest to SSA. One recommendation, then, is that BLS perform analyses such as shown here but focus on trends for jobs with very low SVP. If both completed cycles of O*NET are used, converting SVP scores to numerical values by imputing midpoints and using SSA’s thresholds for different skill levels, then both between- and within-occupation effects can be captured in terms that speak directly to SSA’s needs.
The previous exercise using DOT scores was updated recently using O*NET scores applied to time series of occupational weights derived from labor force surveys in the EU, Canada, and japan, as well as the U.S. O*NET (2008) scores were matched to all data on occupational employment after national codes were translated into 3-digit ISCO-1988 codes, which is less detailed than U.S. Census and SOC codes.15 An extensive series of validity checks confirmed the reasonableness of imputing U.S. skill scores to other countries (Handel 2012, Annex 2). Again, all observed differences across countries and trends over time reflect variations in the composition of employment by 3-digit ISCO occupations, holding skill measures by occupation constant at O*NET (2008) levels, without capturing any shifts within occupations.
15 There are approximately 100 detailed occupations at the 3-digit level of the ISCO classification scheme.
Trends in Mean Training Times in Months, 1971-1997 (Occupation- Level Means from PSID76, PSID85, and QES77 imputed to March CPS Microdata)
The scales constructed from O*NET items are described in Table 15. All scores are standardized for the U.S. workforce using the U.S. Current Population Survey (CPS) for 1992 and occupational means calculated after assigning ISCO-88 codes to workers in the 1992 CPS file. The mean O*NET scores by 3-digit ISCO-88 occupations that resulted from collapsing this data set were then merged onto all other LFS country samples. This means that values for the O*NET scales should be interpreted as measuring differences from the CPS 1992 sample in standard deviation units. Cross-sectional differences between countries and trends within countries will reflect only variation in the sizes of 3-digit occupations across time and place because ISCO-88 occupations in all country-years were assigned a single set of mean values based on a standardization with respect to the CPS 1992. It is differences in the occupation weights that generate any observed variation. This procedure effectively assigns quantitative scores for multiple skill dimensions to an otherwise nominal variable, detailed occupational title, but other sources of variation, such as temporal change within occupations or national differences in occupation scores, are not captured.
49
Table 15. O*NET skill scales and measures
1 Required education
2 Math requirements: (1) mathematics skills; (2) mathematics knowledge; (3) mathematical reasoning; (4) number facility (α=0.92)
3 Verbal requirements: (1) reading comprehension; (2) writing skills; (3) writing comprehension; (4) writing ability; (5) knowledge of English language rules (spelling, grammar, composition); (6) frequency of using written letters and memos (α=0.95)
4 General cognitive demands: (1) analytical thinking; (2) critical thinking; (3) complex problem solving; (4) active learning; (5) analyzing data or information; (6) processing information; (7) thinking creatively; (8) updating and using relevant knowledge; (9) deductive reasoning; (10) inductive reasoning; (11) fluency of ideas; (12) category flexibility (α=0.97)
5 People skills: (1) persuasion; (2) negotiation; (3) speaking skills; (4) frequency of face-to-face discussions; (5) frequency of public speaking; (6) communicating with persons outside organization; (7) dealing with external customers or public; (8) performing for or working directly with the public; (9) customer and personal service knowledge; (10) service orientation; (11) dealing with angry people; (12) dealing with physically aggressive people; (13) frequency of conflict situations; (14) resolving conflicts and negotiating with others; (15) instructing skills; (16) training and teaching others; (17) education and training knowledge; (18) interpreting the meaning of information for others; (19) social orientation; (20) social perceptiveness (α=0.94)
6 Craft skills: (1) controlling machines and processes; (2) repairing and maintaining mechanical equipment; (3) repairing and maintaining electronic equipment; (4) equipment maintenance; (5) repairing machines; (6) troubleshooting operating errors; (7) installing equipment, machines, and wiring (α=0.95)
7 Gross physical requirements: (1) handling and moving objects; (2) general physical activities; (3) static strength; (4) dynamic strength; (5) trunk strength; (6) stamina; and time spent (7) sitting, (8) standing, (9) walking, (10) twisting body, (11) kneeling, crouching, stooping, or crawling (α=0.98)
8 Repetitive motions (time spent making repetitive motions, 1=never, 2=less than half time, 3=about half time, 4=more than half time, 5=continually or almost continually)
Note: Cronbach’s α in parentheses. from Handel (2012)
Table 16 presents the correlations among O*NET skill variables for the U.S. and a group of European countries in 2009 to give a sense of the structure of relationships among them, which can inform ORS expectations regarding analogous variables collected for SSA. Correlations differ between the upper and lower panels as a function of the different sizes of 3-digit ISCO-88
50
occupations in the two regions because the detailed occupations in both samples have the same O*NET scores, as noted.
The cognitive skills variables tend to show the highest positive correlations. Required education’s correlations with general cognitive demands and verbal skills are between 0.86 and 0.88 across regions, while the latter two variables correlate 0.92 or 0.93 with one another, the highest associations in the table. The correlations involving math skills are somewhat lower. Interpersonal skills correlate 0.74-0.85 with required education, general cognitive skills, and verbal skills, but only 0.52-0.55 with math skills. This pattern seems sensible. Craft skills have relatively modest correlations with all other variables except gross physical requirements (0.53). The item on repetitive physical motions is strongly and negatively correlated with all cognitive skills variables (-0.64 to -0.84) and positively correlated with gross physical demands (0.50 and 0.56). These relationships are also consistent with expectation.
Table 16. Correlations among O*NET skill measures, United States and Europe (2009)
Note: U.S. data is from the Current Population Survey and the European data is from the Labour Force Survey. European countries in the bottom panel are those with Labour Force Survey data beginning no later than 1997: Austria, Belgium, Czech Republic, Denmark, Estonia, Finland, France, Germany, Greece, Hungary, Ireland, Iceland, Italy, Luxembourg, Netherlands, Norway, Poland, Portugal, Slovenia, Spain, Switzerland, Sweden, and the UK. from Handel (2012, p.66)
Table 17 presents O*NET skill means for the U.S. and the same set of European countries as in Table 16, which are EU countries with LFS data available beginning in 1997 or earlier. The bottom panels show corresponding information for Canada and Japan. In the United States, row
51
1 shows the le vel of general cognitive, verbal, math, and interpersonal skill requirements in 1997 were already about 0.05 standard deviations above their levels in 1992 as result of occupational shifts; craft and physical demands were little changed. In the dozen years between 1997 and 2009, required education rose by 0.15 years, cognitive, verbal, and interpersonal requirements rose by 0.07-0.11 standard deviations, craft skill demands fell by 0.06 standard deviations, and gross physical requirements fell the least (-0.02 standard deviations), consistent with previous findings regarding the weak trends for workplace physical demands (row 3).
Table 17. Mean job skill demands for US and European panel using O*NET skill measures, 1997-2009 Education Cognitive Math Verbal People Craft Physical Repetitive
Note: Education is measured in years, the variables “cognitive” through “physical” are in standard deviation units with respect to U.S. means in 1992, and “repetitive” is measured on a 5-point frequency scale (see Table 16 for details). European panel includes Austria, Belgium, Czech Republic, Denmark, Estonia, Finland, France, Germany, Greece, Hungary, Ireland, Iceland, Italy, Luxembourg, Netherlands, Norway, Poland, Portugal, Slovenia, Spain, Switzerland, Sweden, and the UK. from Handel (2012, p.67)
Repetitive physical motions fell 0.05 units on a 5-point scale (row 3). If the repetitiveness scale were interpreted (perhaps too literally) as dividing the percentage scale into quarters, this would
52
imply that the percentage of work time spent on such activities fell from 52.3% to 51% between 1997 and 2009.16
These results show that for both the U.S. and Europe the trend toward a postindustrial society involves rising demand for both cognitive and interpersonal skills, as well as declining demand for both skilled and unskilled physical skills. Simple regressions of each skill score on a linear time trend were fitted for each country separately, usually for somewhat longer time periods of varying length. When quadratic terms were added almost none were significant and showed the pattern expected if the pace of skill change were accelerating. In almost no case were both linear and quadratic effects significant and similarly signed, as one would expect if certain skills were growing (e.g., cognitive) or declining (e.g., physical) at an accelerating rate (not shown).17
To better interpret the growth rates, one can note that the table implies it would take 80 years for job education requirements to rise by one year and for cognitive and verbal skill demands to rise by 0.5 standard deviations. If skill changes resulting from within-occupation shifts, which are not captured here, were assumed to be as large as those resulting from between-occupation shifts, then it would take 40 years. If within-occupation shifts were twice the size of between-occupation shifts, the time interval would be just under 27 years. It is unlikely that within-occupation shifts account for appreciably more than two-thirds of the total change in job skill requirements and it is quite possible that they account for less than half. Therefore, the interval between these two values provide a reasonable range of estimates for rates of change in educational, cognitive, and verbal skill requirements. It is also worth noting that math requirements grew at less than half the rates of cognitive and verbal requirements in the U.S., so the time interval to achieve a 0.5 standard deviation rise would be more than double these figures.18
The panel of European countries in 1997 had lower cognitive, math, verbal and interpersonal skills than the U.S. in 1992, and higher usage of craft and gross physical skills (row 4). However, Europe changed more rapidly (row 6 vs. row 3), which narrowed most of the gaps by
16 There was a substantial revision of occupation codes in the U.S. in 2002 but no visible break in the trends in mean skills scores. The European panel time series also straddle national coding system changes and values for the intervening years are somewhat more erratic, with both jumps and plateaus, but no obvious pattern suggesting underestimation of growth rates. 17 Exceptions are interpersonal skills in Luxembourg, Denmark, and the Czech Republic, math skills, craft and physical demands in Iceland, general cognitive and verbal skills in the Czech Republic, and craft skills in Finland. Many of Canada’s trends are best approximated by a cubic function, as there was a positive trend for the late 1980s through early 1990s and somewhat accelerated trend after 2004, while most trends showed virtually no change for the intervening ten to twelve years. 18 To illustrate how the calculations in this paragraph were made, educational requirements grew 0.15 years in a twelve-year period (1997-2009), implying an annual growth rate of 0.0125. If between-occupation shifts were the sole driver of skill change, then growth equal to one year of education would take 1/0.0125=80 years’ time. If the (unobserved) within-occupation skill shifts were equal to the between-occupation shifts then the time interval would be 1/0.025=40 years and if they were double the size of the between-occupation shifts then the time required would be 1/0.0375=26.7 years.
53
2009 (row 9), especially for craft and physical demands, perhaps reflecting the decline of manufacturing. Again, it should be noted that these calculations reflect cross-national differences in just the distributions of workers across occupations and assumes occupations within each country have skill levels fixed at levels measured by O*NET in a single cross-section. If country-specific occupational skill requirements are either higher or lower or occupational skill requirements change over time, the figures in the lower panels of Table 17 would need to be adjusted accordingly.
Canada’s skill levels and rates of change are generally comparable to the U.S., with some minor variations. The biggest surprises are both the levels and rates of change for Japan. Job requirements for education, general cognitive skills, math and verbal skills in 2005 appear well below levels in the U.S., EU panel, and Canada (row 14), and the trends for 1995-2005 were flat or even slightly negative (row 15). Similar patterns are evident for most of the other skills to a somewhat lesser extent. Given the Japan’s well-known reputation for job enrichment among production jobs comparisons of skill levels to those of other countries requires caution. However, the same considerations do not apply as strongly to within-country trends. It is likely that O*NET skill scores do a reasonable job of ranking occupations even for Japan. The flat trends suggest even more gradual skill upgrading in Japan than elsewhere.
Although it is not possible with these data to measure within-occupation skill change at the detailed occupation level, it is possible to determine whether the changing mix of detailed occupations within the seven broad occupational groups alters the meaning of those groups, whose growth and declines were presented previously.
Table 18 presents mean job skill demands by broad occupational group and year (1997, 2009) for the U.S. and the European panel. The table also includes additional breakdowns that could not be presented in Table 11 for reasons of long-run comparability. The general patterns by occupation are as expected.19 The cognitive, verbal and interpersonal skill requirements of full professionals’ in 1997 were about 1.3 standard deviations above the U.S. average in 1992, while the figures for elementary workers were about 1.2 standard deviations below the average, even as this group’s physical job requirements were 1.2 standard deviations above average. If the repetitiveness scale were interpreted as dividing the percentage scale into quarters, European managers performed repetitive tasks 37.5% of the time in 2009, while elementary workers did so 70% of the time.
Table 18 also shows that the O*NET measures discriminate effectively within the production worker group. Craft workers score higher than operators and elementary workers on all
19 Figures for the U.S. are adjusted for a break in series resulting from the change in occupation coding systems in 2002. The dual-coded CPS 2002 file was used to correct for a shift in levels observed when means are calculated using the newer coding system.
54
cognitive skills variables. They also score higher on the machine control, maintenance, and repair tasks that comprise the “craft” skill variable.
The result that is particularly relevant for the question of occupational dynamics is the near-total constancy in skill means for 1-digit occupations between 1997 and 2009. Although there may be skill changes within detailed occupations, it appears that there is no shift in the relative sizes of differently skilled 3-digit occupations within these broad occupation groups. The composition of the combined professional group did not shift away from associate professional/technical workers toward more full professionals and the skill mix of occupations within each subgroup remained stable, as well. Likewise, there is no obvious trend up or down in the skills of the production worker group and its components or in any of the other major groups. This contradicts the dominant impression from SBTC studies that one finds skill upgrading however the data are sliced. These results provide no evidence of skill change within 1-digit occupations due to shifting compositions of 3-digit occupations for either the U.S. or the European countries for 1997-2009. This leaves open the possibility that skill upgrading occurred within 3-digit occupations, which was not observable in the data available at the time when these analyses were conducted.
The preceding suggests that the trends in Table 11, which assumed that broad occupational groups meant the same things over time, were reasonably accurate in that regard, at least in terms of the broad groups’ 3-digit occupation composition for the period 1997-2009. Indeed, the last two rows of both panels of Table 12 show that both the collapsed and full 1-digit occupation dummies capture very large shares of the variance in scores across 3-digit occupations.
55
Table 18. Mean job skill demands by occupation in 1997 and 2009, USA and Europe
Education Cognitive Math Verbal People Craft Physical Repetitive
Table 18. Mean job skill demands by occupation in 1997 and 2009, USA and Europe (cont’d) B. EUROPE Education Cognitive Math Verbal People Craft Physical Repetitive
Note: Tech/AP refers to technicians and associate professionals. R2 values for “Full 1-digit” are the variance explained by standard 1-digit occupational groups and R2 values for collapsed codes are the variance explained by the seven-group version used prevously. European panel includes Austria, Belgium, Czech Republic, Denmark, Estonia, Finland, France, Germany, Greece, Hungary, Ireland, Iceland, Italy, Luxembourg, Netherlands, Norway, Poland, Portugal, Slovenia, Spain, Switzerland, Sweden, and the UK. from Handel (2012, p.76f.)
57
C. Research on rates of change due to within-occupation effects
1. General
The previous section examined one component of changes in job skill requirements, changes in the occupational composition of employment, using broad occupations as a proxy for skill and direct measures of job skill requirements measured in a cross-section at the detailed occupation level. If one could be confident that changes in occupational employment shares accounted for the overwhelming majority of skill change, then analyses could conclude there and ORS data collection cycles could be relatively infrequent. However, no such confidence is warranted. The critical gap in existing data is the scarcity of repeated collection of the same skill measures across multiple waves of large-sample surveys. In the absence of such information there is no way to capture both between- and within-components of skill change and therefore no way to determine whether within-occupation skill shifts are relatively important.
Although there may be many reasons for changes in the task content of occupations, it is commonly believed that the diffusion of computer technology since the early 1980s has increased job complexity, as well as altering the sizes of different occupations, and that these effects have accelerated over time. This raises the possibility that within-occupation changes are quite important. However, this view of the implications of new technologies may need to be qualified as the total effects of new technologies may vary by occupational skill level. Insofar as information and communication technology substitutes for certain kinds of labor, any skill upgrading within less-skilled occupations may be offset partly by the declining size of the occupations, which would dampen the skill upgrading effects of the technological change on the overall mean. Further, insofar as skill upgrading is most pronounced within relatively skilled and sedentary jobs, whose shares of all jobs are generally growing as well, there may be few implications for SSA practices because such jobs are already likely to be rated in the top skill categories and the bottom physical exertion categories. Any further increases or decreases within SSA’s top or bottom codes for skill and exertion will not have any practical impact on the distribution of jobs as measured by SSA’s relatively coarse set of categories.
Nevertheless, whether any of these considerations apply in practice are empirical questions that depend upon the nature and magnitude of skill and task shifts within detailed occupations, which remains largely unknown. Before reviewing the limited research on this topic, one can state a number of recommendations for increasing that knowledge base at the outset.
1. O*NET completed two cycles of data collection in 2008 and 2013. Skill scores most relevant for ORS (e.g., required education, SVP) can be merged onto the CPS for those
58
years to examine the absolute and relative sizes of within- and between-occupation effects for all jobs and sub-groups of interest (e.g., low-skill sedentary jobs). Using O*NET to study quinquennial changes in required education, SVP, scores on various cognitive items, physical demands, and working conditions is one of the closest ways ORS can investigate both between- and within-occupation components of skill change for a broad spectrum of variables, despite the limited comparability of some of the less concrete items to ORS.
a. Comparisons across waves of key variables, such as required education and job learning times (SVP) and selected items from the Working Conditions survey, should present few difficulties
b. Variables from O*NET’s Skills and Abilities surveys cannot be used because of mode effects.
i. The Skills survey was completed by job incumbents for the 2008 edition and by ETA’s job analysts for the 2013 edition, which introduced significant, artifactual changes in scores.
ii. The Abilities survey has always been completed by job analysts, who are few in number and base their ratings mostly on written job descriptions. It is not known whether the raters in the second cycle are the same individuals and/or allowed to examine ratings from the prior cycle, but the narrow base of non-incumbent respondents for all occupations raises validity concerns in any case.
c. BLS can explore the feasibility and validity of scraping O*NET’s Detailed Work Activities and task statements fields for evidence of change within occupations over time.
d. Access to O*NET microdata would be quite useful for anticipating future rates of skill change. If personal education and other demographic variables from the O*NET background questionnaire are found effective in predicting job required education, SVP and other variables of interest, the coefficients could be applied to educational and occupational projections to anticipate future changes in those variables.
2. The NCS is another potential source of trend data on within-occupation shifts. The
sampling design and the leveling factors have changed over time. Nevertheless, it should be possible to use the Knowledge factor and potentially others to examine changes consistently over periods of 5-10 years. Although the NCS factors lack the concreteness of the ORS and the January 1991 CPS measures, the scarcity of time series information and the similarity between the NCS and ORS in terms of sampling and interview modes argues strongly for exploiting this source of information to the fullest extent possible.
59
3. A series of surveys sponsored by the National Center for Education Statistics (NCES) of the U.S. Department of Education represents another possible source of within-occupation measures. The National Adult Literacy Survey (1992), Adult Literacy and Lifeskills Survey (2003), and the Program for the International Assessment of Adult Competencies (2011) administered a cognitive assessment and asked a series of job task items similar to the January 1991 CPS. Both the job incumbent test scores and the job task items may be suitable for studying within-occupation shifts over times. However, further investigation is required to ensure task items and test scores are fully comparable across survey waves and to determine whether the occupation-level sample sizes are large enough to calculate means reliably.
4. The education and training requirements ratings associated with the OES and occupational projections programs may also be useful for understanding the evolution of job requirements within occupations. Potentially important aspects of the methodology are unclear from the published materials. For example, it is not clear how frequently the assignments of education/training categories to occupations were updated and whether the updating was sufficiently independent of prior assignments to be useful for assessing change (i.e., not simply carrying over most of the previous assignments without significant follow-up). The system has also changed frequently since its first introduction, so at least one update would be needed prior to a coding changeover, as well. BLS staff is best positioned to determine whether such an exercise is likely to be valid. However, assuming there are at least two independent ratings of occupations using the same system separated 4-10 years apart, understanding how many occupations changed categories and the share of the workforce associated with “mover” occupations could be quite informative.
5. The Occupational Outlook Handbook may contain unique information on job requirements that can be combed for relevant fields, such as training times, assuming the text or data is in electronic form or can easily be converted to usable files. Again, this recommendation also assumes relative independence between the content of at least two different editions spaced at least 4 years apart. Insofar as occupational descriptions are simply carried forward for convenience without verifying the occupations remained similar, then the OOH would have the same problem as the third and fourth editions of the DOT and would not be a valid source of information on rates of change in task content within occupations.
6. Despite the limitations noted in (5), it is possible that measures can be compared across the final two versions of the DOT 4th ed., issued in 1977 and 1991, for occupations that were updated in the revision of the fourth edition. The prevalence of within-occupation effects can be examined only for the segments of the workforce that were rerated in the
60
1991 edition, and assessing their importance relative to between-occupation effects is complicated by the fact that crosswalks to CPS occupations codes do not have weights for the size of the DOT occupations associated with them. There is also the further complication that occupations were updated for the 1991 edition in different years during the 1980s, and the original ratings in the 1977 DOT were performed across an even wider range of years during the preceding two decades. In addition, a large number of occupational definitions in the 1991 edition did not appear in the 1977 edition (U.S. Department of Labor, Employment and Training Administration 1991, p.xv).
Two other systematic source of replicated skills measures are the UK Skills Survey (1986-2012), discussed previously, and the Qualification and Career Survey (1979-2012) conducted by the German Federal Institute for Vocational Training (Bundesinstitut für Berufsbildung or BIBB) and partner agencies.20 Both would probably be suitable for trend analyses but the sample sizes may be somewhat small for some occupations in the UK survey and the job skill measures may have comparability problems over time in the German survey. Although BIBB’s sponsors have made efforts to make the survey accessible to international researchers, it may still present some difficulties non-German speakers working outside the country. Aside from a few other international sources with much less rich job measures, the preceding is a complete enumeration of large-sample, representative and consistent long time series data on job skill requirements known to the author. If ORS seeks to gain greater understanding of within-occupation change prior to collecting a second wave of data, it will most likely have to work with some or all of the data described above.
An additional potential source of information is big data from firms like Burning Glass that scrape an enormous number of job-posting web sites and compile highly granular data on job tasks and requirements for job titles that can be much more detailed than SOC. This kind of data is very new and presents challenges, such as converting a vast number of task statements to some kind of valid numerical score, which may make the database impractical for current use by ORS. Nevertheless, some exploration of the possible uses of this data may be warranted.
Given the widespread belief that technology drives within-occupation change, ORS will also want to understand the diffusion and implications of various technologies for the character and size of different occupations. Although information technology receives most attention, changes in mechanical technologies that may or may not have microelectronic controllers may be more relevant for SSA’s claimant population. With the decline of production jobs, many of the occupations filled most commonly by SSA claimants other than clerical jobs are not necessarily exposed to much technological change in the form of computerization. Nevertheless, ORS can use CPS supplements on computer and internet use at work to examine how rapidly computers
20 Partners were the Research Institute of the Federal Employment Service (Institut für Arbeitsmarkt-und Berufsforschung; IAB) prior to 2000 and the Federal Institute for Occupational Safety and Health (Bundesanstalt für Arbeitsschutz und Arbeitsmedizin; BAuA) since 1999 (see Rohrbach-Schmidt and Hall 2013).
61
are diffusing to occupations at different levels of SSA’s skill and exertion constructs. ORS might consider including a section on computer use and associated skill requirements in the cognitive section of the ORS instrument itself.
Broadly speaking, IT can increase the skill content of jobs because the equipment and software itself are difficult to learn or present some challenges to mastering in a narrow sense. If workplace practices and IT systems change more frequently then requirements for intellectual flexibility and coping with novelty may increase even if the skills required are merely altered rather than becoming qualitatively more complex. Alternatively, jobs may become more information-intensive in a general sense, involving more reading, writing, math, and problem-solving. This may occur because computers are information tools, encouraging the production and consumption of more written matter (e.g., emails, memos, internet pages) and numerical data (e.g., spreadsheets, inventory sheets). Manufacturing automation may transform tasks that were physical and concrete into more conceptual or abstract tasks. Many organizations may find that the ready availability of computing power and information makes it convenient to combine tasks into broader jobs (job enlargement) and devolve more responsibilities to lower levels of organizations (job enrichment), as well (Zuboff 1988). If the ORS can collect information on both the prevalence and consequence of various technologies for physical exertion and cognitive skills at work the program will gain a clearer understanding of how rapidly job content changes within occupations and the drivers of change.
2. Research using representative samples
Given the scarcity of repeated direct measures of job complexity, it is not surprising that data on workers’ own educational attainment within detailed occupations, which are plentiful, has been used as a proxy. Previous research has found that changes in education levels within occupations accounts for a substantial proportion of the total change in workforce education levels. Folger and Nam (1964, pp.29ff.) performed a kind of shift-share analysis for white male workers ages 35-54 using nine 1-digit occupation categories. They found 85% of the overall rise in education for both 1940-1950 and 1950-1960 could be accounted for by shifts within occupations. However, the within-occupation component was much less important in explaining the growth in the share of workers with four years of college education or more, accounting for 40% for 1940-1950 and 45% for 1950-1960. Undoubtedly, the proportion attributable to within-occupation shifts for both all workers and those with a college education would be significantly reduced if the authors were able to use finer occupation categories.
Rodriguez (1978, p.62) updated these analyses for 1960-1970 and found within-occupation changes accounted for 75% of the educational upgrading of the workforce overall and 47% of the growth in the share of workers with at least four years of college. Both studies found that the declining sizes of occupations requiring little or no formal education, such as farm jobs and laborers, accounted for a significant decline in the shares of the workforce with very low education.
62
The overall impression from these works is the potential importance of within-occupation changes when worker education is the measure of job requirements, though effects are weaker for those with at least four years of college. These studies recognized the impossibility of determining the extent to which within-occupation changes reflected changing job tasks or more general changes in social norms and practices. While this question is difficult to resolve, this report recommends that ORS conducts shift-share analyses for the period 2000-2015 using a consistent set of detailed occupation and education codes to gain a firmer understanding of plausible bounds for the relative importance of between- and within-occupation components of total skill change. If the results indicate the within component accounts for 75% of the total without any correction for general normative influences on the growth in educational attainment, then multiplying the between-occupation shifts in Table 17 by a factor of three would be a reasonable rough order-of-magnitude calculation for understanding the likely magnitude of within-occupation change during a 12-year period. For example, such a procedure would suggest required education within occupations increased 0.45 years overall in the U.S. between 1997 and 2009, or 0.15 years on average over a three-year period. Assuming actual change rates would fluctuate somewhat around these figures owing to period effects, SSA and BLS could evaluate whether such estimates warrant updating the ORS with greater or lesser frequency based on SSA’s needs and resources.
Such an exercise will likely provide an upper bound on the relative importance of the within component because estimates of the importance of the within effect using workers’ education as a proxy for job requirements are likely biased upwards. Workers’ education is not a direct measure of the task content of jobs, even their levels of cognitive complexity. The problem with assuming that it is a direct reflection of job characteristics is that changes in workers’ education levels within occupations may reflect changes in the general level of education among adults to an unknown extent. Education may serve as a credential that signals workers' personal qualities and attitudes, such as self-discipline, trainability, and presentation skills, rather than simply imparting knowledge and skills used on the job. If there is competition for jobs and employers rank workers by education, then competition for relative position in those queues rather than increases in the task complexity of jobs themselves can induce rising education levels. When the supply of educated workers rises, employers adjust their hiring standards upward accordingly to continue drawing from the same part of the distribution as before, prompting young people to acquire more education, leading employers to raise hiring requirements even further and so on.
In addition to these well-known arguments, there are additional reasons for the long-term rise in educational attainment unrelated to the changing need for human capital which argue for caution in treating worker attainment as a direct measure of job skill requirements. At various times, formal education at different levels has been considered important for developing a common sense of citizenship, assimilating immigrants, instilling discipline and building moral character, promoting social skills, removing child labor from competition with adults, improving marriage prospects for women, rewarding veterans, and avoiding the military draft. Similarly, the
63
historically low attainment among southern blacks and substantial postwar growth in black attainment reflected the waxing and waning of political subordination rather than changes in the job structure. Since a large proportion of workers remain in the labor force for about 45 years after completing their education, these historical circumstances can exert an influence on average education levels for many decades after a particular era has passed. For instance, increasing mean attainment among workers in the 1960s was driven in part by the retirement of those educated around World War I. In addition, parents' schooling is a strong predictor of and sets something of a floor on children’s' level of schooling, which suggests that rising educational attainment is likely to have a self-sustaining character whatever its other sources (Mare 1995, pp.165,177,180f.). In short, there are many reasons why educational attainment has grown over time. Even if past educational decisions represented pure responses to current human capital requirements, the mere fact that individuals remain in the labor force for so long ensures that overall supplies are an imperfect guide to current conditions.
The limitations of using individual attainment as a proxy for job skill requirements can be seen directly by examining education trends for occupations that have likely remained relatively unchanged over time, particularly very unskilled jobs little affected by technological change. If the mean attainment for these jobs increased over time this suggests normative or other general social trends rather than increased job skill requirements are at work.
The top panel of Table 19 uses Decennial Census data for 1960-90 or 1970-90 depending on the span for which reasonably consistent occupational categories are available.21 The bottom panel uses 1971-1982 and 1983-1991 to maximize consistency of occupation and education codes. For both panels, the left side presents raw means and the right side presents the percentage change, where the first year of each series is the base year.
The table shows that the average educational attainment for all of these occupations increased over time, often at a faster rate than the overall average, despite their generally low and presumably slow-changing skill requirements. For instance, the mean years of education of taxi drivers and bus drivers increased over 20% during 1960-1980. The mean education of garbage collectors (top panel) and janitors (bottom panel) increased by 12% during the 1970s, above the growth rate for the national average, while the increase among mail carriers was a bit below the average for all workers. It seems unlikely that the skill requirements of these jobs have increased much over time. Indeed, as late as 1989, when about 36% of the workforce used computers, less than 5% of workers in these occupations used computers (results not shown). Yet the average
21 Comparisons between 1990 and earlier years require caution since the 1990 Census replaced years of education with intervals for years of primary schooling and highest degree obtained for post-secondary schooling. However, the problem is less serious for most of the specific occupations examined than for the overall sample average, since education for most in these occupations is in the range still measured using years of education. Years of education for 1990 were imputed by using March 1990 CPS data to calculate mean years of education within categories of the new codes.
64
educational level within these occupations continued to grow at rates similar to the workforce overall.
By contrast, computer usage among receptionists increased from 29% (1984) to 46% (1989) (results not shown), but their educational levels grew the least among the occupations shown. Among airline ticket and reservation agents, a more skilled job compared to the others shown, the rate of computer usage was already over 90% by 1984 (results not shown) but there was also less educational upgrading than most other occupations, though sample sizes are small for this group (bottom panel). The Census files have much larger samples and also reveal low rates of upgrading for this group, only 0.8% increase in mean years of education between 1960-70 and 3.4% between 1980-90 (results not shown), but the incompatibility of the occupation codes between 1970-80 prevent comparison for the period when computer usage presumably diffused most rapidly for this group.
Finally, there has been a great deal of discussion about the changing skill requirements for auto mechanics since cars incorporated more electronic circuitry. Some claim that electronic systems require more conceptual and formal knowledge than mechanical systems, and that the knowledge must be acquired through more formal instruction than the on-the-job training and observation
65
Table 19. Trends in the Mean Education of All Workers and Selected Occupations, Census and March CPS (Handel 2000, p.258)
which was sufficient in the past (Levy 1990). However, both the Census and CPS figures indicate that growth in mean education for auto repairers has been no faster than average in any decade including the 1980s and below that of taxi and bus drivers, garbage collectors, and janitors. Whether or not the real change in this kind of work occurred more recently is not clear, though autos have included on-board computers and other microelectronics since the early 1980s. Figures for 1992-1997 are difficult to summarize in a single series but in general they give some indication that the education of auto repairers is rising somewhat faster than those of all workers, but the evidence is not fully consistent across different measures of education.
Overall, the data in Table 19 suggest cautions in using trends in educational attainment as simple measures of changes in job skill requirements. Clearly, growth in educational attainment reflects broader societal trends as well as any changes in human capital requirements, whether the result of the diffusion of computers or other causes.
To test for effects of computer usage on occupational educational composition models in Table 20 regress changes in mean years of education and in the shares of different education groups within occupations on changes in the percentage of computer users within the occupation and a constant.22 The models use 3-digit Census occupations as the units of analysis and estimate all variables from CPS supplements on computer use. All dependent and independent variables are expressed in terms of average annual changes over the periods 1984-1989, 1993-1997, and 1984-1997. The first two periods have the advantage of consistent educational codes, while the third spans a longer period, ensuring more variation in the dependent variables, even though the change in coding scheme introduces measurement error as well. Model 1 includes only a constant term to obtain a baseline measure of the time trend. Model 2 adds computer use as a predictor, and Model 3 controls for an occupation's pre-computer education level by controlling for the value of the dependent variable in 1970, calculated from a 1970 Census extract coded using both 1970 and 1980 occupation codes.
The first row of models shows mean years of education within occupations grew at an average annual rate of 0.017 years during 1984-1989 (Model 1) and that a percentage point increase in computer use is associated with an increase in mean education of 0.002 years, a bit more than 10% of the size of the unconditional time trend (Model 2). A 12 percentage point increase in computer use, about average for the period, would be predicted to increase an occupation's mean education by 0.024 years during this period, well below the actual mean education increase of 0.18 years observed for individuals in the CPS. Another way to look at this coefficient is that an occupation that moved from having no computer users to 100% computer users is predicted to increase mean education by 0.2 years. Computers are not associated with increased education within occupations for 1993-1997 and seem to be associated with decreased education levels for
22 The analyses are drawn from Handel (2000a).
67
the full period from 1984-1997. However, once the occupation's pre-computer education level is controlled the coefficient for 1984-1997 turns positive again (Model 3).
Table 20. Regression Coefficients for the Effects of Changes in Computer Use on Changes in the Educational Composition of 3-Digit Occupations, 1984-97 (CPS)
Note: Dependent variables are average annual changes in mean education and changes in the percentage shares of different categories of educational attainment within 3-digit occupations. The independent variables are annual average change in computer use within 3-digit occupation and, for Model 3, the 1970 mean education or share of educational group within 3-digit occupation. The source for measures of the dependent variables are the 1984, 1989, 1993, and 1997 CPS-ORG files. The source for measures of computer usage are the 1984, 1989, 1993, and 1997 October CPS files. The source for the 1970 educational measures is a double-coded 1970 Census extract,
68
which permits construction of measures for 1980s occupation codes from Census year 1970. Sample sizes are between 469-492 3-digit occupations. ~ p<.10 * p<.05 ** p<.01 *** p<.001 from Handel (2000, p.262)
Other rows in the table show changes in computer use do not predict changes in the share of high school dropouts within occupations and that the significant estimated effects of computers on the employment shares of those with a post-graduate education are inappropriately signed. The results for high school and college-educated workers are appropriately signed and seem a bit stronger than those for workers with some college only. Results from Model 3 for 1984-1997 suggest that a 25 percentage point increase in computer use within occupations, about average for the period, was associated with a 2.7 percentage point decline in the share of high school educated workers and a 1.1 percentage point increase in college-educated workers within an occupation. By comparison, using the raw microdata, the share of high school educated workers declined by 6.7 percentage points overall and the share of college-educated workers increased 5.3 percentage points during this period. These results suggest that increased computer use is associated with increasing educational requirements but this ostensible prime mover of occupational change represents only 20-40% of the educational upgrading observed within occupations.
In addition, after deleting influential cases the coefficient for college educated workers in Model 3 drops to about 0.003, implying that a unit increase in computer use is associated with only about a 0.07 percentage point increase in the percentage of college educated workers within an occupation. Even these conclusions comes under some doubt because sensitivity analyses indicate changes in computer use by occupation data for 1984-1997 predict prior changes in educational levels within occupations for 1971-1976 to a similar extent (not shown). In other words, occupations which increased their computer usage most in the 1980s and 1990s were already upgrading educational levels for other reasons prior to the diffusion of computers. These analyses could be updated to include years after 1997 to see if they alter conclusions substantively, but it appears that the CPS computer use supplements were discontinued sometime in the early 2000s.
A more direct measure of job education and training requirements are the categories used by BLS in its OES and occupational projections programs. BLS analysts use expert judgment to assign education and training levels to detailed occupations using both data on educational attainment and other information. Although BLS replaced its longstanding category scheme with a new system in 2010, the change is too recent to examine trends over a significant period or to compare ten-year projections with actual results using the new system. Therefore, Table 21 uses published tabulations from Monthly Labor Review using the prior system to contrast actual employment by education and training category in 1998 with both projections and actual figures for 2008. Projections for 2018 are included for comparison. The table shows the share of jobs in occupations requiring a post-graduate degree increased 1.6 percentage points over ten years,
69
while the share in occupations requiring a bachelor’s degree declined by 2.6 percentage points (column 5). There was considerable realignment of jobs across occupations requiring less than an associate’s degree, generally in the direction of upgrading. The index of dissimilarity between 1998 and 2008 is 8.3, mostly reflecting changes below the tertiary degree level.
70
Table 21. Employment by education and training category for 1998, 2008 (projected and actual), and 2018 (projected)
1 2 3 4 5 6 7
1998 actual
2008 projected
2008 actual
2018 projected
2008-1998 actual
2008-1998 projected
2018-2008 projected
First professional degree 1.4 1.4 1.3 1.4 -0.1 0.0 0.1 Doctoral degree 0.7 0.8 1.4 1.5 0.7 0.1 0.1 Master’s degree 0.7 0.7 1.7 1.8 1.0 0.0 0.1 All post-bachelor’s degrees 2.8 2.9 4.4 4.7 1.6 0.1 0.3 Work exp. plus bachelor’s or higher 6.8 7.0 4.3 4.3 -2.5 0.2 0.0 Bachelor’s degree 12.4 13.4 12.3 13.0 -0.1 1.0 0.7 All bachelor’s degrees 19.2 20.4 16.6 17.3 -2.6 1.2 0.7 Associate degree 3.5 4.0 4.1 4.4 0.6 0.5 0.3 Postsecondary vocational training 3.2 3.2 5.8 6.0 2.6 0.0 0.2 Work exp. in related occupation 8.0 7.8 9.6 9.4 1.6 -0.2 -0.2 Long-term on-the-job training 9.6 9.1 7.2 7.0 -2.4 -0.5 -0.2 Moderate-term on-the-job training 14.6 13.7 16.3 16.0 1.7 -0.9 -0.3 Short-term on-the-job training 39.2 39.0 36.0 35.3 -3.2 -0.2 -0.7
Note: Changes for 1998-2008 greater than ± one percentage point are highlighted in columns 5-7.
Source: Douglas Braddock, “Occupational employment projections to 2008,” Monthly Labor Review (November 1999, p.75) and T. Alan Lacey and Benjamin Wright, “Occupational employment projections to 2018,” Monthly Labor Review (November 2009, p.88).
71
The table is included in this section because it is a direct measure of trends in education requirements and it is quite possible that a significant proportion of the total change in the table reflects the changing classification of detailed occupations, not simply their changing relative sizes. For example, the redistribution of jobs in the bottom panel of the table may reflect partly the upward migration of occupations across training categories. One recommendation that emerges from this discussion is that BLS analysts consider examining changes between 2010 and 2016 to determine how many detailed occupations were reclassified in terms of required education, prior experience requirements, and learning times over the past six years as indicators of the likely need for ORS to update its ratings within a similar time frame. The validity of this recommendation is premised on the assumption that all occupations were rerated independently during the current cycle, i.e. prior ratings were not simply carried over from prior cycles for convenience as was the case for ratings in the DOT 1977.
It is somewhat concerning that projections for education and training requirements do not seem as successful as the projections of occupational aggregates for the same period shown in Table 12. The projections for 2008 (column 2) in Table 21 often differ meaningfully from the actual figures (column 3). Comparisons of actual changes (column 5) with projected changes (column 6) shows the projections were conservative and missed all of the large changes, particularly the declines among occupations requiring short- and long-term OJT and the growth of occupations requiring postsecondary vocational training. In general, the rate of SVP upgrading among the least skilled occupations seems to have been underestimated. Likewise, the Master’s degree jobs were underpredicted by one percentage point. By contrast, the projections were too optimistic with respect to the Bachelor’s categories, especially jobs requiring work experience, some of which may have converted to occupations Master’s degrees. A retrospective evaluation of the 1998 occupational projections showed the assumed unemployment rate for 2008 was 1.1 percentage points lower than the actual rate and the decline of manufacturing employment was underestimated greatly (Byun and Henderson 2015), which may have affected the accuracy of projections regarding the lower education and training categories.
Finally, the table offers reasons for caution regarding education and skill projections in the form of the projections for 2008-2018 (column 7), which appear close in spirit to projections for 1998-2008, raising the possibility that they are overly conservative, as well. BLS might consider investigating the reasons the education and skill projections seem to have performed more poorly than projections for 1-digit occupations and seek to address them in order to improve the ability of ORS, as well as other users of the projections, to anticipate future changes.
Nevertheless, the actual decadal SVP changes in column 5 should be useful for SSA and BLS decision making regarding the optimal frequency of the ORS. For example, the share of jobs requiring short-term on-the-job training declined by 3.2 percentage points over a recent ten-year period. SSA should consider whether the implied declines of about 1 and 1.6 percentage points for 3- and 5-year intervals, respectively, suggest a need for more or less frequent updating of ORS.
72
3. Quantitative results from case studies
There is a rich case study literature on changes in occupational skill, autonomy, and other working conditions, but most are qualitative (e.g., Zuboff 1988). They capture the highly nuanced ways in which different jobs are performed and have changed as a result of new technology and management practices. However, it is often difficult to judge the magnitude of changes in the absence of standardized measures, which also precludes systematic comparisons or cumulation of results across jobs and studies. Much of the case study literature that uses standard surveys and measures is in the field of IO psychology, but these studies have proven difficult to summarize systematically, as well. Objective studies of physical job requirements are common in the fields of occupational health and ergonomics, which tend to have the most precise measures but also use relatively small samples. However, the main limitation of most studies in these fields for present purposes is they are cross-sectional, reflecting a primary concern with current applications rather than long-run evolution.
One possibility is to explore the uses of successive editions of the Occupational Outlook Handbook, either for cumulating understanding within-occupation change across the economy broadly or as a rich source of relatively standardized case study data. Information on training, job tasks, and other job characteristics can be gathered from editions spaced 4-6 years apart over 20 years to study changes in the characterization of numerous or specifically chosen individual occupations. In order to understand whether OOH can be used for this purpose BLS will have to clarify whether the methodology of its construction is sufficiently rigorous in the cross-section and its updates sufficiently independent across multiple editions that such an effort is likely to produce credible results. The availability of the data in tractable form is also important if a broad spectrum of occupations is to be studied. Apparently, OOH has been on CD-ROM since the 1992-93 edition and on the web since1996-97 edition (Pilot 1999), though it is not clear whether key data fields can be converted easily into a manipulable electronic file.
Alternatively, OOH can be used in conjunction with other sources to perform case studies of selected occupations that have long been thought to be changing internally in response to the introduction of computer or mechanical technology (e.g., bank tellers, auto mechanics, machinists), have experienced particularly great increases in average worker education levels from relatively low levels, or are overrepresented among SSA claimants (e.g., cashier, fast food). Although they will be studies of a handful of occupations, the rationale for their selection makes them critical test cases. If within-occupation change is gradual for occupations that can be identified in advance as likely extreme cases, then it is unlikely that such change will be more rapid in occupations with fewer markers or more consequential in occupations less represented in SSA’s disability determination process. If within-occupation change is rapid in these occupations, then it is clear that they must be updated on a more frequent basis and the results raise the possibility that there are other occupations that may need to be updated with similar
73
frequency. In any case, taking a closer look at occupations that have high potential for rapid or consequential changes in task content will be informative for ORS planning and practice.
Finally, BLS can survey state boards of education and workforce commissions to understand the length of revision cycles for vocational education curricula and occupational skill standards, including license and certifications. This information can indicate rates of change in entrance and knowledge requirements for selected occupations and help identify some of those that are changing most rapidly.
The remainder of this section considers four case studies of manual jobs that contain relatively systematic, quantitative information on changes in job demands within occupations over time, usually in the context of dramatic technological change.
A small-sample (n=18) ergonomic study of physical demands among refuse collectors in Haarlem (Netherlands) replicated in studies from 1985 and 1993 in 1997. The study monitored workers’ heart rates continuously and converted them to measures of energetic workload using subject-specific estimates of the relationship between their heart rates and oxygen intake. Workers also completed a survey asking them to rate their perceived exertion on a scale ranging from 0-120. The study found workers’ energetic workload did not differ significantly from the studies conducted four and twelve years earlier, though task analyses showed less trunk flexing, raised arms, and knee-bending. This may account partly for the significant declines in perceived exertion between the prior study using the measure in 1993 and the replication in 1997. Nevertheless, the researchers were surprised by the size of the decline in perceived exertion, particularly as there were no differences in musculoskeletal or other health complaints. The study concluded, “the workload of refuse collecting can still be classified as heavy physical work” (Kuijer et al. 200, pp.315ff.). Although this is only a small-scale study of a single occupation, it is useful as a reminder that many of the jobs of greatest interest to SSA are physical and that changes in their content will often be due changes in mechanical technologies that change gradually. Although there is refuse collection truck technology that uses mechanical arms for lifting and emptying garbage containers, relieving workers of most strenuous effort, it would appear to have limited diffusion even seven years after the replication study (Kuijer and Frings-Dresen 2004).
Milkman and Pullman studied GM's Linden, NJ assembly plant after it was rebuilt to incorporate state of the art robots and other elements of industrial automation (1985-1986). Although the study is now several decades old it is valuable as one of the few studies collecting systematic data in the context of extreme technological change. After the auto plant’s modernization, costing over $300 million in current dollars, the Linden plant was one of the country's most automated assembly plants, with 219 robots (192 for welding, 12 for painting, 6 for sealing glass, 9 for training and use as spares), 186 programmable logic controllers (PLCs) to program the robots, and 113 automated guided vehicles to carry car bodies to different work stations, replacing the assembly line. The plant also adopted a just-in-time (JIT) inventory system and
74
quality control practices, such as statistical process control, and employee involvement groups, all cutting edge management innovations (Milkman and Pullman 1991, pp.127f.).
Using retrospective questions, a survey of the plant's skilled trades (n=52) and production workers (n=217) found that unskilled workers were actually less likely to report that accuracy, concentration, judgment, and memory were very important for their jobs, dropping from roughly 60 percent to 45 percent in most cases (see Table 22, left panel). Those reporting problem-solving, reading, and math skills were very important held steady at about 40 percent, 15 percent, and 7 percent respectively. Production workers were asked how long it would take new workers to learn how to do their job well before and after the changeover (i.e., SVP); the median responses were 5 and 3 days, respectively. The corresponding figures for skilled workers jumped from 6 months to 12 months. While most of the decline among production workers reflected a model change and the transfer of responsibility for parts quality back to vendors, the few production workers using computers noted that they were simple to operate. When asked if they would benefit from more training, less than 10 percent of unskilled workers responded positively. Results were qualitatively similar in the more automated body and paint shops as in the plant as a whole (results not shown) (Milkman and Pullman 1991, pp.139ff.).
Automation did change environmental conditions and physical effort requirements significantly. The welding area eliminated previously high levels of dirt and dangerous fumes. One worker, referring to the body shop, said "The jobs are real easy over there now. Most of the guys just have buttons to push for loading up stuff, and robots do it" (Milkman 1997, p.155).
Table 22. Self-Reported Skill Requirements of Unskilled and Skilled Production Workers Before and After Automation, General Motors Linden, NJ Assembly Plant Unskilled Workers Skilled Workers Before After Difference Before After Difference Accuracy/precision 71 63 -8 * 46 73 27 *** Concentration 58 48 -10 *** 42 60 18 ** Judgment 57 47 -10 *** 69 71 2 Memory 63 42 -21 *** 56 81 25 *** Problem solving 41 37 -4 52 73 21 *** Reading 17 14 -3 23 31 8 Math 8 6 -2 17 19 2 Training Time 5 days 3 days -2 days 6 mos. 12 mos. 6 mos. Need more training <10% 71%
Note: Figures are percentages reporting skills "very important." Significance tests not reported for last two rows. Source: Milkman and Pullman (1991, pp.140f.) * p<.10 ** p<.05 ***p<.01 The smaller group of skilled trades workers experienced much greater changes, reporting large increases in skill requirements on most, though not all, dimensions (Table 22, right panel).
75
Changes were concentrated heavily among the workers servicing the new equipment (not shown). Skilled workers reported that their total time to proficiency (SVP) increased from 6 months to 12 months. Over 70 percent of all skilled workers felt they would benefit from additional training, including 87 percent of those working most closely with high tech equipment (not shown). Not surprisingly, electricians needed knowledge of electronics and ability to program PLCs after the installation of automated equipment, which was not necessary with the previous, mechanical, production technology (Milkman and Pullman 1991, pp.132ff.). It would not be surprising to find this phenomenon among other kinds of electrical workers increasing interfacing with microelectronics, e.g., elevator installers.
Fernandez (2001) conducted a longitudinal study of a food processing plant that closed an antiquated plant and built a new, highly automated, state-of-the-art facility that became operational in 1993. The employer guaranteed jobs and current nominal wages for the nearly 200 hourly production workers employed at the old plant. In the new plant, operations once performed manually, such as pouring ingredients into stand-alone machines, were replaced by automated and computer-controlled materials flow and cooking processes, which were monitored and directed by operators sitting in front of computer terminals in an air-conditioned control room. Management explicitly gave operators more training, autonomy, discretion, decision making, data interpretation, and quality control functions as part of the changeover, consistent with Zuboff's (1988) model of effective automation.
The longitudinal design permitted independent, repeated measurements of job skill demands in the old and new plants, which included (a) observer ratings using skill measures from the Dictionary of Occupational Titles, (b) worker self-reports of education and training requirements and their use of reading, writing, and math on the job, and (c) analyst ratings of complete sets of documents workers used on the job. There was a clear increase in technology use. The percentage of workers in the plant who never used a computer on their job declined dramatically from over 83 percent to less than 10 percent, and the percentage always using a computer on the job rose from about 5 percent to about 29 percent (Fernandez 2001, p.22). The evidence indicated jobs in the new plant involved greater cognitive complexity, as well. On a 5-point scale ranging from use "none at all" to "a lot," workers average reports of reading, writing, and math use rose roughly 0.32 after the plant retooling (Fernandez 2001, Table 4). The average number of paper documents workers use rose from 2.6 to 10.3, not counting computer screen forms. Many off-screen, paper forms were generated from computer data on plant output and quality and thus attributable to greater IT intensity.
However, the absolute reading and math demands remained fairly simple, such as a shift from requiring only basic arithmetic in the old plant to requiring computation using decimals and ability to read a graph in the new plant. And though the greater number of documents increased the volume of information workers must process, the documents' qualitative complexity, as rated using the system employed on the National Adult Literacy Survey developed by ETS, seems to have increased only modestly (Fernandez 2001, pp.14,21).
76
The average training time (SVP) remained constant at the interval 3-6 months in both the obsolete and automated plants, and worker self-reports also indicated no change in training times. Worker reports from the two waves indicated they believed the formal education required for their jobs increased from 10 years to 11.5 years, but even the higher figure is roughly equal to the average level of education of workers in the original plant so there does not appear to be any gap between the skills required by the new system and those workers already possessed (Fernandez 2001, pp.14f. and Table 3). Although there is evidence that skill demands rose it seems to have been relatively easily absorbed by the existing workers with no change in turnover relative to historical patterns nor any change in the racial composition (ca. 55 percent minority) despite widespread fears of a mismatch between the skills of minorities and those demanded by high tech work environments. The author seems to acknowledge at various points that the magnitude of the within-occupation skill shifts was absorbable and did not require higher levels of formal education for production workers (Fernandez 2001, pp.16,25,31, 40f.). Indeed, Current Population Survey data indicate that the education levels of blue-collar manufacturing workers in the overall economy tended to track closely changes in the workforce as a whole (Handel 2000a, pp.164,297).
As in the GM plant, this study is valuable as a critical test case because there can be little doubt regarding the large magnitude of the technological change. Both plants were transformed from antiquated to state of the art facilities. The magnitude of the technological upgrading was far higher than is typical and suggests the cases should be taken as an upper bound estimate of the impact of IT on changes in skill demands at the plant level, even as such radical change is relatively atypical in any short time period.
Bartel, Ichniowski and Shaw (2000) and Shaw (2002) conducted qualitative case studies of plants in the medical devices (n=8), valve (n=5), and steel (n=70) industries. In many plants, the introduction of IT has meant that work is less physical and involves more operation of computer terminals, process monitoring, and troubleshooting, while robots, computer numerically controlled (CNC) machine tools, and automated production flows do the actual work of handling and transforming materials into products. Even in a non-automated assembly process, computers and chip technology have increased product variety and complexity, requiring greater worker attention to quality (Bartel, Ichniowski, and Shaw 2000, p. 13). However, in some cases, computers automate some key quality control functions, relieving workers of some inspection and quality control tasks, albeit creating new opportunities for other forms of quality control (Bartel, Ichniowski, and Shaw 2000, pp. 10, 21, 26 ff.).
In the five valve plants, machinists now program CNC machines, but the "sophisticated software" comes with "a simple graphical user interface," and "programming skills would take a relatively short time to learn compared to machining skills, thus they tend not to be a limiting factor" and are learned on the job (Bartel, Ichniowski, and Shaw 2000, pp. 20, 22 f.). Considering the diverse production jobs they observed in the different industries, the authors concluded that "[t]he increase in demand for computer skills is very modest. New computerized
77
machines are run with graphical options that operators can be trained to utilize very quickly." (Bartel, Ichniowski, and Shaw 2000, p. 32).
The case of the steel workers, who now work in central computer control rooms rather than on the production line, seems to encapsulate their general argument: "While some increase in computer literacy is also needed, the critical change in skill sets is being able to respond to the new information processes," which involves greater decision making responsibility regarding quality control and "fixing disruptions and breakdowns" (Bartel, Ichniowski, and Shaw 2000, p. 30). In the steel industry, "[t]he beauty of the introduction of computers in the workplace is that the software that integrates computers is so good that production workers do not require extensive computer skills…[but] the operators now have far more information than they did in the past" as a result of computerization (Shaw 2002, p. 4).
Yet formal education requirements did not rise in any of the plants they studied. Despite employer claims that workers must be intellectually flexible, able to be cross-trained on different jobs, and have problem-solving, communication, and teamwork skills, the jobs still require no more than a high school degree and traditional machinist qualifications in the case of the valve industry (Bartel, Ichniowski, and Shaw 2000, pp. 11, 13, 22 f.). Even though their educational requirements are unchanged, employers in the steel industry are now said to be "looking for an entirely different type of employee," whereas previously they did little to screen applicants. But some of the desirable worker characteristics cited, such as being responsible and reliable and having a "positive attitude" toward hard work and rewards, as well as the others noted above, seem to be traditional virtues (Shaw 2002, p. 8). Shaw acknowledged that the skills "are difficult to observe and quantify" (2002, p. 25) and that the magnitude of change may not be great (2002, p. 23).
III. Discussion
A. ORS periodicity
ORS should be updated on a regular basis between waves by adjusting the occupational weights associated with the ORS scores using occupational employment data from programs such as the CPS, ACS, OES, and Decennial Census. The need to update the scores themselves with greater or lesser frequency is a function of the rate of change in skill requirements and task content within occupations, as well as SSA’s judgment as to the magnitudes that are large enough to warrant updated ratings. If job content within occupations changes gradually such that jobs cross the thresholds of SSA’s skill and exertion categories very gradually over time, then a single cross-section of ORS scores in combination with annual updates of the occupation weights may be generally reasonable for extended periods (e.g., 5-10 years), perhaps supplemented by more frequent updates to occupations that are changing especially rapidly or are more heavily represented among SSA’s claimants.
78
By way of comparison, Table 23 shows the frequency of data collection for similar skill surveys or otherwise relevant data programs. The NCS is one of the very few that are updated more frequently than every 5 years, which likely reflects its use in wage setting, which requires more timely updates. The NCS differs from ORS in measuring changes in the rewards to job characteristics, as well as the characteristics themselves.
Table 23. Frequency of data collection for skill surveys and similar data programs (years) Survey or database Frequency
1 National Compensation Survey 3 2 O*NET 5 3 Dictionary of Occupational Titles 12-16 4 European Working Conditions Survey (6 waves) 5 5 UK Skills Survey (6 waves) 5-6* 6 German BIBB surveys (6 waves) 6-7* 7 Adult literacy surveys, U.S. and OECD (3 waves) 8-10 8 Swedish Level-of-Living Survey (LNU) (6 waves) 7-10* 9 General Social Survey modules on quality of work
life (3 waves) 4 10 ISSP modules on work (3 waves) 8 11 Quality of Employment Surveys (3 waves) 3.5 and 5 12 Panel Study of Income Dynamics (2 waves) 9 13 European Social Survey (2 waves) 6 14 U.S. Economic Censuses 5 15 U.S. Census of Population 10 16 BLS occupational projections 2
Note: The Swedish Level of Living Surveys and the European Social Survey modules on work both contain similar measures of job required education, but the question wording raises validity issues in both data sets. * indicates one wave outside of range Although the knowledge base regarding within-occupation change is quite sparse, the available evidence along with the research results regarding rates of overall change and between-occupation change do not suggest particularly rapid rates of change. Adjusting the employment weights is inexpensive and likely to account for a significant portion of the total change over short time periods, although the exact proportion is largely unknown. Clearly, BLS may wish to conduct some of the research suggested above to gain greater understanding regarding the absolute and relative importance of within-occupation in job skill requirements and task content over time. As a preliminary assessment, given the evidence presented above and the periodicity of the data collection programs on which they were based as well as others shown in Table 23, it is likely that updating the ORS every 5-6 years will prove sufficient to meet SSA’s needs. This periodicity is more likely to be feasible for both agencies than shorter cycles, which is an important consideration given the delays and difficulties experienced by the DOT and O*NET programs at various points. Resources might be better spent increasing the sample size and
79
improving the quality and richness of the measures than on more frequent administrations of a briefer instrument to fewer respondents. Nevertheless, BLS might plan on more frequent updates initially in order to fine tune the instrument and the data collection methods and procedures. Any repeated measurements of occupations over time should be monitored closely and results fed back into the planning process. If notably rapid change is observed over a 3-year period, and there is confidence the changes are not artifactual, then planning to update ORS on a regular 3-year cycle may be warranted. These recommendations are also subject to the caveat that SSA is the ultimate arbiter of its own needs and that the disability determination process may involve considerations not covered in this report, which reflects primarily social science and job analysis perspectives on work. If SSA decides relatively frequent updating is necessary, then its decision is ultimately the controlling consideration. Likewise, BLS may have uses for the ORS that would make more frequent data collection desirable from the perspective of its own mission.
B. Metrics and thresholds
At a general level, setting metrics and thresholds for ORS to track changes in job content is straightforward. The ORS database is intended to support SSA’s mission, so the metrics and thresholds should correspond to the criteria SSA uses in its eligibility determination process, such as levels of job required education, SVP, physical exertion, and various combinations of those categories. For example, the concept of low-skilled sedentary work has specific operational meaning in this context, and ORS metrics should mirror this concepts and the others that SSA has defined as salient for its work. SSA is particularly interested in knowing when the number of jobs in such categories changes, and ORS metrics should be structured with the goal of presenting that information in as accessible form as possible. Metrics and thresholds should be designed to reflect the uses to which they will be put. ORS practice should conform to SSA definitions and cut points in the outputs it produces for SSA, using cut points like “limited education or less,” “high school graduate or above that does/does not provide for direct entry into skilled work,” etc.
The exact form of the metrics will differ for continuous and categorical metrics. Continuous metrics are likely to be relatively straightforward, such as the difference between means divided by the length of the time interval separating them (i.e., average annual change), or average annual percentage change. Focusing on trends in the central tendency of continuous variables presents the fewest complications. Greater complexity arises when there are many levels within categorical variables or there is a desire to track several levels of the distribution of continuous variables (e.g., 10th, 50th, and 90th percentiles). Instead of characterizing an occupation’s level of cognitive complexity or exertional requirements with single numbers, this approach involves multiple numbers, and it is possible they do not tell a simple or consistent story.
80
Metrics for categorical variables will require extensive thought and discussion between BLS and SSA. If all observed skill variability within occupations is trivially small or reasonably judged measurement error, then simply tracking change using the modal category as a measure of central tendency is warranted. However, if variation within occupations is sufficiently great, one possibility is some variant of the educational attainment cluster system used in some editions of the “Occupational Projections and Training Data” supplement to the Occupational Outlook Handbook, which used the percentage distribution of workers’ education within occupations to designate some occupations as requiring a range of educational levels. For example, if 55% of jobs in an occupation require “light” physical exertion and 45% require “moderate” exertion, the classification of the occupation will reflect this diversity, as well, rather than classifying the occupation as simply involving light physical exertion. If jobs are distributed even more widely across the categories light (45%), moderate (35%), and heavy (20%) exertion, such that no category represents a majority of jobs, a decision will need to be made as to how much diversity within occupations the coding scheme will recognize.
The change metric(s) would reflect any shifts in jobs across categories in this more complex scheme, as well. In other words, metrics might need to recognize within-occupation heterogeneity, as well as between-occupation variation, both cross-sectionally in each edition of ORS and in the monitoring of change over time. Further detail on the specific metrics that make sense require a clear summary of the variables and levels SSA wants to use in eligibility determination and some understanding of the pattern of variation within occupations that might require more or less attention to parts of the distribution other than the central tendency. This is one reason O*NET microdata (or NCS data) would be so useful, as ORS could gain some sense of the likely magnitude of within-occupation heterogeneity and the complications it creates for classifying and tracking occupations in terms of these characteristics. Again, it is worthwhile repeating the point that many of these problems in characterizing occupations in singular terms could be avoided if the metrics focused on measuring the numbers of light or heavy jobs, rather than the number of jobs in light or heavy occupations (Handel 2015). It is the latter that raises the problem that potentially numerous jobs in the occupation do not share the characteristics that are used to describe the occupation, e.g., jobs requiring heavy exertion in occupations classified as requiring moderate exertion.
This report has noted at points the difficulties in interpreting the magnitudes of observed changes in job characteristics described in existing research. In part this reflected the nature of the measures used in that research, specifically, items that were relatively vague, general, and abstract and ordinal or standardized scale metrics, rather than metrics with objective meanings. As noted, in addition to creating problems of interpretability for analysts, such items may impart a stability bias to the trends measured in the data. When items are relatively susceptible to variable and subjective interpretations, it is possible that subsequent cohorts of respondents who experience genuine change in working conditions (e.g., reduced physical demands) redefine the meaning of the questions or response options. Thus, what counts as “heavy” physical work may
81
change over time, causing responses to hover around a fixed set-point, reflecting conformity to some preconceived normative response. Items that are phrased in more general and less concrete terms can be expected to be subject response biases, such as yea-saying, nay-saying, extreme-value responding, or middle-value responding. By contrast, ORS measures aim to be concrete and objective, and should be less susceptible to these kinds of problems.
Nevertheless, no design, including ORS, can escape the more general problem that there is no absolute, objective, or well-established standard for judging the rapidity of change in occupational skill requirements and task content. As with most social indicators, magnitudes can only be interpreted relative to some criterion or point of comparison. It is only long experience that renders the 0 to 800 scale of SAT college entrance exams meaningful to anyone outside of ETS. Among economic indicators, the ability to compare individual values of an indicator to its historical behavior is often the basis for judging whether a given rate of GDP or productivity growth is fast or slow, for example. Needless to say, neither of these conditions applies to most measures of job requirements, especially the kind of hard metrics ORS is pioneering. Theory and research that could provide a frame of reference for judging the magnitudes of change rates are generally lacking. SSA, BLS, and many others want to know how fast jobs are changing. What is less appreciated is that this requires some standard for deciding what counts as fast or slow. The ORS will be breaking new ground in seeking a firm basis for substantively meaningful thresholds for measures of job content.
One way to render metric levels more intuitive would be to illustrate or benchmark them using a small number of well-known occupations that could be expected to span the range of most skill score scales in relatively even spacing (e.g., cleaner, cashier, secretary, carpenter, teacher, medical technician, nurse, accountant). Knowing the mean ratings of the DOT’s Dealing with people for managers, supervisors, physicians, secretaries, machine operators, and janitors would give some context for understanding score distances. This might be useful also in establishing thresholds to measure the significance of observed changes. In this scenario, the metrics would track how far the entire workforce, percentiles in the distribution, or individual occupations moved time t0 to time t1 relative to the scale distances separating prototypical jobs. If changes within an occupation over time are relatively small with respect to the score distances between these occupational signposts then one can reasonably treat the changes as relatively small. Judging the significance of magnitudes by benchmarking changes against the distances separating well-known occupational titles provides one solution to the problem of deciding how much change counts as large.
Alternatively, the assessment of magnitudes could be tied more directly to the purposes of data collection. Clearly, when the BLS finds an occupation shifts between the categories that SSA uses in its disability determination process, the change is substantively significant. If an occupation crosses an educational/skill or effort threshold, that is something to be noted. If many occupations change status rapidly, then BLS and SSA might need to consider relatively frequent data collection cycles. The recommendation is that SSA’s definitions of skill (required
82
education), SVP, exertional levels, environmental conditions, and other variables provide the frame of reference that BLS uses in tracking occupational change. Although this still leaves open issues such as the number of occupations, the percentage of jobs, and the number of variables that must cross SSA thresholds in order to suggest more or less frequent updating of the ORS is necessary, at least it is clear what phenomena need to be monitored in order to make an informed decision. SSA and BLS will need to decide how much movement of occupations and jobs across the levels of variables used in the disability determination process indicates a need to update the ORS occupational scores.
Of course, movement of occupations representing more or less jobs within SSA skill and effort levels are likelier to be more common, but these lack practical significance for the determination of eligibility for disability benefits and are therefore ignorable from the perspective of the primary purpose for which the ORS data are being collected.
IV. Conclusion The BLS seeks to understand historical rates of change in job requirements and potential rates of change in the future in order to inform its planning regarding the frequency with which the ORS database of occupational scores will need to be updated. Monitoring and evaluating the rapidity of change requires metrics and thresholds for defining when change is rapid enough to warrant full or partial updating of the ORS database. As noted, research on this topic has remained relatively sketchy for the several decades since the late 1960s that it has been studied. In many respects, ORS will be breaking new ground. Currently, there are no objective or standard measures with long historical series based on large samples, as exists with other, familiar economic indicators, such as GDP, productivity, unemployment, or inflation rate. Where measures exist, their differences from ORS measurement philosophy is such that there is no guarantee that their behavior over time is similar to ORS measures. Indeed, although O*NET has large samples and a wide array of repeated measures, it is SSA’s dissatisfaction with O*NET that is responsible for the ORS data collection program. The implication is that solid information will emerge only from repeated administrations of the ORS itself. Only when there is ORS data on a wide range of occupations over 3-5 years will the program know how rapidly occupational task content changes with respect to ORS metrics. Nevertheless, theory and available evidence reviewed here can inform ORS planning.
This report recommends that the ORS program recognize clearly two distinct components of total change in job requirements, between-occupation changes in the size of occupations and within-occupation changes in the character of occupations as it related to skill requirements, job tasks, and environmental conditions. The two components differ significantly in their implications for ORS practice. Regardless of the frequency with which the ORS scores are themselves updated, the database should incorporate annual or biennial changes in occupation size into calculations of the prevalence of relevant job characteristics. In addition to its intrinsic substantive importance, information on the rate of change due to such compositional effects can
83
also provide information on the plausible ranges of within-occupation effects. Nevertheless, it is only insofar as occupations change internally, or new occupations emerge, that ORS scores themselves need to be updated and direct evidence on within-occupation change is the most scarce as there are few sources of repeated measures with sufficient occupational coding detail and sufficient samples sizes to estimate trends over time at the level of detailed occupations. Nevertheless, there is a common belief that the increasing use of computer technology in the workplace is altering the task content as well as the relative sizes of detailed occupations.
The main part of this report reviewed research evidence on
• total changes in job skill requirements from U.S. and international studies using data with modest sample sizes or not presenting shift-share decompositions
o using data from the QES, PSID, EWCS, ISSP, GSS, and UK Skills Survey • between-occupation changes
o long-run historical trends in the relative sizes of broad occupations in the U.S. and other OECD countries as a coarse, ordinal measure of skills
o performance of BLS projections to 2008 as an indicator of BLS’ ability to effectively anticipate future skill change
o long-run trends in direct measures of skills based on the changing sizes of detailed occupations, including DOT scores weighted by detailed occupational employment for the U.S.
covering 1960-1997 O*NET scores weighted by detailed occupational employment for the
U.S. and other OECD countries covering 1997-2009 • within-occupation changes
o using shift-share analyses of trends in workers’ personal education as an imperfect proxy for job required education
o analyses of the relationship between workers’ education within occupations and computer use within occupations
o trends in actual and projected distribution of jobs across BLS education and training levels for 1988, 1998, 2008, and 2018
o four quantitative case studies of trends in blue-collar job demands replicating ergonomic measures of a single physically demanding job
(urban refuse collectors) tracking changes after full-scale factory automation overhauls probing changes in steel and other manufacturing industries after the
introduction of varying levels of automated production technologies
Most of the evidence reviewed suggested job skill requirements and other job demands do not change rapidly and that the effects of computer or other technologies are not necessarily far-reaching, including studies that focused on blue-collar jobs. Perhaps reflecting this fact, almost all multi-wave studies of job requirements, including O*NET, updated with a periodicity of 5-10
84
years. Indeed, job trends in the future are unlikely to be a simple reflection of Moore’s Law of accelerating change, despite the frequency of such claims (e.g., Hassett and Strain 2016), because no evidence of such continuous acceleration is visible in occupational employment trends or in direct measures of job requirements since 1965, when Gordon Moore made his original observation, or since the microcomputer revolution of the early 1980s. Computer technology changes rapidly but any belief that workplace trends are a simple reflection of the speed with which chip density or microprocessor speed increases is a fallacy.
In addition to the empirical evidence, there are two reasons to expect within-occupation change to be gradual. Within very short intervals, the vast majority of the people working at the end of the time period will be the same as those working at the beginning, as well. Panel data may be consulted to gain a more precise understanding, but it would not be surprising if somewhere around 85% of the workers at the end of a 3-year period were also working at the outset. This group provides substantial demographic ballast to estimated overall prevalence of job requirements. Most people probably do not change dramatically the kinds of job tasks they perform in such a short period. Normal forms of career progression do not count because it leaves the structure or distribution of jobs across SSA levels unchanged. In this case, less senior workers simply move into slots vacated by more senior workers as those at the top of the vacancy chain exit the workforce. Simulations can be performed to estimate how different the tasks of continuing workers and new entrants must be in year t3 compared to t1 in order to alter the distribution of jobs across SSA categories to a meaningful extent. If the estimated changes among new and experienced workers must be implausibly large to produce meaningful change in the aggregate, this would be another reason to question whether updating the ORS so frequently is necessary.
Another reason to expect within-occupation change to be gradual is that very large changes in the task content of jobs would prompt reclassification or redefinition of those jobs as different occupations, like the labeling of some jobs as administrative assistants rather than secretaries in the past twenty-five years. Indeed, systems of occupational classification are designed to classify jobs into meaningful and relatively homogeneous groups. If there is wholesale change in the task content of jobs such that the occupational title is no longer descriptive, or a very large share of jobs becomes so different from the rest of the occupation that the occupational title no longer applies but the change goes unrecognized in the practice of occupational coding, then the occupational classification scheme has failed to serve its purpose. Although occupational classification schemes are not revised more rapidly than once per decade and coding may well lag developments in the workplace in certain cases, the nature of effectively functioning occupational classification can be expected to impose some limits on the magnitude of unrecognized changes in job requirements within occupations.
Nevertheless, none of the theory and evidence reviewed here can be taken as conclusive. The evidence presented here is informative for ORS planning, but also limited by the differences between most of the underlying survey instruments and ORS items, response options, and the
85
metrics that will be constructed from them. The ORS development process may well require more frequent updating of ORS to fine-tune the instrument and survey practices. During this process repeated measures should be analyzed closely for the light they shed on rates of within-occupation change and implications for ORS periodicity. Ultimately, the needs and resources of SSA and BLS will determine the appropriate frequency for updating the ORS.
If BLS seeks to gain greater leverage on questions of within-occupation change, Section II.C.1 (pp.54ff.) offered a number of concrete suggestions for systematic analyses using O*NET, the NCS, literacy surveys sponsored by NCES and OECD, and the 1977 and 1991 editions of the DOT. Efforts should be made to secure confidential access to O*NET microdata because it permits much richer analyses of within-occupation diversity than the publicly available occupation-level database. Indeed, the final two items on the O*NET background questionnaire ask respondents about 6 specific conditions or symptom clusters that affect their functioning, including their ability to work. It is very surprising that there appears to be no public reporting by O*NET of descriptive information on these items relevant to disability status, or any analyses relating them to respondents’ actual occupations, which requires working with the microdata. It appears a very rich source of information on within-occupation job demands is currently unexploited.
In addition, BLS can make fuller use of its own research on occupational requirements connected to its education and training categories and the Occupational Outlook Handbook. Depending on the methodology employed in making occupational projections, comparisons of projections made between 2010 and 2016 might show how many detailed occupations were reclassified in terms of required education, prior experience requirements, and learning times over the past six years, which could indicate the likely need for ORS to update its ratings within a similar time frame.
BLS should also work to centralize and standardize information from these two programs so that they can be monitored continuously to inform ORS practice and other BLS programs. This information should include systematic monitoring of trends in occupational certification and licensing and regular collection of information from state workforce commissions and other bodies that set or monitor occupational standards and curricula for technical, career, and vocational education. The frequency with which such training and standards are revised provide important indications of rates of occupational change. BLS should work to centralize and standardize information on training, credentialing, and technological change that is currently collected in different programs inside BLS and ETA.
Likewise, given the level of interest in the speed of technology diffusion and its potential consequences for job requirements, BLS should try to integrate into a central information clearinghouse the various data collected currently in different programs and offices in BLS, O*NET (e.g., Tools and Technology database), the Economic Census programs, and BEA (e.g., capital investment data). Technology monitoring is important for ORS in its efforts to anticipate
86
future job trends and would be followed with great interest by many others in the policy and research communities, as well as the public, who are concerned about the relationships between technology and jobs. BLS might consider opening a small office or formal effort to integrate disparate knowledge on technology and jobs currently collected across different agencies. A CPS supplement and/or employer survey on computer and other technology use could help fill longstanding gaps in knowledge regarding technology as a driver of the growth and decline of occupations and changes in physical exertion, cognitive skills, and other occupational characteristics. In the interim, critical case studies of technologically dynamic occupations using successive editions of OOH and other sources can help ORS understand recent rates of change and anticipate future change.
To understand rates of change and anticipate future change more formally, analyses can combine scores from the first wave of ORS with employment weights from (1) CPS or Census data from the previous 10 years, (2) a recent projection year for which actual data are available, such as 2014, and (3) the most recent projections for 2024 or 2026. As in shown in this report, such exercises can provide a good sense of historical rates of change, magnitudes of projected future changes, and the performance of recent projections when compared to actual means and distributions for ORS variables. Again, both the historical record and the evaluation of past projections should be in terms of metrics relevant to SSA, e.g., the proportion of sedentary low-skilled jobs, rather than metrics that may show finer rates of change or otherwise differ from the kind of changes SSA and BLS are interested in monitoring. Needless to say, all of the results from this exercise would reflect changes due to trends in the sizes of detailed occupations rather than any changes in their task content, which would require multiple waves of ORS data.
Because the analyses are so easily accomplished, BLS should almost certainly update the shift-share analyses described earlier that decompose changes in worker education into between- and within-occupation components. Although workers’ education is an imperfect proxy for job education requirements, it is one of the most widely available measures. Results can also help provide plausible bounds for the relative importance of between- and within-occupation components of total change for ORS skill measures.
Finally, it is important to recognize that not all change within occupations implies a need to update ORS. Changes in skill within occupations require attention insofar as they push occupations or significant proportions of workers within occupations over some threshold relevant to SSA’s disability determination process or relative to BLS’ own needs for timely and precise occupational information. If within-occupation change of this kind occurs infrequently, then less costly estimates based on updating employment weights to reflect the changing sizes of occupations will produce estimates of change that meet many of the goals for which ORS was designed.
87
References
Bartel, Ann P., Casey Ichniowski, and Kathryn Shaw. 2000. "New Technology, Human Resource Practices, and Skill Requirements: Evidence from Plant Visits in Three Industries."
Byun, Kathryn J. and Richard Henderson. 2015. “Evaluation of BLS employment, labor force and macroeconomic projections to 2006, 2008, and 2010.” Monthly Labor Review. November.
Felstead, Alan, Duncan Gallie, Francis Green, and Ying Zhou. 2007. “Skills at Work, 1986 to 2006.” ESRC Centre on Skills, Knowledge and Organisational Performance. Universities of Oxford and Cardiff, UK.
Felstead, Alan, Duncan Gallie, Francis Green, and Hande Inanc. 2013. “Skills At Work In Britain: First Findings from the Skills and Employment Survey 2012.” London: Centre for Learning and Life Chances in Knowledge Economies and Societies, Institute of Education.
Fernandez, Roberto M. 2001. "Skill-Biased Technological Change and Wage Inequality: Evidence From a Plant Retooling." American Journal of Sociology. 107:273-320.
Folger, John K. and Charles B. Nam. 1964. “Trends in Education in Relation to the Occupational Structure.” Social Forces. 38:19-33.
Gallie, Duncan, Alan Felstead, and Francis Green. 2003. “Skill, task discretion and new technology. Trends in Britain 1986-2001.” L'Année sociologique. 53:401-430.
Green, Francis. 2012. “Employee Involvement, Technology and Evolution in Job Skills: A Task-Based Analysis.” Industrial and Labor Relations Review. 65:36-67.
Handel, Michael J. 2000a. “Models of Economic Organization and the new Inequality in the United States.” Unpublished PhD dissertation. Department of Sociology, Harvard University.
Handel, Michael J. 2000b. “Is There a Skills Crisis? Trends in Job Skill Requirements, Technology, and Wage Inequality in the United States.” Public Policy Brief 62. Levy Economics Institute of Bard College. Annandale-on-Hudson, New York.
Handel, Michael J. 2003. "Impacts of Information Technology on Employment and Work: What Do the Data and Research Say?" SRI International. Arlington, VA. Commissioned by the National Science Foundation.
88
Handel, Michael J. 2004. "Implications of Information Technology for Employment, Skills, and Wages: Findings from Sectoral and Case Study Research." SRI International. Arlington, VA. Commissioned by the National Science Foundation.
Handel, Michael J. 2012. “Trends in Job Skill Demands in OECD Countries.” OECD Social, Employment and Migration Working Papers, No. 143. OECD: Paris.
Handel, Michael J. 2015. “Methodological Issues Related to the Occupational Requirements Survey.” BLS report.
Handel, Michael J. 2016 (forthcoming). “Measuring job content: Skills, technology, and management practices.” The Oxford Handbook of Skills and Training, John Buchanan, David Finegold, Kenneth Mayhew, and Chris Warhurst, eds. Oxford University Press.
Handel, Michael J and David I. Levine. 2004. "The Effects of New Work Practices on Workers.” Industrial Relations. 43:1-43.
Hassett, Kevin A. and Michael R. Strain. 2016. “Expect 25 years of rapid change.” Monthly Labor Review. (March).
Hogan, Andrew and Brian Roberts. 2015. “Occupational employment projections to 2024.” Monthly Labor Review. December.
Johnson, Richard W. 2004. “Trends in Job Demands Among Older Workers, 1992-2002.” Monthly Labor Review. July: 48-56.
Kuijer, Paul and Monique Frings-Dresen. 2004. “World at work: Refuse collectors.” Occupational and Environmental Medicine. 61:282–6.
Kuijer, Paul, Monique Frings-Dresen, Michiel De Looze, Bart Visser, and Allard van der Beek. 2000. “Work situation and physical workload of refuse collectors in three different time periods.” International Journal of Industrial Ergonomics. 26:509–19.
Mare, Robert D. 1995. “Changes in Educational Attainment and School Enrollment.” Pp.155-213 in State of the Union: America in the 1990s, Reynolds Farley, ed. New York: Russell Sage Foundation.
Milkman, Ruth. 1997. Farewell to the Factory. Berkeley and Los Angeles, CA: University of California Press.
Milkman, Ruth and Cydney Pullman. 1991. "Technological Change in an auto Assembly Plant: The Impact on Workers' Tasks and Skills." Work and Occupations. 18:123-147.
Miller, Ann R., Donald J. Treiman, Pamela S. Cain, and Patricia A. Roos. 1980. Work, Jobs, and Occupations: A Critical Review of the Dictionary of Occupational Titles.
89
Parent-Thirion, Agnès, Enrique Fernández Macías, John Hurley, and Greet Vermeylen. 2007. “Fourth European Working Conditions Survey.” European Foundation for the Improvement of Living and Working Conditions. Dublin, Ireland.
Pilot, Michael J. 1999. “Occupational Outlook Handbook: A review of 50 years of change.” Monthly Labor Review. May:8-26.
Rodriguez, Orlando. 1978. “Occupational Shifts and Educational Upgrading in the American Labor Force Between 1950 and 1970.” Sociology of Education. 51:55-67.
Rohrbach-Schmidt, Daniela and Anja Hall. 2013. “BIBB-BAuA Employment Survey 2012.” BIBB-FDZ Data and Methodological Reports. Federal Institute for Vocational Education and Training. Bonn, Germany.
Sass, Steven A. 1990. “The U.S. Professional Sector: 1950 to 1988.” New England Economic Review. January/February:37-55.
Shaw, Kathryn. 2002. "By What Means Does Information Technology Affect Employment and Wages? The Value of IT, HRM Practices, and Knowledge Capital." Pp.229-267 in Information Technology, Employment, and Earnings, Nathalie Greenan and Jacques Mairesse, eds. Cambridge: MIT Press.
Smith, Tom W., Peter V. Marsden, Michael Hout. 2016. General Social Surveys, 1972-2014: cumulative codebook. Chicago: NORC.
Steuerle, Eugene , Christopher Spiro, and Richard W. Johnson. 1999. “Can Americans Work Longer?” Straight Talk on Social Security and Retirement Policy No. 5. Washington, DC: Urban Institute.
U.S. Department of Labor. Employment and Training Administration. 1991. Dictionary of Occupational Titles: Volume 1. Fourth edition, revised. Washington, DC.
Zuboff, Shoshana. 1988. In the Age of the Smart Machine: The Future of Work and Power. New York: Basic Books.