Page 1
1
Dynamics of speB mRNA Transcripts in Streptococcus pyogenes 1
2
Zhiyun Chen 1*, Andreas Itzek 1, Horst Malke 1, Joseph J. Ferretti 1, and Jens 3
Kreth 1* 4
5
6
7 1 Department of Microbiology and Immunology, University of Oklahoma Health 8
Sciences Center, Oklahoma City, Oklahoma 73104 9
10
11
* Corresponding author address: Department of Microbiology and Immunology, 12
University of Oklahoma Health Sciences Center, BMSB 907, 940 Stanton L. 13
Young Blvd., Oklahoma City, OK 73104. Phone: (405) 271-1202. Fax: (405) 271-14
3117. E-mail: [email protected] and [email protected] 15
16
17
Copyright © 2012, American Society for Microbiology. All Rights Reserved.J. Bacteriol. doi:10.1128/JB.06612-11 JB Accepts, published online ahead of print on 20 January 2012
on May 14, 2018 by guest
http://jb.asm.org/
Dow
nloaded from
Page 2
2
Abstract 18
19
Streptococcus pyogenes (Group A streptococcus, GAS) is a human-specific 20
pathogen that causes a variety of diseases ranging from superficial infection to 21
life-threatening diseases. SpeB, a potent extracellular cysteine proteinase, plays 22
an important role in the pathogenesis of GAS infections. Previous studies show 23
that SpeB expression and activity are controlled at the transcriptional and 24
posttranslational levels, though it had been unclear whether speB was also 25
regulated at the post-transcriptional level. In this study, we examined the growth 26
phase dependent speB mRNA abundance and decay using qRT-PCR and 27
Northern blot analyses. We observed that the speB mRNA accumulated rapidly 28
during exponential growth, which occurred concomitantly with an increase of 29
speB mRNA stability. A closer observation revealed that the increased speB 30
mRNA stability was mainly due to progressive acidification. Inactivation of RNase 31
Y, a recently identified endoribonuclease, revealed a role in processing and 32
degradation of speB mRNA. We conclude that the increased speB mRNA 33
stability contributes to the rapid accumulation of speB transcript during growth. 34
35
36
Keywords: Streptococcus pyogenes, SpeB, mRNA degradation, RNase Y37
on May 14, 2018 by guest
http://jb.asm.org/
Dow
nloaded from
Page 3
3
Introduction 38
39
Streptococcus pyogenes (Group A streptococcus, GAS) is a Gram-positive 40
pathogen that causes a variety of human diseases. GAS infections range from 41
mild superficial infection such as pharyngitis and impetigo, to life-threatening 42
systemic diseases such as toxic shock syndrome and necrotizing fasciitis (15). 43
GAS also plays a significant role in the development of post-streptococcal 44
infection sequelae, including acute rheumatic fever, acute glomerulonephritis, 45
and reactive arthritis (15). The pathogenesis of GAS infection involves a complex 46
host-pathogen interaction in which the streptococcal proteinase, SpeB 47
(streptococcal pyrogenic exotoxin B) plays a crucial role (47). 48
SpeB is a secreted cysteine proteinase with a broad spectrum of activities. 49
Spe B cleaves human extracellular matrix proteins, such as fibrin, fibronectin, 50
vitronectin, and matrix proteoglycans (16, 21, 41); and degrades human 51
immunoglobulins (13, 14) and inflammatory mediators, such as complement 52
factor C3b (46) and cathelicidin LL-37 (19). In addition, SpeB cleaves S. 53
pyogenes surface proteins releasing C5a peptidase and M protein (8). These 54
observations indicate that SpeB can facilitate bacterial dissemination and survival 55
as well as induce inflammation and tissue damage in the host. Clinical 56
observations and animal experiments have clearly demonstrated the importance 57
of SpeB in the pathogenesis of GAS infection. Accordingly, it has been observed 58
that SpeB was abundantly present in necrotic human tissue (19), and that a 59
on May 14, 2018 by guest
http://jb.asm.org/
Dow
nloaded from
Page 4
4
decreased SpeB proteinase activity led to reduced tissue damage in a primate 60
model for necrotizing fasciitis (36). 61
Since SpeB is an important virulence factor in GAS infection, it is not 62
surprising that SpeB production is tightly regulated. Under laboratory conditions, 63
the SpeB proteinase is usually not detectable during early and mid exponential 64
growth phases, but becomes highly abundant when the culture reaches late 65
exponential and stationary phases (11, 38). SpeB production is strongly affected 66
by culture pH and nutrient availability, e.g., the optimal pH for SpeB synthesis 67
ranges from pH 6.0 to pH 6.5 (11, 12, 28, 35), and supplementation of glucose or 68
peptides in the growth medium usually inhibits the production of the proteinase 69
(11, 12, 38). Molecular biological studies show that SpeB is controlled at both 70
transcriptional and post-translational levels. The transcription of SpeB is 71
repressed by CovR/S (17) and Srv (39), and is activated by Rgg also referred to 72
as RopB (30), CcpA (22), and Mga (40). Among these regulators, RopB is 73
essential for speB transcription by binding to the promoter region and facilitating 74
transcription initiation (4, 10, 29, 33). It has yet to be determined if speB is 75
regulated at the post-transcriptional level. 76
The steady-state level of mRNA is determined by both transcript synthesis 77
and degradation. Traditionally the regulation of mRNA decay has been 78
considered insignificant in prokaryotes, though this opinion has slowly changed 79
as a growing body of literature suggested that the regulation of mRNA turnover is 80
widely distributed in many bacterial species (5). Barnett et al. (7) reported that 81
the expression of certain ‘growth phase dependent’ genes, such as sagA and 82
on May 14, 2018 by guest
http://jb.asm.org/
Dow
nloaded from
Page 5
5
sda (encoding streptolysin S and streptodornase, respectively), were primarily 83
regulated at the mRNA decay level, indicating an important role of post-84
transcriptional regulation on S. pyogenes virulence. These transcripts were more 85
abundant in stationary phase than in exponential phase, mainly because their 86
stability increased dramatically in the stationary phase (7). It was later found that 87
ribonucleases J1 and J2 were involved in the decay process of these genes (9). 88
Additionally, the mRNAs of prominent genes (mga, covR and ska) have been 89
shown to exhibit widely differing half-lives (45). 90
The aim of this study was to determine how S. pyogenes regulates SpeB at the 91
post-transcriptional level leading to the rapid accumulation of speB transcripts 92
during growth. By combining Northern blot analysis and qRT-PCR, we observed 93
that speB mRNA stability increased gradually during exponential growth, and that 94
the mRNA degradation process was pH dependent. RNase Y (encoded by cvfA), 95
a recently identified endoribonuclease of S. pyogenes (20), is involved in speB 96
mRNA processing and degradation, but other yet unidentified nucleases are 97
required as well. We conclude that the increased speB mRNA stability 98
contributes to the rapid accumulation of speB transcript during growth. 99
100
on May 14, 2018 by guest
http://jb.asm.org/
Dow
nloaded from
Page 6
6
Materials and Methods 101
Bacterial strains and growth condition. Bacterial strains used in this study 102
are listed in Table 1. S. pyogenes NZ131 (M49) was routinely grown in C 103
medium (0.5% proteose peptone #3; 1.5% yeast extract; 10 mM K2HPO4; 0.4 104
mM MgSO4; 17 mM NaCl) (30) at 37°C without aeration. Erythromycin and 105
spectinomycin, when required, was added at a final concentration of 2 μg/ml and 106
100 μg/ml, respectively. 107
108
Total RNA extraction, cDNA synthesis, and Real-time PCR analysis. 109
Overnight cultures of S. pyogenes were diluted 1:40 in fresh C medium and 110
grown at 37°C to the desired growth phase. Streptococcal cells were harvested 111
by centrifugation (5000 × g, 5 min, 4°C). Cell pellets were resuspended in TRIzol 112
(Invitrogen) and stored at -80°C. To isolate RNA, cells were disrupted three times 113
for 30 seconds each using Lysing Matrix B (MP Biomedicals; Solon, OH) in a 114
FastPrep FP210 Homogenizer (Thermo Scientific) (speed setting 6.5). Total 115
RNA isolation was carried out according to the manufacturer’s instructions 116
(Isolation of total RNA using TRIzol, Invitrogen). RNA samples were treated with 117
Turbo DNase (Ambion) to remove traces of chromosomal DNA. RNeasy 118
MiniElute cleanup kit (Qiagen) was used to purify RNA samples after DNase 119
treatment. cDNA was synthesized from 1 μg of total RNA by using the iScript 120
cDNA synthesis kit (Bio-Rad). Real-time PCR was performed as described 121
previously (2, 31). Briefly, the relative amounts of gene-specific cDNA were 122
quantified by the comparative threshold cycle (CT) method using the Bio-Rad 123
on May 14, 2018 by guest
http://jb.asm.org/
Dow
nloaded from
Page 7
7
(Hercules, CA) MyiQ Real-Time PCR Detection System with fluorescein-spiked 124
SYBR Green as the fluorophore. The primers were designed to have a melting 125
temperature between 59.5°C and 60.5°C, and to amplify 110-115 bp fragments. 126
The amplification efficiency was between 90% and 110%, which was determined 127
by analysis of the standard curve of Real-time PCR with template dilution over 128
five orders of magnitude. The CT value of each gene of interest was normalized 129
to the 16S rRNA (ΔCT = CT _goi- CT _16S). The 16S rRNA was used as the 130
endogenous reference because its abundance was consistent from the early 131
exponential phase to early stationary phase (data not shown). Relative 132
abundance (RA) of each gene as compared to 16S rRNA was calculated using 133
the equation RA = 2-ΔCT. 134
135
Northern blot analysis. Total RNA without DNase treatment was used for 136
Northern blot analysis. RNA samples were frozen and thawed no more than once 137
to minimize degradation. One to five micrograms of total RNA were separated on 138
a 1% agarose–0.66 M formaldehyde gel in a buffer consisting of 40 mM 3-[N-139
Morpholino]propanesulfonic acid (MOPS) (pH 7.0), 10 mM sodium acetate and 140
0.2 mM EDTA. RNA was then transferred to a Hybond-N membrane (Amersham) 141
in a Trans-Blot SD Semi-Dry Transfer Cell (Bio-Rad), and was immobilized to the 142
membrane by UV crosslinking (Stratagene). Gene-specific digoxigenin (DIG) 143
probes were PCR-generated by using a PCR DIG probe synthesis kit (Roche 144
Diagnostic). Primers used for DIG probe synthesis are listed in Table 2. 145
Hybridization of the DIG-labeled DNA probes to RNA on the membrane and 146
on May 14, 2018 by guest
http://jb.asm.org/
Dow
nloaded from
Page 8
8
visualization of the hybrid with CDP-Star were carried out according to the 147
manufacturer’s instructions (DIG application manual, Roche Diagnostic). The 148
abundance of gene transcript, represented by the averaged pixel intensity of a 149
band with defined size, was quantified with ImageJ software (1). The amount of 150
23S rRNA, which was visualized by ethidium bromide staining on an agarose gel 151
prior to transfer, served as a loading control. 152
153
mRNA decay assay. Streptococcal cells were grown in C medium to a 154
desired cell density. Rifampicin was added to the culture to a final concentration 155
of 1 mg/ml. Five-milliliter aliquots of the culture were withdrawn at different time 156
points after the addition of rifampicin, rapidly chilled to 0°C by mixing with 10 ml 157
crushed ice, and harvested by centrifugation (5000 × g, 5 min, 4°C). The 158
transcript abundance of a particular gene at each time point was determined by 159
qRT-PCR or Northern blot analyses. Excel software (Microsoft) was used to 160
perform regression analysis and to calculate mRNA decay rates. 161
162
SpeB and RNase mutant construction. Overlap extension PCR technique 163
(44) was used to construct S. pyogenes mutants described in Table 1. Primer 164
sequences for mutant construction were listed in Table 2. For speB mutant 165
(ΔspeB) construction, the upstream and downstream regions of speB gene were 166
PCR amplified with primer pairs speB_P1/speB_P2(erm) and 167
speB_P3(erm)/speB_P4 respectively. An erythromycin resistant cassette (erm) 168
was PCR amplified from a shuttle vector pHS17 (18) with primer pair Erm-L/Erm-169
on May 14, 2018 by guest
http://jb.asm.org/
Dow
nloaded from
Page 9
9
R. The primers speB_P2(erm) and speB_P3(erm) were oligonucleotide hybrids 170
with 5’ end sequences complementary to the erm cassette and 3’ end sequences 171
complementary to the flanking regions of speB gene. PCR-generated fragments 172
of speB-upstream region, erm cassette, and speB-downstream region were 173
mixed at 1:1:1 molar ratio and amplified with primer pair speB_P1/speB_P4. This 174
amplification led to the ‘ligation’ of the three fragments in an order of 5’-175
speB_upstream-erm-speB_downstream-3’. The resulting PCR product was used 176
to transform S. pyogenes NZ131 to generate the speB mutant. The same 177
strategy was applied for other mutant construction. For pnpA and acpA mutant 178
construction, a promoterless erm fragment (generated by a primer pair Erm-F 179
(ptls)/Erm-R) was used to replace the pnpA or acpA gene so that the 180
downstream gene expression was not affected. 181
182
ΔcvfA mutant complementation. A shuttle vector, pDL278 (24), was used to 183
introduce cvfA gene to the ΔcvfA mutant. The cvfA gene was PCR amplified with 184
primer pairs cvfA_L(BamHI)/cvfA_R(HindIII). The PCR product was digested with 185
restriction enzymes BamHI and HindIII (Promega), and was ligated to the 186
pDL278 vector that was similarly digested. The resulting plasmid, pDL278-cvfA, 187
was introduced into S. pyogenes ΔcvfA mutant via electroporation to generate 188
the ΔcvfA complement strain (ΔcvfA + pDL278::cvfA). 189
190
SpeB proteinase activity assay. The overnight cultures of S. pyogenes wild 191
type and its derivatives were stab inoculated on a C medium-based agar plate 192
on May 14, 2018 by guest
http://jb.asm.org/
Dow
nloaded from
Page 10
10
containing 1.5% skim milk. The plate was incubated at 37°C for 18 hours in a 193
candle jar. Caseinolytic activity results in a translucent zone around the stab site 194
(10). 195
196
197
on May 14, 2018 by guest
http://jb.asm.org/
Dow
nloaded from
Page 11
11
Results 198 199
Increased speB mRNA abundance during exponential growth. Previous 200
studies demonstrated growth-dependent production of SpeB in S. pyogenes, with 201
the highest proteinase activity detected in late exponential and stationary phases 202
(11, 28). Furthermore, a novel peptide-mediated regulatory system has recently 203
been shown to be involved in expression control of speB in late exponential and 204
early stationary phase (43). In this study, we examined the speB transcript 205
abundance during bacterial growth with qRT-PCR. An overnight culture of S. 206
pyogenes was diluted 1:100 in C medium, incubated at 37°C, and bacterial 207
samples were withdrawn at different growth phases (Fig. 1A). The speB 208
transcript level was extremely low in early exponential phase (A600nm = 0.15). It 209
increased by 50-fold from early to mid exponential phase (A600nm = 0.3), and 210
increased by 340-fold from mid to late exponential phase (A600nm = 0.6). The 211
overall speB transcript abundance increased by over 10,000-fold from early to 212
late exponential phase. After the cells entered the stationary phase, the speB 213
transcript abundance slightly decreased but was still considerably higher than in 214
the early and mid exponential phases. We also examined the transcription profile 215
of the ropB gene, which encodes a positive transcriptional regulator of speB (33). 216
The ropB gene was expressed at a constant level during exponential growth, and 217
diminished quickly upon entering stationary phase (Fig. 1A). These observations 218
suggested that speB and ropB transcripts were regulated by distinct 219
mechanisms. 220
on May 14, 2018 by guest
http://jb.asm.org/
Dow
nloaded from
Page 12
12
Our data showed a rapid increase of speB transcript abundance when cells 221
grew from early to late exponential phase. Correspondingly, one would expect a 222
rapid decrease of speB transcript abundance when cells are diluted to simulate a 223
low cell density environment. To confirm this hypothesis we grew S. pyogenes 224
cells until late exponential phase, and diluted the culture 1:20 in fresh pre-225
warmed medium so that the cells re-entered the early exponential phase. qRT-226
PCR analysis detected a rapid decrease of the speB transcript level immediately 227
after dilution (Fig. 1B). The most significant change occurred within the first 30 228
min, when the total amount of speB transcripts decreased by almost 1,000 fold. 229
After that the speB transcript level continued to decrease and became 10,000 230
fold less than that of the inoculum after 1.5 hours. In contrast, the ropB transcript 231
remained constant throughout the incubation. These data clearly show that S. 232
pyogenes can accumulate or destroy specifically a large amount of speB 233
transcripts over a short period of time and suggests that speB and ropB mRNA 234
degradation is regulated by distinct mechanisms. 235
236
Increased speB mRNA stability during growth. We initially hypothesized 237
that the speB mRNA stability might increase during exponential growth, which 238
might contribute to the rapid accumulation of speB mRNA from early to late 239
exponential phase. To test this hypothesis, speB mRNA stability was measured 240
in different growth phases with Northern blot analyses and qRT-PCR. 241
Northern blot analysis is a standard method for mRNA stability assays (3). It 242
allows detection of differently sized transcripts from the same gene. Since each 243
on May 14, 2018 by guest
http://jb.asm.org/
Dow
nloaded from
Page 13
13
speB and ropB mRNA species have two transcripts of different sizes (33), 244
Northern blot analysis makes it possible to measure the decay rate of each 245
individual transcript. However, signal detection and quantification becomes 246
difficult when the target mRNA level is very low. To circumvent the problem of 247
low mRNA abundance, qRT-PCR detection was employed because of its high 248
sensitivity, broad dynamic range and direct quantitative measurement, and 249
because several studies have confirmed the validity of qRT-PCR in mRNA decay 250
analysis (25, 34, 42). In this study, qRT-PCR primers were designed to target the 251
protein-encoding regions of speB and ropB genes so that the results reflected the 252
overall mRNA decay rate of each gene (Table 2). To verify qRT-PCR results for 253
mRNA decay measurements, Northern blot analysis was performed to determine 254
the decay rate of each transcript when target mRNA was sufficiently abundant for 255
reliable detection. 256
The speB mRNA decay rates appeared to follow first order kinetics with 257
corresponding exponential regression coefficients (R2) greater than 0.95 under 258
all prevailing growth conditions. qRT-PCR analysis revealed an increasing trend 259
of speB mRNA stability along the growth curve (Fig. 2A and Table 3). We could 260
not directly measure the speB mRNA stability in the early exponential phase 261
(A600nm = 0.15) because the transcript abundance was extremely low in that 262
condition (Fig. 1). An alternative strategy was used instead. Fifty milliliters of S. 263
pyogenes culture were grown until early stationary phase when speB was highly 264
expressed, and cells were collected by centrifugation. The cell pellet was 265
immediately suspended in 250 ml pre-warmed C medium (1:5 dilution) to 266
on May 14, 2018 by guest
http://jb.asm.org/
Dow
nloaded from
Page 14
14
simulate the early exponential phase. qRT-PCR results showed that speB mRNA 267
degraded rapidly under this condition (Fig. 2A). The speB mRNA stability 268
gradually increased as the cells grew into mid and late exponential phases, and 269
speB mRNA became very stable at early stationary phase (Fig. 2A). These 270
findings were confirmed by Northern blot analysis (Fig. 2B-D). speB mRNA has 271
two transcript sizes, 2.3 kb and 1.7 kb, with the short transcript (1.7 kb) being the 272
dominant form. The short transcript was also more stable than the long transcript 273
(2.3 kb) in a given growth phase. Nevertheless, both transcripts displayed an 274
increasing trend of stability when cells grew from early exponential to stationary 275
phase. 276
In contrast to speB, the ropB mRNA stability remained unchanged during 277
exponential growth, and increased dramatically when cells entered the stationary 278
phase (Fig. 3 and Table 4). The ropB mRNA also has two sizes of transcripts, 1.1 279
kb and 1.0 kb. The two ropB transcripts were similar in abundance at the 280
beginning of the decay assay (t = 0 min), though the long transcript (1.1 kb) 281
diminished faster than the short transcript (1.0 kb), indicating that the short 282
transcript was more stable. 283
284
Effect of environmental pH on speB mRNA stability. Two environmental 285
factors, pH and nutrient availability, change continuously when bacteria actively 286
grow in a batch culture. Because C medium has a weak buffering capacity, the 287
culture pH decreased from pH 7.4 to pH 6.2 as S. pyogenes cells grew from early 288
to late exponential phase, and remained constant at pH 6.2 after the cells 289
on May 14, 2018 by guest
http://jb.asm.org/
Dow
nloaded from
Page 15
15
entered stationary phase (data not shown). C medium is used in this study 290
because it supports a high expression of SpeB (30). The medium is rich in 291
peptides and poor in carbohydrate (30). We assumed that the availability of an 292
energy source was the limiting factor of bacterial growth, the depletion of which 293
led to entry into the stationary phase. This assumption was supported by the fact 294
that the bacterial culture in early stationary phase resumed growth immediately 295
after the addition of exogenous glucose (data not shown). We hypothesized that 296
either environmental pH or energy source availability, or both, affected speB 297
mRNA stability. 298
To test this hypothesis, S. pyogenes cells were grown until late exponential 299
phase, when speB mRNA was highly abundant. The culture was then divided 300
into four aliquots. Each aliquot was adjusted with 2 M Bis Tris buffer (the final 301
concentration of Bis Tris buffer is 0.1 M) to pH 7.5, pH 7.0, pH 6.5, or pH 6.0, and 302
was supplemented with or without 1% glucose. Rifampicin was added 303
simultaneously with Bis Tris buffer and glucose to inhibit new mRNA synthesis. 304
qRT-PCR results showed that the adjusted culture pH had an instant effect on 305
speB mRNA stability (Fig. 4A-B and Table 5). The speB mRNA degraded rapidly 306
at neutral pH, and became more stable when the culture medium was gradually 307
acidified. This pattern was observed in both cultures supplemented or not 308
supplemented with glucose. At a given environmental pH, the supplementation of 309
glucose did not obviously change speB mRNA stability. We conclude that 310
environmental pH, rather than energy source availability, played a major role in 311
regulating speB mRNA stability. This finding can at least partially explain the 312
on May 14, 2018 by guest
http://jb.asm.org/
Dow
nloaded from
Page 16
16
increased SpeB activity measured under low pH as shown before (28). We also 313
measured ropB mRNA stability in different environmental conditions. qRT-PCR 314
results showed that ropB mRNA degraded at a constant rate under all pH 315
conditions. The presence of glucose led to a slight increase of ropB mRNA 316
stability, though the change was too small to be considered biologically 317
significant (Fig. 4C-D and Table 5). These findings indicated that in contrast to 318
speB mRNA variations in stability, ropB mRNA stability was not affected by 319
environmental pH or energy source availability. 320
321
Search for RNase(s) involved in speB mRNA degradation. The 322
degradation of RNA molecules is a tightly controlled process involving different 323
types of RNases. The genome of S. pyogene NZ131 encodes at least 11 324
RNases (32), four exoribonucleases and nine endoribonucleases (RNases J1 325
and J2 have both exo- and endoribonulease activities). In this study, the RNases 326
polynucleotide phosphorylase (PNPase, encoded by pnpA), RNase III (encoded 327
by acpA), and RNase Y (encoded by cvfA) were chosen, and investigated for 328
their possible roles in speB mRNA degradation. RNase J1 and J2 are essential 329
and cannot be inactivated (9). 330
PNPase is an exoribonuclease that catalyzes the 3’-5’ phosphorolytic 331
degradation of RNA (6). PNPase in S. pyogenes is involved in the decay of at 332
least two gene transcripts, sagA and sda (7). RNase III is an endoribonuclease 333
that specifically cleaves double-stranded RNAs (37). Its function in S. pyogenes 334
remains to be determined. RNase Y from Bacillus subtilis is an endoribonuclease 335
on May 14, 2018 by guest
http://jb.asm.org/
Dow
nloaded from
Page 17
17
that is the functional equivalent of RNase E from Escherichia coli (26, 27). Its 336
ortholog in S. pyogenes (CvfA) is involved in the expression of multiple virulence 337
factors, including SpeB (20). 338
We constructed isogenic null mutants of PNPase (ΔpnpA), RNase III (ΔacpA), 339
and RNase Y (ΔcvfA) by allelic exchange. All RNase mutants were viable, 340
suggesting that these RNases were dispensable for the organism. All three 341
mutants formed a translucent zone on a skim milk plate (Fig. 5A), indicating that 342
functionally active SpeB proteinase was produced and secreted in these strains. 343
This observation is at variance with a previous study that the proteinase activity 344
was undetected in the cvfA mutant (20). We attribute this variance to the different 345
serotype strains used in the two studies (NZ131, M49 vs HSC5, M5). Northern 346
blot analysis was then carried out to determine speB mRNA abundance in these 347
strains at early stationary phase. No hybridization signal was detected in ΔspeB 348
mutant, confirming that the speB probe was highly specific (Fig. 5B). The wild 349
type, PNPase (ΔpnpA) and RNase III (ΔacpA) mutants produced similar amounts 350
of speB mRNA, with the short transcript being more abundant than the long 351
transcript (Fig. 5B). These two RNase mutants were not further studied. In 352
contrast, the RNase Y mutant (ΔcvfA) produced considerably less speB mRNA 353
than the other strains. The hybridization signal was only detectable when the 354
sample was concentrated (Fig. 5B). One striking feature was that the relative 355
abundance of two speB transcripts were inverted in the ΔcvfA mutant, with the 356
long transcript being much more abundant than the short transcript. To rule out 357
possible polar effect or unexpected mutation that may occur during mutant 358
on May 14, 2018 by guest
http://jb.asm.org/
Dow
nloaded from
Page 18
18
construction, the cvfA gene was re-introduced into the ΔcvfA mutant on a shuttle 359
vector, pDL278. Northern blot analysis showed that the speB transcript pattern 360
was restored to the wild type level after the cvfA gene complementation (Fig. 5B), 361
which confirmed that the altered speB transcript pattern was due to the cvfA 362
gene deletion. 363
364
Role of RNase Y in speB mRNA degradation. The speB mRNA abundance 365
in ΔcvfA strain was further examined. qRT-PCR results showed that, unlike the 366
wild-type strain, the speB mRNA level in the ΔcvfA mutant was very low during 367
exponential growth, and increased rapidly only immediately before the cells 368
entered stationary phase (data not shown). This expression pattern made it 369
technically difficult to collect ΔcvfA samples for an mRNA decay assay, because 370
the assay required samples expressing high levels of speB mRNA but were still 371
exponentially growing. To solve this problem 1% glucose was added to bacterial 372
cultures in the early stationary phase (ES + 1% glucose) so that the cells ‘re-373
entered’ the exponential phase. A similar speB mRNA decay rate under this 374
condition (ES + 1% glucose) and in late exponential phase (compare Fig. 6A and 375
Fig. 2C) in the wild type strain was observed. Cells treated this way (ES + 1% 376
glucose) should behave similarly to those in late exponential phase. 377
Subsequently speB mRNA decay rates in the wild type and ΔcvfA mutant 378
were compared. Cells were grown until early exponential phase (30 min after 379
reaching the maximal A600nm), and supplemented with 1% glucose. The culture 380
was either unbuffered (pH 6.2), or buffered to pH 7.5 or 6.0 with Bis Tris (0.1 M 381
on May 14, 2018 by guest
http://jb.asm.org/
Dow
nloaded from
Page 19
19
final concentration) and mRNA decay was determined immediately after 382
modification. The ΔcvfA mutant showed a five fold reduced abundance of speB 383
mRNA compared to the wild type. To compensate for the low abundance of 384
speB mRNA, the total RNA amount was therefore increased five-fold and used in 385
the Northern blot assay. Again we observed an altered speB transcript pattern in 386
the ΔcvfA strain, with the long transcript being the most dominant form under all 387
three conditions (Figure 6). We also observed that, (i) in a given strain (wild type 388
or ΔcvfA) under a given environmental condition (unbuffered, pH 7.5, or pH 6.0), 389
the speB short transcript was always more stable than the long transcript; (ii) in a 390
given strain, both short and long transcripts were more stable at low pH 391
(unbuffered, pH 6.0) than at high pH (pH 7.5); (iii) under a given environmental 392
condition, RNase Y contributes to the stability of the speB short transcript, but not 393
long transcript (Fig. 6 and Table 6). Based on these observations we conclude 394
that RNase Y is not responsible for pH-dependent regulation of speB mRNA 395
degradation. Though, it apparently plays a general role in determining the 396
stability of the speB short transcript. 397
398
399
on May 14, 2018 by guest
http://jb.asm.org/
Dow
nloaded from
Page 20
20
Discussion 400 401
The degradation of mRNA appears to play an important regulatory role in the 402
actual availability of several virulence factors in GAS (9). Furthermore, it has 403
been suggested that growth phase dependent regulation of GAS gene 404
expression is predominantly regulated at the level of mRNA stability (9, 20). In 405
the present study we used the important GAS virulence gene speB to further 406
dissect post-transcriptional regulation in S. pyogenes. Using Northern-blot 407
analysis and qRT-PCR to detect the mRNA levels of speB, we measured speB 408
mRNA abundance and decay under several environmental conditions. The main 409
result of mRNA abundance and decay measurements suggests that the apparent 410
increase in speB mRNA abundance is the result of increased speB mRNA 411
stability in the late logarithmic and early stationary phase. The smooth 412
accumulation processes of speB mRNA abundance suggest that speB gene 413
expression is controlled by the same regulatory mechanism from early to late 414
exponential phase. 415
The rapid accelerating degradation rate of speB mRNA implies the existence 416
of a strong mRNA degradation mechanism in this organism. A search for putative 417
RNases in the genome of S. pyogenes NZ131 revealed 11 candidates (32). Our 418
previous microarray data showed that most RNase-encoding genes were actively 419
transcribed in both exponential and early stationary phases (data not shown) 420
(23). Based on these findings, we propose that the mRNA degradation 421
mechanism is highly active throughout exponential growth. The accumulation of 422
speB mRNA is because more transcripts are synthesized than can be serviced 423
on May 14, 2018 by guest
http://jb.asm.org/
Dow
nloaded from
Page 21
21
by the degradasome. A highly active degradation mechanism would predict that 424
disruption of speB mRNA synthesis would result in a quick degradation of the 425
accumulated mRNA. This was observed in our dilution experiment and during the 426
challenge experiment with different pH. We observed an immediate increase in 427
speB mRNA degradation during the shift to pH 7.5, demonstrating the presence 428
of an active degradosome and excluding new synthesis since rifampicin was 429
administered simultaneously. If speB mRNA was simply stabilized by a stopped 430
degradation after entry into stationary phase, it is unlikely that the message 431
would be so rapidly degraded upon the dilution of stationary phase cells. Our 432
data also suggest a pH dependent regulation of the speB specific degradosome. 433
What could be the evolutionary rationale for not simply stopping mRNA 434
degradation entirely to accumulate speB transcripts during the exponential 435
growth? A highly active degradation process at any given time means that the 436
cell can eliminate the speB transcript and therefore SpeB production by 437
preventing its translation. Because SpeB is a potent extracellular proteinase, 438
control of speB mRNA abundance by its synthesis and degradation rates may 439
enable S. pyogenes to respond to environmental changes in a more time-efficient 440
manner. One example shown in this study is the dilution experiment, in which the 441
speB mRNA abundance decreases by 1,000 fold within 30 min after the cells 442
from late exponential phase are diluted in fresh medium (Fig. 1B). This drastic 443
change can occur only when (i) the synthesis of new speB mRNA is completely 444
stopped and (ii) the existing mRNA molecules are rapidly degraded. 445
on May 14, 2018 by guest
http://jb.asm.org/
Dow
nloaded from
Page 22
22
One major environmental signal influencing speB mRNA stability and SpeB 446
abundance is the culture pH (Fig.4) (28). The speB transcript is more stable at a 447
low culture pH than neutral pH. This explains why the speB mRNA stability 448
increased during exponential growth, when the culture medium was gradually 449
acidified by metabolic products (lactic acid, etc.). In contrast to speB, ropB mRNA 450
stability is not affected by environmental pH. This observation further supports 451
the notion that the pH-dependent regulation of mRNA stability is not a universal 452
phenomenon, but seems to be gene specific, since ropB mRNA abundance 453
remains constant during exponential growth with a short half-life. The constitutive 454
expression of the ropB gene suggests a balanced synthesis and degradation of 455
ropB mRNA. This observation is at variance with a previous study (33), in which 456
the ropB gene was expressed in the late stage of exponential growth. We 457
consider that the variance may be due to the different serotype strains used in 458
the two studies (M14 and M49). However, in the same study (33), the authors 459
also demonstrated that an ectopic expression of ropB (i.e. ropB was expressed in 460
the early stage of exponential growth) had no influence on the pattern of speB 461
gene expression. This result is consistent with our study, since we did not detect 462
any correlation between speB mRNA abundance and ropB expression. 463
RNase Y (also known as CvfA), is a recently identified endoribonuclease that 464
controls SpeB abundance in S. pyogenes (20). RNase Y seems to be part of the 465
RNA degradosome in Gram-positive bacteria, which also includes the metabolic 466
enzyme enolase and phosphofructokinase. We found in the present study that 467
the speB mRNA abundance was obviously reduced in the RNase Y mutant, 468
on May 14, 2018 by guest
http://jb.asm.org/
Dow
nloaded from
Page 23
23
confirming previous findings (20). We also describe for the first time that the 469
mutation of RNase Y led to an altered speB transcript pattern. The long transcript, 470
but not the short transcript, was the dominant form of speB mRNA species. The 471
exact mechanism of how S. pyogenes produces two sizes of speB transcripts is 472
still unclear. Our findings favor a hypothesis that the short transcript might be a 473
processed product from the primary transcript through endonucleolytic cleavage, 474
and that RNase Y might be a major enzyme responsible for the cleavage. Since 475
the speB short transcript is significantly more stable than the long transcript, the 476
conversion of speB mRNA from long to short transcript may increase the overall 477
speB mRNA stability, which in turn promotes the protein production. We are 478
currently testing this hypothesis. 479
480 481 Acknowledgement: 482 483 J.K. was supported by NIH/NIDCR grant 4R00DE018400. The authors would like 484
to thank Dr. Jimmy Ballard and Dr. Justin Merritt (OUHSC; Microbiology & 485
Immunology) for helpful discussions. 486
487
on May 14, 2018 by guest
http://jb.asm.org/
Dow
nloaded from
Page 24
24
Tables 488 Table 1. Bacterial strains and plasmids used in this study 489 Strains Characteristics Reference or source Bacterial strains S. pyogenes
NZ131 Wild type (32) ΔspeB speB mutant strain This study ΔpnpA pnpA mutant strain This study ΔacpA acpA mutant strain This study ΔcvfA cvfA mutant strain This study ΔcvfA+pDL278::cvfA ΔcvfA pDL278::cvfA This study
E. coli DH5α cloning strain New England Biolabs
Plasmid pDL278 Shuttle vector (24) pDL278::cvfA pDL278 encoding cvfA This study 490 491 Table 2. Primers used in this study. 492 Primer Sequence Primers for qRT-PCR speB_1l gtggagtctctgacggcttc speB_1r tgcctacaacagcactttgg ropB_1l tgccttggtcaaggtgtt ropB_1r gcacagtctcatagtgactcca 16S rRNA_1l aagcaacgcgaagaacctta 16S rRNA_1r gtctcgctagagtgcccaac Primers for mutant construction Erm-L ccgggcccaaaatttgtttgat Erm-R agtcggcagcgactcatagaat Erm-F (ptls) gaaggagtgattacatgaacaaaaa cvfA_P1 ggacgctcaaaaggttctca cvfA_P2(erm) caaatcaaacaaattttgggcccggccaatgagggcagaaacaat cvfA_P3(erm) ataattctatgagtcgctgccgactgagcggttgattatgccaag cvfA_P4 agctgaaggatctgggtgaa speB_P1 ggtcaatagccagatgcgata speB_P2(erm) caaatcaaacaaattttgggcccggtgatcggcaaatactgggtta speB_P3(erm) ataattctatgagtcgctgccgactcgcactaaacccttcagctc speB_P4 tcgagacgagtttggtgttg pnpA_P1 caggtttggtcacaggcttt pnpA_P2(erm_ptls) tttttgttcatgtaatcactccttcggtttccctgcaaatgttgt pnpA_P3(erm) ataattctatgagtcgctgccgactcccaccaaaaccagagaaaa pnpA_P4 tgaagactccaggagcgatt acpA_P1 agccatgacgctattgatcc acpA_P2(erm_ptls) tttttgttcatgtaatcactccttcaggagacgatgctcgttagc
on May 14, 2018 by guest
http://jb.asm.org/
Dow
nloaded from
Page 25
25
acpA_P3(erm) ataattctatgagtcgctgccgactcccttgcccaacttagtgag acpA_P4 tctctgcttcttggccactt cvfA_L(BamHI) aaaaaaggatcccatcatggacgacttgctaca cvfA_R(HindIII) aaaaaaaagcttgaacattttcaaaggcaagtca Primers for DIG-labeled probe synthesis speB_L (probe) ctatcaaagcaggtgcacga speB_R (probe) taatttgagcagttgcagtagca ropB_L (probe) ggaaattggtgaaaccgttg ropB_R (probe) aaacatatgatggatcgttttgc
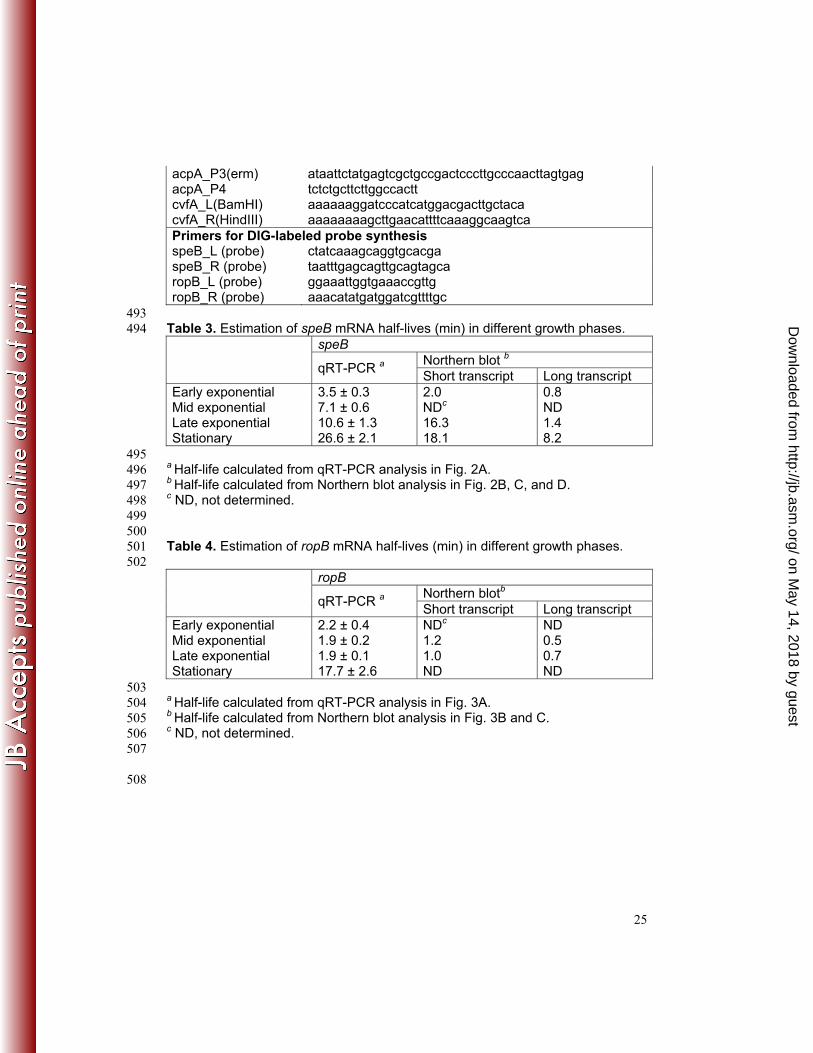
493 Table 3. Estimation of speB mRNA half-lives (min) in different growth phases. 494
speB
qRT-PCR a Northern blot b Short transcript Long transcript
Early exponential 3.5 ± 0.3 2.0 0.8 Mid exponential 7.1 ± 0.6 NDc ND Late exponential 10.6 ± 1.3 16.3 1.4 Stationary 26.6 ± 2.1 18.1 8.2
495 a Half-life calculated from qRT-PCR analysis in Fig. 2A. 496 b Half-life calculated from Northern blot analysis in Fig. 2B, C, and D. 497 c ND, not determined. 498 499 500 Table 4. Estimation of ropB mRNA half-lives (min) in different growth phases. 501 502
ropB
qRT-PCR a Northern blotb Short transcript Long transcript
Early exponential 2.2 ± 0.4 NDc ND Mid exponential 1.9 ± 0.2 1.2 0.5 Late exponential 1.9 ± 0.1 1.0 0.7 Stationary 17.7 ± 2.6 ND ND
503 a Half-life calculated from qRT-PCR analysis in Fig. 3A. 504 b Half-life calculated from Northern blot analysis in Fig. 3B and C. 505 c ND, not determined. 506
507
508
on May 14, 2018 by guest
http://jb.asm.org/
Dow
nloaded from
Page 26
26
Table 5. Estimation of speB and ropB mRNA half-lives (min) under different pH 509 conditions based on qRT-PCR analysis in Fig. 4. 510 511 speB ropB No glucose With glucose No glucose With glucose pH 7.5 3.3 ± 0.2 2.8 ± 0.5 1.5 ± 0.1 2.0 ± 0.5 pH 7.0 3.7 ±0.5 3.6 ± 0.8 1.5 ± 0.0 1.8 ± 0.0 pH 6.5 5.1 ± 0.5 5.2 ± 0.1 1.6 ± 0.1 1.7 ± 0.3 pH 6.0 6.1 ± 0.2 8.4 ± 2.0 1.6 ± 0.1 2.0 ± 0.1
512
Table 6. Estimation of speB transcript half-lives (min) based on Northern blot 513 analysis in Fig. 6. 514 WT ΔcvfA
short transcript long transcript short transcript long transcript unbuffered 16.9 3.5 27.0 3.7 pH 7.5 3.3 1.7 5.4 1.6 pH 6.0 10.0 2.8 14.5 3.4
515
516
on May 14, 2018 by guest
http://jb.asm.org/
Dow
nloaded from
Page 27
27
Figures 517
518
Figure 1. Change of speB and ropB transcript abundance during growth. 519
S. pyogenes cells were continuously grown in C-medium from early exponential 520
phase to early stationary phase (A). An aliquot of cell culture from the late 521
exponential phase was diluted 1:20 in fresh C-medium and incubated for two 522
hours (B). qRT-PCR analysis was used to determine the speB and ropB 523
transcript abundance at different time points. Data were presented as mean ± 524
standard deviation of three (A) or two (B) independent experiments. 525
526
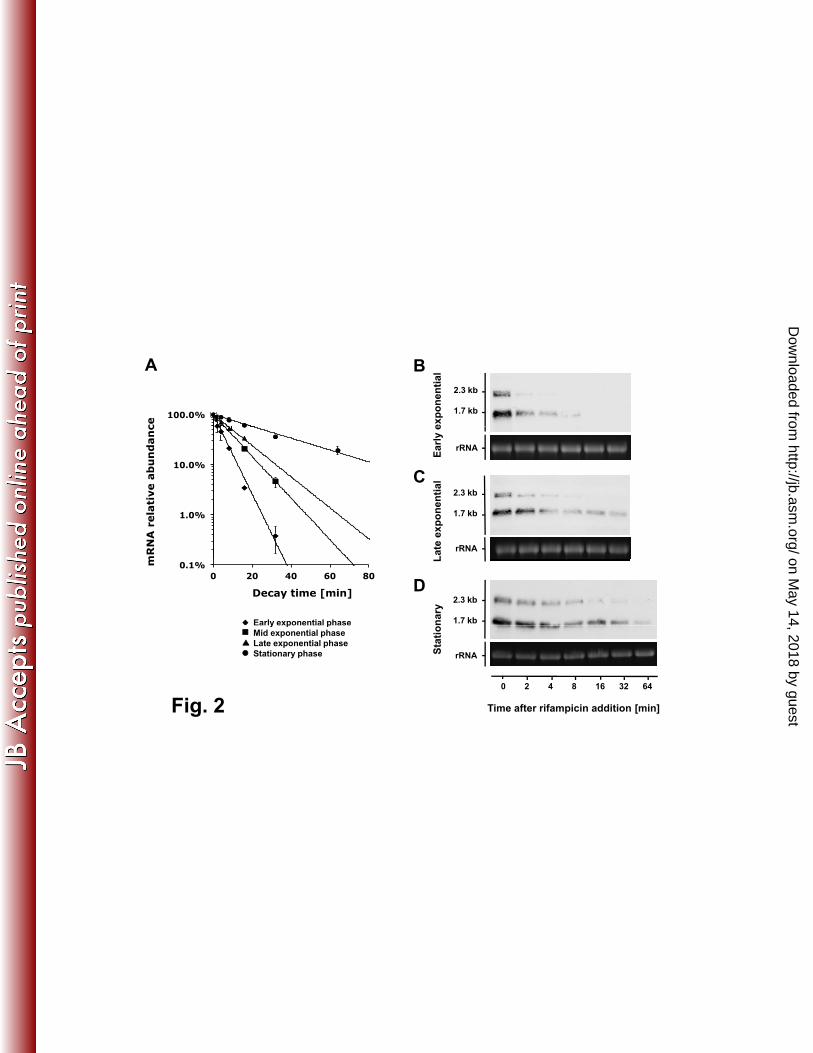
Figure 2. Growth phase-dependent speB mRNA decay. Decay rates of speB 527
mRNA in different growth phases were determined by qRT-PCR (A) and 528
Northern blot analyses (B, C, and D). Note that to analyze speB mRNA decay in 529
early-exponential phase, we used stationary culture that was diluted in fresh 530
medium to mimic the condition (see text for detail). qRT-PCR data were 531
presented as mean ± standard deviation of two independent experiments. For 532
Northern blot analysis, 23s rRNA was used as loading control. One microgram of 533
total RNA was loaded per lane. 534
535
Figure 3. Growth phase-dependent ropB mRNA decay. Decay rates of ropB 536
mRNA in different growth phases were determined by qRT-PCR (A) and 537
Northern blot analyses (B and C). qRT-PCR data were presented as mean ± 538
standard deviation of two independent experiments. For Northern blot analysis, 539
on May 14, 2018 by guest
http://jb.asm.org/
Dow
nloaded from
Page 28
28
23s rRNA was used as loading control. Five micrograms of total RNA was loaded 540
per lane. 541
542
Figure 4. speB and ropB mRNA decay under different environmental 543
conditions. S. pyogenes NZ131 was grown to late exponential phase (A600nm = 544
0.55) and divided into four aliquots. The culture pH was artificially adjusted from 545
pH 7.5 to pH 6.0 with Bis Tris buffer (0.1 M final concentration). One percent 546
(wt/vol) glucose was added to the culture as indicated. The messenger RNA 547
decay assay was carried out immediately after the medium modification. qRT-548
PCR was used to determine speB (A and B) and ropB (C and D) mRNA decay 549
rates. Data were presented as the average ± standard deviation of two 550
independent experiments. 551
552
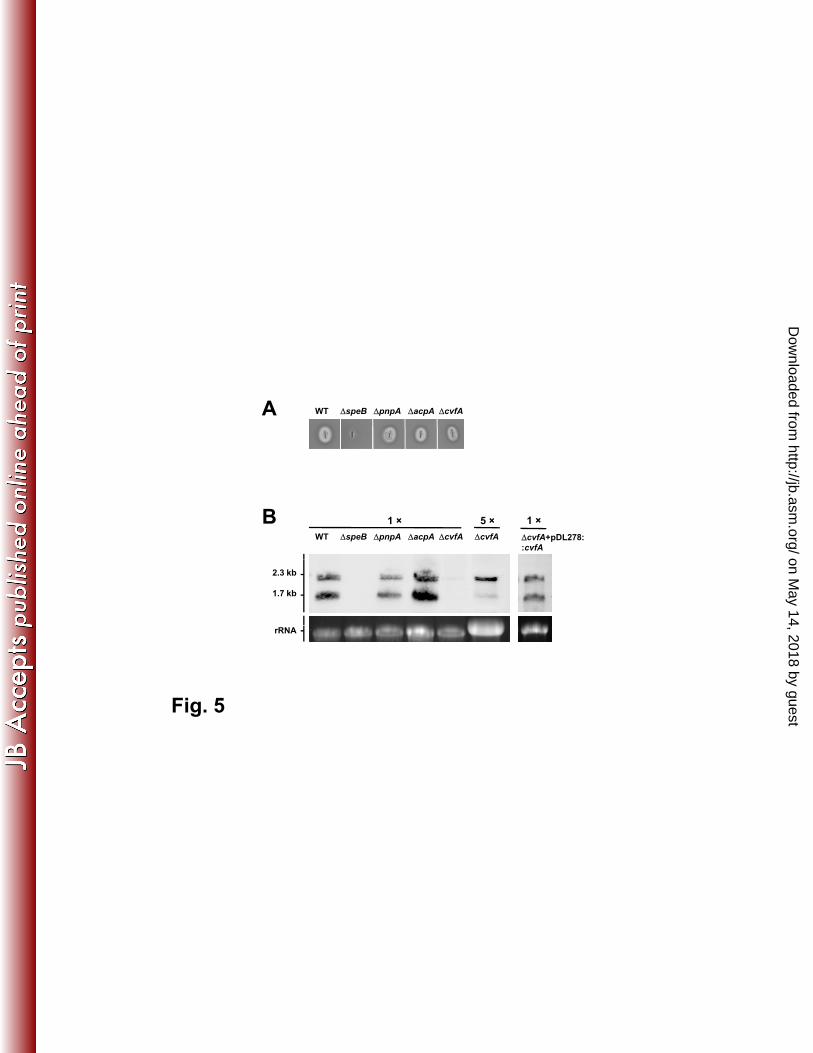
Figure 5. SpeB expression in RNase mutants and ∆cvfA complementation 553
strain. SpeB proteinase activities in RNase mutants were visualized on a 1.5% 554
skim milk agar plate. Wild type (WT) and ∆speB mutant were included as positive 555
and negative controls (A). The transcript abundance of speB mRNA in each 556
strain at early stationary phase was determined by Northern blot analysis (B). 557
One microgram of total RNA was loaded per lane for each strain except for 558
∆cvfA, in which 5 ug of total RNA was used so that the hybridization signal was 559
comparable to the other strains. 560
561
on May 14, 2018 by guest
http://jb.asm.org/
Dow
nloaded from
Page 29
29
Figure 6. speB mRNA decay in wild type and ∆cvfA strains under different 562
pH conditions. Bacterial strains were grown until early stationary phase and 1% 563
glucose was added to the culture so that the cells resumed growth. The culture 564
pH was either unbuffered (pH 6.2) (A), 7.5 (B), or pH 6.0 (C). Rifampicin was 565
added immediately after pH modification. For Northern blot analysis, 23s rRNA 566
was used as loading control. One microgram (wild type) or 5 µg (∆cvfA) of total 567
RNA was loaded per lane. 568
569
570
on May 14, 2018 by guest
http://jb.asm.org/
Dow
nloaded from
Page 30
30
References 571
572 1. Abramoff, M. D., Magelhaes, P.J., Ram, S.J. 2004. Image Processing with 573
ImageJ. Biophotonics International 11:36-42. 574 2. Ajdic, D., and V. T. Pham. 2007. Global transcriptional analysis of 575
Streptococcus mutans sugar transporters using microarrays. J Bacteriol 189:5049-576 5059. 577
3. Alwine, J. C., D. J. Kemp, and G. R. Stark. 1977. Method for detection of 578 specific RNAs in agarose gels by transfer to diazobenzyloxymethyl-paper and 579 hybridization with DNA probes. Proc Natl Acad Sci U S A 74:5350-5354. 580
4. Anbalagan, S., W. M. McShan, P. M. Dunman, and M. S. Chaussee. 2011. 581 Identification of Rgg binding sites in the Streptococcus pyogenes chromosome. J 582 Bacteriol 193:4933-4942. 583
5. Anderson, K. L., and P. M. Dunman. 2009. Messenger RNA Turnover 584 Processes in Escherichia coli, Bacillus subtilis, and Emerging Studies in 585 Staphylococcus aureus. Int J Microbiol 2009:525491. 586
6. Andrade, J. M., V. Pobre, I. J. Silva, S. Domingues, and C. M. Arraiano. 587 2009. The role of 3'-5' exoribonucleases in RNA degradation. Prog Mol Biol 588 Transl Sci 85:187-229. 589
7. Barnett, T. C., J. V. Bugrysheva, and J. R. Scott. 2007. Role of mRNA 590 stability in growth phase regulation of gene expression in the group A 591 streptococcus. J Bacteriol 189:1866-1873. 592
8. Berge, A., and L. Bjorck. 1995. Streptococcal cysteine proteinase releases 593 biologically active fragments of streptococcal surface proteins. J Biol Chem 594 270:9862-9867. 595
9. Bugrysheva, J. V., and J. R. Scott. 2010. The ribonucleases J1 and J2 are 596 essential for growth and have independent roles in mRNA decay in Streptococcus 597 pyogenes. Mol Microbiol 75:731-743. 598
10. Chaussee, M. S., D. Ajdic, and J. J. Ferretti. 1999. The rgg gene of 599 Streptococcus pyogenes NZ131 positively influences extracellular SpeB 600 production. Infect Immun 67:1715-1722. 601
11. Chaussee, M. S., E. R. Phillips, and J. J. Ferretti. 1997. Temporal production 602 of streptococcal erythrogenic toxin B (streptococcal cysteine proteinase) in 603 response to nutrient depletion. Infect Immun 65:1956-1959. 604
12. Cohen, J. O. 1969. Effect of culture medium composition and pH on the 605 production of M protein and proteinase by group A Streptococci. J Bacteriol 606 99:737-744. 607
13. Collin, M., and A. Olsen. 2001. Effect of SpeB and EndoS from Streptococcus 608 pyogenes on human immunoglobulins. Infect Immun 69:7187-7189. 609
14. Collin, M., and A. Olsen. 2001. EndoS, a novel secreted protein from 610 Streptococcus pyogenes with endoglycosidase activity on human IgG. Embo J 611 20:3046-3055. 612
15. Cunningham, M. W. 2000. Pathogenesis of group A streptococcal infections. 613 Clin Microbiol Rev 13:470-511. 614
on May 14, 2018 by guest
http://jb.asm.org/
Dow
nloaded from
Page 31
31
16. Elliott, S. D. 1945. A Proteolytic Enzyme Produced by Group a Streptococci with 615 Special Reference to Its Effect on the Type-Specific M Antigen. J Exp Med 616 81:573-592. 617
17. Graham, M. R., L. M. Smoot, C. A. Migliaccio, K. Virtaneva, D. E. 618 Sturdevant, S. F. Porcella, M. J. Federle, G. J. Adams, J. R. Scott, and J. M. 619 Musser. 2002. Virulence control in group A Streptococcus by a two-component 620 gene regulatory system: global expression profiling and in vivo infection 621 modeling. Proc Natl Acad Sci U S A 99:13855-13860. 622
18. Haake, S. K., S. C. Yoder, G. Attarian, and K. Podkaminer. 2000. Native 623 plasmids of Fusobacterium nucleatum: characterization and use in development 624 of genetic systems. J Bacteriol 182:1176-1180. 625
19. Johansson, L., P. Thulin, P. Sendi, E. Hertzen, A. Linder, P. Akesson, D. E. 626 Low, B. Agerberth, and A. Norrby-Teglund. 2008. Cathelicidin LL-37 in 627 severe Streptococcus pyogenes soft tissue infections in humans. Infect Immun 628 76:3399-3404. 629
20. Kang, S. O., M. G. Caparon, and K. H. Cho. 2010. Virulence gene regulation 630 by CvfA, a putative RNase: the CvfA-enolase complex in Streptococcus pyogenes 631 links nutritional stress, growth-phase control, and virulence gene expression. 632 Infect Immun 78:2754-2767. 633
21. Kapur, V., S. Topouzis, M. W. Majesky, L. L. Li, M. R. Hamrick, R. J. 634 Hamill, J. M. Patti, and J. M. Musser. 1993. A conserved Streptococcus 635 pyogenes extracellular cysteine protease cleaves human fibronectin and degrades 636 vitronectin. Microb Pathog 15:327-346. 637
22. Kietzman, C. C., and M. G. Caparon. 2010. CcpA and LacD.1 affect temporal 638 regulation of Streptococcus pyogenes virulence genes. Infect Immun 78:241-252. 639
23. Kreth, J., Z. Chen, J. Ferretti, and H. Malke. 2011. Counteractive Balancing of 640 Transcriptome Expression Involving CodY and CovRS in Streptococcus 641 pyogenes. J Bacteriol 193:4153-4165. 642
24. LeBlanc, D. J., L. N. Lee, and A. Abu-Al-Jaibat. 1992. Molecular, genetic, and 643 functional analysis of the basic replicon of pVA380-1, a plasmid of oral 644 streptococcal origin. Plasmid 28:130-145. 645
25. Leclerc, G. J., G. M. Leclerc, and J. C. Barredo. 2002. Real-time RT-PCR 646 analysis of mRNA decay: half-life of Beta-actin mRNA in human leukemia 647 CCRF-CEM and Nalm-6 cell lines. Cancer Cell Int 2:1. 648
26. Lehnik-Habrink, M., J. Newman, F. M. Rothe, A. S. Solovyova, C. 649 Rodrigues, C. Herzberg, F. M. Commichau, R. J. Lewis, and J. Stulke. 2011. 650 RNase Y in Bacillus subtilis: a natively disordered protein that is the functional 651 equivalent to RNase E from Escherichia coli. J Bacteriol 193:5431–5441. 652
27. Lehnik-Habrink, M., M. Schaffer, U. Mader, C. Diethmaier, C. Herzberg, 653 and J. Stulke. 2011. RNA processing in Bacillus subtilis: identification of targets 654 of the essential RNase Y. Molecular Microbiology 81:1459–1473. 655
28. Loughman, J. A., and M. Caparon. 2006. Regulation of SpeB in Streptococcus 656 pyogenes by pH and NaCl: a model for in vivo gene expression. J Bacteriol 657 188:399-408. 658
on May 14, 2018 by guest
http://jb.asm.org/
Dow
nloaded from
Page 32
32
29. Lyon, W. R., and M. G. Caparon. 2003. Trigger factor-mediated prolyl 659 isomerization influences maturation of the Streptococcus pyogenes cysteine 660 protease. J Bacteriol 185:3661-3667. 661
30. Lyon, W. R., C. M. Gibson, and M. G. Caparon. 1998. A role for trigger factor 662 and an rgg-like regulator in the transcription, secretion and processing of the 663 cysteine proteinase of Streptococcus pyogenes. Embo J 17:6263-6275. 664
31. Malke, H., K. Steiner, W. M. McShan, and J. J. Ferretti. 2006. Linking the 665 nutritional status of Streptococcus pyogenes to alteration of transcriptional gene 666 expression: the action of CodY and RelA. Int J Med Microbiol 296:259-275. 667
32. McShan, W. M., J. J. Ferretti, T. Karasawa, A. N. Suvorov, S. Lin, B. Qin, H. 668 Jia, S. Kenton, F. Najar, H. Wu, J. Scott, B. A. Roe, and D. J. Savic. 2008. 669 Genome sequence of a nephritogenic and highly transformable M49 strain of 670 Streptococcus pyogenes. J Bacteriol 190:7773-7785. 671
33. Neely, M. N., W. R. Lyon, D. L. Runft, and M. Caparon. 2003. Role of RopB 672 in growth phase expression of the SpeB cysteine protease of Streptococcus 673 pyogenes. J Bacteriol 185:5166-5174. 674
34. O'Driscoll, L., C. Daly, M. Saleh, and M. Clynes. 1993. The use of reverse 675 transcriptase-polymerase chain reaction (RT-PCR) to investigate specific gene 676 expression in multidrug-resistant cells. Cytotechnology 12:289-314. 677
35. Ogburn, C. A., T. N. Harris, and S. Harris. 1958. Extracellular antigens in 678 steady-state cultures of the hemolytic Streptococcus: production of proteinase at 679 low pH. J Bacteriol 76:142-151. 680
36. Olsen, R. J., and J. M. Musser. 2010. Molecular pathogenesis of necrotizing 681 fasciitis. Annu Rev Pathol 5:1-31. 682
37. Panganiban, A. T., and H. R. Whiteley. 1983. Purification and properties of a 683 new Bacillus subtilis RNA processing enzyme. Cleavage of phage SP82 mRNA 684 and Bacillus subtilis precursor rRNA. J Biol Chem 258:12487-12493. 685
38. Podbielski, A., M. Woischnik, B. Kreikemeyer, K. Bettenbrock, and B. A. 686 Buttaro. 1999. Cysteine protease SpeB expression in group A streptococci is 687 influenced by the nutritional environment but SpeB does not contribute to 688 obtaining essential nutrients. Med Microbiol Immunol 188:99-109. 689
39. Reid, S. D., M. S. Chaussee, C. D. Doern, M. A. Chaussee, A. G. 690 Montgomery, D. E. Sturdevant, and J. M. Musser. 2006. Inactivation of the 691 group A Streptococcus regulator srv results in chromosome wide reduction of 692 transcript levels, and changes in extracellular levels of Sic and SpeB. FEMS 693 Immunol Med Microbiol 48:283-292. 694
40. Ribardo, D. A., and K. S. McIver. 2006. Defining the Mga regulon: 695 Comparative transcriptome analysis reveals both direct and indirect regulation by 696 Mga in the group A streptococcus. Mol Microbiol 62:491-508. 697
41. Schmidtchen, A., I. M. Frick, and L. Bjorck. 2001. Dermatan sulphate is 698 released by proteinases of common pathogenic bacteria and inactivates 699 antibacterial alpha-defensin. Mol Microbiol 39:708-713. 700
42. Schmittgen, T. D., B. A. Zakrajsek, A. G. Mills, V. Gorn, M. J. Singer, and 701 M. W. Reed. 2000. Quantitative reverse transcription-polymerase chain reaction 702 to study mRNA decay: comparison of endpoint and real-time methods. Anal 703 Biochem 285:194-204. 704
on May 14, 2018 by guest
http://jb.asm.org/
Dow
nloaded from
Page 33
33
43. Shelburne III, S. A., R. J. Olsen, N. Makthal, N. G. Brown, P. 705 Sahasrabhojane, E. M. Watkins, T. Palzkill, J. M. Musser, and M. 706 Kumaraswami. 2011. An amino-terminal signal peptide of Vfr protein 707 negatively influences RopB-dependent SpeB expression and attenuates virulence 708 in Streptococcus pyogenes. Mol Microbiol 82:1481-1495. 709
44. Song, J. H., K. S. Ko, J. Y. Lee, J. Y. Baek, W. S. Oh, H. S. Yoon, J. Y. Jeong, 710 and J. Chun. 2005. Identification of essential genes in Streptococcus pneumoniae 711 by allelic replacement mutagenesis. Mol Cells 19:365-374. 712
45. Steiner, K., and H. Malke. 2002. Dual control of streptokinase and streptolysin S 713 production by the covRS and fasCAX two-component regulators in Streptococcus 714 dysgalactiae subsp. equisimilis. Infect Immun 70:3627-3636. 715
46. Terao, Y., Y. Mori, M. Yamaguchi, Y. Shimizu, K. Ooe, S. Hamada, and S. 716 Kawabata. 2008. Group A streptococcal cysteine protease degrades C3 (C3b) 717 and contributes to evasion of innate immunity. J Biol Chem 283:6253-6260. 718
47. von Pawel-Rammingen, U., and L. Bjorck. 2003. IdeS and SpeB: 719 immunoglobulin-degrading cysteine proteinases of Streptococcus pyogenes. Curr 720 Opin Microbiol 6:50-55. 721
722 723
on May 14, 2018 by guest
http://jb.asm.org/
Dow
nloaded from
Page 34
A B
1.E+00
0.6
0.7
speB ropB
1.0E+00 1
RN
A)
1.0E+00 1
A) speB ropB
A B
1.E-02
0 3
0.4
0.5
0.6 p p
1.0E-02
0.1
ce (r
elat
ive
to 1
6S rR
ity (A
600n
m) 1.0E-02
0.1
e (r
elat
ive
to 1
6S rR
NA
nsity
(A60
0nm
)
1.E-04
0.1
0.2
0.3 1.0E-04
Tran
scrip
t abu
ndan
c
Cel
l den
s
1.0E-04
Tran
scrip
t abu
ndan
ce
Cel
l den
1.E-06 0 0 60 120 180 240 300 360 420 480
Time [hour]
1.0E-06 0.01 0 1 2 3 4 5 6 7 8 9
T
Time [hour]
1.0E-06 0.01 0 0.5 1 1.5 2
T
Time [hour]
Fig. 1
on May 14, 2018 by guest
http://jb.asm.org/
Dow
nloaded from
Page 35
A B
100.0%
ce
A B
expo
nent
ial
2.3 kb
1.7 kb
10.0%
ve a
bu
nd
an
c
C
Early
etia
lrRNA
2 3 kb
1.0%
mR
NA
rela
tiv
Late
exp
onen
t 2.3 kb
1.7 kb
rRNA
0.1% 0 20 40 60 80
m
Decay time [min] D
Lna
ry
2.3 kb
1.7 kbEarly exponential phase
Stat
io
0 2 4 8 16 32 64
rRNA
y p pMid exponential phaseLate exponential phaseStationary phase
Fig. 2 Time after rifampicin addition [min]
on May 14, 2018 by guest
http://jb.asm.org/
Dow
nloaded from
Page 36
100.0%
e
A B
ial
10.0%
e a
bu
nd
an
ce
Mid
exp
onen
ti 1.1 kb1.0 kb
rRNA
1.0%
RN
A r
ela
tive
C
Mon
entia
l
rRNA
1.1 kb1.0 kb
Early exponential phaseMid exponential phaseLate exponential phaseStationary phase
0.1% 0 20 40 60 80
mR
Decay time [min] Late
exp
o
rRNA
0 2 4 8 16 32
Time after rifampicin addition [min]
Fig. 3
on May 14, 2018 by guest
http://jb.asm.org/
Dow
nloaded from
Page 37
A speB no glucose B speB with glucoseA speB, no glucose B speB, with glucose
10 0%
100.0%
bu
nd
an
ce
100.0%
un
dan
ce
1.0%
10.0% m
RN
A r
ela
tive a
bpH 7.5
pH 7.0
pH 6.5
pH 6.0 1.0%
10.0%
RN
A r
ela
tive a
bu
pH 7.5
pH 7.0
pH 6.5
pH 6.0
C ropB, no glucose D ropB, with glucose
0.1% 0 5 10 15 20
m
Decay time [min]
0.1% 0 5 10 15 20 m
R
Decay time [min]
10.0%
100.0%
ive a
bu
nd
an
ce
pH 7.5
10.0%
100.0%
ve a
bu
nd
an
ce
pH 7.5
0.1%
1.0%
0 5 10 15 20
mR
NA
rela
ti
Decay time [min]
pH 7.5
pH 7.0
pH 6.5
pH 6.0
0.1%
1.0%
0 5 10 15 20 mR
NA
rela
tiv
Decay time [min]
pH 7.5
pH 7.0
pH 6.5
pH 6.0
ecay t e [ ]
Fig. 4
on May 14, 2018 by guest
http://jb.asm.org/
Dow
nloaded from
Page 38
A WT ΔspeB ΔpnpA ΔacpA ΔcvfA
BWT ΔspeB ΔpnpA ΔacpA ΔcvfA ΔcvfA
1 × 5 × 1 ×ΔcvfA+pDL278::cvfA
2.3 kb
1.7 kb
rRNA
Fig. 5
on May 14, 2018 by guest
http://jb.asm.org/
Dow
nloaded from
Page 39
Wild type ∆cvfAA2.3 kb
1.7 kb
unbu
ffere
d
BrRNA
2.3 kb
.5
C
1.7 kb
rRNA
pH 7
.
C2.3 kb
1.7 kb
pH 6
.0
rRNA
0 2 4 8 16 320 2 4 8 16 32
Time after rifampicin addition [min]Fig. 6
on May 14, 2018 by guest
http://jb.asm.org/
Dow
nloaded from