E 3 Research Team led by Dr. Karen Vierow Research Associate: Dr. Isaac Choutapalli www.diskingallerie s.com/bobdiskin /slides/wate... www.palaciosbeacon.com/palaciospixs- 1.shtml by Marilyn Phillips Palacios High School Mathematics Instructor
Ph.D., Quantum Engineering and System Sciences, University of TokyoM.S., Nuclear Engineering, University of California at BerkeleyB.S., Nuclear Engineering, Purdue University
Project Leader
Dr. Vierow’s Grad Students
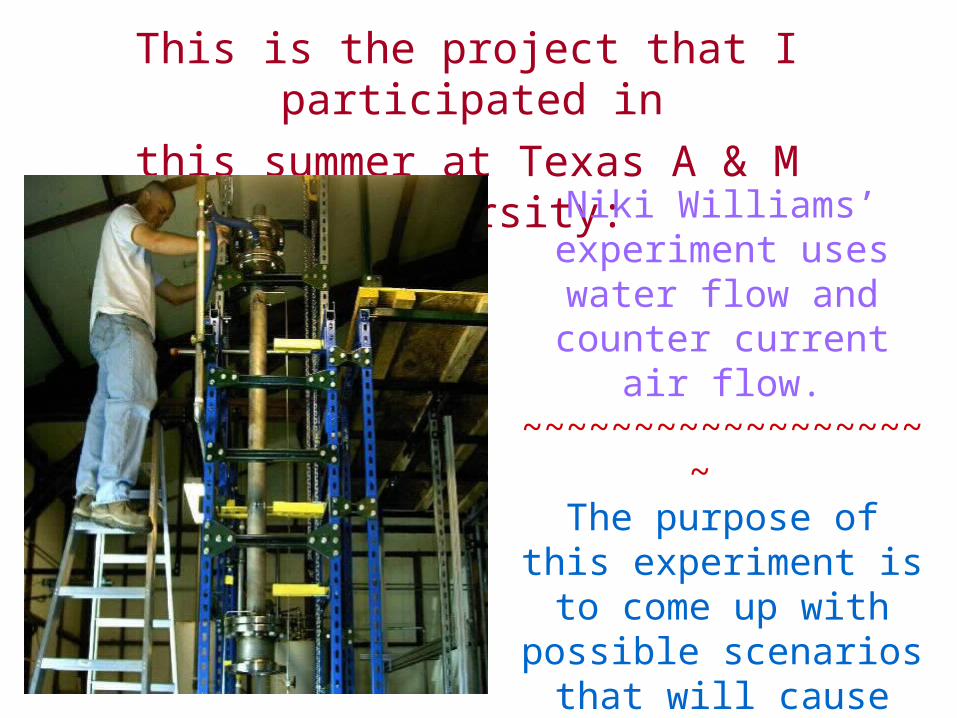
— Niki Williams—Countercurrent Flow Limitation Experiment with Steam & Water
— Adam Bingham —Analysis of Advanced Fuel Assemblies
And Core Designs for the Current and the Next Generations of LWR’s
(Light Water Reactors)
— Kevin Hogan —An Overview of Projects
Using a Simulation Model
—Zach Bailey —Nuclear Safety Curriculum Development
Texas A & M
— Ni Zhen —Analysis of VHTR
(Very High Temperature Reactor) Using MELCOR
Other Team Members:
Scott Griffin from Bay City High School
Willie Smith from TideHaven High School
Working in Conjunction with the South Texas Project Nuclear Facility
Picture of the South Texas Project Nuclear Facility
They were racing against time to try to get the water to drain.
Picture taken at 9 a.m. on June 10, 2008 from a military helicopter shows the drainage of the Tangjiashan quake lake in southewest China's Sichuan Province. Drainage of the quake lake through a manmade spillway speeded up to 1,760 cubic meters per second at 9:30 am on Tuesday, whereas water flow in the lower reaches of the lake, in Beichuan County, reached 2,240 cubic meters per second.
www.china.org.cn
During this lesson, the students will learn the following objectives:
(1) How changing dimensions affects the cross-sectional area and the volume of the
water in the pipe.(2) How to calculate the water flow coming
out a pipe by using the Δ Amount of Water / Δ Time
(3) The students will also make a table, graph the data points and draw a conclusion
from the graph.(4) The students will calculate the velocity of
the water for each size of pipe.
Science teachers may also want to do a water conservation lesson along with this lesson on
water flow.I will probably spend about one week of classroom
time covering this material.~~~~~~~~~~~~~~~~~~~~~~~~~~~~~~~~~~~~~~
Day One: Pre-Test on Basic knowledgeDay Two: Do the Experiment
Day Three: Make Graphs & Discuss the DataDay Four: Have a class discussion about how water flow
relates to the safety of a nuclear plant, irrigation & everyday water use.
Day Five: Post Test to determine what the students have learned.
• Have students start with the ½ inch pipe. • The first student will turn the water on and start the timer at the same time. • The second student could turn on the water and
measure the water. The water will be collected and measured at a collection container at the other end of the pipe.
• The third student will write down the data into the collection table that could be used in this
experiment.
The students will do three trials on each pipe and fill in the following
data table.
Water pipe size Δ Water Volume Δ Time Water Flow Rate______3/8 inch_________________________________________________________ 3/8 inch_________________________________________________________ 3/8 inch__________________________________________________________ ½ inch__________________________________________________________ ½ inch__________________________________________________________ ½ inch___________________________________________________________ ¾ inch___________________________________________________________ ¾ inch___________________________________________________________ ¾ inch___________________________________________________________
Day 2 of Experiment
After the students have collected all the data points, they will then calculate the
flow rate for each trial by
Using the following formula:
Water flow = Δ volume/ Δ time
(This is column 4 on the data table)
The students will then plot the data on a graph,
where the independent variableis time (x-axis),
and the dependent variable is the volume of the water (y-axis). The flow rate is the slope of the line.
Example of graph:
Water Volume in ounces
70
60
50
40
30
20
10
2 4 6 8 10 12 14 16 18 20 22 24
Time in seconds
Graph of Time vs. ounces
Now have the students graph the water flow for each size of pipe:
⅜ inch 1.8 gal/min
½ inch 3.7 gal/min
¾ inch 7.5 gal/min
1/8 ¼ 3/8 ½ ¾ 1 Pipe Size
8
7
6
5
4
3
2
1
0
Flow Rate
in Gal/min
Graph of Pipe size vs. flow rate
What conclusion can you make about the water flow and how it relates to
the size of pipe?
They should see that the graph is an exponential function.
y = a2 kx
After the students graph the
average water flow, the next thing
that they will do is to
calculate the velocity for each pipe.
The velocity of the water is
how fast the water is moving.
This is found by using the
following formula:
Velocity = Water Flow / cross-sectional area
Predictions
What conclusions can be made about the size of pipe and the water flow?
What conclusions can be made about the size of pipe and the velocity at
which the water is moving?
At this point I will give them some discussion questions and have them
answer these questions on paper.
How would you describe the water flow in the 3/4 inch pipe?
How did it compare to the ½ inch pipe?
How did it compare to the ⅜ inch pipe?
Algebraic Problem Solving
If one pipe can empty a 40 gal water tank
in 5 minutes and a second pipe
can empty a 40 gal water tank
in 8 minutes,
how long will it take for both pipes
to empty the water tank?
Analysis
At this point, I would like them to be able to conclude that
the water flow in the ½ inch pipe is twice the water flow in the ⅜ inch pipe and the water flow in the ¾ inch pipe is
four times the water flow in the ⅜ inch pipe.
I would like to express my
To Everyone in the E3 Program,Especially those that took us on our field trips to
the power plant and the nuclear plant: Dr. Cheryl Page,
Dr. Robin Autenrieth, Dr. Karen Butler-Purry, and
Jacque Hodge.
I would also like to Thank
Professor Conkey and Professor Srinivasa for working with us in the
Educational Discussion Time,
along with all of the other people
that are involved in the
E3 Program.
In Conclusion,I would like to give a special
to all of the people that made this presentation possible.
TAMU E3 ProgramOur Team Leader: Dr. Karen Vierow
Research Associate: Dr. Isaac Choutapalli Grad Student: Niki Williams All of the other grad students that presented