26
E-ANALYTICS GUIDE USING DATA AND NEW TECHNOLOGY FOR PEACEMAKING, PREVENTIVE DIPLOMACY AND PEACEBUILDING

E-ANALYTICSGUIDE
USING DATA AND NEW TECHNOLOGY FOR PEACEMAKING,
PREVENTIVE DIPLOMACY AND PEACEBUILDING
E-Analytics Guide:
Using Data and New Technology for Peacemaking, Preventive Diplomacy and Peacebuilding
Department of Political and Peacebuilding AffairsUN Global Pulse
United Nations University Institute on Computing and Society
New York, January 2019
The United Nations does not represent or endorse the accuracy or reliability of any advice, opinion, statement or other information provided by any information provider mentioned in this publication.
For suggestions and comments on the guide please contact:
Mr. Martin Waehlisch, [email protected],Mr. Daanish Masood, [email protected],
Department of Political and Peacebuilding Affairs.
The presentation of the materials used in this publication, does not imply the expression of any opinion whatsoever on the part of the United Nations.
Designed by Department of Global Communications.
CONTENTINTRODUCTION
SECRETARY-GENERAL’S STRATEGY ON NEW TECHNOLOGIES
DATA LITERACY
IMMERSIVE ENVIRONMENTS
CASE STUDIES
TOOLS: DATA SETS
SITUATIONAL AWARENESSSOCIAL MEDIA ANALYTICS
MAPS AND SATELLITE IMAGERY ANALYSISDATA VISUALIZATION
DATA PROJECT PLANNING MATRIX
RESOURCES
e-Analytics Guide
INTRODUCTION
The Secretary-General emphasized in his Strategy on New Technologies (2018) the opportunities offered by digital technologies for accelerating the implementation of SDG 16 and enhancing the work of the peace and security pillar. With the appointment of the High-level Panel on Digital Cooperation, the Secretary-General stressed that the UN must strengthen its internal capacities and deepen exposure to new technologies while increasing understanding, advocacy and dialogue around technology.
Opportunities
As digital technology changes societies, econo-mies and governance, it can also has a role to play in conflict resolution. Big data, machine learning, crowdsourcing, digital opinion mining, and other e-analytics tools have the potential to enhance the UN’s operational approach to conflict prevention and peacemaking. Data is available at an unprece-dented scale and in real time. Open data, including social media, and big data provide new entry points for peace and security assessments. Improvements in machine learning algorithms and computational power yield new opportunities.
A major benefit of technology-driven approaches is the ability to expand situational awareness, par-ticularly in settings without political presence or limited access. They also offer opportunities to triangulate information based on empirical data. In addition, new technological frontiers such as artificial intelligence can help to detect patterns and political trends, monitor incidents and track community perceptions more efficiently and at a fast speed, thereby enhancing the organization’s capacity to forecast trends.
Challenges
The use of data and technology for prevention and crisis management efforts continues to face technical and operational challenges. Limited internet access and restrictions in conflict zones remain impeding factors for digital sentiment
analysis or opinion mining. Data privacy and data sensitivities need to be carefully considered, while insufficient or manipulated data can distort analytical conclusions.
There are also limits on the extent to which digital tools can leverage conflict prevention forecasts and diplomatic efforts. The human factor remains key in the new digital era. Finally, as the Secretary-General’s Strategy on New Technologies emphasises, it is critical to maintain a culture of innovation in which both successes and failures from exposure to new technologies are a source of learning. New technologies and e-analytics approaches will take time to become integral parts of work flows and institutional mechanisms.
About this guide
This guide offers an overview of e-analytics in the context of peacemaking and preventive diplomacy. It is rooted in the e-analytics course that the Department of Political and Peacebuilding Affairs has been conducting jointly with Global Pulse and a range of other partners since 2017.
The guide presents a summary of e-analytics tools as well as examples from the peace and security field. It includes a data project planning matrix that aims to help facilitate and motivate data-driven analysis. Part of the guide is a glossary on basic terminology related to new technologies.

e-Analytics Guide
SECRETARY-GENERAL’S STRATEGY ON NEW TECHNOLOGIES
Many parts of the UN system have already embraced the operational and tactical challenges posed by new technologies. Several UN agencies and departments are using machine learning, robot-ics, and computational sciences, to deliver on their mandates, and to become more efficient in doing so.
Upgrading our collective understanding of, and exposure to, new technologies must be a priority. It is the fastest and most effective way for the UN system to engage with governments, industry and civil society actors in their own technological transformations.
Without a stepped up, smart and responsible use of technology, we will fail to reach the SDGs and we will miss opportunities to prevent conflict and sustain peace. And with greater recourse to innovation using new technology, the UN’s management culture can become more efficient, more agile, and more proactive—and deliver better results for our Members.
Protect and promote global values
Foster inclusion and transparency
Work in partnership
Build on existing capabilities and mandate
Be humble and continue to learn
Deepening the UN’s internal capacities and exposure to new technologies
Increasing understanding, advocacy and dialogue
Supporting dialogue on normative and cooperation frameworks
Enhancing UN system support to government capacity development
PRINCIPLES COMMITMENTS
1 12
23
34
45
e-Analytics Guide
DATA LITERACY
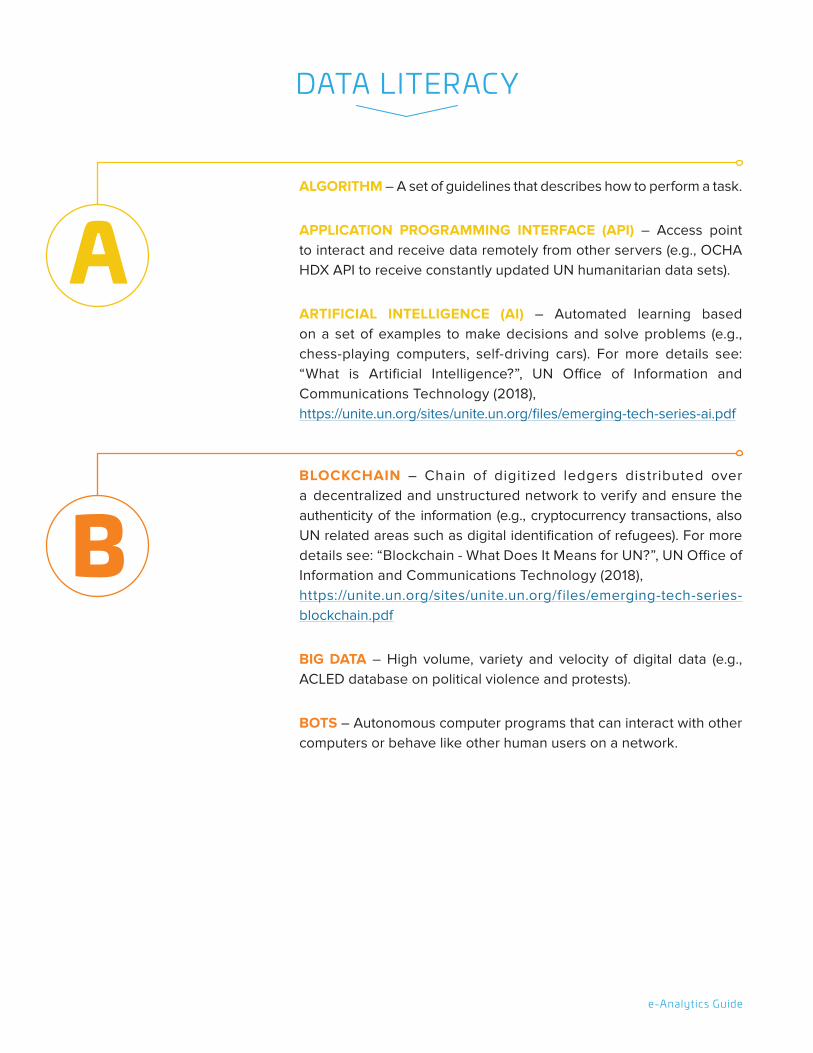
ALGORITHM – A set of guidelines that describes how to perform a task.
APPLICATION PROGRAMMING INTERFACE (API) – Access point to interact and receive data remotely from other servers (e.g., OCHA HDX API to receive constantly updated UN humanitarian data sets).
ARTIFICIAL INTELLIGENCE (AI) – Automated learning based on a set of examples to make decisions and solve problems (e.g., chess-playing computers, self-driving cars). For more details see: “What is Artificial Intelligence?”, UN Office of Information and Communications Technology (2018), https://unite.un.org/sites/unite.un.org/files/emerging-tech-series-ai.pdf
BLOCKCHAIN – Chain of digitized ledgers distributed over a decentralized and unstructured network to verify and ensure the authenticity of the information (e.g., cryptocurrency transactions, also UN related areas such as digital identification of refugees). For more details see: “Blockchain - What Does It Means for UN?”, UN Office of Information and Communications Technology (2018), https://unite.un.org/sites/unite.un.org/files/emerging-tech-series-blockchain.pdf
BIG DATA – High volume, variety and velocity of digital data (e.g., ACLED database on political violence and protests).
BOTS – Autonomous computer programs that can interact with other computers or behave like other human users on a network.
A
B

e-Analytics Guide
CLOUD – Data is stored on servers not on desktop (e.g., Unite Drive).
CROWDSOURCING – The practice of enlisting the input of a large number of people to perform a task on the internet of public opinions on peace process).
CRYPTOGRAPHY – Encryption process of converting information into unintelligible text, called ciphertext (e.g., used for UN Code Cables).
DATA – Characteristics, usually numerical, that can occur as structured data (e.g., GDP, age, gender, zip code) or unstructured data (e.g., text files, digital images, video and audio files).
DATA FIREHOSE – Steady stream of all publicly available data from a source in real time (e.g., Twitter firehose).
DATA MINING – Process of sifting through large quantity of data and identifying patterns or other information (e.g., trends of terrorist attacks).
DIGITAL DIVIDE – Lack of access to the internet and know-how (e.g., see SDG target 9.c “increase access to information and communications technology and the internet”).
DISTRIBUTED DENIAL OF SERVICE (DDoS) – Systematic cyber-attacks to disable a network by causing suspension of service, for example through server overload.
DEEP LEARNING (DL) – Type of MACHINE LEARNING that is focused on complex problems (e.g., measuring parliamentary polarization and ideology).
DATA LITERACY
C
D

e-Analytics Guide
GEOGRAPHIC INFORMATION SYSTEM (GIS) – System designed to capture, store, manipulate, analyse, manage, and present spatial or geographical data (e.g., hotspots of political unrest).
GEOTAG – Location data users can attach to specific data points (e.g., location details linked to tweets on ongoing conflicts).
INFORMATION AND COMMUNICATION TECHNOLOGY (ICT) – Hard or software for digitally processing, storing or transferring information (e.g., computers, internet, radio).
INFORMATION MANAGEMENT SYSTEM (IMS) – Systematic gathering, organising and retrieving of data (e.g., Unite Docs).
INTERNET OF THINGS (IOT) – Network of diverse interlinked physical objects that communicate with each other by means of embedded internet-enabled electronics (e.g., smartphone to fridge).
MACHINE LEARNING – An anoted system System to make predictions by detecting patterns in never-before-seen data while self-improving forecasting model (e.g., machine learning of hazard prediction). For more details see: “What is Machine Learning?”, UN Office of Information and Communications Technology (2018), https://unite.un.org/sites/unite.un.org/files/emerging-tech-series-machine-learning.pdf
META DATA – Data that provides information about other data (e.g., time, location, user info, device type, etc.).
NATURAL LANGUAGE PROCESSING (NLP) – Analysing large amounts of natural language data (e.g., used for SENTIMENT ANALYSIS to detect public opinions).
DATA LITERACY
G
I
M
N
e-Analytics Guide
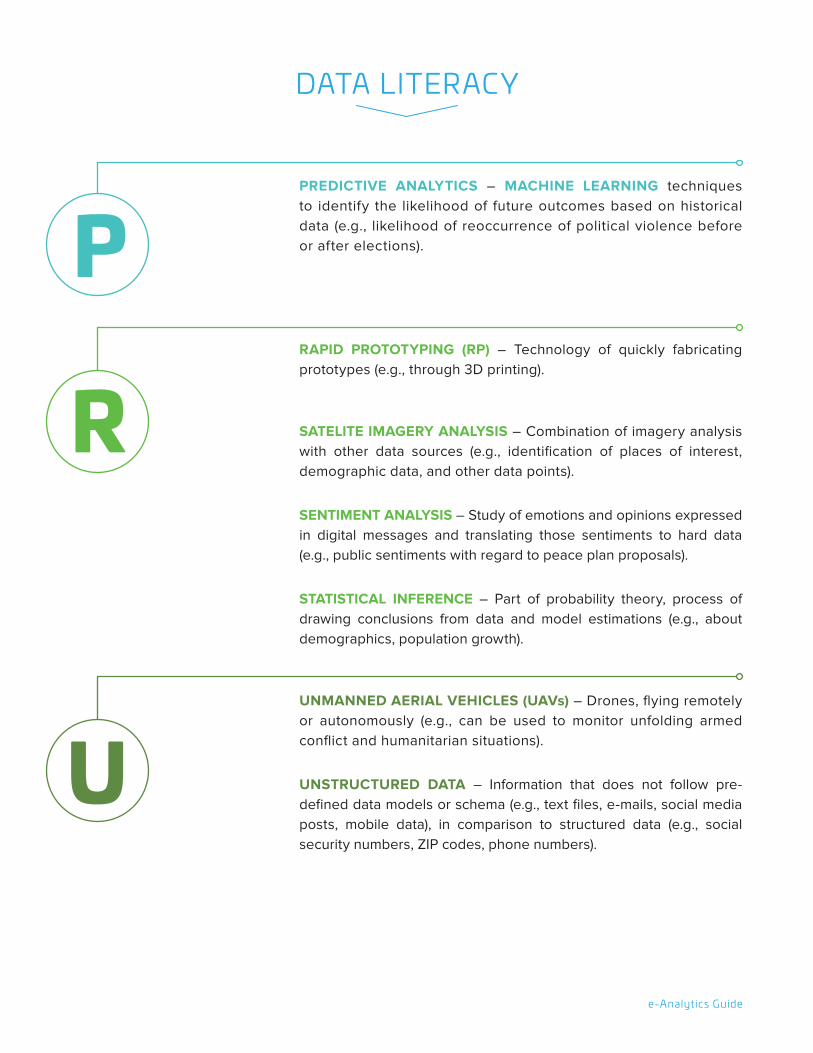
PREDICTIVE ANALYTICS – MACHINE LEARNING techniques to identify the likelihood of future outcomes based on historical data (e.g., likelihood of reoccurrence of political violence before or after elections).
RAPID PROTOTYPING (RP) – Technology of quickly fabricating prototypes (e.g., through 3D printing).
SATELITE IMAGERY ANALYSIS – Combination of imagery analysis with other data sources (e.g., identification of places of interest, demographic data, and other data points).
SENTIMENT ANALYSIS – Study of emotions and opinions expressed in digital messages and translating those sentiments to hard data (e.g., public sentiments with regard to peace plan proposals).
STATISTICAL INFERENCE – Part of probability theory, process of drawing conclusions from data and model estimations (e.g., about demographics, population growth).
UNMANNED AERIAL VEHICLES (UAVs) – Drones, flying remotely or autonomously (e.g., can be used to monitor unfolding armed conflict and humanitarian situations).
UNSTRUCTURED DATA – Information that does not follow pre-defined data models or schema (e.g., text files, e-mails, social media posts, mobile data), in comparison to structured data (e.g., social security numbers, ZIP codes, phone numbers).
DATA LITERACY
P
R
U
e-Analytics Guide
IMMERSIVE ENVIRONMENTS
Immersive environments are digital experiences designed that create the perception of being physically present in a non-physical world, through surrounding the user with images, sound, and other stimuli.They can be used as a tool for briefings on crisis situations, as means to explain complex information (e.g., visualization of conflict data and structures), that create the perception of being physically present in a non-physical world, through surrounding the user with images, sound, and other stimuli. Immersive environments can eventually help emphasize users, increase emotional response, and strengthen responsible decision-making.
Virtual Reality
Full enclosed, digitial environment
Mixed & Augmented Reality
Intertwined real and virtual environment that
allows interaction
VR Examples
● Join UN Peacekeepers on the ground in Congo in Virtual Reality experience, Time Magazine (2018) http://time.com/5293203/blue-helmets-un-peacekeepers-congo-vr/
● Travel with UN Secretary General Ban Ki-moon in Virtual Realty, Time Magazine (2017)http://time.com/4635917/un-virtual-reality-ban-ki-moon/
● Clouds of Sidra, Zaatari Refugee Camp in Jordan (2015),https://www.with.in/watch/clouds-over-sidra/
e-Analytics Guide
CASE STUDIES
USING MACHINE LEARNING TO ANALYZE RADIO CONTENT IN UGANDA
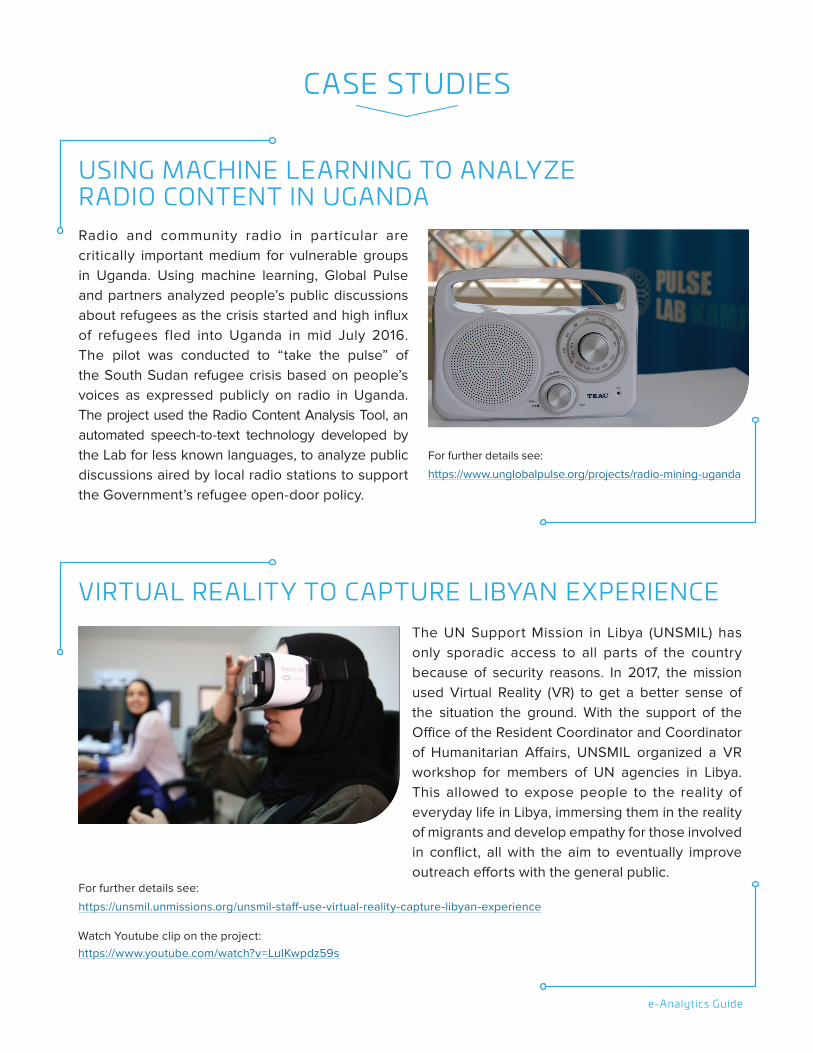
VIRTUAL REALITY TO CAPTURE LIBYAN EXPERIENCE
Radio and community radio in particular are critically important medium for vulnerable groups in Uganda. Using machine learning, Global Pulse and partners analyzed people’s public discussions about refugees as the crisis started and high influx of refugees fled into Uganda in mid July 2016. The pilot was conducted to “take the pulse” of the South Sudan refugee crisis based on people’s voices as expressed publicly on radio in Uganda. The project used the Radio Content Analysis Tool, an automated speech-to-text technology developed by the Lab for less known languages, to analyze public discussions aired by local radio stations to support the Government’s refugee open-door policy.
The UN Support Mission in Libya (UNSMIL) has only sporadic access to all parts of the country because of security reasons. In 2017, the mission used Virtual Reality (VR) to get a better sense of the situation the ground. With the support of the Office of the Resident Coordinator and Coordinator of Humanitarian Affairs, UNSMIL organized a VR workshop for members of UN agencies in Libya. This allowed to expose people to the reality of everyday life in Libya, immersing them in the reality of migrants and develop empathy for those involved in conflict, all with the aim to eventually improve outreach efforts with the general public.
For further details see:
https://www.unglobalpulse.org/projects/radio-mining-uganda
For further details see:
https://unsmil.unmissions.org/unsmil-staff-use-virtual-reality-capture-libyan-experience
Watch Youtube clip on the project: https://www.youtube.com/watch?v=LuIKwpdz59s
e-Analytics Guide
CASE STUDIES
SATELLITE IMAGERY ANALYSIS OF SYRIAN-JORDAN BORDER
UNITAR - UNOSAT - Palais des Nations CH-1211 Geneva 10, Switzerland - T: +41 22 767 4020 (UNOSAT Operations) - Hotline 24/7 : +41 75 411 4998 - [email protected] - www.unitar.org/unosat
38°45'0"E
38°45'0"E
38°44'0"E
38°44'0"E
38°43'0"E
38°43'0"E
38°42'0"E
38°42'0"E
38°41'0"E
38°41'0"E
38°40'0"E
38°40'0"E
38°39'0"E
38°39'0"E
38°38'0"E
38°38'0"E
38°37'0"E
38°37'0"E
38°36'0"E
38°36'0"E
38°35'0"E
38°35'0"E
38°34'0"E
38°34'0"E
38°33'0"E
38°33'0"E
38°32'0"E
38°32'0"E
33°2
5'0"
N33
°24'
0"N
33°2
4'0"
N
33°2
3'0"
N
33°2
3'0"
N
33°2
2'0"
N
33°2
2'0"
N
33°2
1'0"
N
33°2
1'0"
N
33°2
0'0"
N
33°2
0'0"
N
33°1
9'0"
N
33°1
9'0"
N
33°1
8'0"
N
33°1
8'0"
N
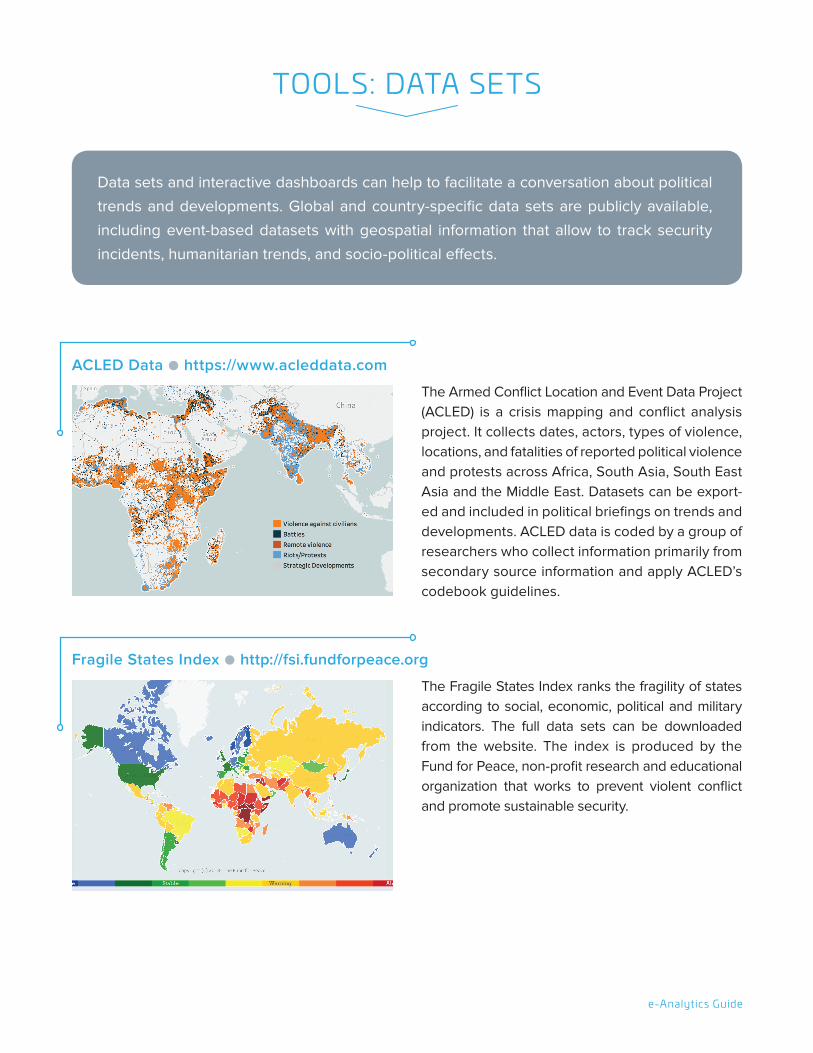
SYRIA - JORDAN BORDERRukban border crossingImagery analysis: 10 January 2018 | Published 16 January 2018 | Version 1.0
Complex emergency
CE20130604SYR
This map illustrates shelters in the area of theRukban border crossing on the Syrian-Jordanianborder. Using a satellite image collected by theDeimos-2 satellite on 10 January 2018, UNOSATlocated 10,418 probable shelters along theJordanian side of the border, 25 kilometerssouthwest of the Al Waleed crossing. This is a6.5 percent increase in apparent shelters visiblecompared to the previous UNOSAT analysis doneusing an image collected 21 September 2017.Due to the small size and the irregularity of theshelters it is likely that some shelters may havebeen missed in this analysis, or some shelterswere included erroneously. Due to the scale ofthis map and the lack of suitable borderinformation at this scale, the border in this maphas been excluded. This map is intended for fieldsupport and local authorities should be consultedfor boundary information. This is a preliminaryanalysis and has not yet been validated in thefield. Please send ground feedback to UNITAR-UNOSAT.
¥¦¬
¥¦¬
S Y R I A
J O R D A N
I R A Q
Amman
Damascus
The depiction and use of boundaries, geographic names and related data shown here are not warranted to be error-free nor do they implyofficial endorsement or acceptance by the United Nations. UNOSAT is a program of the United Nations Institute for Training and Research(UNITAR), providing satellite imagery and related geographic information, research and analysis to UN humanitarian & developmentagencies & their implementing partners. This work by UNITAR-UNOSAT is licensed under a CC BY-NC 3.0.
Shelter density map at Rukbanborder crossing
Satellite Data (1): Deimos-2Imagery Date: 10 January 2018Resolution: 75 cmCopyright: Deimos ImagingSource: Urthecast
Satellite Data (2): TripleSatImagery Dates: 21 September 2017Resolution: 80 cmCopyright: Twenty First Century Aerospace Technology Co.Source: Twenty First Century Aerospace Technology Co.
Satellite Data (3): Multiple previous imagesBerm Data : UNOSATOther Data: USGS, UNCS, NASA, NGAAnalysis : UNITAR - UNOSATProduction: UNITAR - UNOSAT
!IMap Scale for A3: 1:65,000
Analysis conducted with ArcGIS v10.4.1
Coordinate System: WGS 1984 UTM Zone 37NProjection: Transverse MercatorDatum: WGS 1984Units: Meter
ÆI
Map location
Legend
0 1 2Kilometers
See inset for close-up view of shelters
INSET: Close up view of shelters
SYRIA
JORDANSecurity berm
Shelter density levelHigh
Low
25 July 2014 01 Oct 2014 02 Nov 2014 24 Sept 2015 05 Dec 2015 03 Feb 2016 24 April 2016 23 May 2016 24 June 2016 25 July 2016 02 Sept 2016 22 Oct 2016 03 Dec 2016 17 Feb 2017 29 April 2017 26 June 2017 21 Sept 2017 10 Jan 2018
90 132 245 363 1,497 3,365 6,104 6,416 7,925 6,563 8,295 7,116 6,441 6,460 8,382 9,175 9,777 10,418
Number of Structures
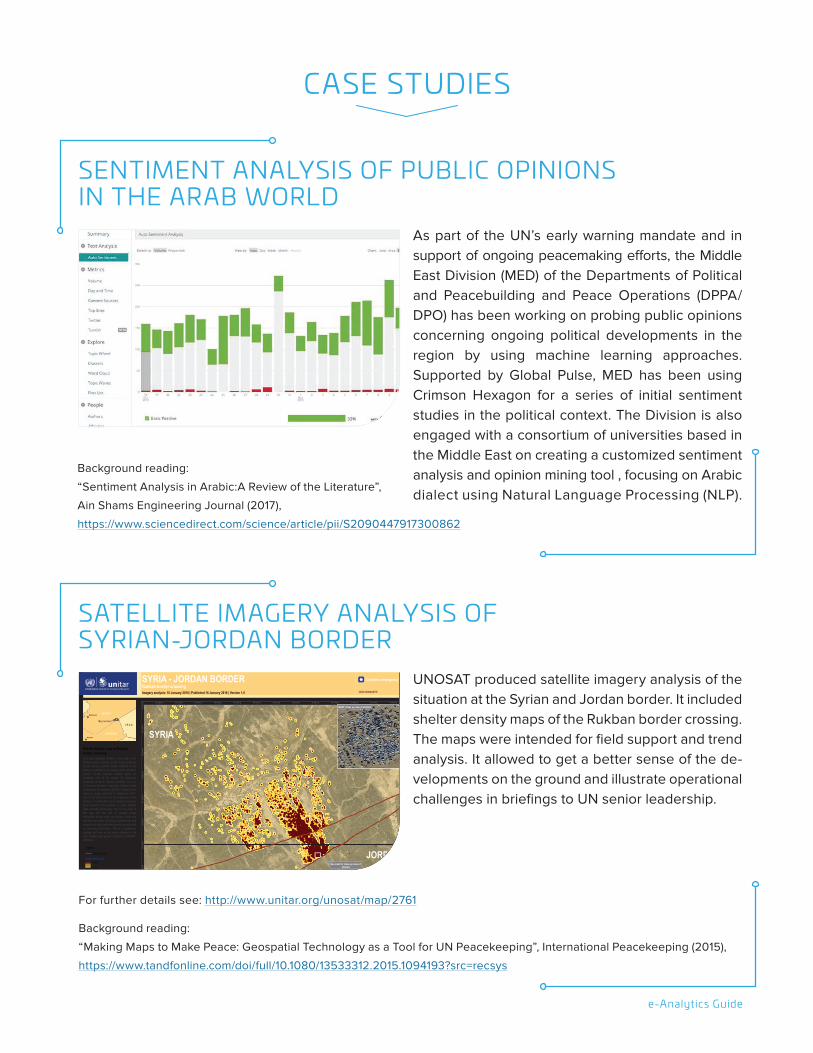
As part of the UN’s early warning mandate and in support of ongoing peacemaking efforts, the Middle East Division (MED) of the Departments of Political and Peacebuilding and Peace Operations (DPPA/DPO) has been working on probing public opinions concerning ongoing political developments in the region by using machine learning approaches. Supported by Global Pulse, MED has been using Crimson Hexagon for a series of initial sentiment studies in the political context. The Division is also engaged with a consortium of universities based in the Middle East on creating a customized sentiment analysis and opinion mining tool , focusing on Arabic dialect using Natural Language Processing (NLP).
Background reading:
“Sentiment Analysis in Arabic:A Review of the Literature”,
Ain Shams Engineering Journal (2017),
https://www.sciencedirect.com/science/article/pii/S2090447917300862
SENTIMENT ANALYSIS OF PUBLIC OPINIONS IN THE ARAB WORLD
UNOSAT produced satellite imagery analysis of the situation at the Syrian and Jordan border. It included shelter density maps of the Rukban border crossing. The maps were intended for field support and trend analysis. It allowed to get a better sense of the de-velopments on the ground and illustrate operational challenges in briefings to UN senior leadership.
For further details see: http://www.unitar.org/unosat/map/2761
Background reading:
“Making Maps to Make Peace: Geospatial Technology as a Tool for UN Peacekeeping”, International Peacekeeping (2015),
https://www.tandfonline.com/doi/full/10.1080/13533312.2015.1094193?src=recsys
e-Analytics Guide
Data sets and interactive dashboards can help to facilitate a conversation about political
trends and developments. Global and country-specific data sets are publicly available,
including event-based datasets with geospatial information that allow to track security
incidents, humanitarian trends, and socio-political effects.
The Armed Conflict Location and Event Data Project (ACLED) is a crisis mapping and conflict analysis project. It collects dates, actors, types of violence, locations, and fatalities of reported political violence and protests across Africa, South Asia, South East Asia and the Middle East. Datasets can be export-ed and included in political briefings on trends and developments. ACLED data is coded by a group of researchers who collect information primarily from secondary source information and apply ACLED’s codebook guidelines.
The Fragile States Index ranks the fragility of states according to social, economic, political and military indicators. The full data sets can be downloaded from the website. The index is produced by the Fund for Peace, non-profit research and educational organization that works to prevent violent conflict and promote sustainable security.
ACLED Data ● https://www.acleddata.com
Fragile States Index ● http://fsi.fundforpeace.org
TOOLS: DATA SETS

e-Analytics Guide
Produced by the Institute for Economics and Peace, the Global Peace Index ranks states and territories according to their level of peacefulness. It uses qual-itative and quantitative indicators to measure the state of peace using three thematic parameters: the level of societal safety and security; the extent of on-going domestic and international conflict; and the degree of militarisation.
The Conflict Barometer published by the Heidelberg Institute for International Conflict Research describes recent trends in global conflicts. The Barometer also accounts for the application of conflict resolution measures, including measures of conflict resolution such as negotiations and treaties, UN peacekeeping missions as well as authoritative decisions by the ICJ and the ICC. It includes data on conflict intensity, start dates, conflict parties and conflict items can.
The Uppsala Conflict Data Program at the Department of Peace and Conflict Research of Uppsala University has recorded ongoing violent conflicts since the 1970s. Related data projects include the study of the duration of violence; creating “conflict polygons” to pinpoint the geography of war within a given country; and adding figures for yearly combat deaths. All information is separately available in the form of geo-referenced conflict site datasets.
Global Peace Index ● http://visionofhumanity.org
CONFLICTS IN 2016 (NATIONAL AND INTERNATIONAL LEVEL)
Projection: World Wagner IV
2 NON-VIOLENT CRISISNON-VIOLENTVIOLENT___________________________________
INTENSITY
0 NO CONFLICT
1 DISPUTES
3 VIOLENT CRISIS
4 LIMITED WAR
5 WAR
Heidelberg Conflict Barometer ● https://hiik.de/conflict-barometer
Uppsala Conflict Data Program ● http://ucdp.uu.se
TOOLS: DATA SETS
e-Analytics Guide
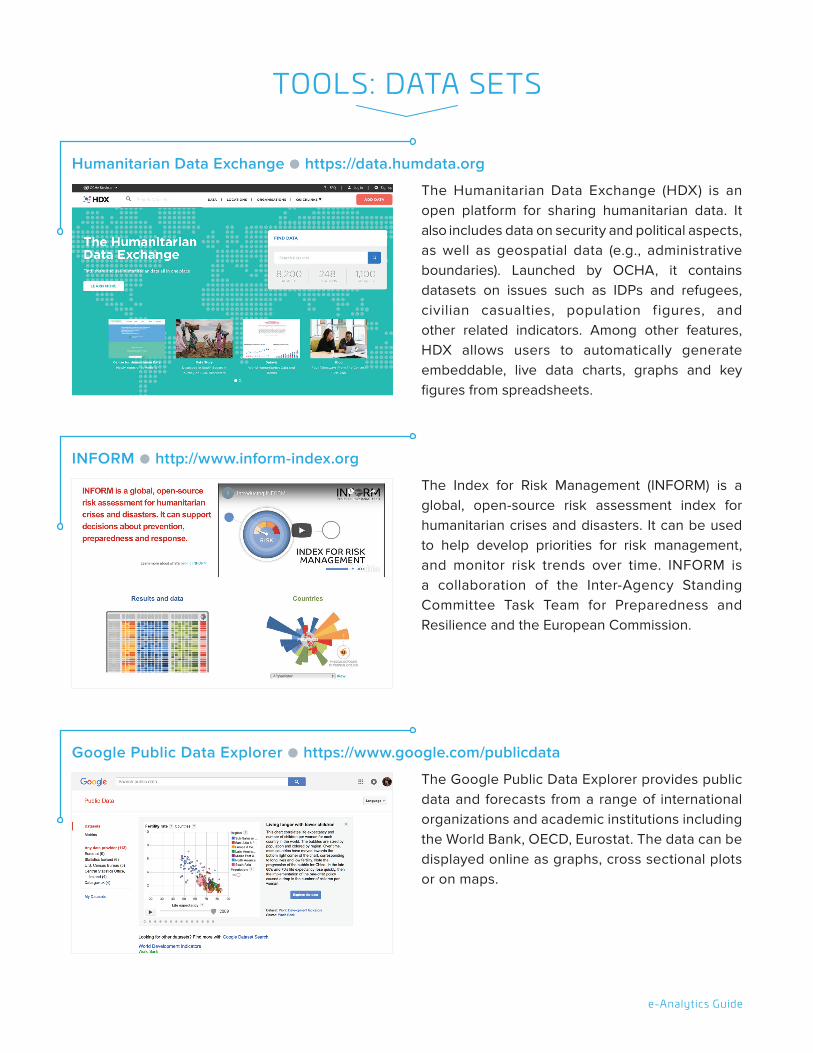
The Humanitarian Data Exchange (HDX) is an open platform for sharing humanitarian data. It also includes data on security and political aspects, as well as geospatial data (e.g., administrative boundaries). Launched by OCHA, it contains datasets on issues such as IDPs and refugees, civilian casualties, population f igures, and other related indicators. Among other features, HDX allows users to automatically generate embeddable, live data charts, graphs and key figures from spreadsheets.
The Index for Risk Management (INFORM) is a global, open-source risk assessment index for humanitarian crises and disasters. It can be used to help develop priorities for risk management, and monitor risk trends over time. INFORM is a collaboration of the Inter-Agency Standing Committee Task Team for Preparedness and Resilience and the European Commission.
The Google Public Data Explorer provides public data and forecasts from a range of international organizations and academic institutions including the World Bank, OECD, Eurostat. The data can be displayed online as graphs, cross sectional plots or on maps.
Humanitarian Data Exchange ● https://data.humdata.org
INFORM ● http://www.inform-index.org
Google Public Data Explorer ● https://www.google.com/publicdata
TOOLS: DATA SETS

e-Analytics Guide
The Global Terrorism Database is an open-source portal that provides information on terror-ist events around the world from 1970 onwards. It offers systematic data on domestic as well as transnational and international terrorist in-cidents, including the date and location of the incident, the weapons used and nature of the target, the number of casualties, and the group or individual responsible.
World Bank Open Data provides free and open access to global development data, compiled from officially-recognized international sources. It includes an analysis and visualisation tool that contains collections of time series data on various topics, including gender statistics, SDG related data, and governance related data.
Global Terrorism Database ● https://www.start.umd.edu/gtd
World Bank Open Data ● https://data.worldbank.org
TOOLS: DATA SETS
e-Analytics Guide
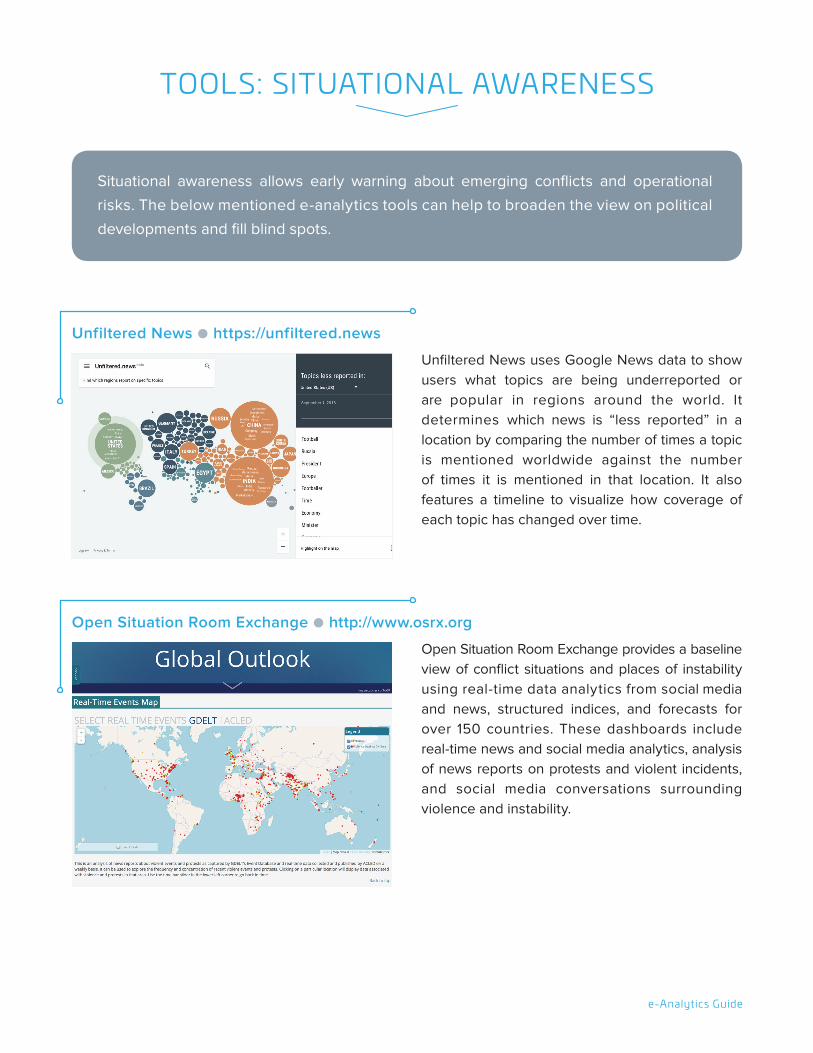
Unfiltered News uses Google News data to show users what topics are being underreported or are popular in regions around the world. It determines which news is “less reported” in a location by comparing the number of times a topic is mentioned worldwide against the number of times it is mentioned in that location. It also features a timeline to visualize how coverage of each topic has changed over time.
Open Situation Room Exchange provides a baseline view of conflict situations and places of instability using real-time data analytics from social media and news, structured indices, and forecasts for over 150 countries. These dashboards include real-time news and social media analytics, analysis of news reports on protests and violent incidents, and social media conversations surrounding violence and instability.
Unfiltered News ● https://unfiltered.news
Open Situation Room Exchange ● http://www.osrx.org
TOOLS: SITUATIONAL AWARENESS
Situational awareness allows early warning about emerging conflicts and operational
risks. The below mentioned e-analytics tools can help to broaden the view on political
developments and fill blind spots.

e-Analytics Guide
Dataminr is a source for breaking news alerts about critical events. It uses AI and machine learning to detect, qualify and classify public information in realtime based on social media reports and other sources. Accounts for UN staff can be requested through UN Global Pulse.
Aggie is an open-source software that can aggregate data from multiple platforms and support real-time analysis during critical events, such as national elections. It connects to multiple sources such as Twitter, Facebook, Whatsapp, SMS and syndicated websites. Aggie is a collaboration between Georgia Tech, Sassafras Tech Collective, and the United Nations University Computing and Society Institute.
Ushahidi (Swahii word for “testimony”) is a non-profit technology company from Kenia that got known for its crowdsourcing efforts of collecting and publishing eyewitness reports on civil disturbances during the presidential elections in 2017. It can be used for visualizing hotspots and flashpoints during political conflicts, natural disasters or other instances. The Ushahidi code is open source and free licenses are provided for non-profit projects.
Dataminr ● https://www.dataminr.com
Aggie ● http://getaggie.org
Ushahidi ● https://www.ushahidi.com
TOOLS: SITUATIONAL AWARENESS

e-Analytics Guide
The Institute of Advanced Analytics at North Carolina State University has built one of the most robust and highly functional free tools for Twitter sentiment analysis called the Tweet Visualizer. Based on keywords, it automatically pulls recent tweets and analysis general sentiments (positive, negative). It also clusters tweets into related topics by leveraging machine-learning algorithms.
Crimson Hexagon is a tool to mine social media such as Twitter and Facebook as well as blogs, forums, and news sites. It is an AI-powered platform that allows to analyse audiences, track perceptions, and detect trends of interventions.It provides an entry point for digging into public conversations and understand what people are saying online to make better-informed decisions. Accounts for UN staff can be requested through UN Global Pulse.
Sentiment Viz ● https://www.csc2.ncsu.edu/faculty/healey/tweet_viz/tweet_app
Crimson Hexagon ● https://www.crimsonhexagon.com
Social media is a critical source for the monitoring of public opinions and political
developments. Opinion mining and sentiment analysis can be used to sift through social
media with the help of text analysis and natural language processing in order to identify
and categorize expressed opinions.
TOOLS: SOCIAL MEDIA ANALYTICS
e-Analytics Guide
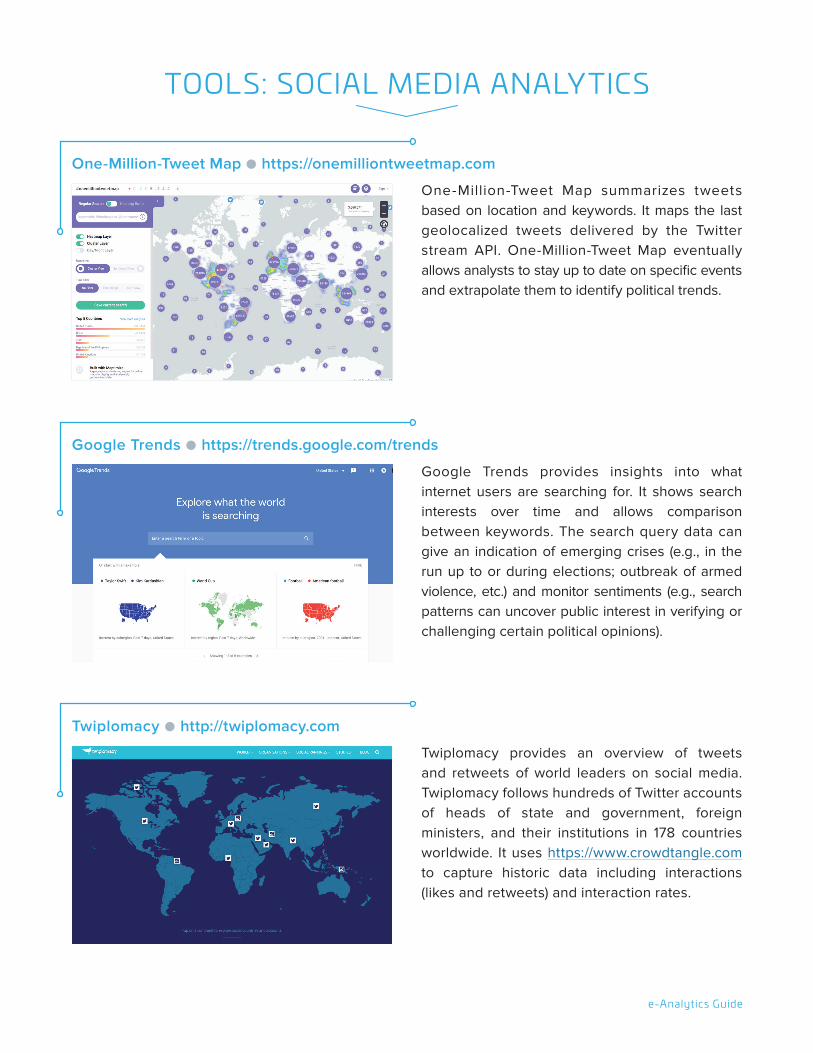
One-Million-Tweet Map summarizes tweets based on location and keywords. It maps the last geolocalized tweets delivered by the Twitter stream API. One-Million-Tweet Map eventually allows analysts to stay up to date on specific events and extrapolate them to identify political trends.
Google Trends provides insights into what internet users are searching for. It shows search interests over time and allows comparison between keywords. The search query data can give an indication of emerging crises (e.g., in the run up to or during elections; outbreak of armed violence, etc.) and monitor sentiments (e.g., search patterns can uncover public interest in verifying or challenging certain political opinions).
Twiplomacy provides an overview of tweets and retweets of world leaders on social media. Twiplomacy follows hundreds of Twitter accounts of heads of state and government, foreign ministers, and their institutions in 178 countries worldwide. It uses https://www.crowdtangle.com to capture historic data including interactions (likes and retweets) and interaction rates.
One-Million-Tweet Map ● https://onemilliontweetmap.com
Google Trends ● https://trends.google.com/trends
Twiplomacy ● http://twiplomacy.com
TOOLS: SOCIAL MEDIA ANALYTICS

e-Analytics Guide
UN GeoPortal is the gateway for geospatial services in support of UN field missions and the Secretariat. It includes public maps, UN operational maps, and other services.
OCHA’s Refliefweb complies key maps on critical operational situations, including security develop-ments and humanitarian assistance.
UN GeoPortal ● https://geoportal.dfs.un.org/arcgis/home/index.html
Reliefweb ● https://reliefweb.int/maps
Imagery analysis can provide insights into the developments of armed conflict and
humanitarian crises. For instance, maps can be used to visualize areas of control of armed
groups or latest security incidents. Satellite imagery analysis can be used to monitor
displacement, migration flows, or the scale of destruction by war.
TOOLS: MAPS AND SATELLITE IMAGERY ANALYSIS

e-Analytics Guide
The Geospatial Information Section (formerly Cartographic Section) comprises a team of map-ping and GIS specialists to undertake a range of geospatial and cartographic services related to the work of the Secretariat, including the preparation of small-scale illustrative, large-scale stand-alone maps and GIS products. For support requests con-tact the Geospatial Information Section.
UNOSAT provides maps and satellite imagery analysis in support of international humanitarian assistance operations to respond to crises caused by natural disasters, conflict and other complex emergencies, including developing political and security related issues. Maps and satellite imagery analysis can be requested by UN offices and agencies.
Liveuamap is an open data media platform that combines reports on news with their geolocation. It allows to track unfolding conflicts, human rights issues, protests, incidents of terrorism, natural disasters, and weather hazards. It also offers specialised maps on conflict regions (e.g., see on the Middle East, https://mideast.liveuamap.com/).
UN Geospatial Information Section ● http://www.un.org/Depts/Cartographic/english/htmain.htm
UNOSAT ● http://www.unitar.org/unosat
Liveuamap ● https://liveuamap.com
TOOLS: MAPS AND SATELLITE IMAGERY ANALYSIS
e-Analytics Guide
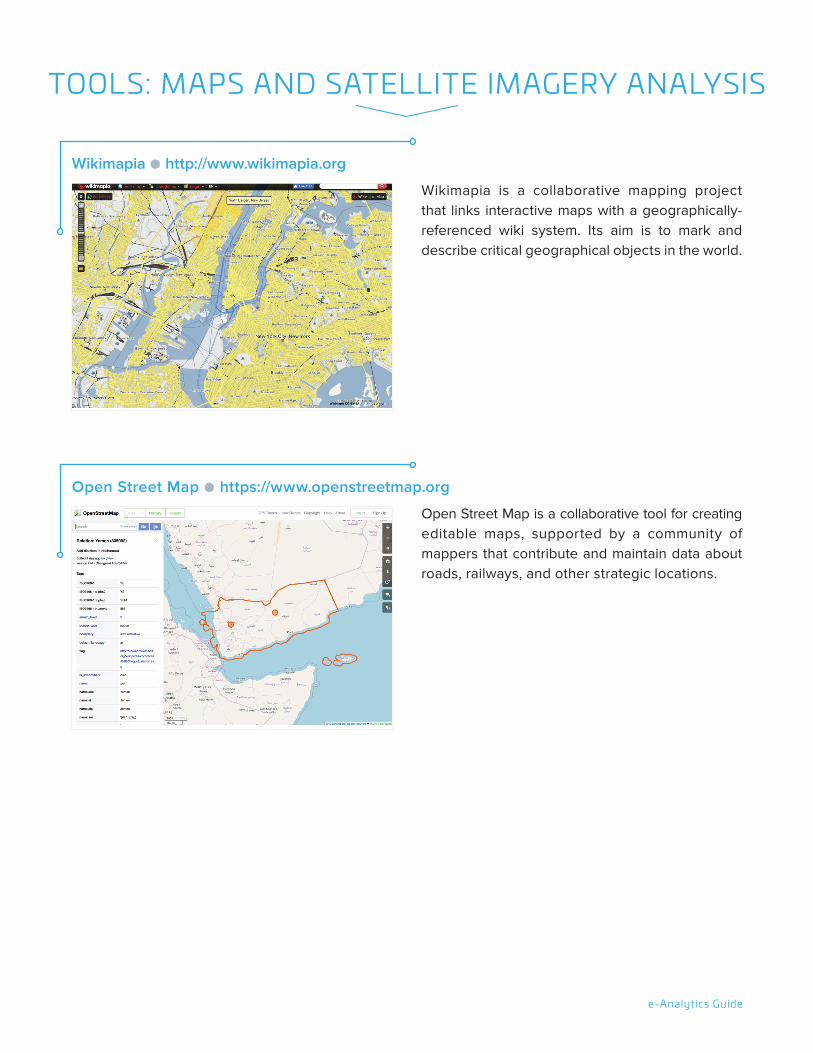
Wikimapia is a collaborative mapping project that links interactive maps with a geographically-referenced wiki system. Its aim is to mark and describe critical geographical objects in the world.
Open Street Map is a collaborative tool for creating editable maps, supported by a community of mappers that contribute and maintain data about roads, railways, and other strategic locations.
Wikimapia ● http://www.wikimapia.org
Open Street Map ● https://www.openstreetmap.org
TOOLS: MAPS AND SATELLITE IMAGERY ANALYSIS
e-Analytics Guide
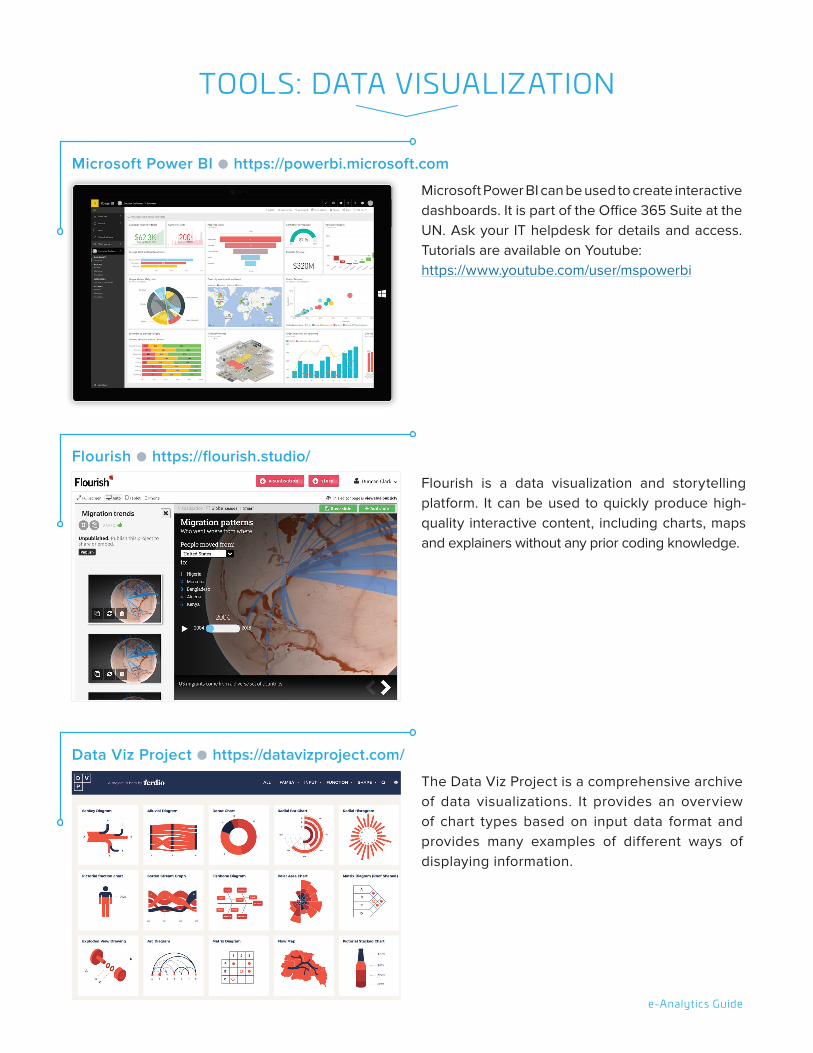
TOOLS: DATA VISUALIZATION
Microsoft Power BI can be used to create interactive dashboards. It is part of the Office 365 Suite at the UN. Ask your IT helpdesk for details and access. Tutorials are available on Youtube: https://www.youtube.com/user/mspowerbi
Flourish is a data visualization and storytelling platform. It can be used to quickly produce high-quality interactive content, including charts, maps and explainers without any prior coding knowledge.
The Data Viz Project is a comprehensive archive of data visualizations. It provides an overview of chart types based on input data format and provides many examples of different ways of displaying information.
Microsoft Power BI ● https://powerbi.microsoft.com
Flourish ● https://flourish.studio/
Data Viz Project ● https://datavizproject.com/

e-Analytics Guide
DATA PROJECT PLANNING MATRIX
DATA GAPSWhat additional
sources areneeded?
DATA QUALITYHow accurate,meaningfuland valuable is the data?
VISUALIZATIONHow will the resultsbe communicated?
DATA SENSITIVITYDoes the collected dataneed to be protected?
COLLABORATIONWho needs toget engaged?
TOOLSWhat tools and technology
solution are needed?
DATA SOURCESWhat data sources
are available?
DATA PARAMETERSWhat data sets areneeded to address
the issue?
?PROBLEM
DEFINITIONWhat is the key
question?

e-Analytics Guide
DATA PROJECT PLANNING MATRIXWORKSHEET
?CONSIDER:
What decision will be madebased on the addressed problem
satellite imagery analysis, etc.
level of confidentiality, etc.
audience
, visu
als (e
.g., c
harts
, das
hboa
rds,
VR) e
tc.
additional resources, partnership, etc.
triangulation of data, alternative data points
synergies, cross-verification, etc.
data mining , m
achine learning,
data privacy, accountability,
frequency, granularity, etc.
inte
rnal
/ext
erna
l dat
a col
lectio
ns, e
tc.
e-Analytics Guide
RESOURCES
Key documents
● Secretary-General’s Strategy on New Technologies (2018), http://www.un.org/en/newtechnologies/index.shtml
● Final Report of the Expert Panel on Technology and Innovation in UN Peacekeeping (2014), https://peacekeeping.un.org/en/final-report-of-expert-panel-technology-and-innovation-un-peacekeeping
● Report of the Secretary-General on Information and Communications Technology in the United Nations, A/69/517 (2014), https://undocs.org/A/RES/67/254
● A World that Counts, Mobilizing the Data Revolution for Sustainable Development (2014), http://www.undatarevolution.org/report/
● Experimenting with Big Data and Artificial Intelligence to Support Peace and Security, UN Global Pulse (2018), https://www.unglobalpulse.org/resource-library/reports
Further reading
● Big Data for Development: A Primer, UN Global Pulse (2013), http://www.unglobalpulse.org/sites/default/files/Primer%202013_FINAL%20FOR%20PRINT.pdf
● Using Technologies for Conflict Prevention, UNDP (2012), http://www.undp.org/content/dam/undp/library/crisis%20prevention/Issue_brief_Conflict%20Prevention_digital_tools_March2012.pdf
● The Impact of Big Data of International Affairs, Clingendael Institute (2016),https://spectator.clingendael.org/en/publication/impact-big-data-international-affairs
● New Technology and the Prevention of Violence and Conflict, IPI (2013), https://www.ipinst.org/images/pdfs/IPI_Epub-New_Technology-final.pdf
Learning opportunities
● Learning Data Science: Tell Stories With Data, https://www.lynda.com/Data-Science-tutorials/Storytelling-Data-Science/477450-2.html
● Intro to Machine Learning, https://www.udacity.com/course/intro-to-machine-learning--ud120
● Data Mining, https://www.kdnuggets.com/data_mining_course/index.html
● Big Data Foundations: Techniques and Concepts, https://www.linkedin.com/learning/big-data-foundations-techniques-and-concepts
Youtube
● CyberMediation: New skills and tools for mediation, https://www.youtube.com/watch?v=YDj2evqeGvU
● How can innovative technology make conflict prevention more effective?, https://www.youtube.com/watch?v=qHypbV-MNP4
● Preventing Violent Conflict: How Can Innovative Technologies Aid Peacebuilding?,https://www.youtube.com/watch?v=5UkhLgRs0jw


