Page 1
FP7-SMARTCITIES-2013
Project number: 609132
http://www.e-balance-project.eu/
e-balance
Deliverable D3.2
Detailed System Architecture Specification
Editor: Krzysztof Piotrowski (IHP)
Dissemination level: (Confidentiality)
PU
Suggested readers: Consortium/Experts/other reader groups
Version: 1.0
Total number of pages: 66
Keywords: Smart Grid, System Architecture, Energy Management, Resilience, Distributed
Generation
Abstract
This document gives a detailed description of the e-balance system. It defines the set of modules that are
representing the system functionality and the interactions between these modules. Further, the document
defines the distribution of the modules over the management units deployed within the energy grid as well as
the specific features of these management units. The applied functionality modules define also the data
exchanged between the management units.
Ref. Ares(2015)3754171 - 11/09/2015
Page 2
e-balance Deliverable D3.2
Page 2 of (66) © e-balance consortium 2015
Disclaimer
This document contains material, which is the copyright of certain e-balance consortium parties, and may not
be reproduced or copied without permission.
All e-balance consortium parties have agreed to full publication of this document.
The commercial use of any information contained in this document may require a license from the proprietor
of that information.
Neither the e-balance consortium as a whole, nor a certain party of the e-balance consortium warrant that the
information contained in this document is capable of use, or that use of the information is free from risk, and
accept no liability for loss or damage suffered by any person using this information.
The information, documentation and figures available in this deliverable are written by the e-balance partners
under EC co-financing (project number: 609132) and does not necessarily reflect the view of the European
Commission.
Impressum
[Full project title] Balancing energy production and consumption in energy efficient smart neighbourhoods
[Short project title] e-balance
[Number and title of work-package] WP3 System specification
[Document title] Detailed System Architecture Specification [Editor: Name, company] Krzysztof Piotrowski, IHP
[Work-package leader: Name, company] Krzysztof Piotrowski, IHP
Copyright notice
2015 Participants in project e-balance
Page 3
Deliverable D3.2 e-balance
© e-balance consortium 2015 Page 3 of (66)
Executive Summary
This document gives a detailed description of the e-balance system. It defines the set of modules that are
representing the system functionality and the interactions between these modules. Further, the document
defines the distribution of the modules over the management units deployed within the energy grid as well as
the specific features of these management units. The applied functionality modules define also the data
exchanged between the management units.
Section 2 starts the document with a short review of the high level architecture of the e-balance system. It
describes the management unit architecture and the distribution of the management units within the grid.
This allows to keep the document complete and to provide the detailed system specification based on the
high level description.
Section 3 describes the Data Interface between the energy management platform and the communication
platform, i.e., the two main building blocks of the e-balance system. The communication platform provides
the data exchange abstraction for the services executed by the energy management platform. The latter may
access the data without being involved in the details of the communication platform or the details on the
security implementation at that level. All these aspects are covered by the Data Interface.
Section 4 introduces all the individual modules. Their functionality is described together with the (abstract)
API interfaces and some specific technical requirements. These modules are also combined together in order
to form the complete set of modules available to define a management unit. The interactions between the
modules are also defined at that point. This represents the complete instance of a management unit that will
be then reduced to the necessary functionality to form the individual management units to be applied on each
system level. These specific management units are then described in Section 5. The data gathered and
processed at each kind of management unit is also defined at this point.
Section 6 considers the data flows in the complete system reflecting the data exchanges between multiple
management units. Here, the data owners can be identified as well as potential security issues that have to be
addressed.
The document is summarised in Section 7.
Page 4
e-balance Deliverable D3.2
Page 4 of (66) © e-balance consortium 2015
List of authors
Company Author
ALLI Marcel Geers
EDP João Almeida
Francisco Melo
EFACEC Alberto Bernardo
António Carrapatoso
Nuno Silva
Paulo Rodrigues
Alberto Rodrigues
IHP Krzysztof Piotrowski
Peter Langendörfer
IPI Tomasz Szmidt
INOV
Mário Nunes
António Grilo
Augusto Casaca
LODZ Bozena Matusiak
Jerzy S. Zieliński
UMA Eduardo Cañete
Jaime Chen
Manuel Díaz
Daniel Garrido
UTWE Marco Gerards
Marijn Jongerden
Page 5
Deliverable D3.2 e-balance
© e-balance consortium 2015 Page 5 of (66)
Table of Contents
Executive Summary ........................................................................................................................................... 3 List of authors .................................................................................................................................................... 4 Table of Contents .............................................................................................................................................. 5 List of Figures.................................................................................................................................................... 7 Abbreviations .................................................................................................................................................... 8 1 Introduction .............................................................................................................................................. 10
1.1 Deliverable Position in the Project .................................................................................................... 10 2 The high-level system architecture........................................................................................................... 12
2.1 The grid-level e-balance system architecture .................................................................................... 12 2.2 Management Unit Architecture ......................................................................................................... 14
3 The e-balance Data Interface .................................................................................................................... 16 3.1 Communication Pattern ..................................................................................................................... 16 3.2 Functional Data Interface .................................................................................................................. 17
3.2.1 Write(variable, location, value, policy, source, signature) ........................................................ 18 3.2.2 Query(variable, location, condition, function, source, signature) .............................................. 19 3.2.3 Event(variable, location, condition, source, signature) .............................................................. 19 3.2.4 Periodic(variable, location, period, source, signature) .............................................................. 20 3.2.5 Unsubscribe(subscriptionID, source, signature) ........................................................................ 20 3.2.6 Notify(requestID, result, variable, location, value, timestamp) ................................................. 21
4 The modules within a management unit ................................................................................................... 22 4.1 Communication platform .................................................................................................................. 22
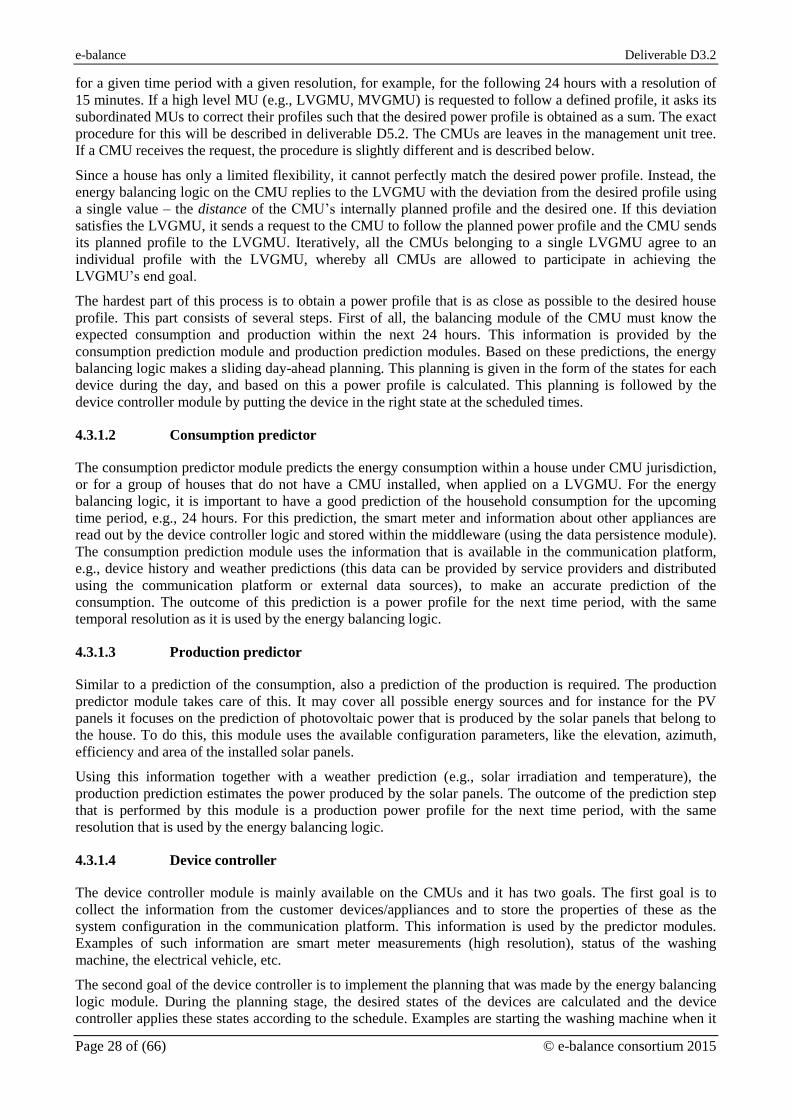
4.1.1 Communication Manager Module ............................................................................................. 23 4.1.2 Maintenance and Group Management Module .......................................................................... 24 4.1.3 Request Processor Module......................................................................................................... 24 4.1.4 Data Persistence Module ........................................................................................................... 25
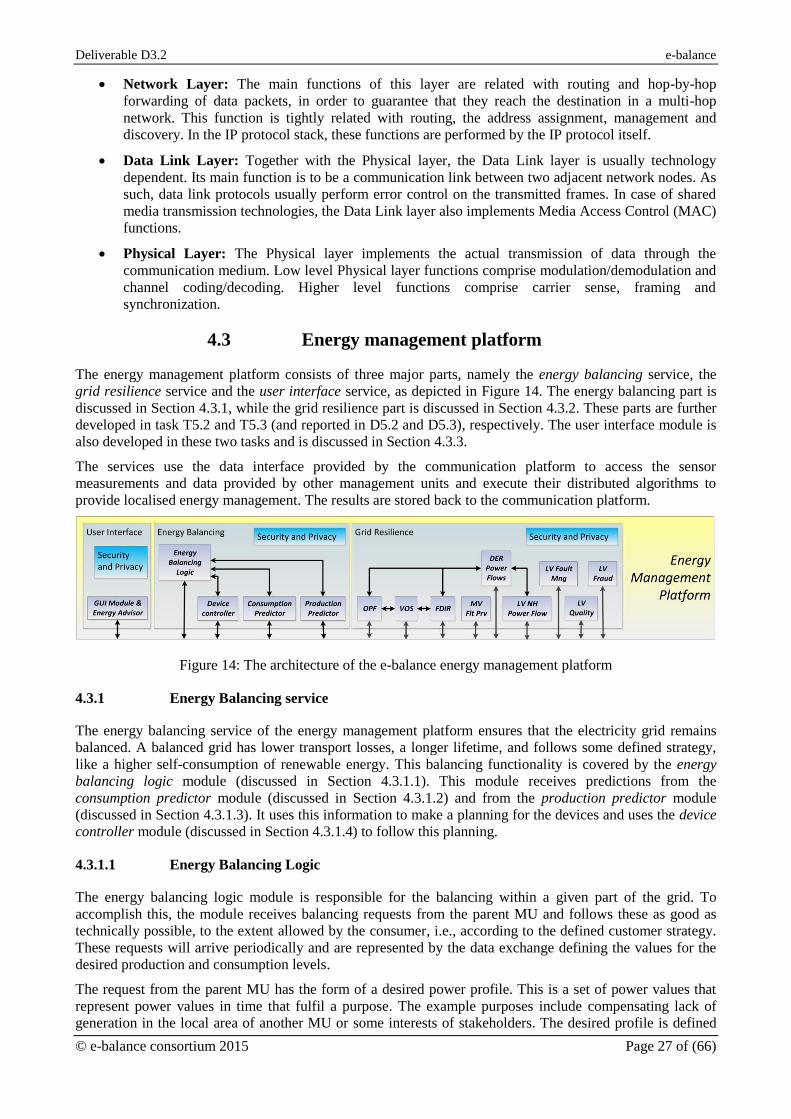
4.2 Network Stack ................................................................................................................................... 26 4.3 Energy management platform ........................................................................................................... 27
4.3.1 Energy Balancing service .......................................................................................................... 27 4.3.2 Grid Resilience service .............................................................................................................. 29 4.3.3 The user interface ...................................................................................................................... 42
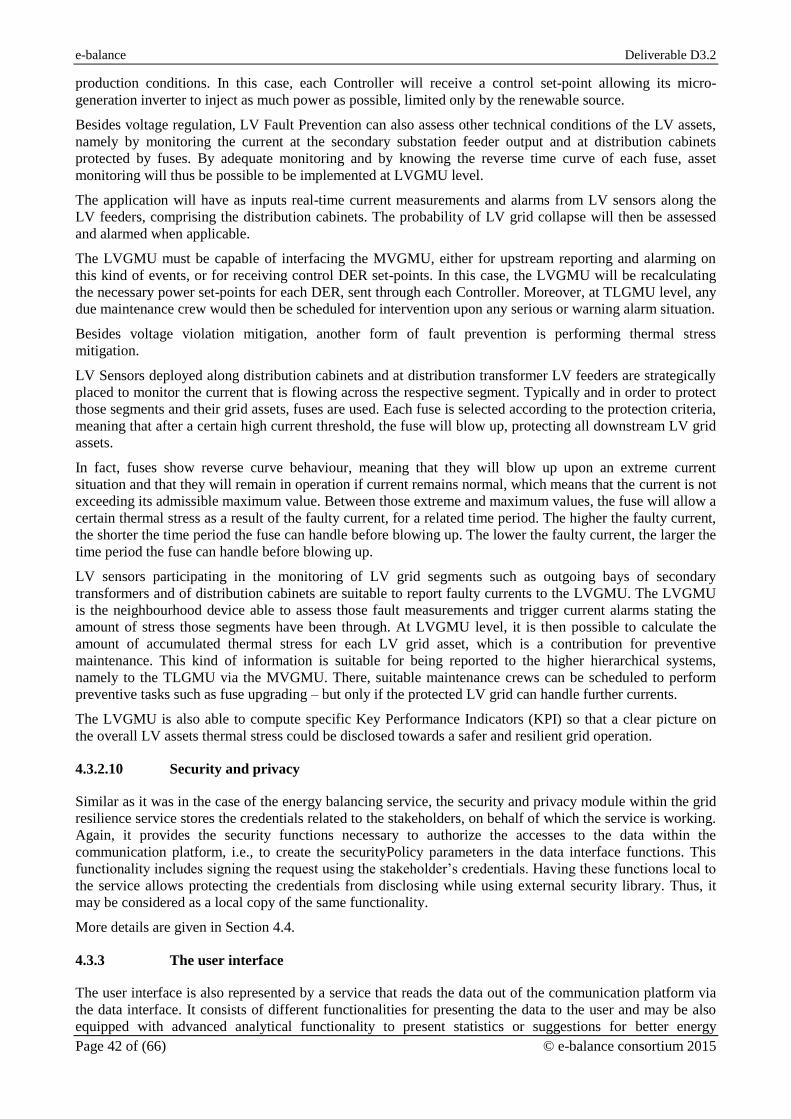
4.4 Security and privacy modules ........................................................................................................... 43 4.4.1 Communication Platform security and privacy ......................................................................... 43 4.4.2 Energy Management Platform security and privacy .................................................................. 45
5 Instantiation of the management unit ....................................................................................................... 48 5.1 Device management unit (DMU), Sensor, Actuator ......................................................................... 48
5.1.1 Hardware considerations............................................................................................................ 49 5.1.2 Data gathered and generated by the unit .................................................................................... 49
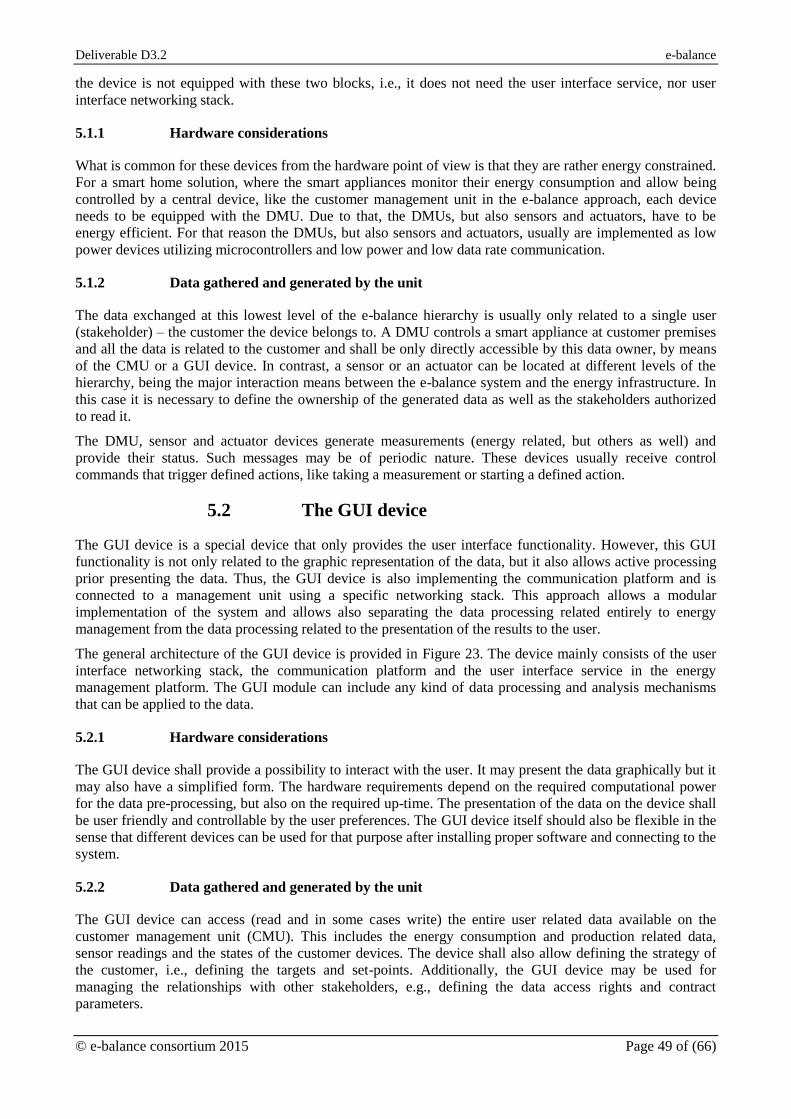
5.2 The GUI device ................................................................................................................................. 49 5.2.1 Hardware considerations............................................................................................................ 49 5.2.2 Data gathered and generated by the unit .................................................................................... 49
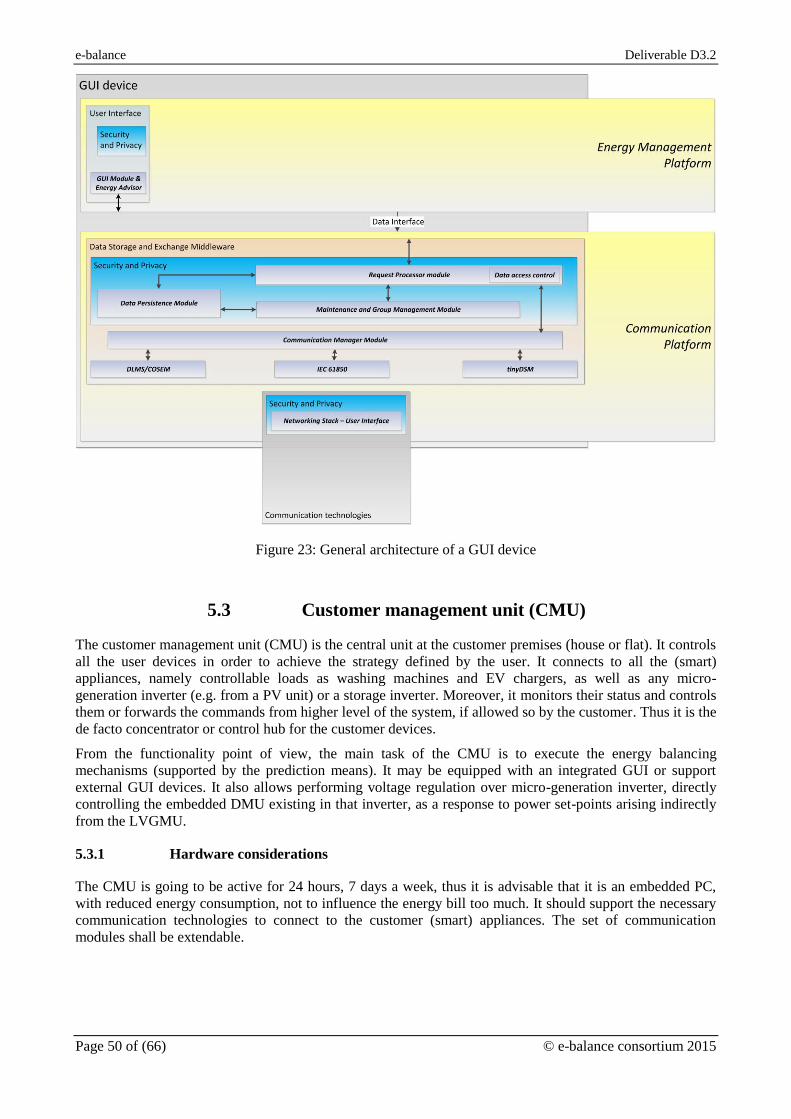
5.3 Customer management unit (CMU) .................................................................................................. 50 5.3.1 Hardware considerations............................................................................................................ 50 5.3.2 Data gathered and generated by the unit .................................................................................... 51
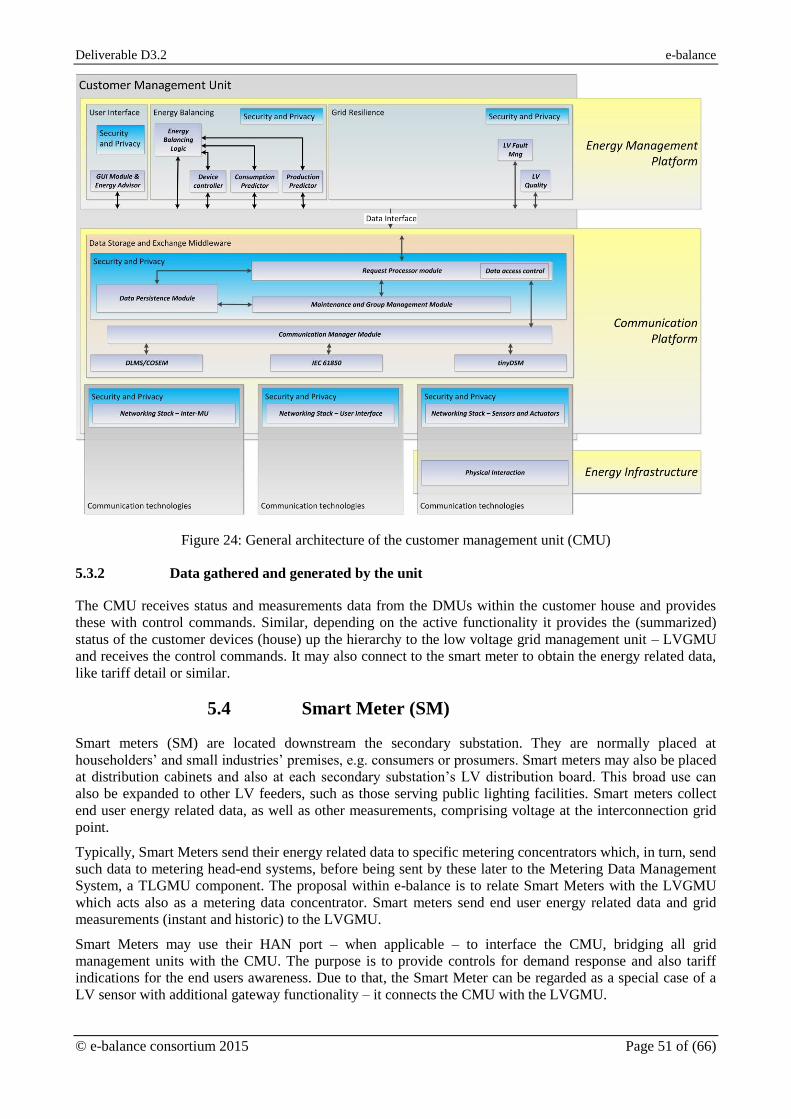
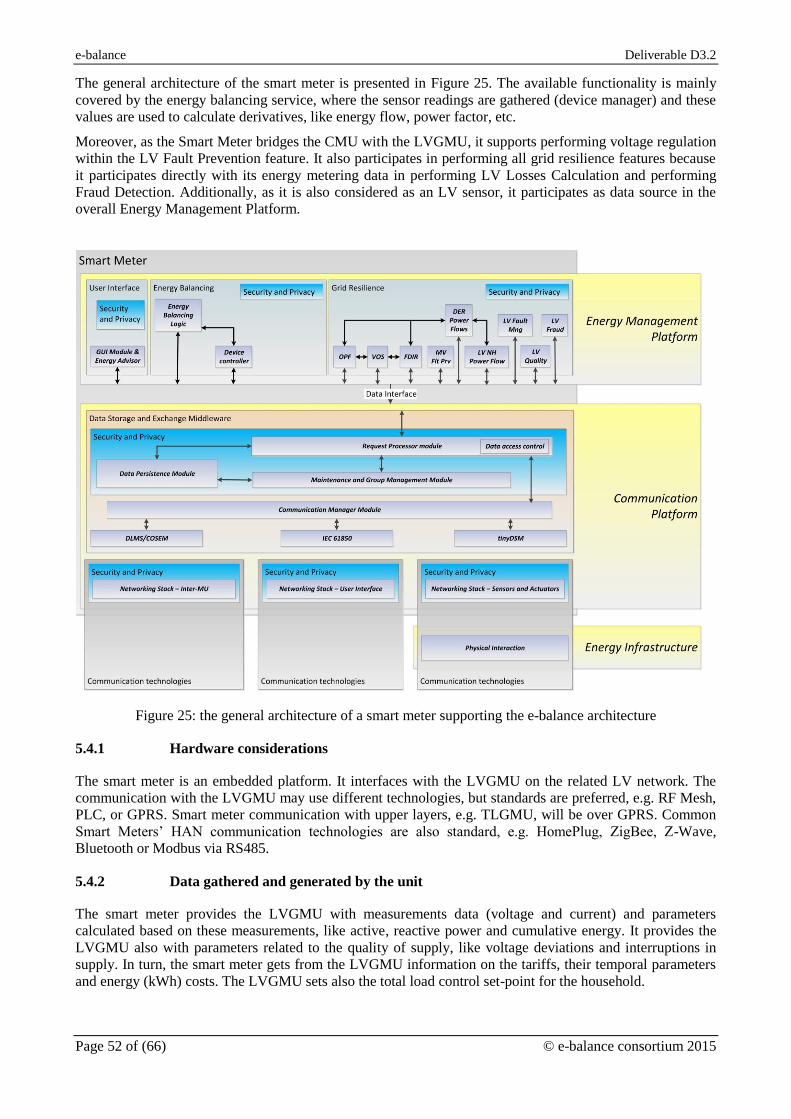
5.4 Smart Meter (SM) ............................................................................................................................. 51 5.4.1 Hardware considerations............................................................................................................ 52 5.4.2 Data gathered and generated by the unit .................................................................................... 52
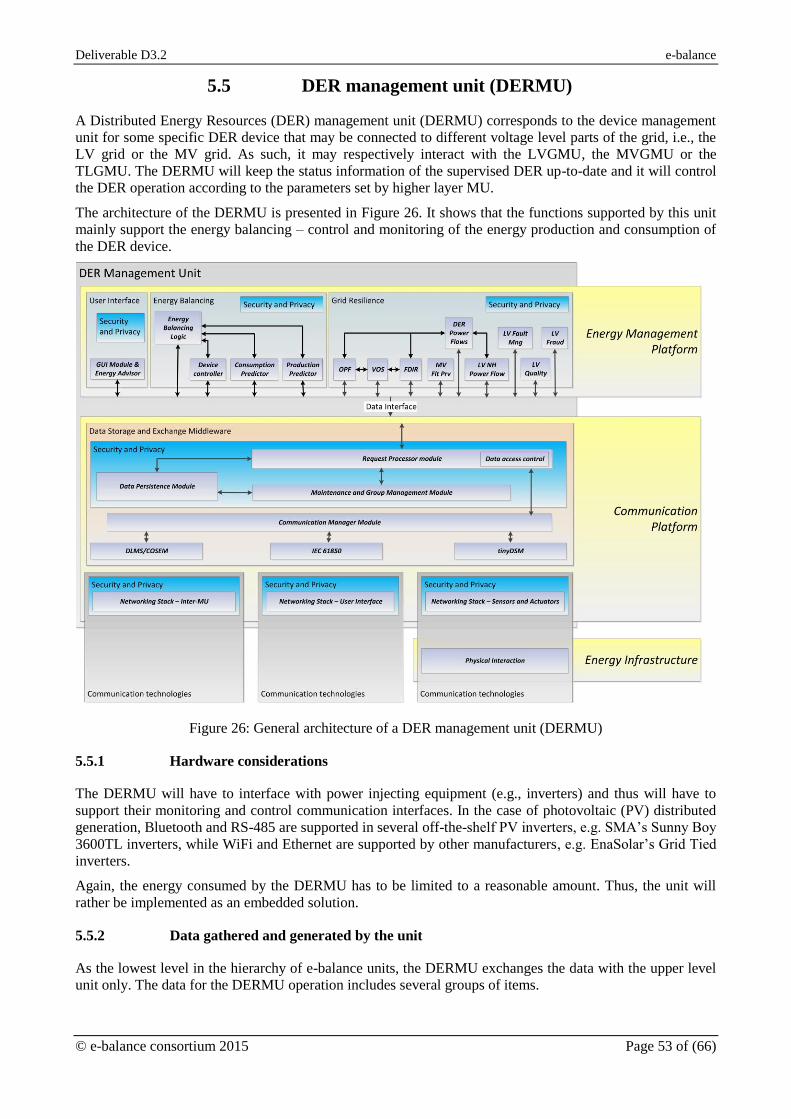
5.5 DER management unit (DERMU) .................................................................................................... 53 5.5.1 Hardware considerations............................................................................................................ 53 5.5.2 Data gathered and generated by the unit .................................................................................... 53
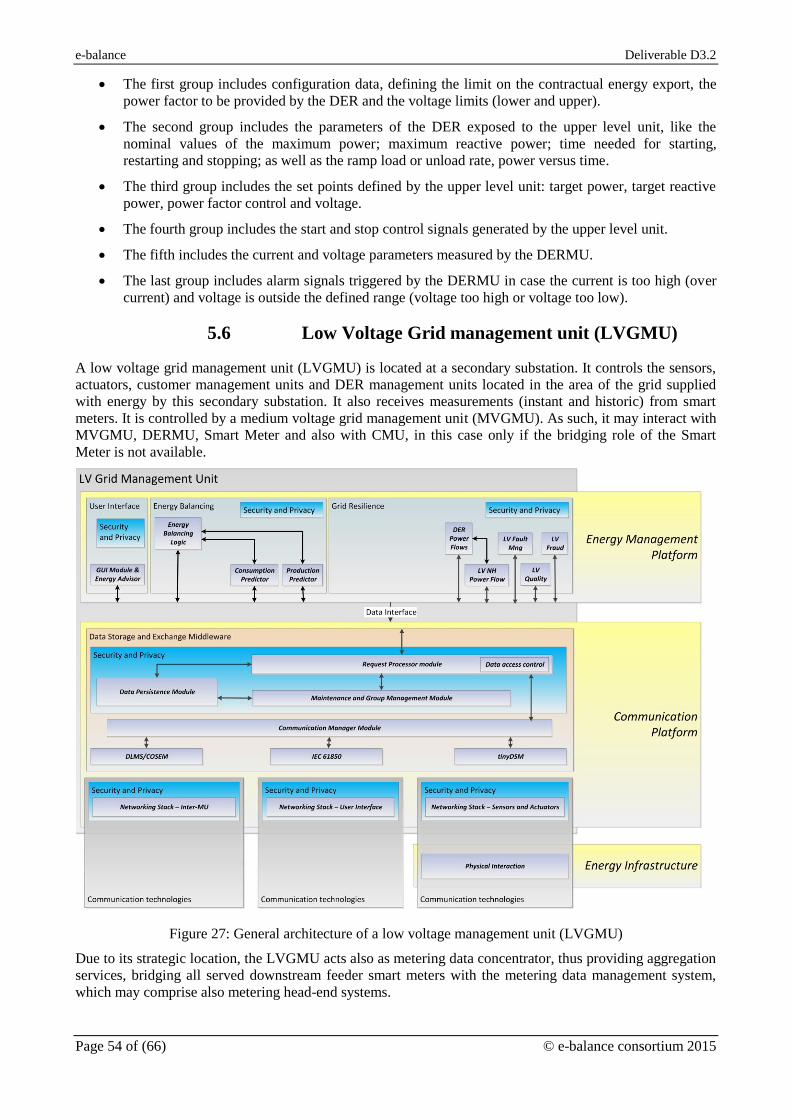
5.6 Low Voltage Grid management unit (LVGMU) .............................................................................. 54 5.6.1 Hardware considerations............................................................................................................ 55 5.6.2 Data gathered and generated by the unit .................................................................................... 55
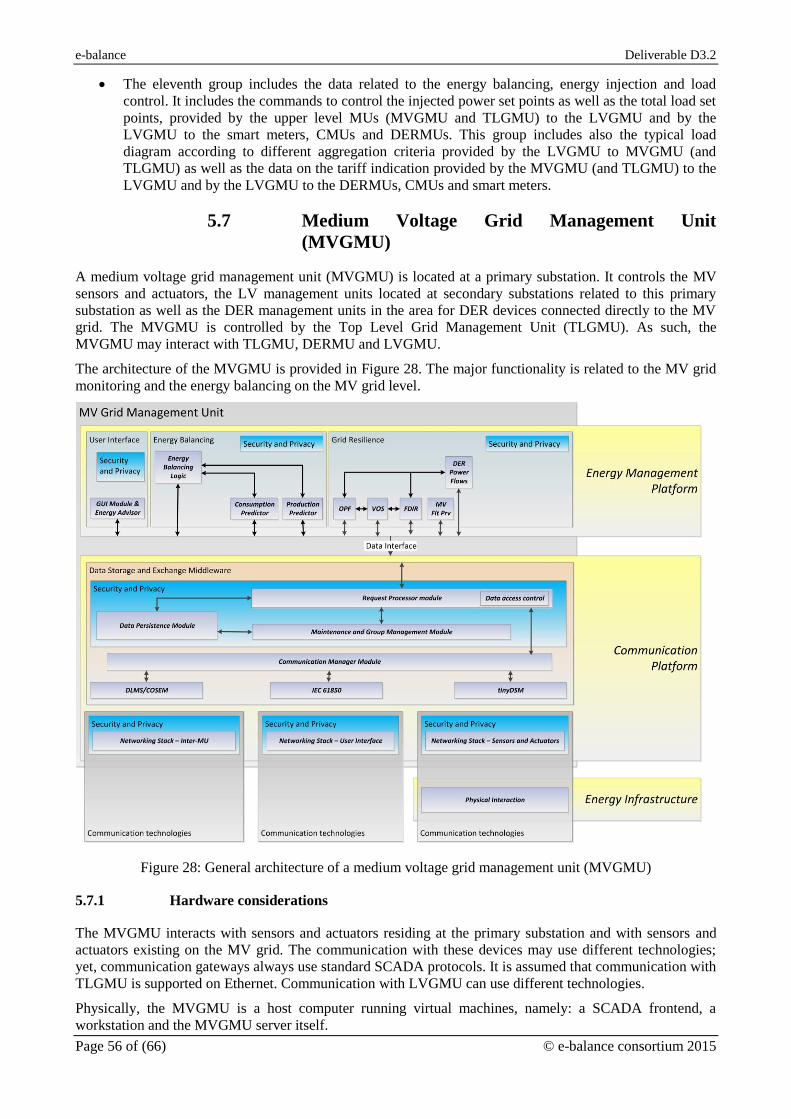
5.7 Medium Voltage Grid Management Unit (MVGMU) ...................................................................... 56 5.7.1 Hardware considerations............................................................................................................ 56
Page 6
e-balance Deliverable D3.2
Page 6 of (66) © e-balance consortium 2015
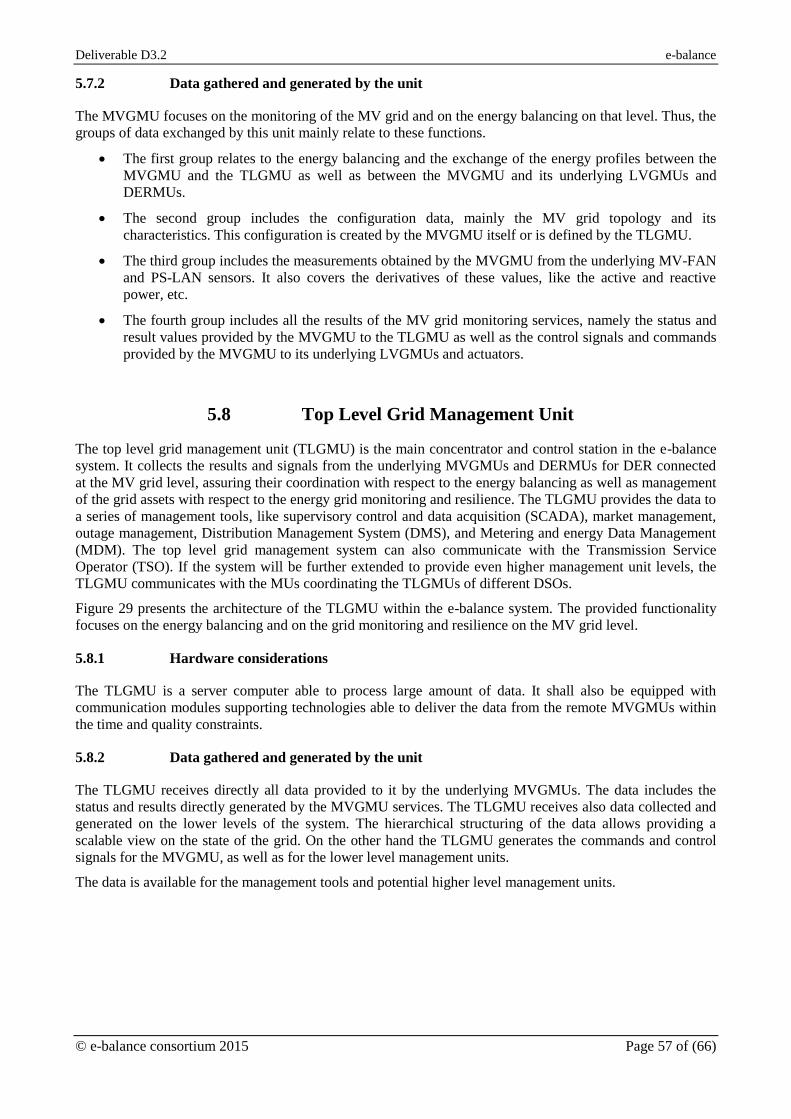
5.7.2 Data gathered and generated by the unit .................................................................................... 57 5.8 Top Level Grid Management Unit .................................................................................................... 57
5.8.1 Hardware considerations............................................................................................................ 57 5.8.2 Data gathered and generated by the unit .................................................................................... 57
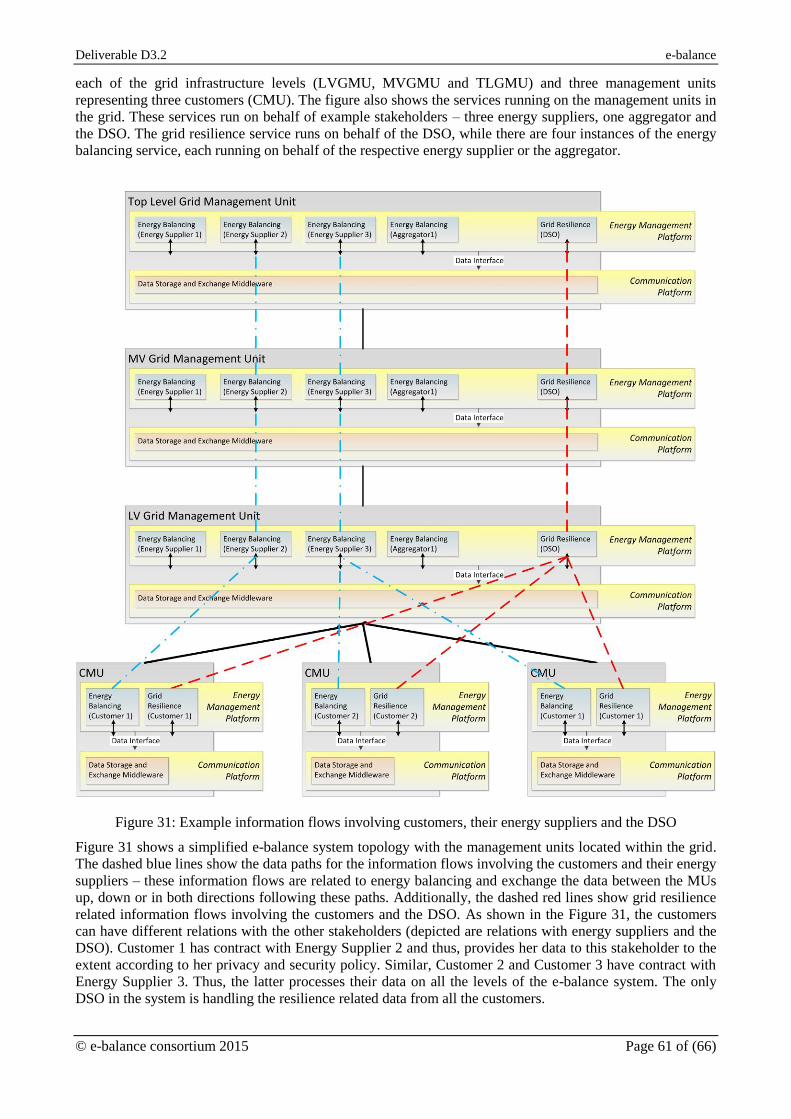
6 Information Flows .................................................................................................................................... 59 6.1 Identification of the Information Flows ............................................................................................ 59 6.2 Data ownership and processing of data ............................................................................................. 60 6.3 Data flows and initial analysis of security aspects ............................................................................ 62
7 Summary and Conclusions ....................................................................................................................... 65 References ....................................................................................................................................................... 66
Page 7
Deliverable D3.2 e-balance
© e-balance consortium 2015 Page 7 of (66)
List of Figures
Figure 1: The position of the deliverable D3.2 within the e-balance project work package structure ............ 11 Figure 2: The system level architecture – distribution of the e-balance management units within the grid ... 12 Figure 3: The general architecture of an e-balance management unit ............................................................. 15 Figure 4: Asynchronous request handling ....................................................................................................... 17 Figure 5: Data Interface in the context of the e-balance Middleware ............................................................. 18 Figure 6: The e-balance management unit architecture – the system architecture .......................................... 22 Figure 7: Architecture of the e-balance communication platform ................................................................... 23 Figure 8: Communication manager module .................................................................................................... 23 Figure 9: Maintenance and group management module .................................................................................. 24 Figure 10: Request processor module ............................................................................................................. 25 Figure 11: Data access control module ............................................................................................................ 25 Figure 12: Data Persistence Module ................................................................................................................ 25 Figure 13: The IP Network Stack (data plane). ............................................................................................... 26 Figure 14: The architecture of the e-balance energy management platform ................................................... 27 Figure 15: Quality Monitoring module architecture ........................................................................................ 35 Figure 16: Topology assessment of a fault occurring between grid sensors ................................................... 37 Figure 17: Topology assessment of a fault occurring after the last grid sensor .............................................. 38 Figure 18: Topology of a Public Lighting (PL) feeder with several luminaires .............................................. 38 Figure 19: Topology of a Public Lighting (PL) feeder with four sets of luminaires with upstream sensors .. 40 Figure 20: The security architecture of the e-balance management unit ......................................................... 43 Figure 21: The security and privacy module within an Energy Management Platform service ...................... 46 Figure 22: General architecture of a DMU, Sensor or Actuator supporting the e-balance architecture .......... 48 Figure 23: General architecture of a GUI device ............................................................................................. 50 Figure 24: General architecture of the customer management unit (CMU) .................................................... 51 Figure 25: the general architecture of a smart meter supporting the e-balance architecture ........................... 52 Figure 26: General architecture of a DER management unit (DERMU) ........................................................ 53 Figure 27: General architecture of a low voltage management unit (LVGMU).............................................. 54 Figure 28: General architecture of a medium voltage grid management unit (MVGMU) .............................. 56 Figure 29: General architecture of a top level grid management unit (TLGMU) ........................................... 58 Figure 30: Simplified e-balance system level architecture for information flow discussion .......................... 59 Figure 31: Example information flows involving customers, their energy suppliers and the DSO ................ 61
Page 8
e-balance Deliverable D3.2
Page 8 of (66) © e-balance consortium 2015
Abbreviations
ADR Automatic Demand Response
API Application Programming Interface
CEN European Committee for Standardization
CENELEC European Committee for Electrotechnical Standardization
CHP Combined Heat and Power
CMS Central Management System
CMU Customer Management Unit
COSEM Companion Specification for Energy Metering
CP Communication Platform
DAN Device Area Network
DB Database
DER Distributed Energy Resources
DERPF DER Power Flow
DERMU DER Management Unit
DG Distributed Generation
DLMS Device Language Message Specification
DMS Distribution Management System
DMU Device Management Unit
DSO Distribution System Operator
ebEMS e-balance Energy Management System
EMP Energy Management Platform
EMS Energy Management System
ETSI European Telecommunications Standards Institute
EV Electric Vehicle
FAN Field Area Network
FDIR Fault Detection, Isolation and Restoration
FDLIR Fault Detection, Location, Isolation and Restoration
GUI Graphical User Interface
GPRS General Packet Radio Service
GPS Global Positioning System
GW Gateway
HAN Home Area Network
HV High Voltage
IEC International Electrotechnical Commission
ICT Information and Communication Technology
IP Internet Protocol
KPI Key Performance Indicator
LAN Local Area Network
LED Light-emitting diode
LV Low Voltage
LV-FAN Low Voltage Field Area Network
LVGMU LV Grid Management Unit
MAC Media Access Control
MDM Metering and energy Data Management
MU Management Unit
MV Medium Voltage
MV-FAN Medium Voltage Field Area Network
Page 9
Deliverable D3.2 e-balance
© e-balance consortium 2015 Page 9 of (66)
MVFDL Medium Voltage Fault Detection and Location
MVGMU MV Grid Management Unit
NPF Neighbourhood Power Flow
NSI Network Stack Interface
OPF Optimized Power Flow
PC Personal Computer
PL Power Line
PLC Power Line Communication
PS Primary Substation
PS-LAN Primary Substation Local Area Network
PV Photovoltaic Panel
RES Renewable Energy Source
RF Radio Frequency
RTDB Real-time Database
QoS Quality of Service
S&A Sensors and Actuators
SCADA Supervisory Control And Data Acquisition
SGAM Smart Grid Architecture Model
SM Smart Meter
SQL Structured Query Language
SS Secondary Substation
SS-LAN Secondary Substation Local Area Network
TCP Transmission Control Protocol
TLGMU Top Level Grid Management Unit
TSO Transmission System Operator
UDP User Datagram Protocol
VOS Validation Optimized Solutions
VVC Voltage Var Control
WAN Wide Area Network
WP Work Package
Page 10
e-balance Deliverable D3.2
Page 10 of (66) © e-balance consortium 2015
1 Introduction
The main objective of the e-balance project is to design a smart and robust energy management system for
the future electricity grid. This document provides the technical specification of this system that can be used
as a base for the implementation of the project demonstrators, but also for the implementation of future
deployments of the system.
This approach is based on the high level specification defined in deliverable D3.1 [3] and extends the
description by providing the technical details of the involved functional modules as well as the information
on the data to be exchanged. Both these factors influence the requirements on the applied hardware
components, i.e., the estimated complexity of the software modules together with the definition of the
required data to be exchanged define the hardware requirements that are also addressed in this document.
The system is modular and extendible in both aspects, i.e., if necessary additional modules can be defined
and also additional data sets can be defined to provide additional functionality.
In Section 2 we start with a short review of the high level architecture of the e-balance system. We describe
the management unit architecture and the distribution of the management units within the grid. This allows to
keep the document complete and to provide the detailed system specification based on the high level
description.
Section 3 describes the data interface between the energy management platform and the communication
platform, i.e., the two main building blocks of the e-balance system. In short, the communication platform
provides the data exchange abstraction for the services executed by the energy management platform. The
latter may access the data without being engaged in the details of the communication platform or the details
on the security implementation at that level. All these aspects are covered by the data interface.
Section 4 introduces all the individual modules. Their functionality is described together with the (abstract)
API interfaces and some specific technical requirements. These modules are also combined together in order
to form the complete set of modules available to define a management unit. The interactions between the
modules are also defined at that point. This represents the complete instance of a management unit that will
be then reduced to the necessary functionality to form the individual management units to be applied on each
system level. These specific management units are then described in Section 5. At this point we also define
the data gathered and processed at each kind of management unit.
In Section 6 we consider the data flows in the complete system reflecting the data exchanges between
multiple management units. Here we can identify the data owners and potential security issues that have to
be addressed. As already mentioned, the data sets are not limited to those defined here and are easily
extendible to provide new functionality.
The document is summarised in Section 7.
1.1 Deliverable Position in the Project
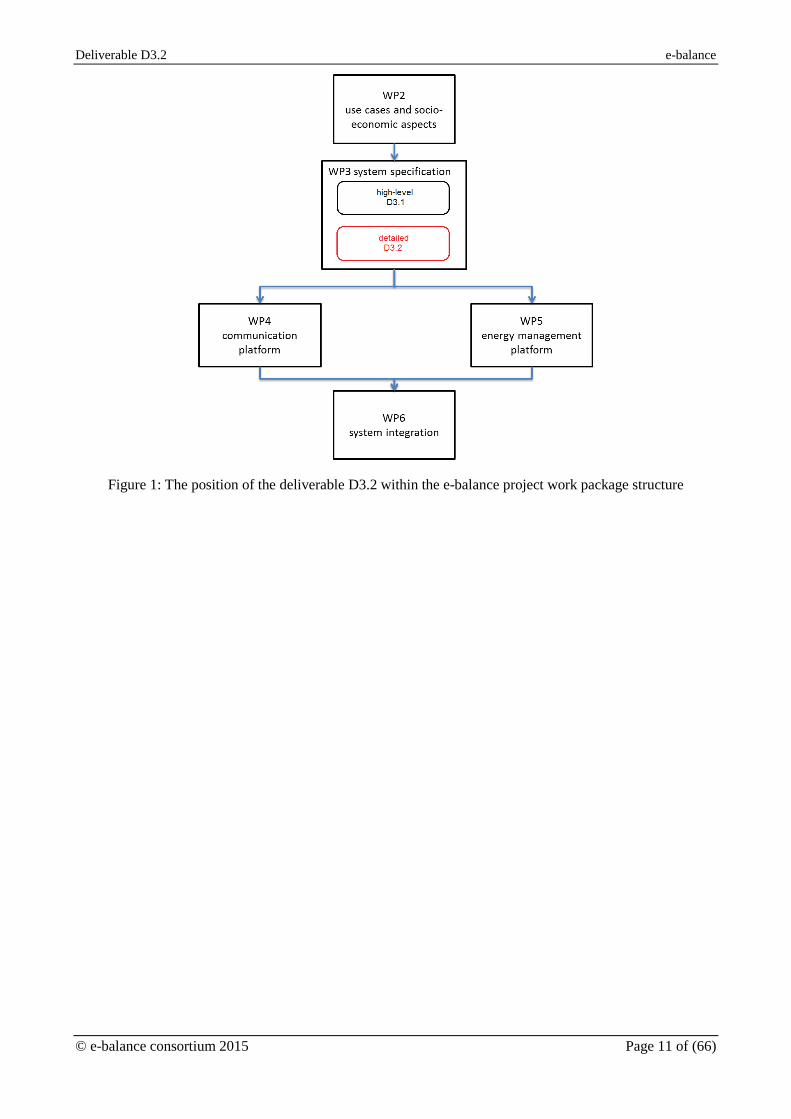
Figure 1 shows the position of this deliverable within the e-balance project. This deliverable is part of work
package 3 – System Specification (WP3). This document provides the more detailed specification of the
system and is an extension to the high-level functional specification we have defined in deliverable D3.1
based on the results obtained in Work Package 2 – Use cases and socio economic aspects (WP2).
The detailed specification directly influences, but also utilises work from WP4 and WP5. The information
provided in this document already considers some aspects we experienced during the first phase of the
development of the modules we describe here. Thus, it is a guideline on how to implement the e-balance
system, but not providing the exact implementation details, since these are very deployment specific.
Page 11
Deliverable D3.2 e-balance
© e-balance consortium 2015 Page 11 of (66)
Figure 1: The position of the deliverable D3.2 within the e-balance project work package structure
Page 12
e-balance Deliverable D3.2
Page 12 of (66) © e-balance consortium 2015
2 The high-level system architecture
This section provides a review of the high-level functional specification of the e-balance system. It provides
a short summary of the deliverable D3.1 with the focus on the architecture of the generic management unit
and on the distribution of the management units within the smart energy grid. But it also already provides
some conceptual extension to the initial functional specification.
2.1 The grid-level e-balance system architecture
This section explains how the system components are mapped onto the grid.
DERManagement
Unit
DERManagement
Unit
DERManagement
Unit
TSO
Smart Meter
Device Management
Unit
Device Management
Unit...
MV GridManagement
Unit
MV Grid Management
Unit
Top level Grid Management Unit
Management units and interfaces
Consumption and Distributed
Generation Level
Distribution Level
Bulk Generation and Transmission
LevelPower Source
Energy Grid Level
...
LV GridManagement
Unit
LV GridManagement
Unit...
Mar
ket,
En
ergy
Acc
ou
nti
ng
Glo
bal
dat
a ac
cess
(w
eath
er f
ore
cast
, etc
.)
Energy Flow
Op
erat
ion
s
HV/MVTransf.
MV/LVTransf.
MVGrid
HomeGrid
DERManagement
Unit...
DERManagement
Unit
...
CustomerManagement Unit
HAN GW
DER Devices
DER Devices
DERManagement
Unit
DER Devices
LVGrid
PS SENSORS and ACTUATORS
MV SENSORS and ACTUATORS
LV SENSORS and ACTUATORS
HAN SENSORS and ACTUATORS
SS SENSORS and ACTUATORS
SS LAN GW
PS LAN GW
MV FAN GW
LV FAN GW
... Smart Meter
Electricity Grid and devices
...
...
Interaction
TSO SENSORS and ACTUATORS
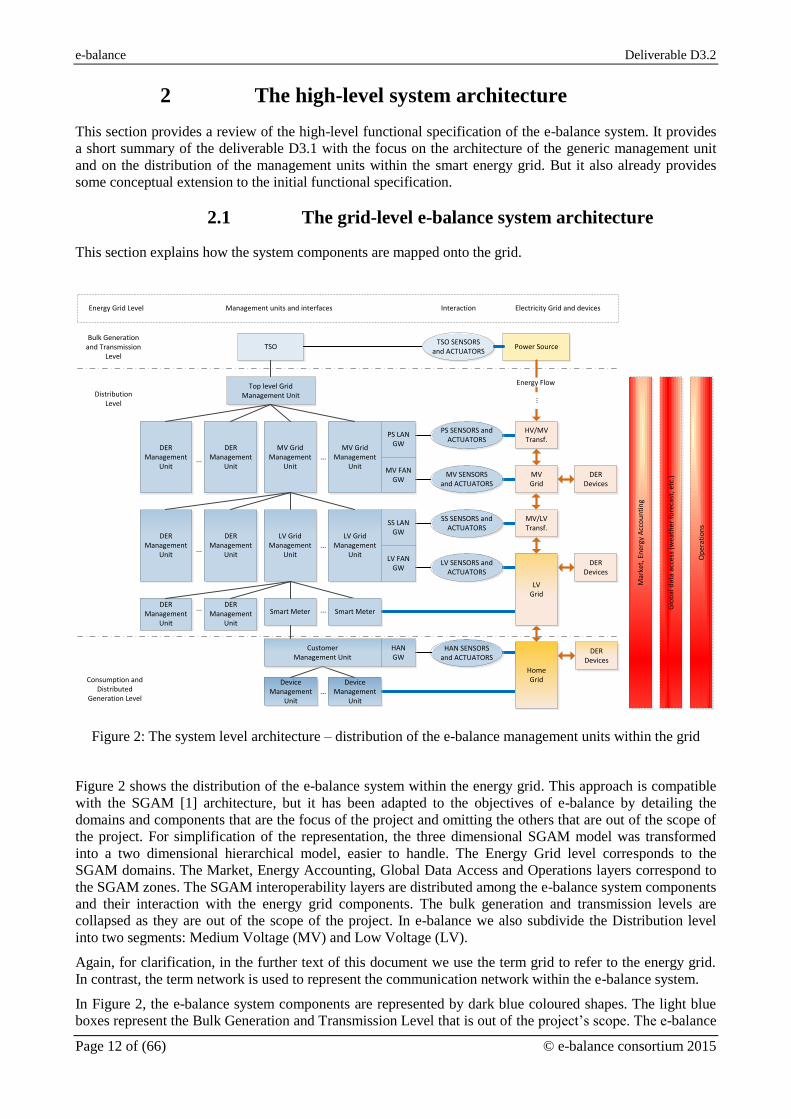
Figure 2: The system level architecture – distribution of the e-balance management units within the grid
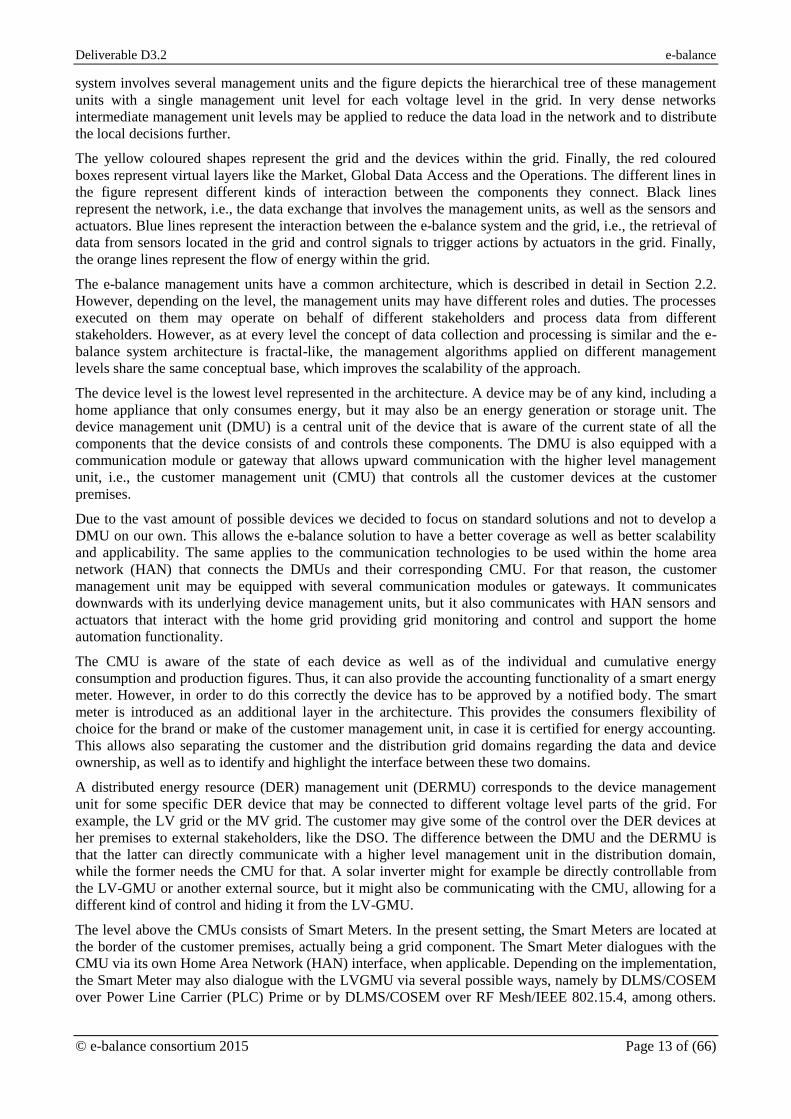
Figure 2 shows the distribution of the e-balance system within the energy grid. This approach is compatible
with the SGAM [1] architecture, but it has been adapted to the objectives of e-balance by detailing the
domains and components that are the focus of the project and omitting the others that are out of the scope of
the project. For simplification of the representation, the three dimensional SGAM model was transformed
into a two dimensional hierarchical model, easier to handle. The Energy Grid level corresponds to the
SGAM domains. The Market, Energy Accounting, Global Data Access and Operations layers correspond to
the SGAM zones. The SGAM interoperability layers are distributed among the e-balance system components
and their interaction with the energy grid components. The bulk generation and transmission levels are
collapsed as they are out of the scope of the project. In e-balance we also subdivide the Distribution level
into two segments: Medium Voltage (MV) and Low Voltage (LV).
Again, for clarification, in the further text of this document we use the term grid to refer to the energy grid.
In contrast, the term network is used to represent the communication network within the e-balance system.
In Figure 2, the e-balance system components are represented by dark blue coloured shapes. The light blue
boxes represent the Bulk Generation and Transmission Level that is out of the project’s scope. The e-balance
Page 13
Deliverable D3.2 e-balance
© e-balance consortium 2015 Page 13 of (66)
system involves several management units and the figure depicts the hierarchical tree of these management
units with a single management unit level for each voltage level in the grid. In very dense networks
intermediate management unit levels may be applied to reduce the data load in the network and to distribute
the local decisions further.
The yellow coloured shapes represent the grid and the devices within the grid. Finally, the red coloured
boxes represent virtual layers like the Market, Global Data Access and the Operations. The different lines in
the figure represent different kinds of interaction between the components they connect. Black lines
represent the network, i.e., the data exchange that involves the management units, as well as the sensors and
actuators. Blue lines represent the interaction between the e-balance system and the grid, i.e., the retrieval of
data from sensors located in the grid and control signals to trigger actions by actuators in the grid. Finally,
the orange lines represent the flow of energy within the grid.
The e-balance management units have a common architecture, which is described in detail in Section 2.2.
However, depending on the level, the management units may have different roles and duties. The processes
executed on them may operate on behalf of different stakeholders and process data from different
stakeholders. However, as at every level the concept of data collection and processing is similar and the e-
balance system architecture is fractal-like, the management algorithms applied on different management
levels share the same conceptual base, which improves the scalability of the approach.
The device level is the lowest level represented in the architecture. A device may be of any kind, including a
home appliance that only consumes energy, but it may also be an energy generation or storage unit. The
device management unit (DMU) is a central unit of the device that is aware of the current state of all the
components that the device consists of and controls these components. The DMU is also equipped with a
communication module or gateway that allows upward communication with the higher level management
unit, i.e., the customer management unit (CMU) that controls all the customer devices at the customer
premises.
Due to the vast amount of possible devices we decided to focus on standard solutions and not to develop a
DMU on our own. This allows the e-balance solution to have a better coverage as well as better scalability
and applicability. The same applies to the communication technologies to be used within the home area
network (HAN) that connects the DMUs and their corresponding CMU. For that reason, the customer
management unit may be equipped with several communication modules or gateways. It communicates
downwards with its underlying device management units, but it also communicates with HAN sensors and
actuators that interact with the home grid providing grid monitoring and control and support the home
automation functionality.
The CMU is aware of the state of each device as well as of the individual and cumulative energy
consumption and production figures. Thus, it can also provide the accounting functionality of a smart energy
meter. However, in order to do this correctly the device has to be approved by a notified body. The smart
meter is introduced as an additional layer in the architecture. This provides the consumers flexibility of
choice for the brand or make of the customer management unit, in case it is certified for energy accounting.
This allows also separating the customer and the distribution grid domains regarding the data and device
ownership, as well as to identify and highlight the interface between these two domains.
A distributed energy resource (DER) management unit (DERMU) corresponds to the device management
unit for some specific DER device that may be connected to different voltage level parts of the grid. For
example, the LV grid or the MV grid. The customer may give some of the control over the DER devices at
her premises to external stakeholders, like the DSO. The difference between the DMU and the DERMU is
that the latter can directly communicate with a higher level management unit in the distribution domain,
while the former needs the CMU for that. A solar inverter might for example be directly controllable from
the LV-GMU or another external source, but it might also be communicating with the CMU, allowing for a
different kind of control and hiding it from the LV-GMU.
The level above the CMUs consists of Smart Meters. In the present setting, the Smart Meters are located at
the border of the customer premises, actually being a grid component. The Smart Meter dialogues with the
CMU via its own Home Area Network (HAN) interface, when applicable. Depending on the implementation,
the Smart Meter may also dialogue with the LVGMU via several possible ways, namely by DLMS/COSEM
over Power Line Carrier (PLC) Prime or by DLMS/COSEM over RF Mesh/IEEE 802.15.4, among others.
Page 14
e-balance Deliverable D3.2
Page 14 of (66) © e-balance consortium 2015
The Smart Meter may also communicate directly with an upper level metering management system, out of
scope of the e-balance architecture.
The level above the CMUs and Smart Meters consists of low voltage grid management units (LVGMU). In
the presented setting, these management units are located at the secondary substations and each of them
controls the sensors, actuators, CMUs (directly or via Smart Meters) and DERMUs located in the area of the
grid, supplied with energy by this secondary substation. A LVGMU is equipped with communication
gateways for the upward and downward communication within the e-balance management hierarchy. It is
also equipped with communication gateways for communication with sensors and actuators located at the
MV/LV transformer (Secondary Substation Local Area Network – SS-LAN) and also in the LV grid feeders
related to the secondary substation (Low Voltage Field Area Network – LV-FAN). All these communication
gateways may be different, depending on the technologies used in each part of the network.
A medium voltage (MV) grid management unit (MVGMU) is similar to its counterpart for the low voltage.
A MV grid management unit resides at a primary substation. It is equipped with upward and downward
communication gateways and controls all the sensors, actuators in the MV grid and LVGMUs located at
secondary substations related to this primary substation. It also controls the DERMUs related to MV grid
connected DER in this area. In order to interact with the sensors and actuators at the HV/MV transformer,
the MV grid management unit is equipped with Primary Substation Local Area Network (PS-LAN) gateway.
Similar, for communicating with the sensors and actuators in the MV grid related to the primary substation
the Medium Voltage Field Area Network (MV-FAN) gateway is available at the MV grid management unit.
Again, the communication gateways may use different communication technologies.
The top level grid management unit (TLGMU) controls all MVGMUs as well as all the DERMUs for DER
connected directly to the MV grid, i.e., it collects all the status data and sends control signals to all the lower
level management units. The top level grid management unit may be considered as a control centre that
provides also interfaces for management tools, like supervisory control and data acquisition (SCADA),
market management, outage management, Distribution Management System (DMS), and Metering and
energy Data Management (MDM). The top level grid management system communicates also with the
Transmission Service Operator (TSO).
At the bulk generation and transmission level, the TSO may also use sensors and actuators to interact with
the transmission grid and the generation that are defined as the Power Source in the figure.
The e-balance fractal-like approach can reach even further, creating higher levels in the hierarchy with
management units that provide bulk balancing for the entire Europe. This is the power of this approach and it
provides scalability for the energy balancing.
The detailed management unit level architecture is presented in the following section.
2.2 Management Unit Architecture
An e-balance management unit controls all its directly subordinate system elements, i.e., lower level
management units, sensors and actuators. It takes control decisions based on the user configuration and
interaction as well as on the context consisting of data received from its parent management unit and the data
obtained from these subordinate system elements.
The core functionality of the management unit that interacts with the respective part of the energy
infrastructure is split into two main blocks, i.e., the communication platform (CP) and the energy
management platform (EMP). The former is responsible for data gathering and exchange within the network,
while the latter represents the logic that takes the local decisions based on the data. This logic is realized as a
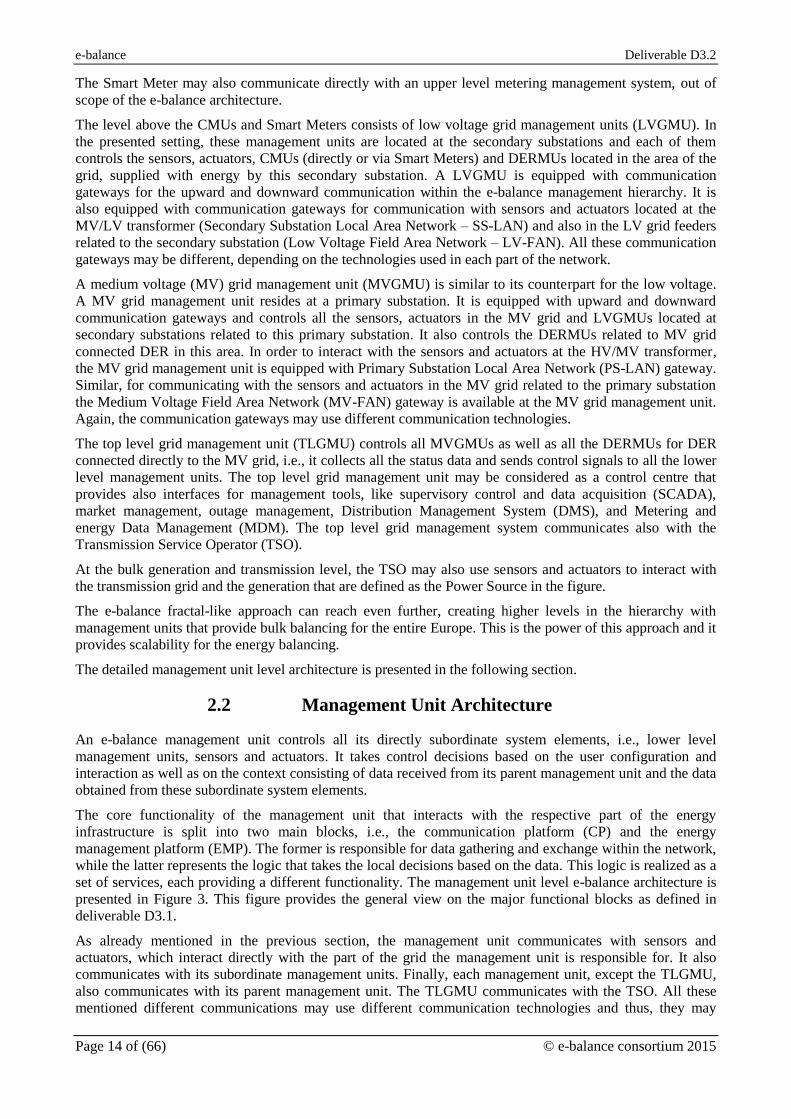
set of services, each providing a different functionality. The management unit level e-balance architecture is
presented in Figure 3. This figure provides the general view on the major functional blocks as defined in
deliverable D3.1.
As already mentioned in the previous section, the management unit communicates with sensors and
actuators, which interact directly with the part of the grid the management unit is responsible for. It also
communicates with its subordinate management units. Finally, each management unit, except the TLGMU,
also communicates with its parent management unit. The TLGMU communicates with the TSO. All these
mentioned different communications may use different communication technologies and thus, they may
Page 15
Deliverable D3.2 e-balance
© e-balance consortium 2015 Page 15 of (66)
require different networking protocol stacks. Thus, the management unit architecture shown in Figure 3,
allows several networking protocol stacks, each for a different purpose.
The data storage and exchange middleware is placed on top of the networking stacks. Its aim is to provide
the abstract and common data addressing, data access and data exchange between different management
units. The middleware is supported by the security and privacy mechanisms to protect the exchanged data. It
provides the data interface that connects the communication platform and the energy management platform
and allows the latter to access the data.
The energy management platform is placed on top of the communication platform. It includes the logic
modules or services that perform different kind of operations based on the data provided by the
communication platform and also provide their results and control signals back through the communication
platform as well. These services are supported by security and privacy mechanisms that operate at a higher
level than their counterparts of the communication platform. Currently we have defined only two such
services (energy balancing and grid resilience), but the general e-balance approach is not limited to these
two.
Management Unit
Energy Management Platform
Energy Infrastructure
Communication Platform
Security and Privacy Mechanisms Data Storage and Exchange Middleware
Communication technologies
NetworkingStack
Upward
Communication technologies
Networking Stack
Sensors0
Data Interface
Security and Privacy Mechanisms
Communication technologies
Networking Stack
Sensorsn
Communication technologies
Networking Stack
Downward
Energy Balancing Grid Resilience
Sensor Interface
Interaction
...
Communication technologies
NetworkingStack
User Interface
Figure 3: The general architecture of an e-balance management unit
The energy balancing service provides the estimates for energy to be produced and consumed in the (near)
future. This estimation is based on the historic consumption data, but also on additional parameters, like the
weather and weather forecast data. This service compares the predicted values with the actual situation and
triggers actions on the devices and units under its control to keep its part of the grid in a stable state with
respect to energy production and consumption. On the other hand, the grid resilience service analyses the
state of its part of the grid and generates control signals to control the grid quality of service, safety and
overall operational performance.
These two above mentioned services are responsible for different aspects but they cooperate closely. They
provide the status and summary to their counterparts on the parent management unit and generate control
signals for the subordinate management units and actuators in the part of the grid; their local management
unit is responsible for. These control signals steer the actions necessary for energy balancing and
management.
The communication platform can be regarded as a distributed and secure data exchange platform whereas the
energy management platform stands for centralized or distributed logic within the grid.
Page 16
e-balance Deliverable D3.2
Page 16 of (66) © e-balance consortium 2015
3 The e-balance Data Interface
The data interface is provided by the data storage and exchange middleware. It defines the data exchange
between the communication platform and the energy management platform. The data interface is data centric
and allows exchanging defined data elements (variables) between the two major parts of the system.
The data structure containing a variable stores the respective value, but it also stores the meta-data that is
used to identify and address the data within the system and the middleware. This meta-data provides a
multidimensional address space allowing identifying the data in the temporal and the spatial domain.
The data structure that stores a given instance (value) of the variable contains the following items:
Identifier of the variable, e.g., current, voltage, temperature, wind direction, solar radiation, etc.,
Value of the specific instance of the variable,
Temporal identification of the instance, e.g., a timestamp,
Spatial identification of the instance, e.g., unit identifier, geo-coordinates, location in the hierarchy,
Identifier of the instance owner,
The privacy and security policy defined by the data owner for this specific instance.
The Data Interface operates on such data structures and allows executing the following requests/operations:
Query,
Write,
Subscription to an event,
Periodic subscription.
These requests are executed or rejected based on the policy defined by the data owner. The access policy
check is realized for each data item to be delivered, allowing for instance to limit the frequency the values of
a variable may be received by some specific stakeholder or by all stakeholders.
Thus, the data interface also provides access control for the stored data. The data access requests are
generated by the services in the energy management platform that request the data from the communication
platform on behalf of some stakeholder. And the data access is only provided to authorised stakeholders.
This means that the stakeholders being the sources of the data access requests are authenticated and their
authorisation is validated. Thus, before the data is delivered the services have to identify themselves as well
as the stakeholder they work for.
The access to the data is granted or denied according to the data specific access strategy (privacy and
security policy definitions) specified by the data owner (data source). This policy is stored within the data
structure in the middleware at the management unit close to the data owner, but may also be replicated on
other units for performance and data availability reasons. The data owner may specify an individual access
strategy for each instance of the variable separately. This definition is then stored and transmitted together
with the data structure containing the specific value of the variable. This approach allows checking and
enforcing the access policy without the need to obtain this policy from the data source, even if the data is
replicated on remote management unit. Additionally, it allows changing the access policy for new values
without affecting the data that was generated prior to this policy change. This solution protects the interests
of all the stakeholders, both producing and consuming the data.
3.1 Communication Pattern
A smart grid is composed of a high number of heterogeneous devices, each one of them with different
requirements and limitations. Because of that, the data interface provided by the smart grid communication
platform must support the different communication patterns and requirements of this complex system. The
interface of the e-balance middleware has been designed taking into account a communication model based
on queries and events.
The query can be used to obtain on-demand information. These requests are handled asynchronously,
meaning that once the request is carried out, the response is provided asynchronously. The request caller can
continue executing the program logic and will be automatically notified by the system when the result of the
request is locally available. This allows applying any underlying communication technology, not setting any
Page 17
Deliverable D3.2 e-balance
© e-balance consortium 2015 Page 17 of (66)
requirements, like guaranteed delivery time, etc. Exceptions, like timeouts have to be handled by the local
instance of the middleware, informing the request source about the communication incidents.
On the other hand, notifications are modelled using the publish/subscribe paradigm. This is one of the most
often used patterns in distributed systems. It is popular mainly due to its capability of providing a loosely
coupled form of interaction. Subscribers express their interests in an event described by some condition or a
set of such events and are subsequently notified in the case this event occurs by publishers. An event
notification is asynchronously propagated to all subscribers that registered the interest in that given event.
The strength of this event-based interacting style lies in the full decoupling in time, space and
synchronization between publishers and subscribers.
The publish/subscribe pattern allows subscribing to a specific condition on a variable (value based or
periodic notifications). On the other hand, the e-balance system offers also the possibility to execute on-
demand requests to collect information. This communication pattern gives the system additional flexibility as
it allows consulting the value of a specific variable in a given moment. All the communications required by
the e-balance system can be modelled using these two well-known patterns.
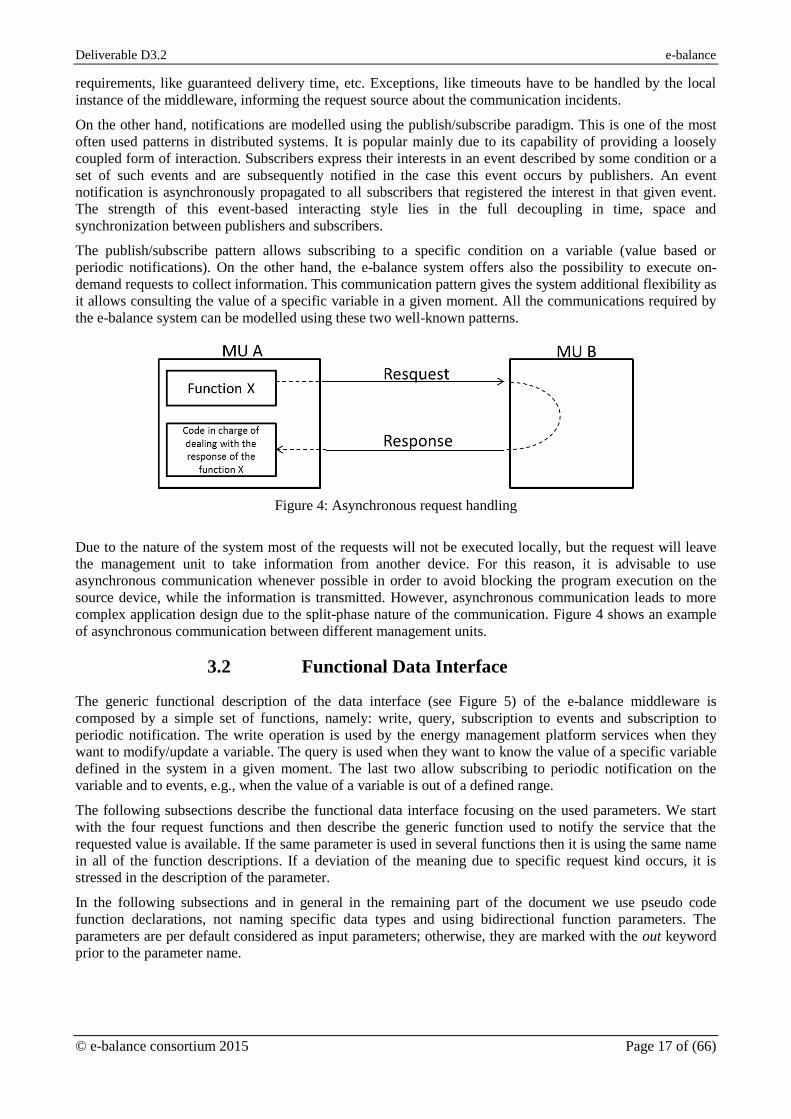
Figure 4: Asynchronous request handling
Due to the nature of the system most of the requests will not be executed locally, but the request will leave
the management unit to take information from another device. For this reason, it is advisable to use
asynchronous communication whenever possible in order to avoid blocking the program execution on the
source device, while the information is transmitted. However, asynchronous communication leads to more
complex application design due to the split-phase nature of the communication. Figure 4 shows an example
of asynchronous communication between different management units.
3.2 Functional Data Interface
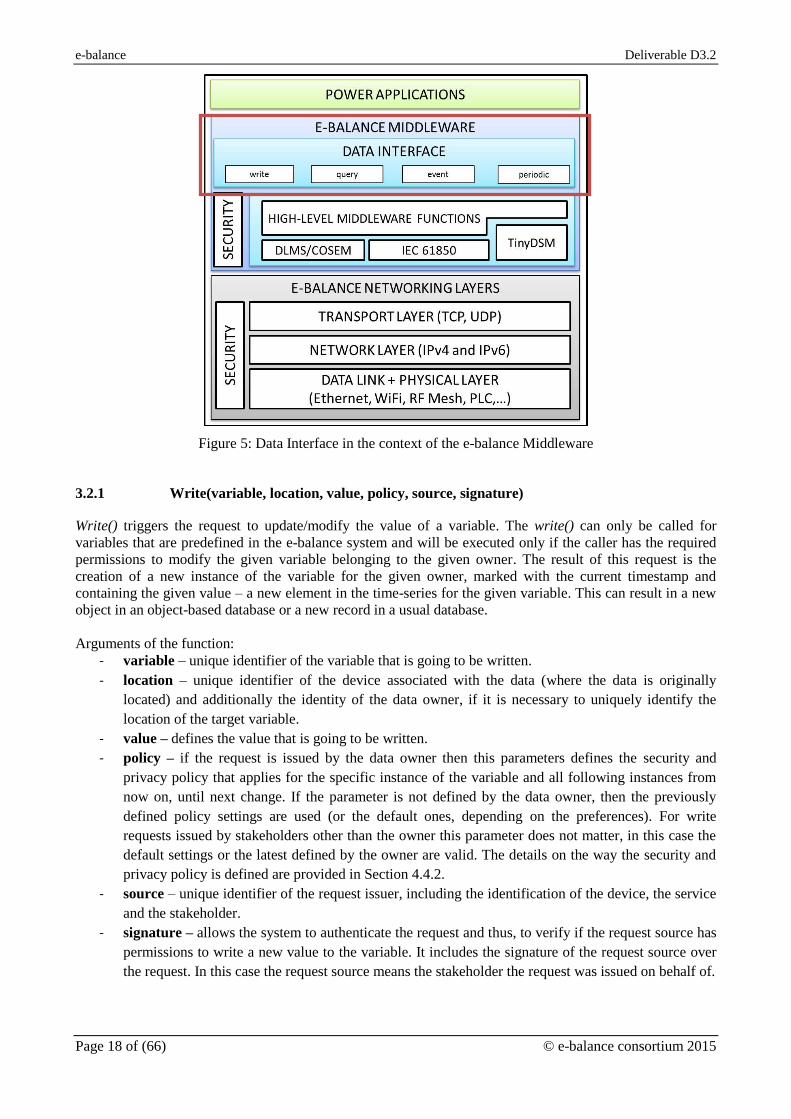
The generic functional description of the data interface (see Figure 5) of the e-balance middleware is
composed by a simple set of functions, namely: write, query, subscription to events and subscription to
periodic notification. The write operation is used by the energy management platform services when they
want to modify/update a variable. The query is used when they want to know the value of a specific variable
defined in the system in a given moment. The last two allow subscribing to periodic notification on the
variable and to events, e.g., when the value of a variable is out of a defined range.
The following subsections describe the functional data interface focusing on the used parameters. We start
with the four request functions and then describe the generic function used to notify the service that the
requested value is available. If the same parameter is used in several functions then it is using the same name
in all of the function descriptions. If a deviation of the meaning due to specific request kind occurs, it is
stressed in the description of the parameter.
In the following subsections and in general in the remaining part of the document we use pseudo code
function declarations, not naming specific data types and using bidirectional function parameters. The
parameters are per default considered as input parameters; otherwise, they are marked with the out keyword
prior to the parameter name.
Page 18
e-balance Deliverable D3.2
Page 18 of (66) © e-balance consortium 2015
Figure 5: Data Interface in the context of the e-balance Middleware
3.2.1 Write(variable, location, value, policy, source, signature)
Write() triggers the request to update/modify the value of a variable. The write() can only be called for
variables that are predefined in the e-balance system and will be executed only if the caller has the required
permissions to modify the given variable belonging to the given owner. The result of this request is the
creation of a new instance of the variable for the given owner, marked with the current timestamp and
containing the given value – a new element in the time-series for the given variable. This can result in a new
object in an object-based database or a new record in a usual database.
Arguments of the function:
- variable – unique identifier of the variable that is going to be written.
- location – unique identifier of the device associated with the data (where the data is originally
located) and additionally the identity of the data owner, if it is necessary to uniquely identify the
location of the target variable.
- value – defines the value that is going to be written.
- policy – if the request is issued by the data owner then this parameters defines the security and
privacy policy that applies for the specific instance of the variable and all following instances from
now on, until next change. If the parameter is not defined by the data owner, then the previously
defined policy settings are used (or the default ones, depending on the preferences). For write
requests issued by stakeholders other than the owner this parameter does not matter, in this case the
default settings or the latest defined by the owner are valid. The details on the way the security and
privacy policy is defined are provided in Section 4.4.2.
- source – unique identifier of the request issuer, including the identification of the device, the service
and the stakeholder.
- signature – allows the system to authenticate the request and thus, to verify if the request source has
permissions to write a new value to the variable. It includes the signature of the request source over
the request. In this case the request source means the stakeholder the request was issued on behalf of.
Page 19
Deliverable D3.2 e-balance
© e-balance consortium 2015 Page 19 of (66)
Return parameters:
- result – the return code that defines the result of the request issuing.
- writeID – specifies the unique identifier of the issued write request allowing handling the reply
correctly.
3.2.2 Query(variable, location, condition, function, source, signature)
This function triggers an asynchronously handled request for reading the value of a specific variable from a
defined location.
Arguments of the function:
- variable – unique identifier of the variable that is going to be read.
- location – unique identifier of the device associated with the data (where the data is originally
located) and additionally the identity of the data owner, if it is necessary to uniquely identify the
location of the target variable.
- condition – allows refining the read request by specifying the data of interest. This parameter can be
regarded as the WHERE clause in a SQL query. The condition can use different fields of the
variables, like the timestamp. An example condition for the read request is the creation of an
aggregate over time, so choosing instances of the variable with timestamp between two defined
values. Together with the function parameter the aggregation is defined precisely.
- function – defines the aggregation function to be applied on the values of the variable if the
condition parameter addresses several instances of the variable to satisfy the restriction that the
request has to result in a single value only. Includes aggregation functions like average, minimum,
maximum, etc.
- source – unique identifier of the request issuer, including the identification of the device, the service
and the stakeholder.
- signature – allows the system to authenticate the request and thus, to verify if the request source has
permissions to read the variable. It includes the signature of the request source over the request. In
this case the request source means the stakeholder the request was issued on behalf of.
Return parameters:
- result – the return code that defines the result of the request issuing.
- queryID – specifies the unique identifier of the issued read request allowing handling the reply
correctly.
3.2.3 Event(variable, location, condition, source, signature)
This function allows the request source to start monitoring a given variable from a defined location with a
defined condition that triggers an event and as a result causes issuing a notification to the request source
about the occurrence of the event.
Arguments of the function:
- variable – unique identifier of the variable that is going to be monitored.
- location – unique identifier of the device associated with the data (where the data is originally
located) and additionally the identity of the data owner, if it is necessary to uniquely identify the
location of the target variable.
- condition – allows defining the event condition that shall be applied for the monitored variable. This
parameter can be again regarded as the WHERE clause in a SQL query. But in this case the
condition is applied on instances of the variable that will be created after defining the monitoring and
causes notification of the request source about occurrences of the defined event every time the new
instance of the variable satisfies the condition. An example condition for monitoring a variable can
be defined to notify the source if the value is greater than a given threshold.
Page 20
e-balance Deliverable D3.2
Page 20 of (66) © e-balance consortium 2015
- source – unique identifier of the request issuer, including the identification of the device, the service
and the stakeholder.
- signature – allows the system to authenticate the request and thus, to verify if the request source has
permissions to read the variable. It includes the signature of the request source over the request. In
this case the request source means the stakeholder the request was issued on behalf of.
Return parameters:
- result – the return code that defines the result of the request issuing.
- eventID – specifies the unique identifier of the defined event allowing handling the replies correctly
and allowing unsubscribing from the notifications and disabling the monitoring.
3.2.4 Periodic(variable, location, period, source, signature)
This request allows subscribing to periodical notifications about the defined variable. An example can be a
periodic reading of the variable storing the energy consumption to be refreshed on the customer GUI every
minute. The difference to events is that there is no condition based on the value of the variable, instead the
period between the notifications is defined. It is possible to have multiple events defined for a single variable
for the same data owner, but it is possible to define only a single periodic subscription for one variable from
a single data owner.
Arguments of the function:
- variable – unique identifier of the variable that is going to be monitored.
- location – unique identifier of the device associated with the data (where the data is originally
located) and additionally the identity of the data owner, if it is necessary to uniquely identify the
location of the target variable.
- period – indicates the intended delay between the consecutive read operations defining the
frequency of the notifications the source subscribes to.
- source – unique identifier of the request issuer, including the identification of the device, the service
and the stakeholder.
- signature – allows the system to authenticate the request and thus, to verify if the request source has
permissions to read the variable. It includes the signature of the request source over the request. In
this case the request source means the stakeholder the request was issued on behalf of.
Return parameters:
- result – the return code that defines the result of the request issuing.
- periodicID – specifies the unique identifier of the defined event allowing handling the replies
correctly and allowing unsubscribing from the notifications and disabling the monitoring.
3.2.5 Unsubscribe(subscriptionID, source, signature)
This function allows unsubscribing from the event or periodic notifications. It deactivates the process that
triggers the notifications.
Arguments of the function:
- subscriptionID – unique identifier of the subscription (periodicID or eventID).
- source – unique identifier of the request issuer, including the identification of the device, the service
and the stakeholder.
- signature – allows the system to authenticate the request and thus, to verify if the request source has
permissions to change the subscription status. It includes the signature of the request source over the
request. In this case the request source means the stakeholder the request was issued on behalf of.
Return parameters:
- result – the return code that defines the result of the request.
Page 21
Deliverable D3.2 e-balance
© e-balance consortium 2015 Page 21 of (66)
3.2.6 Notify(requestID, result, variable, location, value, timestamp)
This function is the call back that has to be implemented by the request source to be notified about the result
of the request processing. For a write request the notification provides the instance of the variable that is the
written one. For queries, the result is the single instance of the variable or the aggregated instances,
depending on the defined condition and the available data. Periodic and event notifications provide always a
single instance of the variable, the periodically read one or the one that triggered the event, respectively.
Arguments of the function:
- requestID – unique identifier of the prior issued request (write or query) or the subscription (event
or periodic). Allows proper handling of the notifications by providing the link between the
notification and the issued request.
- result – the return code that defines the final result of the request processing. In case the processing
was successful the following parameters have meaningful values.
- variable – unique identifier of the variable that is contained in the notification.
- location – unique identifier of the device associated with the requested data (where the data is
originally located) and additionally the identity of the data owner, if it is necessary to uniquely
identify the location of the target variable.
- value – contains the value of the instance of the variable or the aggregated value for multiple
instances of the variable, depending on the query kind.
- timestamp – the timestamp of the instance of the variable or a defined value according to the
aggregation function.
Page 22
e-balance Deliverable D3.2
Page 22 of (66) © e-balance consortium 2015
4 The modules within a management unit
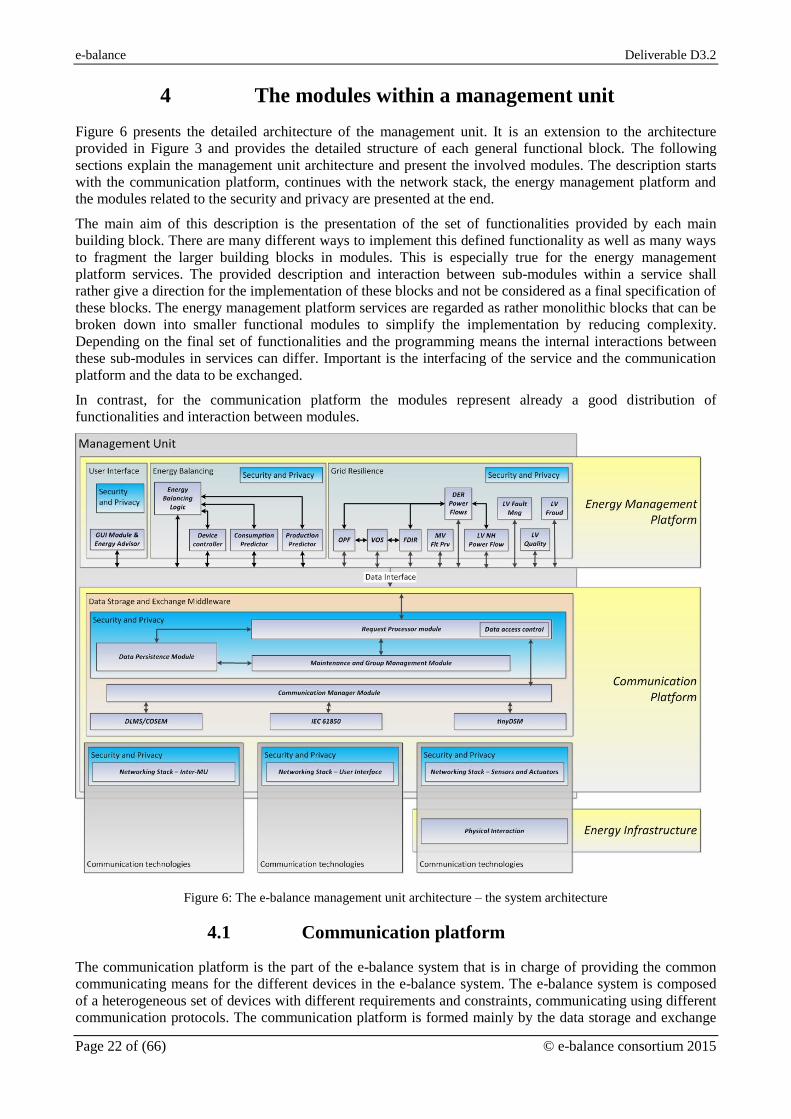
Figure 6 presents the detailed architecture of the management unit. It is an extension to the architecture
provided in Figure 3 and provides the detailed structure of each general functional block. The following
sections explain the management unit architecture and present the involved modules. The description starts
with the communication platform, continues with the network stack, the energy management platform and
the modules related to the security and privacy are presented at the end.
The main aim of this description is the presentation of the set of functionalities provided by each main
building block. There are many different ways to implement this defined functionality as well as many ways
to fragment the larger building blocks in modules. This is especially true for the energy management
platform services. The provided description and interaction between sub-modules within a service shall
rather give a direction for the implementation of these blocks and not be considered as a final specification of
these blocks. The energy management platform services are regarded as rather monolithic blocks that can be
broken down into smaller functional modules to simplify the implementation by reducing complexity.
Depending on the final set of functionalities and the programming means the internal interactions between
these sub-modules in services can differ. Important is the interfacing of the service and the communication
platform and the data to be exchanged.
In contrast, for the communication platform the modules represent already a good distribution of
functionalities and interaction between modules.
Figure 6: The e-balance management unit architecture – the system architecture
4.1 Communication platform
The communication platform is the part of the e-balance system that is in charge of providing the common
communicating means for the different devices in the e-balance system. The e-balance system is composed
of a heterogeneous set of devices with different requirements and constraints, communicating using different
communication protocols. The communication platform is formed mainly by the data storage and exchange
Page 23
Deliverable D3.2 e-balance
© e-balance consortium 2015 Page 23 of (66)
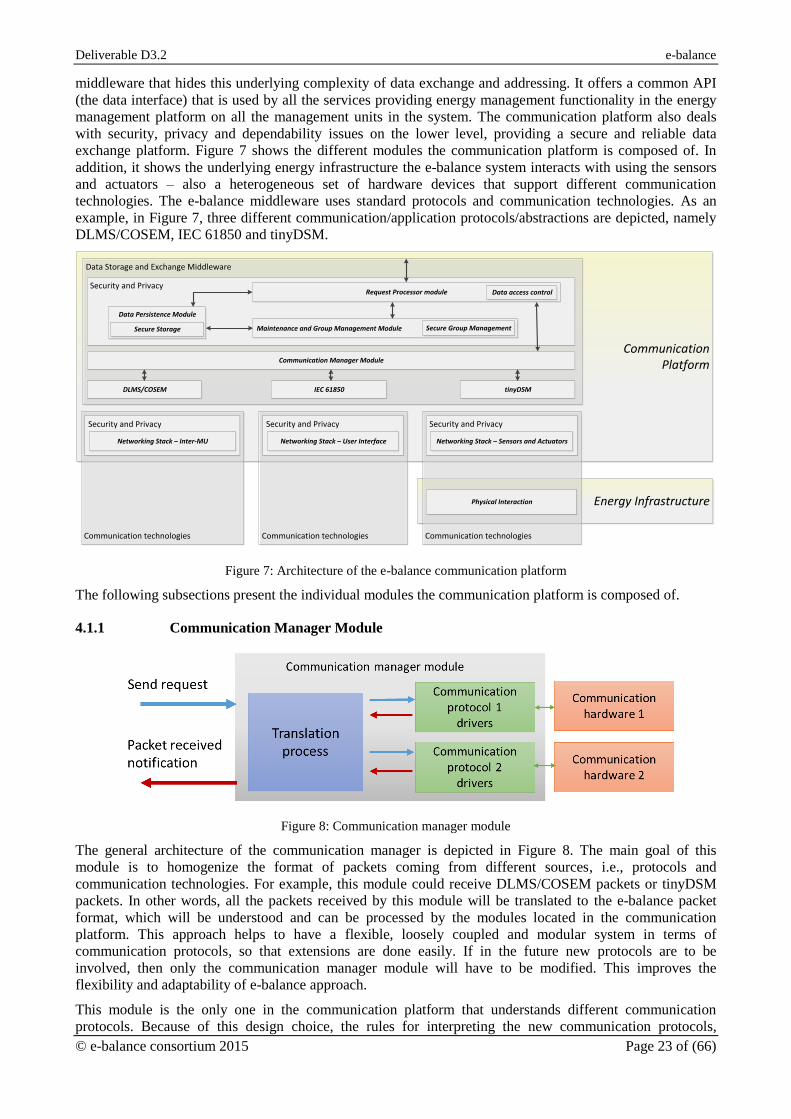
middleware that hides this underlying complexity of data exchange and addressing. It offers a common API
(the data interface) that is used by all the services providing energy management functionality in the energy
management platform on all the management units in the system. The communication platform also deals
with security, privacy and dependability issues on the lower level, providing a secure and reliable data
exchange platform. Figure 7 shows the different modules the communication platform is composed of. In
addition, it shows the underlying energy infrastructure the e-balance system interacts with using the sensors
and actuators – also a heterogeneous set of hardware devices that support different communication
technologies. The e-balance middleware uses standard protocols and communication technologies. As an
example, in Figure 7, three different communication/application protocols/abstractions are depicted, namely
DLMS/COSEM, IEC 61850 and tinyDSM.
Communication Platform
Data Storage and Exchange Middleware
Energy Infrastructure
Security and Privacy
Communication technologiesCommunication technologies
Physical Interaction
Communication technologies
Data Persistence Module
Request Processor module
Communication Manager Module
DLMS/COSEM IEC 61850 tinyDSM
Security and Privacy
Networking Stack – Inter-MU
Security and Privacy
Networking Stack – User Interface
Security and Privacy
Networking Stack – Sensors and Actuators
Data access control
Maintenance and Group Management Module Secure Group ManagementSecure Storage
Figure 7: Architecture of the e-balance communication platform
The following subsections present the individual modules the communication platform is composed of.
4.1.1 Communication Manager Module
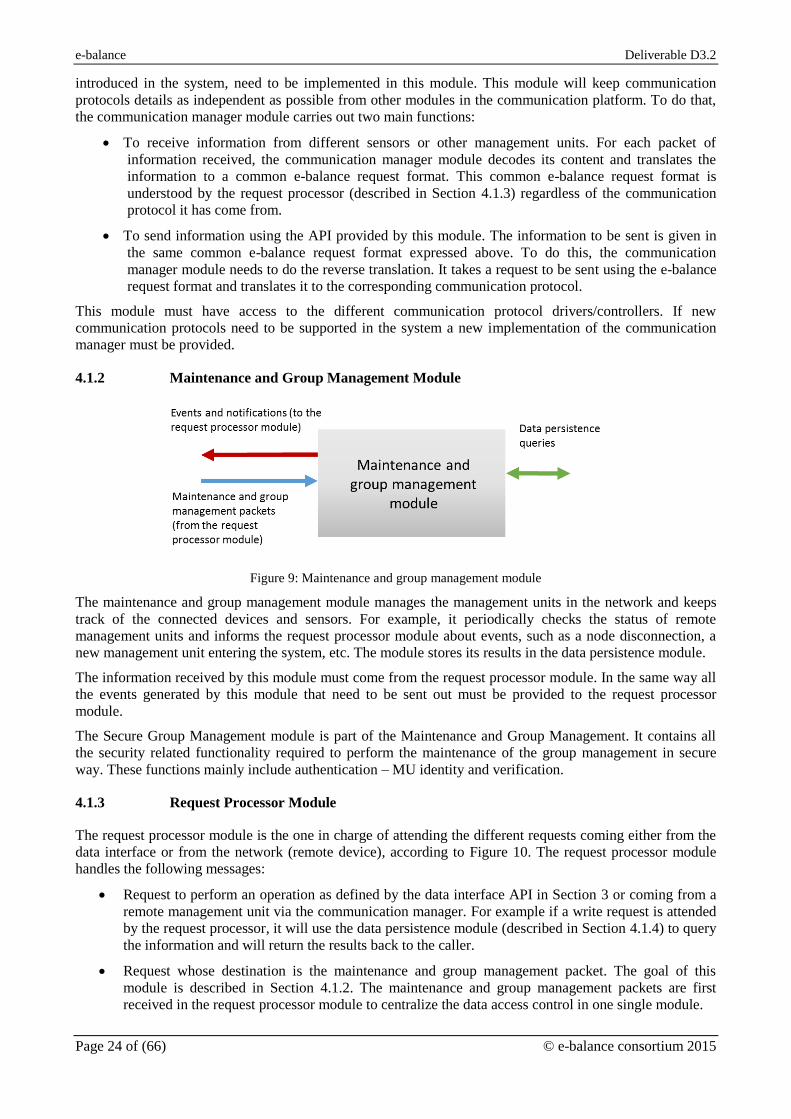
Figure 8: Communication manager module
The general architecture of the communication manager is depicted in Figure 8. The main goal of this
module is to homogenize the format of packets coming from different sources, i.e., protocols and
communication technologies. For example, this module could receive DLMS/COSEM packets or tinyDSM
packets. In other words, all the packets received by this module will be translated to the e-balance packet
format, which will be understood and can be processed by the modules located in the communication
platform. This approach helps to have a flexible, loosely coupled and modular system in terms of
communication protocols, so that extensions are done easily. If in the future new protocols are to be
involved, then only the communication manager module will have to be modified. This improves the
flexibility and adaptability of e-balance approach.
This module is the only one in the communication platform that understands different communication
protocols. Because of this design choice, the rules for interpreting the new communication protocols,
Page 24
e-balance Deliverable D3.2
Page 24 of (66) © e-balance consortium 2015
introduced in the system, need to be implemented in this module. This module will keep communication
protocols details as independent as possible from other modules in the communication platform. To do that,
the communication manager module carries out two main functions:
To receive information from different sensors or other management units. For each packet of
information received, the communication manager module decodes its content and translates the
information to a common e-balance request format. This common e-balance request format is
understood by the request processor (described in Section 4.1.3) regardless of the communication
protocol it has come from.
To send information using the API provided by this module. The information to be sent is given in
the same common e-balance request format expressed above. To do this, the communication
manager module needs to do the reverse translation. It takes a request to be sent using the e-balance
request format and translates it to the corresponding communication protocol.
This module must have access to the different communication protocol drivers/controllers. If new
communication protocols need to be supported in the system a new implementation of the communication
manager must be provided.
4.1.2 Maintenance and Group Management Module
Figure 9: Maintenance and group management module
The maintenance and group management module manages the management units in the network and keeps
track of the connected devices and sensors. For example, it periodically checks the status of remote
management units and informs the request processor module about events, such as a node disconnection, a
new management unit entering the system, etc. The module stores its results in the data persistence module.
The information received by this module must come from the request processor module. In the same way all
the events generated by this module that need to be sent out must be provided to the request processor
module.
The Secure Group Management module is part of the Maintenance and Group Management. It contains all
the security related functionality required to perform the maintenance of the group management in secure
way. These functions mainly include authentication – MU identity and verification.
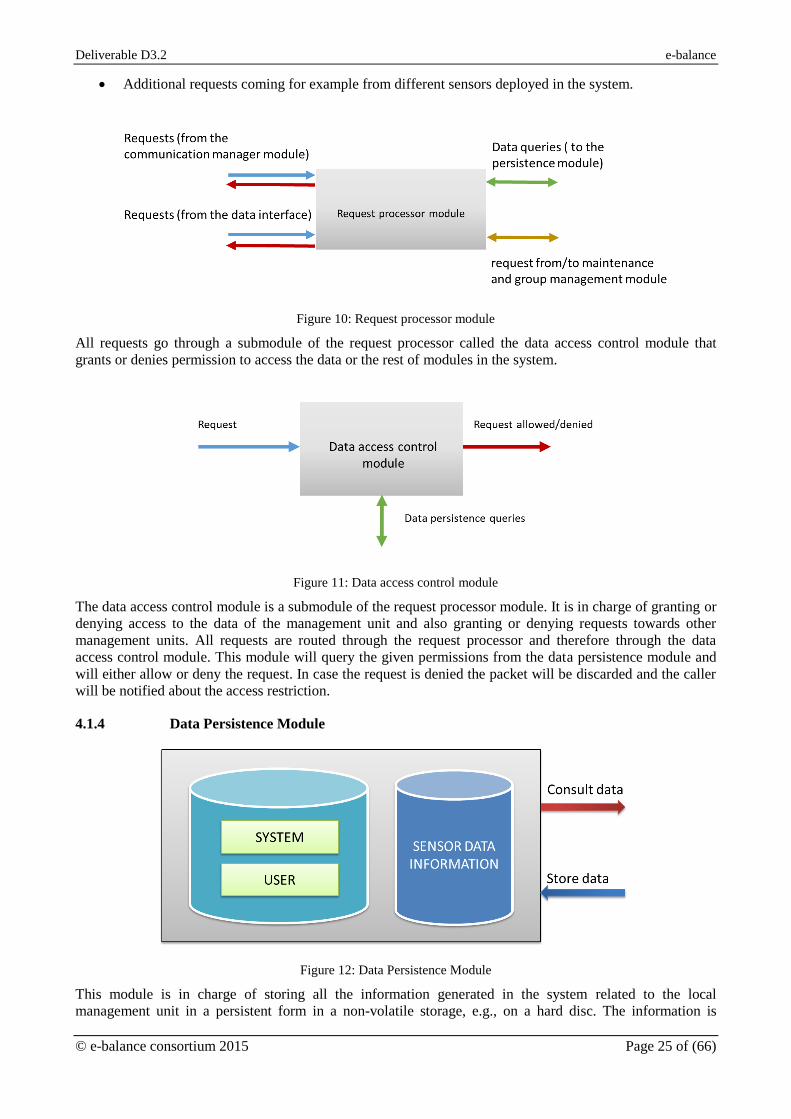
4.1.3 Request Processor Module
The request processor module is the one in charge of attending the different requests coming either from the
data interface or from the network (remote device), according to Figure 10. The request processor module
handles the following messages:
Request to perform an operation as defined by the data interface API in Section 3 or coming from a
remote management unit via the communication manager. For example if a write request is attended
by the request processor, it will use the data persistence module (described in Section 4.1.4) to query
the information and will return the results back to the caller.
Request whose destination is the maintenance and group management packet. The goal of this
module is described in Section 4.1.2. The maintenance and group management packets are first
received in the request processor module to centralize the data access control in one single module.
Page 25
Deliverable D3.2 e-balance
© e-balance consortium 2015 Page 25 of (66)
Additional requests coming for example from different sensors deployed in the system.
Figure 10: Request processor module
All requests go through a submodule of the request processor called the data access control module that
grants or denies permission to access the data or the rest of modules in the system.
Figure 11: Data access control module
The data access control module is a submodule of the request processor module. It is in charge of granting or
denying access to the data of the management unit and also granting or denying requests towards other
management units. All requests are routed through the request processor and therefore through the data
access control module. This module will query the given permissions from the data persistence module and
will either allow or deny the request. In case the request is denied the packet will be discarded and the caller
will be notified about the access restriction.
4.1.4 Data Persistence Module
Figure 12: Data Persistence Module
This module is in charge of storing all the information generated in the system related to the local
management unit in a persistent form in a non-volatile storage, e.g., on a hard disc. The information is
Page 26
e-balance Deliverable D3.2
Page 26 of (66) © e-balance consortium 2015
organized and structured in two groups: the system configuration data and energy management related time-
series data. The configuration part stores all the information necessary to establish the proper working
environment for each management unit and also the user defined settings that are MU specific. On the other
hand, all the measurements sent by the managed sensors installed in the e-balance system are stored in a time
series database. This kind of database is optimized for handling arrays of numbers indexed by time (a
datetime or a datetime range), what improves processing of historical data and aggregation of data values. If
some specific implementation of a management unit does not allow installing this kind of database,
traditional database can be used to store the measurements.
This module offers a general interface for the rest of the communication platform modules to achieve the
independence of the applied database implementation. Different types of database systems are facilitated by
this architecture without affecting the whole system.
This module includes also the Secure Storage module that is responsible for security related functionality,
like encryption of the stored data.
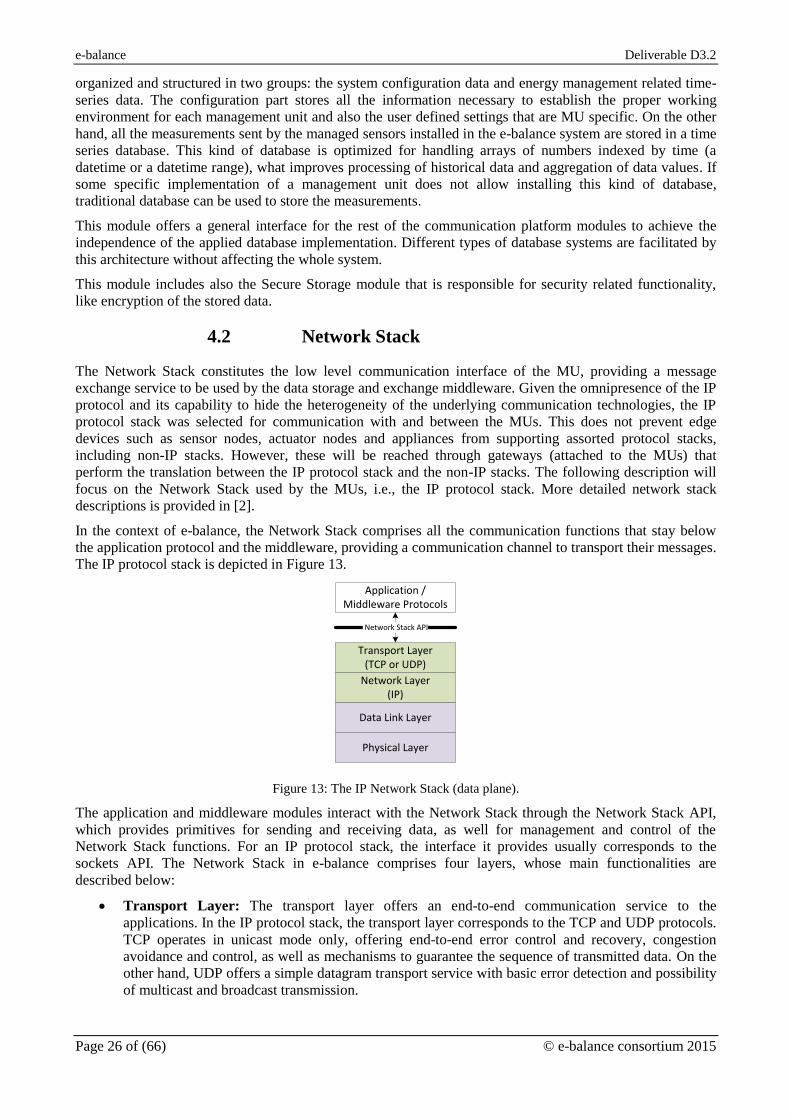
4.2 Network Stack
The Network Stack constitutes the low level communication interface of the MU, providing a message
exchange service to be used by the data storage and exchange middleware. Given the omnipresence of the IP
protocol and its capability to hide the heterogeneity of the underlying communication technologies, the IP
protocol stack was selected for communication with and between the MUs. This does not prevent edge
devices such as sensor nodes, actuator nodes and appliances from supporting assorted protocol stacks,
including non-IP stacks. However, these will be reached through gateways (attached to the MUs) that
perform the translation between the IP protocol stack and the non-IP stacks. The following description will
focus on the Network Stack used by the MUs, i.e., the IP protocol stack. More detailed network stack
descriptions is provided in [2].
In the context of e-balance, the Network Stack comprises all the communication functions that stay below
the application protocol and the middleware, providing a communication channel to transport their messages.
The IP protocol stack is depicted in Figure 13.
Network Layer(IP)
Transport Layer(TCP or UDP)
Application / Middleware Protocols
Physical Layer
Data Link Layer
Network Stack API
Figure 13: The IP Network Stack (data plane).
The application and middleware modules interact with the Network Stack through the Network Stack API,
which provides primitives for sending and receiving data, as well for management and control of the
Network Stack functions. For an IP protocol stack, the interface it provides usually corresponds to the
sockets API. The Network Stack in e-balance comprises four layers, whose main functionalities are
described below:
Transport Layer: The transport layer offers an end-to-end communication service to the
applications. In the IP protocol stack, the transport layer corresponds to the TCP and UDP protocols.
TCP operates in unicast mode only, offering end-to-end error control and recovery, congestion
avoidance and control, as well as mechanisms to guarantee the sequence of transmitted data. On the
other hand, UDP offers a simple datagram transport service with basic error detection and possibility
of multicast and broadcast transmission.
Page 27
Deliverable D3.2 e-balance
© e-balance consortium 2015 Page 27 of (66)
Network Layer: The main functions of this layer are related with routing and hop-by-hop
forwarding of data packets, in order to guarantee that they reach the destination in a multi-hop
network. This function is tightly related with routing, the address assignment, management and
discovery. In the IP protocol stack, these functions are performed by the IP protocol itself.
Data Link Layer: Together with the Physical layer, the Data Link layer is usually technology
dependent. Its main function is to be a communication link between two adjacent network nodes. As
such, data link protocols usually perform error control on the transmitted frames. In case of shared
media transmission technologies, the Data Link layer also implements Media Access Control (MAC)
functions.
Physical Layer: The Physical layer implements the actual transmission of data through the
communication medium. Low level Physical layer functions comprise modulation/demodulation and
channel coding/decoding. Higher level functions comprise carrier sense, framing and
synchronization.
4.3 Energy management platform
The energy management platform consists of three major parts, namely the energy balancing service, the
grid resilience service and the user interface service, as depicted in Figure 14. The energy balancing part is
discussed in Section 4.3.1, while the grid resilience part is discussed in Section 4.3.2. These parts are further
developed in task T5.2 and T5.3 (and reported in D5.2 and D5.3), respectively. The user interface module is
also developed in these two tasks and is discussed in Section 4.3.3.
The services use the data interface provided by the communication platform to access the sensor
measurements and data provided by other management units and execute their distributed algorithms to
provide localised energy management. The results are stored back to the communication platform.
Figure 14: The architecture of the e-balance energy management platform
4.3.1 Energy Balancing service
The energy balancing service of the energy management platform ensures that the electricity grid remains
balanced. A balanced grid has lower transport losses, a longer lifetime, and follows some defined strategy,
like a higher self-consumption of renewable energy. This balancing functionality is covered by the energy
balancing logic module (discussed in Section 4.3.1.1). This module receives predictions from the
consumption predictor module (discussed in Section 4.3.1.2) and from the production predictor module
(discussed in Section 4.3.1.3). It uses this information to make a planning for the devices and uses the device
controller module (discussed in Section 4.3.1.4) to follow this planning.
4.3.1.1 Energy Balancing Logic
The energy balancing logic module is responsible for the balancing within a given part of the grid. To
accomplish this, the module receives balancing requests from the parent MU and follows these as good as
technically possible, to the extent allowed by the consumer, i.e., according to the defined customer strategy.
These requests will arrive periodically and are represented by the data exchange defining the values for the
desired production and consumption levels.
The request from the parent MU has the form of a desired power profile. This is a set of power values that
represent power values in time that fulfil a purpose. The example purposes include compensating lack of
generation in the local area of another MU or some interests of stakeholders. The desired profile is defined
Page 28
e-balance Deliverable D3.2
Page 28 of (66) © e-balance consortium 2015
for a given time period with a given resolution, for example, for the following 24 hours with a resolution of
15 minutes. If a high level MU (e.g., LVGMU, MVGMU) is requested to follow a defined profile, it asks its
subordinated MUs to correct their profiles such that the desired power profile is obtained as a sum. The exact
procedure for this will be described in deliverable D5.2. The CMUs are leaves in the management unit tree.
If a CMU receives the request, the procedure is slightly different and is described below.
Since a house has only a limited flexibility, it cannot perfectly match the desired power profile. Instead, the
energy balancing logic on the CMU replies to the LVGMU with the deviation from the desired profile using
a single value – the distance of the CMU’s internally planned profile and the desired one. If this deviation
satisfies the LVGMU, it sends a request to the CMU to follow the planned power profile and the CMU sends
its planned profile to the LVGMU. Iteratively, all the CMUs belonging to a single LVGMU agree to an
individual profile with the LVGMU, whereby all CMUs are allowed to participate in achieving the
LVGMU’s end goal.
The hardest part of this process is to obtain a power profile that is as close as possible to the desired house
profile. This part consists of several steps. First of all, the balancing module of the CMU must know the
expected consumption and production within the next 24 hours. This information is provided by the
consumption prediction module and production prediction modules. Based on these predictions, the energy
balancing logic makes a sliding day-ahead planning. This planning is given in the form of the states for each
device during the day, and based on this a power profile is calculated. This planning is followed by the
device controller module by putting the device in the right state at the scheduled times.
4.3.1.2 Consumption predictor
The consumption predictor module predicts the energy consumption within a house under CMU jurisdiction,
or for a group of houses that do not have a CMU installed, when applied on a LVGMU. For the energy
balancing logic, it is important to have a good prediction of the household consumption for the upcoming
time period, e.g., 24 hours. For this prediction, the smart meter and information about other appliances are
read out by the device controller logic and stored within the middleware (using the data persistence module).
The consumption prediction module uses the information that is available in the communication platform,
e.g., device history and weather predictions (this data can be provided by service providers and distributed
using the communication platform or external data sources), to make an accurate prediction of the
consumption. The outcome of this prediction is a power profile for the next time period, with the same
temporal resolution as it is used by the energy balancing logic.
4.3.1.3 Production predictor
Similar to a prediction of the consumption, also a prediction of the production is required. The production
predictor module takes care of this. It may cover all possible energy sources and for instance for the PV
panels it focuses on the prediction of photovoltaic power that is produced by the solar panels that belong to
the house. To do this, this module uses the available configuration parameters, like the elevation, azimuth,
efficiency and area of the installed solar panels.
Using this information together with a weather prediction (e.g., solar irradiation and temperature), the
production prediction estimates the power produced by the solar panels. The outcome of the prediction step
that is performed by this module is a production power profile for the next time period, with the same
resolution that is used by the energy balancing logic.
4.3.1.4 Device controller
The device controller module is mainly available on the CMUs and it has two goals. The first goal is to
collect the information from the customer devices/appliances and to store the properties of these as the
system configuration in the communication platform. This information is used by the predictor modules.
Examples of such information are smart meter measurements (high resolution), status of the washing
machine, the electrical vehicle, etc.
The second goal of the device controller is to implement the planning that was made by the energy balancing
logic module. During the planning stage, the desired states of the devices are calculated and the device
controller applies these states according to the schedule. Examples are starting the washing machine when it
Page 29
Deliverable D3.2 e-balance
© e-balance consortium 2015 Page 29 of (66)
is scheduled to run, or setting the right (dis)charge level for an electrical vehicle or battery in each time
interval.
4.3.1.5 Security and privacy
The security and privacy module within the energy balancing service stores the credentials related to the
stakeholders, on behalf of which the service is working. It also provides the security functions necessary to
authorize the accesses to the data within the communication platform, i.e., to create the securityPolicy
parameters in the data interface functions. This functionality includes signing the request using the
stakeholder’s credentials. Having these functions local to the service allows protecting the credentials from
disclosing while using external security library.
More details are given in Section 4.4.
4.3.2 Grid Resilience service
The grid resilience service is also part of the energy management platform as depicted in Figure 14. Its main
aim is to monitor and react to events that may affect the stability in the grid, but, compared to the energy
balancing service, here the view is more from the grid infrastructure perspective. The following sections
describe the modules included in this service. The description here gives already some insight of the details
of the algorithms to be implemented in the respective modules. The modules in this service consist of parts
that are referred to as applications.
4.3.2.1 Distributed Energy Resources Power Flows (DER Power Flows – DERPF)
DER includes storage and distributed generation (DG) units. The DG units are either based on RES (i.e. solar
photovoltaic or wind) or low carbon technologies (fuel cells, micro turbines) usually associated with
Combined Heat and Power (CHP) and flexible loads. These units are connected to the distribution network at
the MV and LV levels.
Real-time awareness of DER power flow (i.e. power consumption and generation) as well as building a
relevant historical database are key features of distribution network control, in order to correctly prevent,
identify and correct potential problems related to the large scale integration of DER resources and enable
innovative DER grid supporting strategies.
The main objective of the DER power flows application is to provide a platform containing the necessary
information for the interaction of DER units with the different stakeholders involved namely: the customer,
the DSO and the electricity market agent.
The DER Power Flow module assumes that there are measuring and communication capabilities at the DER
devices level, providing the adequate means for collecting real-time information from the DER devices (e.g.
power consumption, maximum and minimum capacity, availability to participate in grid supporting
services). In case DER devices are connected at the home grid level, such capabilities will have to be
coordinated with the customer management unit (CMU) and the smart metering equipment.
The DERMU will be responsible for the data collection interface of the supervised DER devices. The
information collected at the DER device and/or home grid level will then be processed at the grid
management levels (i.e. LVGMU and MVGMU).
The DERPF will be responsible for aggregating the filtered measurements and provide an aggregate view of
the DER power flows, estimate the availability of DER to participate in grid supporting services and detect
eventual problems occurring as a consequence of DER integration. The aggregated information will also be
provided via the communication platform to the higher control level, namely for the MV network
applications (e.g. MV self-healing, Optimized Power Flow, among others).
4.3.2.2 MV - Optimized Power Flow (OPF)
The deployment of remotely controlled reconfiguration devices in Medium Voltage (MV) distribution
networks along with increased network monitoring equipment enables the implementation of new network
applications, aiming at improving the efficiency and reliability of distribution systems and minimizing
Page 30
e-balance Deliverable D3.2
Page 30 of (66) © e-balance consortium 2015
operating costs. Such applications will help to manage in real-time distribution systems enabling the active
integration of Distributed Energy Resources (DER) such as renewable based distributed generation (DG) and
electric vehicles (EV) as well as developing new grid supporting services.
The e-balance Optimized Power Flow (OPF) module is a core grid control and monitoring application and
the main objective of this module is to determine the optimal MV network topology, which minimizes
distribution network operation costs while minimizing the grid outages. The results obtained by this module
must comply with operational constraints such as equipment operating limits, system security limits and
radial operation of the network.
The OPF calculations can be integrated with different modes of operation namely in preventive / advisory
mode or corrective mode. In preventive mode, the OPF will run in order to improve the efficiency of MV
operation by minimizing the active power losses of the system or in order to avoid possible congestion or
voltage problems. However, when a violation (i.e. voltage, feeders’ congestion, excessive active power
losses) or fault (e.g. requiring a change in the system topology) is detected, the OPF can run in order to solve
the operating restrictions considering the controllable equipment connected to the MV network and primary
and secondary substations (network switches, taps in transformers, capacitor banks, and possibly DER units
connected to the MV network).
Other applications related to OPF:
Validation of Optimized Solutions (VOS). This application will be responsible for implementing
and validating the optimal reconfiguration solution for the MV network determined by the OPF
module. The OPF will find the best topology which minimizes the active power losses considering
the actual state of the distribution network under study. The solution found will have to comply with
the operation constraints of the distribution network, so that the solution found is always feasible.
Voltage/Var Control (VVC) for the MV network, which main objective is to optimize MV
voltage profile and reactive power flows, ensuring adequate voltages within the MV network. VVC
is usually incorporated in grid management systems in order to maintain voltage levels within
admissible limits and may contribute to minimize active power losses. The OPF provides the outputs
to the VVC module providing the optimal states for transformers and capacitor bank taps and the
coordination with DER units.
Losses calculation, which processes data from sensing devices and determines energy losses within
energy grid assets. If energy losses are higher than the expected value, the OPF functionality can be
used to run in order to find an alternative topology improving the efficiency of the MV distribution
network.
Automatic grid service restoration provides control procedures to reconfigure the MV grid in
order to isolate the fault and find alternative paths in order to restore service to grid segments not
affected by the fault.
Several types of data are required for an OPF package, namely the grid model and initial topology as well as
real time measurements such as voltages, currents and power at different points of the network.
4.3.2.3 MV - Validation of Optimized Solutions (VOS)
The main objective of the Validation of Optimized Solutions (VOS) is to determine and validate a
reconfiguration procedure according to the optimal reconfiguration scheme determined by the OPF module.
As mentioned before, the OPF only determines the switching actions that must be made to improve the
actual configuration and not necessarily the correct order of doing it. Therefore, the VOS module will be
responsible for determining an automated reconfiguration sequence, ensuring the security of the distribution
network during the sequence steps.
Before starting the reconfiguration sequence, the VOS module has to ensure that the solution found by the
OPF module is valid considering current network operation conditions. If the reconfiguration solution found
continues to satisfy the objective function of the OPF module (e.g. total power losses) and the network is
operating under normal conditions (i.e. faults located and isolated), the module will determine the
reconfiguration sequence. Also, it is important to correctly characterize the different switching equipment
involved in the configuration according to its function, remote control capabilities and location, namely
Page 31
Deliverable D3.2 e-balance
© e-balance consortium 2015 Page 31 of (66)
differentiate circuit breakers (with and without automatic reclosing functions) from switches that can be
installed in the primary and secondary substations or in the network feeders.
The automated reconfiguration procedure is also valid when considering the connection of DG in the MV
network feeders involved in the procedure. The sequence avoids the formation of unwanted islands during
the intermediate steps of the procedure and ensures the correct action of the distribution protection systems.
If the network is operating under normal conditions (i.e. faults located and isolated) and the solution found
by the OPF module is valid considering current network operation conditions, the reconfiguration sequence
can be implemented automatically or manually by a network operator. The interaction with the distribution
network operator may be required either to initially validate the automatic procedure or to implement it for
example when the network switches don’t have remote control capabilities. If only remote control equipment
is considered, a fully automatic procedure can be envisioned.
After finalizing the reconfiguration sequence, the module will also validate the final operation state of the
network and compare it with the estimated conditions from the OPF module.
4.3.2.4 Fault Detection, Isolation and service Restoration (FDIR)
The following two submodules (applications) constitute to the FDIR block that is responsible for detecting
and locating faults and then, if possible, to restore the stable grid state automatically. Both modules operate
on the MV level of the grid.
4.3.2.4.1 MV – fault detection and location
Fault detection and isolation in MV feeders is usually performed at the primary substation. When a fault
occurs in a MV feeder, an overcurrent protection controls the substation circuit breaker by disconnecting the
feeder in order to isolate the faulted area. Automatic reclosing functions at the substation can be triggered in
order to eliminate temporary faults and minimize the power not supplied when combined with feeder
switching equipment, which will isolate (in case of normally closed switches) or restore service (in case of
normally open switches) to healthy segments of the feeder.
The increase of monitoring, protection and automation equipment in distribution networks enables fast and
efficient fault detection, isolation and restoration. A new generation of protection and switching equipment is
being deployed in distribution networks in order to improve fault detection and isolation, namely: advanced
reclosers and fault current sensors. Advanced reclosers can operate as a circuit breaker (similarly to primary
substations) or as sectionalizers (which will open when no voltage is detected) and have communication
capabilities which enable remote monitoring and control. Local processing capabilities also add local
intelligence for the implementation of automatic detection of faults and reconfiguration of the network.
The coordination of MV substation and feeders overcurrent protections with automatic reclosing strategies
will improve the time required to detect and isolate faults and minimize the power not supplied. However,
after a permanent fault, it is necessary to identify the location of the fault as well as the faulted equipment.
This process is usually conducted by the grid management system operator in coordination with the field
operators. Such process can take several hours or days depending on the extension of the MV network
affected by the fault.
The main objective of the MV Fault Detection and Location (MVFDL) application is to monitor the MV
network and proactively identify and locate MV faults. The application is incorporated at the MVGMU,
monitoring the primary substation MV panels and the respective switching and sensors installed downstream
in MV feeders. When a fault occurs, the module is activated in order to locate and identify the faulted
equipment.
4.3.2.4.2 MV - Automatic fault restoration - self-healing
The MV Fault Restoration module uses the identification of the topological area where a fault occurred
(which is provided as a result of the MVFDL module – see Section 4.3.2.4.1) to automatically isolate this
area, and then find alternative paths in order to restore service to grid segments not affected by the fault.
In what concerns isolation of the fault, this module performs a topological analysis in the faulted feeder in
order to determine the minimum area limited by operable switches that fully encloses the faulted area. The
Page 32
e-balance Deliverable D3.2
Page 32 of (66) © e-balance consortium 2015
MVGMU runs autonomously in a remote primary substation, which implies that the operable switches to
consider are those that are remote controlled and thus can automatically be maneuvered by the system in
order to isolate the fault. Naturally, open switches are also always considered to isolate the fault,
independently of being remote controlled or not.
Once the fault is isolated, the restoration can take place. If the fault can be isolated before the tripped feeder
breaker then that breaker can be reclosed (and note that this is always a safe operation because that feeder
will have now a lower load). If there is no operable switch that is able to separate the feeder breaker from the
fault then no upstream restoration can be performed in this case.
Downstream restoration consists in reconfiguring the MV grid so that pending segments, located
downstream the isolated faulted area and thus not affected by it, could be fed by an alternative source. Unlike
upstream restoration, where reclosing the tripped breaker is always a safe operation, downstream restoration
is more complex because transferring the de-energized loads to adjacent feeders may compromise
operational grid constraints like thermal or voltage limits. Additionally, a typical MV grid is supported by a
meshed topology that offers multiple possible configurations for a radial exploration, which increases the
probability of finding an acceptable solution, but also brings more complexity to this problem. Thus, in order
to ensure that operation limits are not violated during and after reconfiguration, the system may have to
explore multiple of the reconfiguration possibilities, and in the limit, it may end up with a solution that is not
able to re-energize all grid segments that are isolated from the fault. Note that the operation limits do not
necessarily correspond to equipment nominal characteristics – a line or a transformer can be temporarily
explored above the nominal current or power.
The complex problem of downstream restoration is solved by an OPF function (see Section 4.3.2.2) whose
target is to minimize the power not supplied after fault isolation, while still granting that the found solution
complies with the following constrains:
Minimum and Maximum values for node voltages magnitudes;
Maximum capacity of lines;
Maximum capacity of primary substation transformers
The OPF runs in real-time, based on the data provided by the grid management system. Several types of data
are required, namely the grid model and initial topology as well as real time measurements such as voltages,
currents and power at different points of the grid. Note that the OPF must run using the state conditions when
the fault occurred, in particular with the currents before the fault.
Similarly to isolation, due to the autonomous nature of MVGMU, the OPF considers only remote controlled
switches as operable switches that can be used to reconfigure the grid. The OPF, used in the context of grid
restoration, will not consider the transformer tap changers state or the capacitor bank state as control
variables. In fact, in limit situations, these resources could be used to avoid violations. However, in practice
they are not used because they affect globally the grid (which is a problem because typically the fault
restoration supporting model is not complete) and because the full algorithm performance is not compatible
with the purpose of rapidly proposing restoration actions. Later, after automatic restoration, the grid operator
may use an OPF to study better solutions, if required.
Note that the Fault Restoration module does not manage the faults, meaning that it doesn’t keep track of
which faults are still active or have already been resolved on the field. The main reason for not doing this is
that it would require input from the grid operator, which in turn would prevent the deployment of this
module on an autonomous MVGMU. Operation security is a critical issue and this module relies on the
following practical rule to limit the remote controlled switches that can be used during restoration: only
normally open switches can be closed. This rule ensures that the module will never try to close a switch that
is currently isolating a fault. The drawback is that this may limit the reconfiguration options when the grid is
explored in an abnormal configuration.
Once computed the isolation and the restoration actions, the system proposes its execution, obviously the
isolation actions being executed first. This MVGMU module may run in two different modes:
Manual – in this case the module generates a switching order that implements the computed
reconfiguration sequence. This switching order is then exported to the TLGMU, where it can then be
Page 33
Deliverable D3.2 e-balance
© e-balance consortium 2015 Page 33 of (66)
taken by an operator for execution. The operator is free to add some actions to the switching order,
or to not execute some of the proposed actions.
Automatic – in this case the reconfiguration sequence will run automatically at the MVGMU. The
module is responsible for generating the switching control signals according to the identifiers of the
grid switching equipment and sends it through the local MVGMU system. For each control signal
the module will wait for a confirmation of the final state of the remote controlled grid equipment. If
for some reason the switching action fails, the module aborts the sequence execution and returns an
alert to the grid operator. After successful or unsuccessful execution, the module generates the
corresponding switching order, stating the execution time for each instruction, and exports it to the
TLGMU where it is archived. This switching order can then be consulted / analysed by operators.
4.3.2.5 MV - Fault prevention (MV Flt Prv)
Faults in distribution networks are usually associated to the occurrence of short-circuits or insulation
breakdowns. The main causes for the occurrence of faults are:
Abnormal weather conditions (e.g. wind, rain, lightning, storms)
External factors (e.g. trees, birds, construction work)
Internal factors (e.g. equipment malfunction)
Abnormal operation conditions (e.g. congestion problems, over and under voltages)
Distribution automation and protection systems are usually responsible for the detection, isolation and
restoration of the system, reacting after the occurrence of the fault. However, the neighbourhood monitoring
and control concept increases distribution network monitoring capabilities and its distributed intelligence
enables the development of algorithms dedicated to prevent the occurrence of faults.
The MV Fault prevention module will be responsible for monitoring the MV network state and detect
possible alarm or abnormal operating conditions which can lead to faults. The tool will have as inputs real-
time measurements and alarms from MV sensors at the substation and feeders, together with additional
information such as geographic characteristics of the network, weather forecasts and load and DER
load/generation forecasting.
Based on data mining techniques, the module can estimate the behaviour of the system and determine the
probability of fault occurrence or other warning operation states (e.g. congestion problems, transformer
overloading). This shows that the individual energy production and consumption forecasts obtained in the
energy balancing service can be reused here.
4.3.2.6 LV Neighbourhood Power Flows (LV NH Power Flow)
Future LV distribution networks face several challenges resulting from the large scale integration of DER,
such as renewable based micro generation, active demand response, distributed stationary storage and also
electric vehicles. While the large scale integration of DER such as the ones referred has undeniable
environmental benefits, it will require a deep change in the distribution network operation in order to deal
with increased power flow uncertainty while maximizing distribution network asset utilization.
The most efficient strategy to deal with increased uncertainty is to better exploit and coordinate the
flexibility of different players. However, dealing with such diversity and large number of resources requires
extending the observability and controllability of distribution networks to the LV networks, decentralizing
control and management functionalities downstream, in line with smart grids paradigm.
The deployment of ICT such as smart metering infrastructures as well as a new generation of distribution
network automation and monitoring equipment enables the implementation of distributed management and
control. Neighbourhood monitoring and power flow recognition can be implemented at the LV level in order
to improve grid awareness, to implement resilient distributed control strategies, while supporting grid
resilience services.
New distribution network applications need to be developed in order to characterize LV network voltages,
currents and power flows. The main objective of the Neighbourhood Power Flow (NPF) module is to provide
Page 34
e-balance Deliverable D3.2
Page 34 of (66) © e-balance consortium 2015
a synchronous and accurate characterization of the LV network operation state, in order to identify potential
problems occurring in the LV network (e.g. voltage limit violation, congestion).
The module integrates a distribution state estimation algorithm which ensures a synchronous snapshot of the
LV network conditions and is specifically designed to deal with the distinct characteristics of LV networks,
namely:
LV networks are operated under unbalanced conditions, due to the uneven distribution of single-
phase loads and DER by the three-phases of the system. A three-phase four wire model of the LV
network will have to be adopted, since in unbalance operating conditions the single-phase positive
sequence model of the network is no longer valid.
LV networks are usually operated with radial topology, requiring algorithms specifically
designed for this type of networks. State estimation algorithms for radial networks usually consider
branch current as primary state variables. However, current measurements may not be fully
available, particularly downstream the feeders, yet, the current measurements provided by the smart
meters will also be taken into account.
LV networks have usually a high number of nodes when compared to the number of
measurement devices. Consequently, ensuring the redundancy and observability of the LV network
can be challenging. Adopting pseudo-measurements, generated based on historic database or in
forecasting algorithms, will ensure the observability of the network. However, their accuracy will
affect the quality of the state estimation results.
Insufficient data for LV network modelling. LV feeders’ impedance is usually unknown (in case
of old networks) or unreliable. Conventional state estimation algorithms require full knowledge of
the network impedances in order to build the grid model. However, alternative methods based on
artificial intelligence can overcome this problem.
The state estimator will be responsible for determining the network state based on real time measurements
and other relevant information from historic and forecasted load and generation data. In order to ensure
system observability, the module will generate a set of pseudo-measurements. Additionally, the module can
also run without depending on LV network modelling and depending on real-time and pseudo measurements
available.
The results can then be used by other modules of the e-balance system architecture, such as:
LV Losses Calculation. The NPF module will provide information related with the data consistency
and feeders’ power flows, which can be used by the LV Losses Calculation module to filter the
information measured at the secondary substation and collected from the smart meters.
LV Fraud Detection. The NPF module will provide information related with the data consistency and
feeders’ power flows, which can be used by the LV Fraud Detection module to identify the location
of fraud activities.
LV Distributed Generation power flows. The NPF module will return the power injected by DER in
LV nodes, which will be used to determine the aggregated power flows of DER connected to LV
systems.
4.3.2.6.1 LV Losses Calculation
The estimation of technical and commercial losses in distribution networks is usually based on the analysis
of load diagrams and offline power flow studies. This analysis is usually performed offline considering
historic data and billing information. In addition to the determination of total energy losses, typical losses
profiles are usually required for losses allocation and planning of the distribution network. However, given
the large amount of information required to process, a set of operation scenarios and typical networks are
usually selected for loss estimation, which may lead to higher estimation errors. Also, such approach
includes both technical losses and non-technical losses (fraud, empty buildings that are not disconnected,
unmetered connections and billing errors/inaccuracies) making the identification of fraud activities a
challenging task.
Page 35
Deliverable D3.2 e-balance
© e-balance consortium 2015 Page 35 of (66)
The main objective of the Losses Calculation application is to take advantage of the real-time information
provided by the smart meters and grid sensors in order to provide an accurate estimate of technical energy
losses. The LV Losses Calculation module will monitor energy balance (Power imported vs. Power
consumption and local generation) and generate an event when total losses exceed the expected losses profile
(includes technical and non-technical losses). Based on the event generated, the Fraud Detection module can
be activated. Additionally, the module is also responsible for processing the smart meters’ load and DER
generation diagrams and filtering the errors detected. Based on this information, the module will also
determine aggregated load diagrams using different criteria, namely: type of consumers, contracted power,
DER technology, among others and send this information to central services for aggregated losses studies.
4.3.2.7 LV Quality of supply measurement
Electrical grid may experience distinct technical quality problems, which are usually classified as continuity
of service and power quality. Continuity of service is associated with the occurrence of interruptions to the
supply and is quantified according to the frequency (i.e., number of interruptions) and duration of the
interruptions. In addition, power quality is quantified through voltage quality defined by the following
characteristics:
System frequency
Magnitude of supply voltage
Harmonic and inter-harmonics
Voltage unbalance
Flicker emission
Voltage sags, swells and momentary interruptions
Transients
The quantification of power quality indices is usually based on European standard EN50160:2000, which
establishes the voltage characteristics to be ensured by the distribution network operators.
Figure 15: Quality Monitoring module architecture
The increased uncertainty of distribution network operation caused by the large scale integration of DER,
such as renewable based DG and EVs, associated with the need of maximizing utilities assets utilization,
may compromise the security of operation and quality of supply. At the same time, DER units are usually
coupled to the distribution system through power electronic interfaces, which are a potential source of
harmonic emission. Moreover, voltage disturbances (e.g., over and under voltages) as well as congestion
problems may lead to unplanned service interruptions. However, problems related to voltage regulation in
LV and MV networks caused by the low correlation between load and RES are an issue that has to be solved
by the DSO. In addition, LV networks are typically three-phase four-wire systems operated under
unbalanced conditions. Thus, an uneven connection of single-phase loads and/or micro-generation may cause
non-equal currents flowing in the conductors and consequently unsymmetrical voltage drops along the
feeders.
Quality Monitoring module Power Quality (Query or Events)
Continuity of Service (Query or Events)
Power Quality (Notifications)
Continuity of Service (Notifications)
Parameters (DB) Historical Data (DB)
Functions
Page 36
e-balance Deliverable D3.2
Page 36 of (66) © e-balance consortium 2015
The Quality Monitoring module aims to determine and evaluate the technical quality of electrical grid based
on information from downstream devices and quality of service indices according to current standards. This
application will be integrated at the LVGMU and will be responsible for identifying technical quality
problems, quantifying them and generating reports to be provided to the upper control levels for offline
analysis.
4.3.2.8 LV Fraud detection
The deployment of smart metering devices not only provides accurate metering for billing purposes but also
enables an efficient detection of fraud activities. Besides real-time metering capabilities, smart meters are
able to store power and energy consumption data, which can be aggregated at LVGMU level, thus hiding any
specific end user energy consumption data – a contribution for privacy of each customer – suitable for being
used by the higher control layers to better understand energy consumption patterns within distribution
networks.
Distribution network losses can be classified in two groups: technical and non-technical losses. The first are
related to the operation efficiency of the distribution network and the loss of energy mainly due to Joule’s
effect in lines, transformers and other equipment connected to the system. Non-technical losses are those
associated with inaccuracies in meter readings or estimates, as well as meter errors and fraud activities.
The main objective of the Fraud Detection application is to quantify non-technical losses particularly those
related to possible fraud activities, combining advanced functionalities of smart meters with distributed
intelligence integrated at the LVGMU.
The tool will first estimate the total non-expected energy consumptions, which were not subject to
commercial billing, by comparing secondary substation energy losses determined by the Losses Calculation
API with the expected technical losses. If the difference is above a pre-specified value the module will
launch a second fraud detection and location algorithm, which will try to identify or at least narrow down the
most probable locations for the occurrence of fraudulent activities.
In order to successfully identify fraud activities, this module will have to interact with other network
applications such as:
Losses Calculation, which estimates the total energy losses in the network under analysis.
DERPF, which processes the real-time information of DER power and energy provided.
NPF, which provides power flow in the LV feeders while enabling its comparison with the power
consumption information provided by the smart meters.
As outputs, the Fraud Detection module will generate critical and non-critical alarms when the probability of
fraud occurrence is high, providing a list of possible locations or network areas where fraud activities are
likely to occur. The module will also store the information collected in order to provide it to higher control
levels, namely central services, with a detailed historical database.
4.3.2.9 LV Fault Management (LV Fault Mng)
The following three subsections describe applications that are related to the management of faults in the LV
part of the grid.
4.3.2.9.1 LV Fault detection and location
The Detection and Location of Low Voltage Faults must be made in the LVGMU. This module is
autonomous and dedicated to the LV and so, it is going to be responsible for detecting and locating faults in
the Low Voltage Distribution Grid based on the topological information of related LV network.
With the deployment of Sensors in the LV Distribution Grid it is possible for the LVGMU to provide a wide
and accurate fault detection and location system. In the presented architecture, the LVGMU is the decision
maker and the Sensors scattered across the Grid are the data providers and local alarm validators. Each
sensor is capable of measuring Voltage, Current and Power for each phase, as well as Temperature. The
Page 37
Deliverable D3.2 e-balance
© e-balance consortium 2015 Page 37 of (66)
accuracy of the fault detection algorithm depends on the number of sensors and on their installation place in
the LV network.
The LVGMU must be capable of accepting two approaches for Fault Detection:
Centralized Fault Detection: Measure (V, I) at each node is acquired by the respective Sensor and
periodically polled and analysed by the LVGMU;
Distributed Fault Detection: Measure (V, I) at each node is acquired and analysed by the respective
Sensor and if alarm conditions are met, a report is sent immediately to the LVGMU.
The first is the classical approach, not adding much to the existent solutions. The second one assures
distributed processing. To assure flexibility, LVGMU has to accept the configuration of the Fault Detection
Method.
After a Fault is detected the LVGMU starts the Fault Location sequence. The output will be the identification
of the LV faulty segment.
Under the distributed fault detection mode, the algorithm is triggered by the incoming fault detected by the
LV sensor and is based on a LV grid topology assessment. The LVGMU performs that topology assessment
as follows:
A fault always occurs after the most downstream sensor that has reported a fault
If there are other downstream sensors after the sensor reporting the fault, then the location of the
fault is between the last reporting sensor and the sensor immediately after – Figure 16
If there are no further sensors, then the location of the fault is after the last reporting sensor – see
Figure 17
Figure 16: Topology assessment of a fault occurring between grid sensors
Page 38
e-balance Deliverable D3.2
Page 38 of (66) © e-balance consortium 2015
Figure 17: Topology assessment of a fault occurring after the last grid sensor
4.3.2.9.2 LV Fault detection on fused luminaires
The Fault Detection on Fused Luminaires is similar to the LV Fault Detection and Location algorithm
described previously, so only the algorithm for detection and location of faulty luminaries is described in this
section.
Basically, the algorithm checks public lighting luminaire circuits which are not consuming energy according
to the expected timetable. It also checks for and locates fused luminaire light bulbs during the expected night
period. The algorithm also takes into consideration the occurrence of light bulb flickering – normally due to
low voltage situations – to avoid triggering false alarm situations.
The typical Public Lighting (PL) feeder presents a linear topology, with several luminaires connected in
parallel along the feeder.
::
I1
Ipl
VplLLL LL
Figure 18: Topology of a Public Lighting (PL) feeder with several luminaires
To detect if one or more luminaires are faulty, a basic method could be the comparison of the current
measured periodically along the time, with a reference current measured with the luminaires all working
well.
However this method is not accurate since the current of each luminaire depends on the voltage applied to it,
which could change from the nominal value, along the night period. The same applies for the power
consumed by each luminaire, which also varies with the voltage applied to it.
A more accurate method is based on the measurement of the impedance of the feeder, by comparing it with
the reference impedance value of all expected luminaires in parallel, belonging to such feeder.
Page 39
Deliverable D3.2 e-balance
© e-balance consortium 2015 Page 39 of (66)
Assuming the feeder has a single segment, by placing one voltage and current sensor at the beginning of the
PL feeder, the voltage of the feeder phase and the total current of the PL feeder offer a first impedance
perspective of the overall set of luminaires. If gathered during a normal steady state situation, this first
perspective can be used to calibrate the algorithm so that it could take into account the so called normal
impedance of the overall set of luminaires.
Under normal circumstances (e.g. no low voltage limit condition or no luminaires starting up situation), the
impedance of a luminaire or of a set of luminaires is expected to keep reasonably steady with a minor impact
from cable impedances, when the voltage applied to it varies with time, provided the voltage applied to the
lighting circuit stays steady around the nominal value, with no low limits violation.
As the impedance varies along the feeder, e.g. assuming that all light bulbs (n being the total number of light
bulbs) show the same impedance Z, at the beginning of the feeder, despite any cable impendences, the
impedance shown at that point will be Z/n, and as long as one moves along the feeder, the impedance will be
higher: Z/(n-1), Z/k (with k < n-1), …, Z/4, Z/3, Z/2, Z. A suitable definition can also be obtained
independently of the impedance value of each light bulb, meaning that the algorithm will cope with different
types of light bulbs, which may correspond to different impedances per light bulb type. Introducing the
topology concept, namely by stating which type of bulb is deployed within a lighting segment will, surely,
improve the algorithm.
The deployment of further voltage and current sensors along the public lighting feeder will improve the
observability of any faulty bulb occurrences. In the end, each light bulb could have its own current and
voltage sensor, the ultimate move for a 100% accurate light bulb blown-up detection and location algorithm.
Yet, this is not feasible for large scale deployments; therefore, selecting the placement of sensors along the
feeder will be of major convenience. Highlighting any luminaires failure and their possible location will be
enough for significantly improving the task of maintenance crews managed at corporate system level – e.g.
at TLGMU – which, periodically and in night shifts, have to check for fused luminaires. This improvement is
a contribution for decreasing operating expenses, which business impact does not fit within this
specification.
The algorithm behind the detection and location of faulty luminaries relies on synchronized cyclical
monitoring of the impedance observed from each sensor (current and voltage). Each monitoring set,
comprising multiple downstream feeder impedance values – as many as the number of eventual deployed
sensors along the feeder – represents a static view of the impedance observed from each sensor point within
the PL feeder.
Each specific monitoring set is gathered by the LVGMU and is used to detect impedance deviations, by
coupling subsequent monitoring sets and comparing them.
In normal conditions, e.g., with no faulty bulb phenomena, there is a relation between the impedance
observed at a sensor and the impedance observed at the sensor immediately after, both placed along the
feeder. Unless the cable impedances between consecutive sensors, that impedance relation is kept steady
within a certain boundary.
To illustrate this algorithm, let’s assume that a public lighting feeder serves four segments of luminaires,
each belonging to a PL segment and each being monitored by an upstream sensor, as described in Figure 19.
So, in this illustration, the PL feeder corresponds to four consecutive PL segments.
Page 40
e-balance Deliverable D3.2
Page 40 of (66) © e-balance consortium 2015
Figure 19: Topology of a Public Lighting (PL) feeder with four sets of luminaires with upstream sensors
Each set of luminaires placed in its own PL segment has an upstream sensor which provides voltage and
current measurements. So, Sensor S1 reports voltage U1 and current I1, meaning that the calculated
impedance Z1 corresponds to the parallel of all luminaires downstream sensor S1. The same approach
applies for Sensor S2 which reports voltage U2 and current I2, meaning that the calculated impedance Z2
corresponds to the parallel of all luminaires downstream sensor S2 and so forth, as the same consideration
applies for both the third and the fourth set of luminaires.
Each PL segment has its own impedance, corresponding to the parallel of the luminaires the PL segment is
made of. Each PL segment has impedance corresponding to the parallel of impedances in the segment: Z1a
in segment a, Z2b in segment b, Z3c in segment c and Z4d in segment d.
From another perspective, the impedance observed in Sensor S1 (Z1) equals the parallel of the impedance in
segment a (Z1a) with the impedance observed in Sensor S2 (Z2), therefore, the relation of impedances is as
follows:
Z1 = (Z1a * Z2) / (Z1a + Z2), and Z2 = U2 / I2
Z2 = (Z2b * Z3) / (Z2b + Z3), and Z3 = U3 / I3
Z3 = (Z3c * Z4) / (Z3c + Z4), and Z4 = U4 / I4
Z4 = Z4d
In steady state regime, the PL segment impedance should remain reasonably steady, meaning that no faulty
light bulbs exist. So, a way to detect light blown up bulbs in a specific PL segment is by cyclically
comparing the PL segment impedance between consecutive computing iterations. In a given PL segment, its
impedance can be computed by using the measurements provided by its adjacent sensors.
The impedance of PL segment a is:
Z1a = (Z1 * Z2) / (Z2 – Z1), where Z1 = U1 / I1 and Z2 = U2 / I2
The impedances of PL segments b, c and d are, respectively:
Z2b = (Z2 * Z3) / (Z3 – Z2), where Z2 = U2 / I2 and Z3 = U3 / I3
Z3c = (Z3 * Z4) / (Z4 – Z3), where Z3 = U3 / I3 and Z4 = U4 / I4
Z4d = Z4, where Z4 = U4 / I4
Page 41
Deliverable D3.2 e-balance
© e-balance consortium 2015 Page 41 of (66)
If a light bulb blows up, the observed impedance by the upstream sensors increases, despite of their upstream
placement along the feeder. Nevertheless, the impedance relation measured by consecutive upstream sensors
placed before the faulty bulb (or bulbs) segment will remain steady. The interesting phenomenon is that the
relation of impedances, when compared between the sensors immediately upstream the faulty bulb and the
sensor immediately after (downstream), will not remain steady. When such event occurs, the related segment
is the one where the faulty bulb (or bulbs) is (are) located.
This detailed specification describes the algorithm proposed for detecting and locating fused luminaires,
which actually may occur simultaneously, even in different PL segments within the same feeder or in other
feeders.
Yet, there are few constraints worthy to be highlighted. The worst case for detecting a fused luminaire is at
the beginning of the PL feeder, especially if the number n of light bulbs is very high. In this case, the
accuracy for detecting a slight deviation in the impedance may simply be unachievable, which leads to the
need for validating the algorithm under this condition later on, in lab or at the EDP’s demonstration site in
Batalha.
Moreover, low power luminaires, e.g. LED based, will show more constraints on how to detect slight
impedance variations. The good move will be industry offering LED based public light bulb solutions that,
besides being more eco-friendly and resilient, would also include sensing capabilities within it. The proposed
algorithm would then need to be adapted to become suitable to accommodate such innovation.
4.3.2.9.3 LV - Fault prevention (LV)
The dynamic control of injected power by micro and mini producers is intimately related to the voltage level
control across all the LV grid nodes. A fairly intelligent algorithm must be developed to deal with the highly
stochastic conditions that it will face in the real-world. The algorithm’s goal is not to optimize voltage levels
across the grid’s nodes, but to keep them inside acceptable boundaries. As a form of fault prevention, the
algorithm performs voltage violation mitigation.
The LV Distribution Grid must have Sensors installed at selected distribution cabinets or overhead lines in
order to collect the Voltage Level, Current, Active and Reactive Power at each node. At each micro-
generation station there will be an Inverter, a Controller – the DERMU or CMU – and a Smart Meter. The
LVGMU will be the decision maker, performing a wide control loop comprising all feeder sensors’ data and
sending power set-points (%) to one or several micro-producers, in order to keep the voltage inside
acceptable boundaries. At each injection point, a local droop control performed by the Controller will cope
with the mentioned set-point, not exceeding it, while assuring that the voltage level will remain within
boundaries, despite of the stochastic conditions arisen from the variability of demand and of renewable
sources.
To know the LV state, the LVGMU periodically sweeps the available Sensors in order to poll their data
(Voltage Level, Current, Active and Reactive Power) and updates it’s RTDB (Real-Time Database). This
polling operation is performed node by node, and every time the LVGMU polls another node, a new
handshake must be made, which makes the polling operation a fairly slow process, resulting in asynchronous
grid snapshots. Due to this fact, a state estimation engine must be implemented.
The state estimation must run in the LVGMU and it must be capable of determining – at a certain extent –
the LV Grid’s steady state based on certain initial conditions. The steady state results are Voltage, Active and
Reactive Power Generated/Consumed at each node/busbar and voltage drops at each line.
If the LVGMU receives an overvoltage indication from a Wireless Sensor installed near a node containing
micro-generation, some action must take place as soon as possible. The LVGMU must start calculating the
ideal power set-point that will be a percentage of the installed capacity at the node’s production installation,
aiming at regulating voltage at the due LV node.
After calculating the suitable Power Generation value at the problematic node, the LVGMU must send the
new set-point to the Controller related to the energy micro-producer.
Once the overall condition returns to normal, meaning that the overall LV feeder demand copes with the
power being injected by each DER unit and by the secondary substation, with no foreseen voltage violations,
then the LVGMU will release the power set-points previously sent, thus restating the normal micro
Page 42
e-balance Deliverable D3.2
Page 42 of (66) © e-balance consortium 2015
production conditions. In this case, each Controller will receive a control set-point allowing its micro-
generation inverter to inject as much power as possible, limited only by the renewable source.
Besides voltage regulation, LV Fault Prevention can also assess other technical conditions of the LV assets,
namely by monitoring the current at the secondary substation feeder output and at distribution cabinets
protected by fuses. By adequate monitoring and by knowing the reverse time curve of each fuse, asset
monitoring will thus be possible to be implemented at LVGMU level.
The application will have as inputs real-time current measurements and alarms from LV sensors along the
LV feeders, comprising the distribution cabinets. The probability of LV grid collapse will then be assessed
and alarmed when applicable.
The LVGMU must be capable of interfacing the MVGMU, either for upstream reporting and alarming on
this kind of events, or for receiving control DER set-points. In this case, the LVGMU will be recalculating
the necessary power set-points for each DER, sent through each Controller. Moreover, at TLGMU level, any
due maintenance crew would then be scheduled for intervention upon any serious or warning alarm situation.
Besides voltage violation mitigation, another form of fault prevention is performing thermal stress
mitigation.
LV Sensors deployed along distribution cabinets and at distribution transformer LV feeders are strategically
placed to monitor the current that is flowing across the respective segment. Typically and in order to protect
those segments and their grid assets, fuses are used. Each fuse is selected according to the protection criteria,
meaning that after a certain high current threshold, the fuse will blow up, protecting all downstream LV grid
assets.
In fact, fuses show reverse curve behaviour, meaning that they will blow up upon an extreme current
situation and that they will remain in operation if current remains normal, which means that the current is not
exceeding its admissible maximum value. Between those extreme and maximum values, the fuse will allow a
certain thermal stress as a result of the faulty current, for a related time period. The higher the faulty current,
the shorter the time period the fuse can handle before blowing up. The lower the faulty current, the larger the
time period the fuse can handle before blowing up.
LV sensors participating in the monitoring of LV grid segments such as outgoing bays of secondary
transformers and of distribution cabinets are suitable to report faulty currents to the LVGMU. The LVGMU
is the neighbourhood device able to assess those fault measurements and trigger current alarms stating the
amount of stress those segments have been through. At LVGMU level, it is then possible to calculate the
amount of accumulated thermal stress for each LV grid asset, which is a contribution for preventive
maintenance. This kind of information is suitable for being reported to the higher hierarchical systems,
namely to the TLGMU via the MVGMU. There, suitable maintenance crews can be scheduled to perform
preventive tasks such as fuse upgrading – but only if the protected LV grid can handle further currents.
The LVGMU is also able to compute specific Key Performance Indicators (KPI) so that a clear picture on
the overall LV assets thermal stress could be disclosed towards a safer and resilient grid operation.
4.3.2.10 Security and privacy
Similar as it was in the case of the energy balancing service, the security and privacy module within the grid
resilience service stores the credentials related to the stakeholders, on behalf of which the service is working.
Again, it provides the security functions necessary to authorize the accesses to the data within the
communication platform, i.e., to create the securityPolicy parameters in the data interface functions. This
functionality includes signing the request using the stakeholder’s credentials. Having these functions local to
the service allows protecting the credentials from disclosing while using external security library. Thus, it
may be considered as a local copy of the same functionality.
More details are given in Section 4.4.
4.3.3 The user interface
The user interface is also represented by a service that reads the data out of the communication platform via
the data interface. It consists of different functionalities for presenting the data to the user and may be also
equipped with advanced analytical functionality to present statistics or suggestions for better energy
Page 43
Deliverable D3.2 e-balance
© e-balance consortium 2015 Page 43 of (66)
efficiency. This service will be present on devices with built-in user interface or on stand-alone user interface
devices.
4.4 Security and privacy modules
The e-balance security and privacy modules are distributed among all the parts of the management unit
architecture. They are represented by the blue boxes in Figure 20. This section will specify all the proposed
security and privacy solutions. It will be sorted by the level of the solution, i.e., the lower level solutions are
defined as part of the Communication Platform (and will be further covered by the deliverable D4.2), while
the privacy and security protocol for the data interface with its related and exclusive security solutions are
defined as part of the Energy Management Platform (and will be further covered by the deliverable D5.4).
Figure 20: The security architecture of the e-balance management unit
4.4.1 Communication Platform security and privacy
There are five major groups of security and privacy modules within the communication platform. They can
be defined as follows:
- Secure node maintenance, protection, parameterisation and reset
- Data access control
- Secure group management
- Secure storage
- Network stack security and privacy modules
The instantiations of these modules and their very specific functions depend very much on the hardware and
software characteristics of the specific management unit, but they should fulfil a specific set of requirements
Page 44
e-balance Deliverable D3.2
Page 44 of (66) © e-balance consortium 2015
in order to provide their function properly. Thus, the following sections will focus on these functions rather
than on specific implementation details and possibilities, but the latter will also be named.
4.4.1.1 Node maintenance, protection, parameterisation and reset
This block actually resides outside the communication platform. It covers all (or part of) the software
available on the unit, including the operating system. It shall provide the secure and trusted runtime
environment for the software executed on the management unit. The main features to be provided by this
block are to allow secure update of the code as well as parameterisation and reset of the unit. Additionally, it
is an advantage if the code can be executed in an environment with a hypervisor that detects malicious
execution. These functions are very much dependent on the underlying hardware and software architecture
that define the complexity and available functionality.
This block may be using a dedicated communication channel for secure unit maintenance. It is widely used
for wired or short range optical channels, like infrared, for maintenance purposes.
The main aim of the code update is to update the software running on the unit. This can be realized on
several levels of granularity, i.e., it may be a complete update (system image) or may involve only selected
modules. The code update may only support the underlying e-balance blocks (communication platform and
energy management platform), but it may also allow to update the code update functionality as well. Thus,
the code update can be differentiated according to the following features:
- System image update or Update of individual modules
- Updating operating system as well or Updating e-balance software only
- Updating the code update mechanism as well or Updating the e-balance software only
- Resetting the data and settings or Preservation of the local settings and data
The node parameterisation and reset is very much connected with the code update functionality, but also
covers the run-time configuration and re-configuration of the management unit. It allows (remote and secure)
configuration of the unit as well as (remote and secure) setting it in a stable state – reset.
Node protection includes mechanisms for a secure code execution. This includes the mechanisms for code
analysis prior to execution as well as mechanisms for controlled execution of the code. The main aim of
these mechanisms is to protect the unit against execution of malicious code that may harm the system. The
possible realisations include virtual machine monitors (hypervisor) for executing the code with a defined set
of allowed privileges, but may also be realized as a virtual machine executing programming language code
(Java, C#).
4.4.1.2 Data access control
This block verifies if the requests, coming either from the local energy management platform or from other
MUs are authorized. It shall implement the checks of the possible policies to be defined by the owner of the
data. The details of these policies will be further introduced in Section 4.4.2. The detailed description of
these policies will be provided in deliverable D5.4.
The Data Access Control verifies that the data accesses are authorized. Thus, it checks in the database with
the respective data item if the accessing stakeholder is allowed to access the data (according to the attached
security and privacy policy), verifies that the request was indeed issued by the stakeholder (signature
verification) and checks in the database when did the last access happen (if the maximum read frequency was
not reached). The keys of the allowed stakeholders are either stored in the certificate store or in the database.
It uses the following function to verify the signatures over the requests.
- verify(signature, message, key);
4.4.1.3 Secure storage
This module provides the security for protecting the stored data from unauthorized accesses. These accesses
include copying the database file for analysis on a remote machine. Thus, this module can for instance
encrypt the data before storing it in a file or on a storage device like hard disc, flash memory or similar.
Page 45
Deliverable D3.2 e-balance
© e-balance consortium 2015 Page 45 of (66)
The realisation possibilities depend on the applied database concept. If an already available database solution
is used then it shall allow for protecting the data. If a proprietary data storage solution is to be used, the data
records can be encrypted, using the unit’s own database key, before writing them on the medium.
Secure Storage uses mainly two functions:
- encrypt (plaintext, out ciphertext, key);
- decrypt (ciphertext, out plaintext, key);
The functions are used to encrypt and decrypt the values before there are stored in the database, if the
database does not directly provide the secure storage functionality. Thus, the values are stored and saved on
local data storage encrypted. The key (or keys) used by these two functions are management unit local keys
devoted to the database data encryption. The access to the keys can be embedded in these functions. The data
may be encrypted using a standard symmetric or asymmetric encryption, but it may also be encrypted using
the privacy homomorphism encryption. This allows further performing of a defined operation on the
encrypted data, like addition. This allows, for instance, storing encrypted values of energy usage data and
summing some of them up and decrypting once.
- add (a, b, out sum);
4.4.1.4 Secure group management
This module is responsible for performing security protocols for secure group management. It is mainly
responsible for verifying the identities of the management units (higher and lower level) while creating the
hierarchical structure of the e-balance system. This mainly includes signing the group access requests and
verifying these signatures on the verifying MU. This functionality relies on certificates and credentials
installed on the management units or provided at installation time.
Secure Group Management uses mainly two functions:
- sign (message, out signature, key);
- verify (signature, message, key);
These functions are used to sign messages and verify signatures and certificates for authentication purposes.
Authentication approaches based on usernames and passwords use the database for storing these credentials.
The keys used by the two functions are the ones of the local management unit (signing), but also of the other
communicating management units (verifying signatures). These keys are available in the certificates installed
at the unit or exchanged in the initial phase of the group management protocol and then stored locally in a
certificate store.
4.4.1.5 Network stack security and privacy modules
These modules include security mechanisms integrated in the protocol stack. These cover the functionality
like encryption and decryption of data, but also node authentication and negotiations of security parameters
between communicating devices.
Network stack security modules mainly use the following functions:
- encrypt (plaintext, out ciphertext, key);
- decrypt (ciphertext, out plaintext, key);
- sign (message, out signature, key);
- verify (signature, message, key);
4.4.2 Energy Management Platform security and privacy
An energy management platform service is a software (and possibly also a hardware) module that performs
some defined operations on the data available in the communication platform middleware. In order to access
the data, the service needs to use the Data Interface. The service operates on behalf of some stakeholder.
Page 46
e-balance Deliverable D3.2
Page 46 of (66) © e-balance consortium 2015
The functionality provided by the security and privacy module for the energy management platform services
allows them to generate a valid request for the Data Interface – signed in order to authorize the data access.
Further, the data (to be) stored in the middleware may be additionally protected by encryption. In order to
prepare the data for storing and also to use encrypted data the service uses the respective functions provided
by the module. If the values are encrypted using a privacy homomorphism, then the module also provides
respective functions allowing performing defined operations, like addition, on the encrypted data.
In order to perform these security related functions, the block provides also the storage for the security
credentials used by the security operations. These credentials include passwords and key materials (and
certificates).
Figure 21 shows the features provided by the security and privacy module in the energy management
platform. While preparing the data access request the service uses different functions provided by the
security and privacy module. Services working for multiple stakeholders may use individual security and
privacy module for each stakeholder. This allows separating the service logic and the credentials of the
stakeholders. Further, it is also possible to extract these modules and realize them as tamper proof hardware
solutions.
Energy Management Platform Service
Data Interface
Security and Privacy- Credentials store- Request signing- Value encryption- Value decryption- Value operations
Service Logic
enc/dec
sign
Figure 21: The security and privacy module within an Energy Management Platform service
The security and privacy block provides the following functions:
- sign (message, out signature);
- encrypt (plaintext, out ciphertext);
- decrypt (ciphertext, out plaintext);
- add (a, b, out sum);
The key accesses are embedded in the respective functions for the stakeholder.
Depending on the kind of the data access request different security related actions are performed and there
are different contents of the security parameter – securityPolicy (see Section 3.2). Common for all the four
request kinds, it contains the signature of the request issuer over the whole request (all the parameters of the
functional interface). Additional, for the write access done by the owner of the data, it also contains the
security and privacy policy defining the allowed operations on the written data item. If allowed, write
requests performed by users other than the data owner, result in applying the latest policy defined by the
owner or her default security and privacy policy, according to the owner preferences.
The security and privacy policy is defined for each written data value. It is a structured set of items and
contains the following data:
- identifier of the authorized stakeholder,
- identifier of the authorized service by the stakeholder the data may be used for,
Page 47
Deliverable D3.2 e-balance
© e-balance consortium 2015 Page 47 of (66)
- access rights (read, write), and
- the minimum delay between accesses (in seconds) – defining the maximum reading
frequency.
This set of items is provided for each authorized stakeholder and service combination. Stakeholder and
service combinations with exactly the same access rights may be grouped together.
Page 48
e-balance Deliverable D3.2
Page 48 of (66) © e-balance consortium 2015
5 Instantiation of the management unit
This section describes the differentiation in the management units depending on the level in the hierarchy.
The differences are related to the hardware, the involved software and to the data the unit processes. Figure 2
shows where the different management units are located.
5.1 Device management unit (DMU), Sensor, Actuator
For this group of devices there are two ways to include them in the e-balance system. The devices that do not
implement the e-balance architecture have to be treated as black boxes and the data, functions and actions
they provide are accessed entirely based on the API of a respective protocol – they push their energy
consumption and production related measurements or are polled for the data and the control data is pushed to
them, according to the protocol. This group of devices includes simple sensors or actuators, but covers also
more complex and intelligent devices, like smart appliances. They may use already available standard
protocols, like Z-Wave, Bluetooth, ZigBee, etc. For these devices we do not provide any general figure
defining the architecture, since the only thing that would be present there for sure is the networking stack and
some logic controlling the device. Covering all these devices using a gateway concept allows the e-balance
architecture to be much more flexible and extensible. Not supporting these devices would considerably
reduce the usability of the e-balance system, limiting its reach only to newly developed devices fully
supporting the e-balance architecture.
Figure 22: General architecture of a DMU, Sensor or Actuator supporting the e-balance architecture
On the contrary, the devices that are fully e-balance architecture conform and have the communication
platform available, can be accessed directly following the e-balance concept. The architecture of such
devices is given in Figure 22. There are, for instance, options for implementing the user interface, i.e., it may
be integrated and supported by the internal user interface service, or an external GUI device can access the
communication platform via the specific user interface networking stack. If no user interface is present, then
Page 49
Deliverable D3.2 e-balance
© e-balance consortium 2015 Page 49 of (66)
the device is not equipped with these two blocks, i.e., it does not need the user interface service, nor user
interface networking stack.
5.1.1 Hardware considerations
What is common for these devices from the hardware point of view is that they are rather energy constrained.
For a smart home solution, where the smart appliances monitor their energy consumption and allow being
controlled by a central device, like the customer management unit in the e-balance approach, each device
needs to be equipped with the DMU. Due to that, the DMUs, but also sensors and actuators, have to be
energy efficient. For that reason the DMUs, but also sensors and actuators, usually are implemented as low
power devices utilizing microcontrollers and low power and low data rate communication.
5.1.2 Data gathered and generated by the unit
The data exchanged at this lowest level of the e-balance hierarchy is usually only related to a single user
(stakeholder) – the customer the device belongs to. A DMU controls a smart appliance at customer premises
and all the data is related to the customer and shall be only directly accessible by this data owner, by means
of the CMU or a GUI device. In contrast, a sensor or an actuator can be located at different levels of the
hierarchy, being the major interaction means between the e-balance system and the energy infrastructure. In
this case it is necessary to define the ownership of the generated data as well as the stakeholders authorized
to read it.
The DMU, sensor and actuator devices generate measurements (energy related, but others as well) and
provide their status. Such messages may be of periodic nature. These devices usually receive control
commands that trigger defined actions, like taking a measurement or starting a defined action.
5.2 The GUI device
The GUI device is a special device that only provides the user interface functionality. However, this GUI
functionality is not only related to the graphic representation of the data, but it also allows active processing
prior presenting the data. Thus, the GUI device is also implementing the communication platform and is
connected to a management unit using a specific networking stack. This approach allows a modular
implementation of the system and allows also separating the data processing related entirely to energy
management from the data processing related to the presentation of the results to the user.
The general architecture of the GUI device is provided in Figure 23. The device mainly consists of the user
interface networking stack, the communication platform and the user interface service in the energy
management platform. The GUI module can include any kind of data processing and analysis mechanisms
that can be applied to the data.
5.2.1 Hardware considerations
The GUI device shall provide a possibility to interact with the user. It may present the data graphically but it
may also have a simplified form. The hardware requirements depend on the required computational power
for the data pre-processing, but also on the required up-time. The presentation of the data on the device shall
be user friendly and controllable by the user preferences. The GUI device itself should also be flexible in the
sense that different devices can be used for that purpose after installing proper software and connecting to the
system.
5.2.2 Data gathered and generated by the unit
The GUI device can access (read and in some cases write) the entire user related data available on the
customer management unit (CMU). This includes the energy consumption and production related data,
sensor readings and the states of the customer devices. The device shall also allow defining the strategy of
the customer, i.e., defining the targets and set-points. Additionally, the GUI device may be used for
managing the relationships with other stakeholders, e.g., defining the data access rights and contract
parameters.
Page 50
e-balance Deliverable D3.2
Page 50 of (66) © e-balance consortium 2015
Figure 23: General architecture of a GUI device
5.3 Customer management unit (CMU)
The customer management unit (CMU) is the central unit at the customer premises (house or flat). It controls
all the user devices in order to achieve the strategy defined by the user. It connects to all the (smart)
appliances, namely controllable loads as washing machines and EV chargers, as well as any micro-
generation inverter (e.g. from a PV unit) or a storage inverter. Moreover, it monitors their status and controls
them or forwards the commands from higher level of the system, if allowed so by the customer. Thus it is the
de facto concentrator or control hub for the customer devices.
From the functionality point of view, the main task of the CMU is to execute the energy balancing
mechanisms (supported by the prediction means). It may be equipped with an integrated GUI or support
external GUI devices. It also allows performing voltage regulation over micro-generation inverter, directly
controlling the embedded DMU existing in that inverter, as a response to power set-points arising indirectly
from the LVGMU.
5.3.1 Hardware considerations
The CMU is going to be active for 24 hours, 7 days a week, thus it is advisable that it is an embedded PC,
with reduced energy consumption, not to influence the energy bill too much. It should support the necessary
communication technologies to connect to the customer (smart) appliances. The set of communication
modules shall be extendable.
Page 51
Deliverable D3.2 e-balance
© e-balance consortium 2015 Page 51 of (66)
Figure 24: General architecture of the customer management unit (CMU)
5.3.2 Data gathered and generated by the unit
The CMU receives status and measurements data from the DMUs within the customer house and provides
these with control commands. Similar, depending on the active functionality it provides the (summarized)
status of the customer devices (house) up the hierarchy to the low voltage grid management unit – LVGMU
and receives the control commands. It may also connect to the smart meter to obtain the energy related data,
like tariff detail or similar.
5.4 Smart Meter (SM)
Smart meters (SM) are located downstream the secondary substation. They are normally placed at
householders’ and small industries’ premises, e.g. consumers or prosumers. Smart meters may also be placed
at distribution cabinets and also at each secondary substation’s LV distribution board. This broad use can
also be expanded to other LV feeders, such as those serving public lighting facilities. Smart meters collect
end user energy related data, as well as other measurements, comprising voltage at the interconnection grid
point.
Typically, Smart Meters send their energy related data to specific metering concentrators which, in turn, send
such data to metering head-end systems, before being sent by these later to the Metering Data Management
System, a TLGMU component. The proposal within e-balance is to relate Smart Meters with the LVGMU
which acts also as a metering data concentrator. Smart meters send end user energy related data and grid
measurements (instant and historic) to the LVGMU.
Smart Meters may use their HAN port – when applicable – to interface the CMU, bridging all grid
management units with the CMU. The purpose is to provide controls for demand response and also tariff
indications for the end users awareness. Due to that, the Smart Meter can be regarded as a special case of a
LV sensor with additional gateway functionality – it connects the CMU with the LVGMU.
Page 52
e-balance Deliverable D3.2
Page 52 of (66) © e-balance consortium 2015
The general architecture of the smart meter is presented in Figure 25. The available functionality is mainly
covered by the energy balancing service, where the sensor readings are gathered (device manager) and these
values are used to calculate derivatives, like energy flow, power factor, etc.
Moreover, as the Smart Meter bridges the CMU with the LVGMU, it supports performing voltage regulation
within the LV Fault Prevention feature. It also participates in performing all grid resilience features because
it participates directly with its energy metering data in performing LV Losses Calculation and performing
Fraud Detection. Additionally, as it is also considered as an LV sensor, it participates as data source in the
overall Energy Management Platform.
Figure 25: the general architecture of a smart meter supporting the e-balance architecture
5.4.1 Hardware considerations
The smart meter is an embedded platform. It interfaces with the LVGMU on the related LV network. The
communication with the LVGMU may use different technologies, but standards are preferred, e.g. RF Mesh,
PLC, or GPRS. Smart meter communication with upper layers, e.g. TLGMU, will be over GPRS. Common
Smart Meters’ HAN communication technologies are also standard, e.g. HomePlug, ZigBee, Z-Wave,
Bluetooth or Modbus via RS485.
5.4.2 Data gathered and generated by the unit
The smart meter provides the LVGMU with measurements data (voltage and current) and parameters
calculated based on these measurements, like active, reactive power and cumulative energy. It provides the
LVGMU also with parameters related to the quality of supply, like voltage deviations and interruptions in
supply. In turn, the smart meter gets from the LVGMU information on the tariffs, their temporal parameters
and energy (kWh) costs. The LVGMU sets also the total load control set-point for the household.
Page 53
Deliverable D3.2 e-balance
© e-balance consortium 2015 Page 53 of (66)
5.5 DER management unit (DERMU)
A Distributed Energy Resources (DER) management unit (DERMU) corresponds to the device management
unit for some specific DER device that may be connected to different voltage level parts of the grid, i.e., the
LV grid or the MV grid. As such, it may respectively interact with the LVGMU, the MVGMU or the
TLGMU. The DERMU will keep the status information of the supervised DER up-to-date and it will control
the DER operation according to the parameters set by higher layer MU.
The architecture of the DERMU is presented in Figure 26. It shows that the functions supported by this unit
mainly support the energy balancing – control and monitoring of the energy production and consumption of
the DER device.
Figure 26: General architecture of a DER management unit (DERMU)
5.5.1 Hardware considerations
The DERMU will have to interface with power injecting equipment (e.g., inverters) and thus will have to
support their monitoring and control communication interfaces. In the case of photovoltaic (PV) distributed
generation, Bluetooth and RS-485 are supported in several off-the-shelf PV inverters, e.g. SMA’s Sunny Boy
3600TL inverters, while WiFi and Ethernet are supported by other manufacturers, e.g. EnaSolar’s Grid Tied
inverters.
Again, the energy consumed by the DERMU has to be limited to a reasonable amount. Thus, the unit will
rather be implemented as an embedded solution.
5.5.2 Data gathered and generated by the unit
As the lowest level in the hierarchy of e-balance units, the DERMU exchanges the data with the upper level
unit only. The data for the DERMU operation includes several groups of items.
Page 54
e-balance Deliverable D3.2
Page 54 of (66) © e-balance consortium 2015
The first group includes configuration data, defining the limit on the contractual energy export, the
power factor to be provided by the DER and the voltage limits (lower and upper).
The second group includes the parameters of the DER exposed to the upper level unit, like the
nominal values of the maximum power; maximum reactive power; time needed for starting,
restarting and stopping; as well as the ramp load or unload rate, power versus time.
The third group includes the set points defined by the upper level unit: target power, target reactive
power, power factor control and voltage.
The fourth group includes the start and stop control signals generated by the upper level unit.
The fifth includes the current and voltage parameters measured by the DERMU.
The last group includes alarm signals triggered by the DERMU in case the current is too high (over
current) and voltage is outside the defined range (voltage too high or voltage too low).
5.6 Low Voltage Grid management unit (LVGMU)
A low voltage grid management unit (LVGMU) is located at a secondary substation. It controls the sensors,
actuators, customer management units and DER management units located in the area of the grid supplied
with energy by this secondary substation. It also receives measurements (instant and historic) from smart
meters. It is controlled by a medium voltage grid management unit (MVGMU). As such, it may interact with
MVGMU, DERMU, Smart Meter and also with CMU, in this case only if the bridging role of the Smart
Meter is not available.
Figure 27: General architecture of a low voltage management unit (LVGMU)
Due to its strategic location, the LVGMU acts also as metering data concentrator, thus providing aggregation
services, bridging all served downstream feeder smart meters with the metering data management system,
which may comprise also metering head-end systems.
Page 55
Deliverable D3.2 e-balance
© e-balance consortium 2015 Page 55 of (66)
The architecture of the LVGMU is provided in Figure 27. It shows that the energy management functionality
is focusing on the LV grid monitoring (resilience) and on the energy balancing.
5.6.1 Hardware considerations
The LVGMU is hosted on one or more computers, including embedded technology. The LVGMU interfaces
with LV network and sensors at the secondary substation and with DER – via their DERMU – and smart
meters on the related LV network. The communication with these devices may use different technologies,
but standards are preferred (RF Mesh, PLC, GPRS). Communication with upper layers will be over Ethernet
or GPRS.
5.6.2 Data gathered and generated by the unit
The LVGMU communicates down the hierarchy with CMU, Smart Meters and DERMU, as well as up the
hierarchy with the medium voltage grid management unit (MVGMU). It also communicates with sensors and
actuators within the secondary substation and in the LV energy grid. The data items relevant for LVGMU
operation can also be grouped in several classes.
The first includes the measurements (real-time and historic) collected by all the devices controlled
by the LVGMU: CMUs, Smart Meters, DERMUs, sensors. These data includes current and voltage,
but also active and reactive power values. It also may include the real-time and historical position for
secondary substation transformer tap changer, provided it performs on load tap changing.
The second group includes the configuration provided from the TLGMU (directly by the MVGMU)
including the topology of the LV grid and its characteristics. It also includes the description of the
phases connected to each smart meter or DER.
The third group includes the estimations for each grid node with respect to the voltage, active and
reactive power.
The fourth group is a set of values for each DER, including the characterisation of the DER, its
status and the support for remote control, the grid supporting services and availability to participate
in these, the identification of the market agent, the total active and reactive power injected or
consumed, total energy consumed and produced, the power deviation yield compared to historical
database, voltage deviation and the deviation to grid maximum capacity.
The fifth group includes the signals from the sensors indicating that a fault in a segment or a fault in
the luminaire electrical phase was detected.
The data from the sixth group provides the MVGMU (and TLGMU) with the information on the
detected fault and the (potential) location of these faults.
The seventh group covers the results of the fraud detection, the LVGMU provides the upper level
units with the information that fraud was detected as well as with the information where it could
happen.
The eighth group includes data related to the quality of service. On one hand it covers the live
signals and historical data on the voltage quality disturbances and interruptions collected by the
LVGMU from the LV sensors and smart meters, but on the other it also covers the summary of these
the LVGMU provides to the MVGMU (and then further to the TLGMU).
The ninth group covers the voltage regulation aspects in the LV part of the grid. It includes the state
of the voltage regulation function provided by the smart meters and DERMUs to the LVGMU as
well as the summary the LVGMU provides to the MVGMU. Additionally, it includes commands to
activate and deactivate the voltage regulation function issued by the MVGMU to the LVGMU and
by the LVGMU to the DERMU, smart meters and CMUs.
The tenth group includes the data related to the energy losses, including the total energy losses at the
secondary substation as well as the reference energy losses profile. The former is provided by the
LVGMU to the MVGMU (and TLGMU) while the latter is provided by the MVGMU (TLGMU) to
the LVGMU.
Page 56
e-balance Deliverable D3.2
Page 56 of (66) © e-balance consortium 2015
The eleventh group includes the data related to the energy balancing, energy injection and load
control. It includes the commands to control the injected power set points as well as the total load set
points, provided by the upper level MUs (MVGMU and TLGMU) to the LVGMU and by the
LVGMU to the smart meters, CMUs and DERMUs. This group includes also the typical load
diagram according to different aggregation criteria provided by the LVGMU to MVGMU (and
TLGMU) as well as the data on the tariff indication provided by the MVGMU (and TLGMU) to the
LVGMU and by the LVGMU to the DERMUs, CMUs and smart meters.
5.7 Medium Voltage Grid Management Unit
(MVGMU)
A medium voltage grid management unit (MVGMU) is located at a primary substation. It controls the MV
sensors and actuators, the LV management units located at secondary substations related to this primary
substation as well as the DER management units in the area for DER devices connected directly to the MV
grid. The MVGMU is controlled by the Top Level Grid Management Unit (TLGMU). As such, the
MVGMU may interact with TLGMU, DERMU and LVGMU.
The architecture of the MVGMU is provided in Figure 28. The major functionality is related to the MV grid
monitoring and the energy balancing on the MV grid level.
Figure 28: General architecture of a medium voltage grid management unit (MVGMU)
5.7.1 Hardware considerations
The MVGMU interacts with sensors and actuators residing at the primary substation and with sensors and
actuators existing on the MV grid. The communication with these devices may use different technologies;
yet, communication gateways always use standard SCADA protocols. It is assumed that communication with
TLGMU is supported on Ethernet. Communication with LVGMU can use different technologies.
Physically, the MVGMU is a host computer running virtual machines, namely: a SCADA frontend, a
workstation and the MVGMU server itself.
Page 57
Deliverable D3.2 e-balance
© e-balance consortium 2015 Page 57 of (66)
5.7.2 Data gathered and generated by the unit
The MVGMU focuses on the monitoring of the MV grid and on the energy balancing on that level. Thus, the
groups of data exchanged by this unit mainly relate to these functions.
The first group relates to the energy balancing and the exchange of the energy profiles between the
MVGMU and the TLGMU as well as between the MVGMU and its underlying LVGMUs and
DERMUs.
The second group includes the configuration data, mainly the MV grid topology and its
characteristics. This configuration is created by the MVGMU itself or is defined by the TLGMU.
The third group includes the measurements obtained by the MVGMU from the underlying MV-FAN
and PS-LAN sensors. It also covers the derivatives of these values, like the active and reactive
power, etc.
The fourth group includes all the results of the MV grid monitoring services, namely the status and
result values provided by the MVGMU to the TLGMU as well as the control signals and commands
provided by the MVGMU to its underlying LVGMUs and actuators.
5.8 Top Level Grid Management Unit
The top level grid management unit (TLGMU) is the main concentrator and control station in the e-balance
system. It collects the results and signals from the underlying MVGMUs and DERMUs for DER connected
at the MV grid level, assuring their coordination with respect to the energy balancing as well as management
of the grid assets with respect to the energy grid monitoring and resilience. The TLGMU provides the data to
a series of management tools, like supervisory control and data acquisition (SCADA), market management,
outage management, Distribution Management System (DMS), and Metering and energy Data Management
(MDM). The top level grid management system can also communicate with the Transmission Service
Operator (TSO). If the system will be further extended to provide even higher management unit levels, the
TLGMU communicates with the MUs coordinating the TLGMUs of different DSOs.
Figure 29 presents the architecture of the TLGMU within the e-balance system. The provided functionality
focuses on the energy balancing and on the grid monitoring and resilience on the MV grid level.
5.8.1 Hardware considerations
The TLGMU is a server computer able to process large amount of data. It shall also be equipped with
communication modules supporting technologies able to deliver the data from the remote MVGMUs within
the time and quality constraints.
5.8.2 Data gathered and generated by the unit
The TLGMU receives directly all data provided to it by the underlying MVGMUs. The data includes the
status and results directly generated by the MVGMU services. The TLGMU receives also data collected and
generated on the lower levels of the system. The hierarchical structuring of the data allows providing a
scalable view on the state of the grid. On the other hand the TLGMU generates the commands and control
signals for the MVGMU, as well as for the lower level management units.
The data is available for the management tools and potential higher level management units.
Page 58
e-balance Deliverable D3.2
Page 58 of (66) © e-balance consortium 2015
Figure 29: General architecture of a top level grid management unit (TLGMU)
Page 59
Deliverable D3.2 e-balance
© e-balance consortium 2015 Page 59 of (66)
6 Information Flows
This section provides a summary of the multi-level information flows based on the data exchanges as defined
in the previous section. Figure 30 presents a simplified system level architecture of the e-balance system with
only a single unit of a kind on each system level. The figure presents also the physical locations of the
devices taking part in the data exchange. The figure will be used for the following discussion on the data
flows and can be used for identifying the potential security impact of the data exchanged in the system
between the different management units and other devices. However, the security related discussion will be
focus of deliverable D4.2 and deliverable D5.4.
Figure 30: Simplified e-balance system level architecture for information flow discussion
6.1 Identification of the Information Flows
In the e-balance system we have several multi-level information flows. We will try to identify these flows in
general and then present them in detail.
The first and main information flow going up in the hierarchy is the energy consumption and
production data propagation. It starts at the customer premises and the data is processed (aggregated)
at each system level and is transmitted to higher levels. It covers all the consumption and production
sites at all the grid levels. It can be mainly regarded as the individual metering of each customer
(including DER and large energy customers at other grid levels), but it is also used by the energy
balancing and by the grid resilience service.
The second information flow going up in the hierarchy is related to the status of the monitored assets
in the grid. The data includes the measurements (sensor values) on the monitored grid devices, but
Page 60
e-balance Deliverable D3.2
Page 60 of (66) © e-balance consortium 2015
also status and alarm signals. The data is collected and is propagated up in the hierarchy to the
respective logic blocks, either directly or aggregated. These blocks can trigger actions and report
signals and measurements based on these inputs. This information flow mainly covers the
monitoring functionality of the grid resilience service.
The third information flow goes down in the hierarchy and it covers control signals that steer the
monitored grid assets. The control signals allow reacting to events recognized by the energy grid
monitoring algorithms and help to prevent losses related to: (1) energy inefficiency in the
distribution grid, (2) asset misuse or wear out, and (3) fraud. This flow mainly covers the control part
of the grid resilience service.
The fourth information flow is going down in the hierarchy and is providing the necessary
information for proper definition of localized decisions, like the energy price or weather forecast
data. This information can be global, but it may also be individual for each participant, like localized
weather forecast or individual energy price depending on the individual contract. This data is
provided by some central location at the top level and is propagated down to the individual
customers (including DER). The data can be divided in two groups, system related data that is
provided within the existing contract with the DSO or energy supplier (or aggregator) and the
additional data that is provided by external service providers and may require additional contracts.
The fifth information flow is related to the energy balancing and covers the bidirectional data
exchange at each level of the hierarchy during the negotiations towards the planning of the energy
usage and production with the goal to reach the ideal and desired energy balancing in the current
level of the grid. The desired balancing profile is propagated down in the hierarchy and the real
profile (the result of the negotiation) is then propagated up in the hierarchy and is aggregated at each
level.
6.2 Data ownership and processing of data
Data belonging to different stakeholders is involved in the identified information flows. This section will
discuss the question of data ownership and the blurring data resolution and ownership obtained by data
aggregation.
The data owners can be split into four groups. Each group has different characteristics with respect to the
data kind and data generation, processing and gathering. These groups are:
Customers – the collected data may reflect the behaviour of the customer and may thus be used to
profile the customer. Customers mainly generate data, but also consume data needed for taking local
decisions or influencing these decisions, like market related data (energy price), weather forecast,
other control signals from stakeholders the customer have contract with (DSO, energy supplier,
aggregator, service provider, etc.). This data is owned by the stakeholders providing it and the access
control is driven by the respective security and privacy policy, defined by the stakeholder. The
customers own the data directly generated by the customer CMU, but also by the smart meters
related to her consumption and generation profile.
DSOs – collect data mainly to perform the operation and maintenance of the grid. The DSO directly
owns the data collected using the sensors distributed in the LV grid, MV grid as well as the sensor in
primary and secondary substations. It also owns the results of the operations on this data performed
on the management units (LVGMU, MVGMU and TLGMU). DSO also owns the control signals it
generates for the downstream MUs it manages, as well as for the customers, energy suppliers and
aggregators.
Energy suppliers, aggregators, service providers – mainly own the data related to their service,
including data originally produced by these stakeholders, like energy price or desired profiles, but
also the data and control signals produced based on data collected from their customers.
Data providers – provide data, like weather forecast to the customers and other stakeholders. They
own the data and usually they do not consume any data generated by other stakeholders.
The stakeholders’ involvement in the data flows and the diversification of stakeholder relations and their
coexistence on the management units is depicted in Figure 31. It shows only a single management unit on
Page 61
Deliverable D3.2 e-balance
© e-balance consortium 2015 Page 61 of (66)
each of the grid infrastructure levels (LVGMU, MVGMU and TLGMU) and three management units
representing three customers (CMU). The figure also shows the services running on the management units in
the grid. These services run on behalf of example stakeholders – three energy suppliers, one aggregator and
the DSO. The grid resilience service runs on behalf of the DSO, while there are four instances of the energy
balancing service, each running on behalf of the respective energy supplier or the aggregator.
Figure 31: Example information flows involving customers, their energy suppliers and the DSO
Figure 31 shows a simplified e-balance system topology with the management units located within the grid.
The dashed blue lines show the data paths for the information flows involving the customers and their energy
suppliers – these information flows are related to energy balancing and exchange the data between the MUs
up, down or in both directions following these paths. Additionally, the dashed red lines show grid resilience
related information flows involving the customers and the DSO. As shown in the Figure 31, the customers
can have different relations with the other stakeholders (depicted are relations with energy suppliers and the
DSO). Customer 1 has contract with Energy Supplier 2 and thus, provides her data to this stakeholder to the
extent according to her privacy and security policy. Similar, Customer 2 and Customer 3 have contract with
Energy Supplier 3. Thus, the latter processes their data on all the levels of the e-balance system. The only
DSO in the system is handling the resilience related data from all the customers.
Page 62
e-balance Deliverable D3.2
Page 62 of (66) © e-balance consortium 2015
As the data is transmitted following the paths, it is also processed and the data of several customers may be
aggregated together and form new data describing the grid on a higher level. This new data may be also
owned by the energy supplier or DSO and due to the aggregation (over time or number of customers) the
privacy related information is blurred, thus the harm is minimised. E.g., the result of the aggregated data of
Customer 2 and Customer 3 (and also possible over time) is new information that may now be owned by the
Energy Supplier 3. But in any case, if any stakeholder uses directly the data provided by the customer on
higher levels in the hierarchy, then the ownership of the data has to be respected (as well as the respective
privacy and security policy).
6.3 Data flows and initial analysis of security aspects
The information flows are inseparably connected with data exchange between devices, involving
communication as well as different security and privacy aspects. As the first example, let us provide an
analysis of the flow involving the customer data.
Starting at the customer premises, the DMUs, HAN Sensors and Actuators collect and exchange data related
to the customer devices and data to control these. Due to that, the data allows describing the detailed
behaviour of the customer with respect to energy consumption and generation, but it also allows controlling
the customer devices.
Due to that, having the possibility to receive (eavesdrop) the data in the HAN allows profiling the customer –
recognizing her habits on everyday life aspects. Being able to influence (modify) the data enables one to
control the customer devices. It is thus in the interest of the customer that the data is protected from
unauthorized accesses. And since the HAN includes mainly the devices belonging to the customer or being
under her control it is possible to create a security protected network of trusted devices that exchange
encrypted data, which requires specific actions on the customer side.
The CMU is the central unit of the customer HAN and may be thus used to participate in the management of
the communications network configuration, extensions and data accesses from the upper layers. The data
about the customer collected within the HAN shall then be provided to the outside world only via the CMU
and only according to the policy defined by the customer. The fact that the customer devices are rather
located entirely at customer premises helps to protect these from direct physical influence (tampering).
On the other hand, there is data that is provided to the customer from the upper layer of the system, i.e.,
directly by the smart meter and by the LVGMU. The CMU has to react to this data according to customer
preferences and strategy. This data includes the individual or global energy pricing signals, but also control
signals to influence the way the customer devices work.
The data from the outside of the customer premises can also come over external channels, like the Internet
connection. In this case the source of the information has to be trusted and the data has to be protected by
security means at least against alteration (integrity) and, if needed, against unauthorized reading (secrecy).
Additionally, the reliable delivery of critical data has to be assured. It is hence advisable to rely on the e-
balance internal data communication for critical data. Data that is not critical can also be delivered using
other channels. It is to the customer to decide which data is critical for her, but some data shall be defined
critical per default and the customer needs to explicitly change this setting. An example here may be the
weather forecast data. For a small household it may not be very critical, but incorrect or altered weather data
may anyway influence the prediction algorithms and cause incorrect decisions. In the worst case, this can
cause some financial losses for the customer due to incorrectly predicted amounts of scheduled energy use in
wrong times, e.g., when the energy is more expensive. But for a customer who is a prosumer with a moderate
energy production the weather data may already be critical in both the sense of accuracy and timeliness.
Incorrect predictions can cause losses if the customer declares a given production and is obligated to deliver
the energy.
Another example is the energy price. If it is dynamic and global for all the customers, then it could be also
accessed over other channels like Internet. But, if it would be possible to alter its value, then it could
influence the customers’ decisions on energy consumption and production (like discharging energy storage),
causing financial losses.
Page 63
Deliverable D3.2 e-balance
© e-balance consortium 2015 Page 63 of (66)
For the above mentioned data kinds, altering of their values or blocking access to the data (denial of service)
can cause imbalance in the grid. And if done at large scale in a coordinated way, this can have a great impact
on the stability and availability on the electrical grid.
The CMU can provide the HAN internal data to energy management services running on higher level
management units, like the LVGMU, the MVGMU or the TLGMU. The access to the data is controlled
based on the security and privacy policy defined by the customer. I.e., the data is provided by the CMU only
to services running on behalf of stakeholders that were defined by the customer to be allowed to access the
specific data.
Another data set relevant for the customer privacy is represented by the data collected by the smart meter
outside of the HAN. This data shall also be handled according to the customer preferences, but not violating
the contract with the energy supplier or DSO. There is a simple mechanism to do a check if the customer
settings violate the contract, i.e., if the accesses that fallow the contract end up with an access deny, then the
customer has set to strong access restrictions. A procedural solution would be to define in the contract the
necessary access rights for the respective stakeholder. This means, for instance that the energy consumption
and production readings collected by the smart meter shall be accessible to the energy supplier for billing
purposes and to the DSO for grid management purposes with a sampling rate not smaller than the one
defined in the contract. The customer may however increase this rate for additional benefits from the energy
supplier or DSO. The customer may also enable access to this data to other stakeholders, like an aggregator
working for her. This procedure can be realized in the following way. The energy supplier and DSO access
the data directly at the smart meter with the maximum defined access rate. Accesses by other stakeholders or
accesses by energy supplier or DSO, but with higher sampling rate require access via the CMU. And the
CMU receives the real-time readings with higher sampling rate directly from the smart meter. This approach
helps to avoid the need for modifications to the already available smart meter hardware and software. Future
implementations can also involve smart meters, where the service reading the sensors on the smart meter
runs on behalf of the customer and the customer defines the security and privacy policy for her data at the
CMU and this policy is then executed directly on the smart meter. In order to increase the interoperability
with already available and deployed smart meters we suggest combining the technical and procedural
solutions to achieve the protection of the customer privacy.
The data from different customers is further collected/accessed by the LVGMU (see example in Figure 31).
It is then used by the energy management services executed on the LVGMU on behalf of the respective and
authorized stakeholders. The accesses are controlled according to the privacy and security policies of the
respective customers.
The data that is the result of these services’ operation is a form of an aggregation of the customer data, e.g.,
over time or over a set of customers. This is following the idea of the e-balance fractal-like approach, i.e., the
summary of the lower level (CMUs) is processed locally at the LVGMU and provided to the MVGMU. But,
if necessary, e.g., after detecting a CMU event (fraud, etc.) the details from the CMU level can also be
accessed directly by the management tools on the MVGMU or even on the TLGMU, to show the details of
the event. Thus, to support the service tasks it is important to allow the services to access the customer data
with enough detail (sampling rate), but in order to avoid profiling of the customer organisational procedures
and privacy protection policies have to be defined and implemented.
The customer data aggregated on the LVGMU is then further provided to the MVGMU and further to the
TLGMU. As already said, the aggregation over time or over set of customers hides the details of individual
customers and reflects the summarized behaviour of the branch of the grid managed by the LVGMU, the
MVGMU and the TLGMU. And since this is new data – it becomes the property of the respective
stakeholder who provides the service. But, if the detailed data about an individual customer is provided up in
the system hierarchy, it is always marked as the data of the respective customer. And in this case, the
customer privacy and security policy applies. Additionally, it is here important to define the minimum level
of data aggregation that allows defining the data to be new and owned by the service provider. This has to be
done in order to avoid ownership transfers while keeping the level of information allowing misusing the data.
The control signals coming from the TLGMU, the MVGMU, as well as those generated directly by the
LVGMU, are provided to the CMU and to the smart meter. The data representing the signals belongs to the
stakeholder who runs the respective service, e.g., the energy supplier, the aggregator or the DSO.
Page 64
e-balance Deliverable D3.2
Page 64 of (66) © e-balance consortium 2015
A similar information flow involves the sensors and actuators in the grid (LV and MV), as well as in the
secondary and primary substations. The main difference is that these devices all belong to the DSO and also
the data generated by them is owned by the DSO. From the security perspective, the data is very critical and
especially its modification can lead to destabilisation in the grid.
Page 65
Deliverable D3.2 e-balance
© e-balance consortium 2015 Page 65 of (66)
7 Summary and Conclusions
This document describes the e-balance system architecture at a detailed level. Compared to the high level
system description given in deliverable D3.1 this document provides more details and extensions to the
initial concept that evolved while the consortium worked on the system.
The management units, their internal structure and the interaction between them have been described to
provide a guideline on how the e-balance system shall work as well as how it can be implemented to achieve
the defined goals.
The management units are modular and consist of two main layers:
the communication platform with the middleware as a central part that provides common definition
and rules for the data exchange and addressing, as well as provides the common data interface; and
the energy management platform that consists of energy management services that use the common
data interface and provide the distributed logic to realize a diversity of services for optimizing the
energy grid, increasing its energy efficiency, decreasing losses, while balancing the overall energy
use on a bottom-up fractal-like perspective.
Thus, the system architecture is modular in the sense that the implementation of each platform can be
exchanged seamlessly as long as the common interface is used. Additionally, the common interface provided
by the communication platform allows also extending the energy management platform with additional
services. This modularity and extendibility supports the applicability of the proposed approach.
Further, the fractal-like hierarchic architecture improves the scalability of the approach and the reuse and
compacting of algorithms. Scalability stems here from the fact that the problem can be divided into smaller
ones in the sense of managed power and region. And the fractal-like solution allows to reuse the same (or
very similar) and simpler algorithms on each system level, due to the fact that, e.g., the problem of balancing
energy consumption is the same at each level, just the scale changes from KW to MW.
The distributed service logic is provided by different stakeholders and all these stakeholders have their own
goals. The idea of the e-balance system is to provide a common platform with means that allow stakeholders
to define their goals and strategies that are then executed for each stakeholder and for all of them together.
The customers can define the data they want to provide to other stakeholders, naming these stakeholders as
well as the services that are allowed to use the data. The way to implement such a common platform was
described in this document.
Further work on the e-balance system and its evaluation may cause revision to some initial concepts and
solutions. These will be then covered by the following deliverable in the Work Package 3 – deliverable D3.3.
Page 66
e-balance Deliverable D3.2
Page 66 of (66) © e-balance consortium 2015
References
[1] CEN-CENELEC-ETSI Smart Grid Coordination Group, "Smart Grid Reference Architecture," November 2012.
[2] Antonio Grilo, et. al., "Deliverable D4.1 - Detailed Network Stack Specification and Implementation”, Public deliverable of e-balance project, FP7-Smartcities-2013, Project number 609132, 2015.
[3] M. Gerards, M. Jongerden, et. al., “Deliverable D3.1 - High Level System Architecture Specification”, Public deliverable of e-balance project, FP7-Smartcities-2013, Project number 609132, 2014.