E-business in Maltese Enterprises Alfred Camilleri Director- General National Statistics Office Lascaris Valletta CMR 02 Tel: 25997000 Fax: 25997205 / 25997103 E-mail: [email protected]www.nso.gov.mt
Transcript
E-business in Maltese Enterprises
Alfred Camilleri
Director-General
National Statistics OfficeLascaris Valletta CMR 02Tel: 25997000Fax: 25997205 / 25997103E-mail: [email protected] www.nso.gov.mt
Scope of exercise
• Different NACE divisions covered;
• Comprehensive census among enterprises with 10 and more full-time equivalent employees;
• Sample among enterprises with less than 10 full-time equivalent employees;
• Sample of 1,474 enterprises;
• Response rate of 70 per cent.
Metadata• Definition
Micro 1-9 FTE employees Small 10-49 FTE employees Medium 50-248 FTE employees Large 250 and over FTE employees
• Reference period
All information as at 2005 except for: purchases data refer to 2004 turnover data refer to 2004
• Questionnaires
One addressed to enterprisesOne addressed to individuals and households
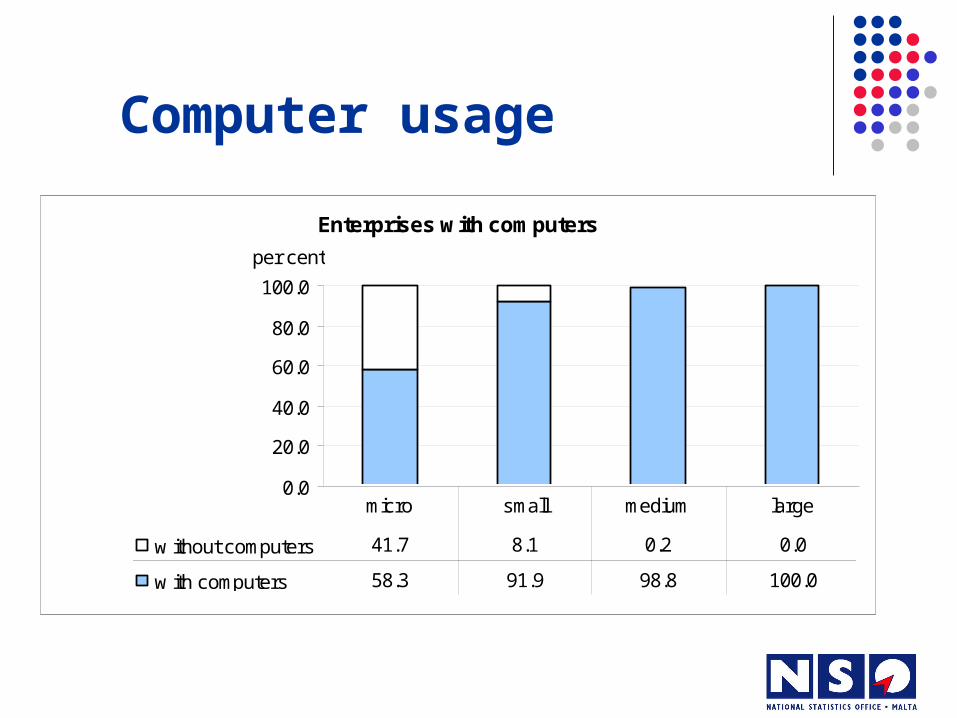
Computer usage
Enterprises with computers
0.0
20.0
40.0
60.0
80.0
100.0
per cent
w ithout computers 41.7 8.1 0.2 0.0
w ith computers 58.3 91.9 98.8 100.0
micro small medium large
Internet usage
Enterprises w ith access to Internet
0.0
20.0
40.0
60.0
80.0
100.0per cent
w ithout internet 49.6 12.6 2.5 0.0
w ith internet 50.4 87.4 97.5 100.0
micro small medium large
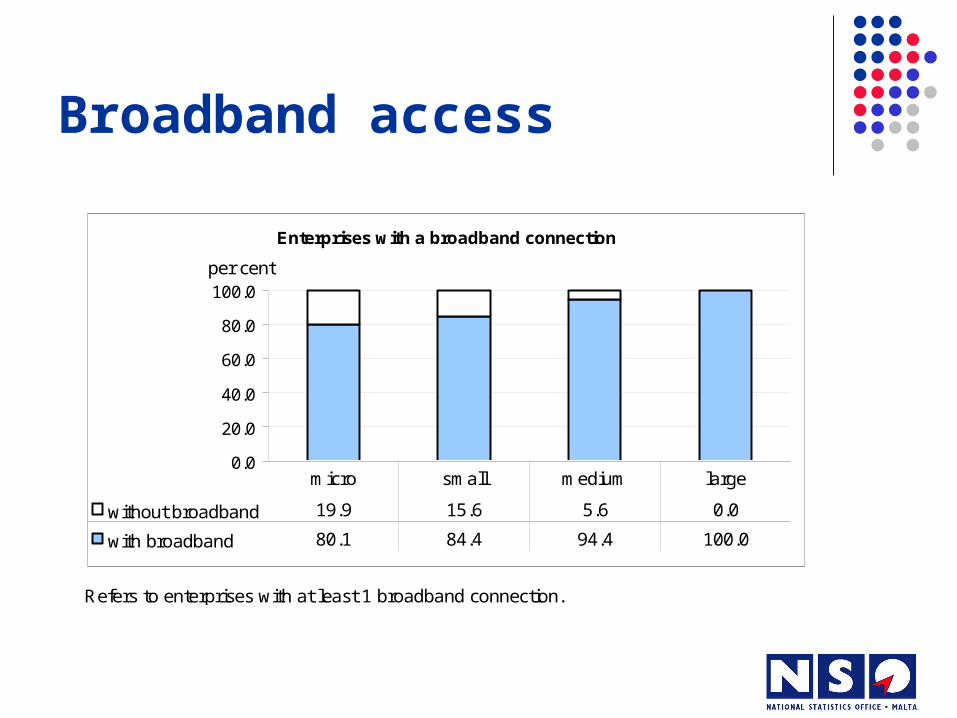
Broadband access
Refers to enterprises with at least 1 broadband connection.
Enterprises with a broadband connection
0.0
20.0
40.0
60.0
80.0
100.0per cent
without broadband 19.9 15.6 5.6 0.0
with broadband 80.1 84.4 94.4 100.0
micro small medium large
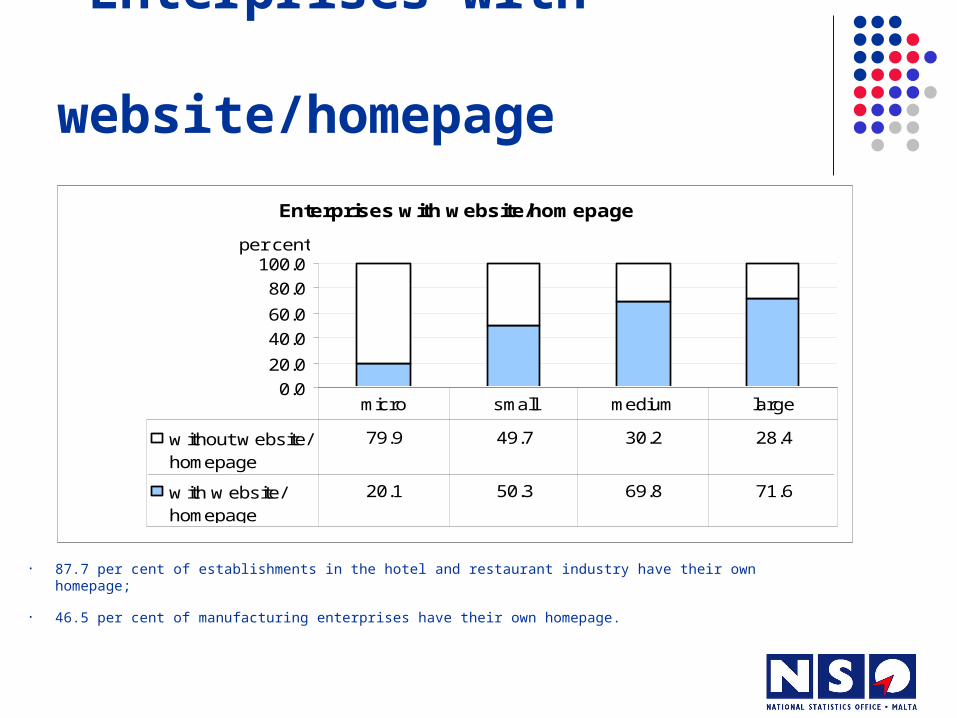
Enterprises with website/homepage
• 87.7 per cent of establishments in the hotel and restaurant industry have their own homepage;
• 46.5 per cent of manufacturing enterprises have their own homepage.
Enterprises with website/homepage
0.0
20.0
40.0
60.0
80.0
100.0per cent
w ithout w ebsite/homepage
79.9 49.7 30.2 28.4
w ith w ebsite/homepage
20.1 50.3 69.8 71.6
micro small medium large
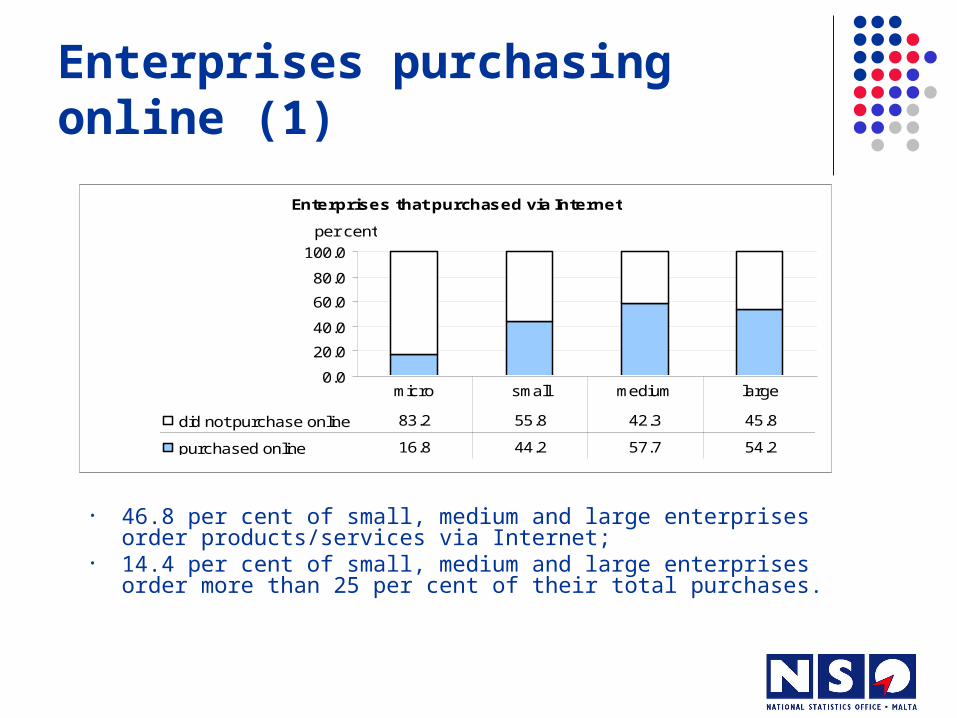
Enterprises purchasing online (1)
• 46.8 per cent of small, medium and large enterprises order products/services via Internet;
• 14.4 per cent of small, medium and large enterprises order more than 25 per cent of their total purchases.
Enterprises that purchased via Internet
0.0
20.0
40.0
60.0
80.0
100.0
per cent
did not purchase online 83.2 55.8 42.3 45.8
purchased online 16.8 44.2 57.7 54.2
micro small medium large
Enterprises purchasing online (2)
• 24.5 per cent of small, medium and large enterprises paid online for products/services ordered;
• 13.2 per cent made use of specialised Internet market places.
Enterprises in top 5 sectors that engaged in online purchasing
0.0
50.0
100.0
150.0per cent
engaged in 62.5 49.6 48.5 47.9 46.8
did not engage in 37.5 50.4 51.5 52.1 53.2
post & communication
transportw holesale &
retailhotels &
restaurantsmanufacturing
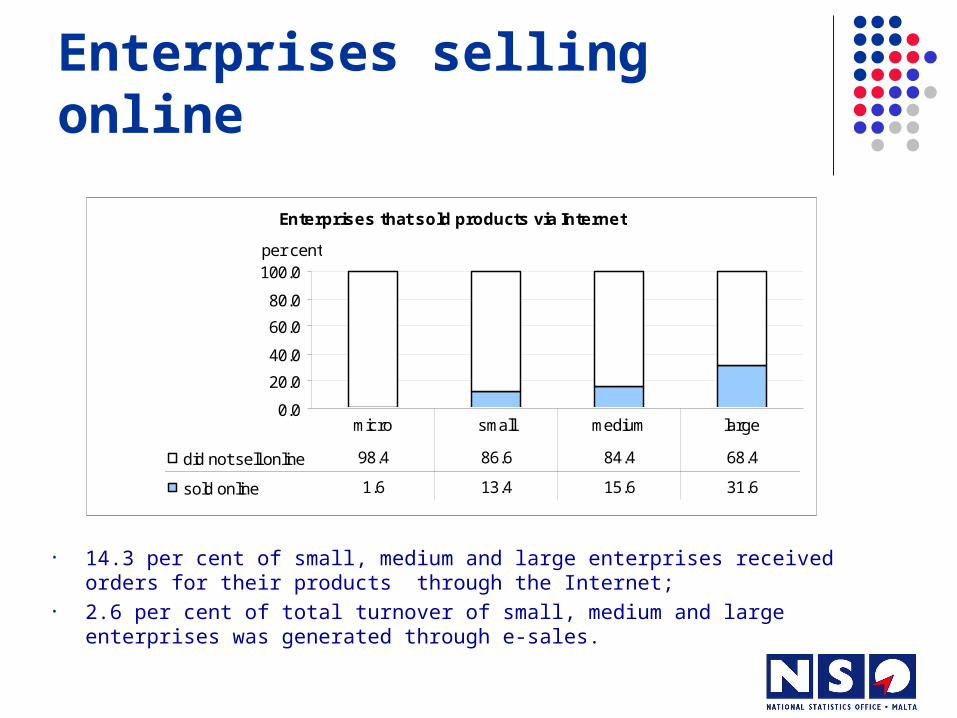
Enterprises selling online
Enterprises that sold products via Internet
0.0
20.0
40.0
60.0
80.0
100.0per cent
did not sell online 98.4 86.6 84.4 68.4
sold online 1.6 13.4 15.6 31.6
micro small medium large
• 14.3 per cent of small, medium and large enterprises received orders for their products through the Internet;
• 2.6 per cent of total turnover of small, medium and large enterprises was generated through e-sales.
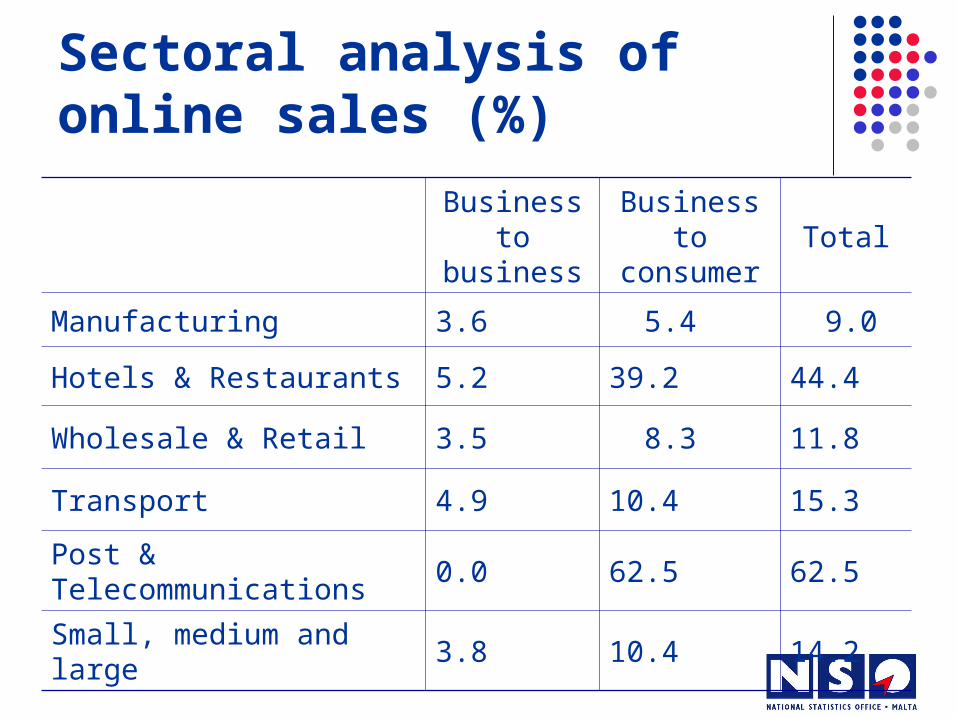
Sectoral analysis of online sales (%)
Business to business
Business to consumer
Total
Manufacturing 3.6 5.4 9.0
Hotels & Restaurants 5.2 39.2 44.4
Wholesale & Retail 3.5 8.3 11.8
Transport 4.9 10.4 15.3
Post & Telecommunications 0.0 62.5 62.5
Small, medium and large 3.8 10.4 14.2
Sectoral online sales by destination (%)
Malta EU Other
Manufacturing 62.1 23.8 14.2
Hotels & Restaurants 3.7 76.0 20.3
Wholesale & Retail 76.6 17.8 5.7
Transport 27.0 69.6 3.4
Post & Telecommunications
66.7 26.7 6.6
Small, medium and large 43.8 45.1 11.1
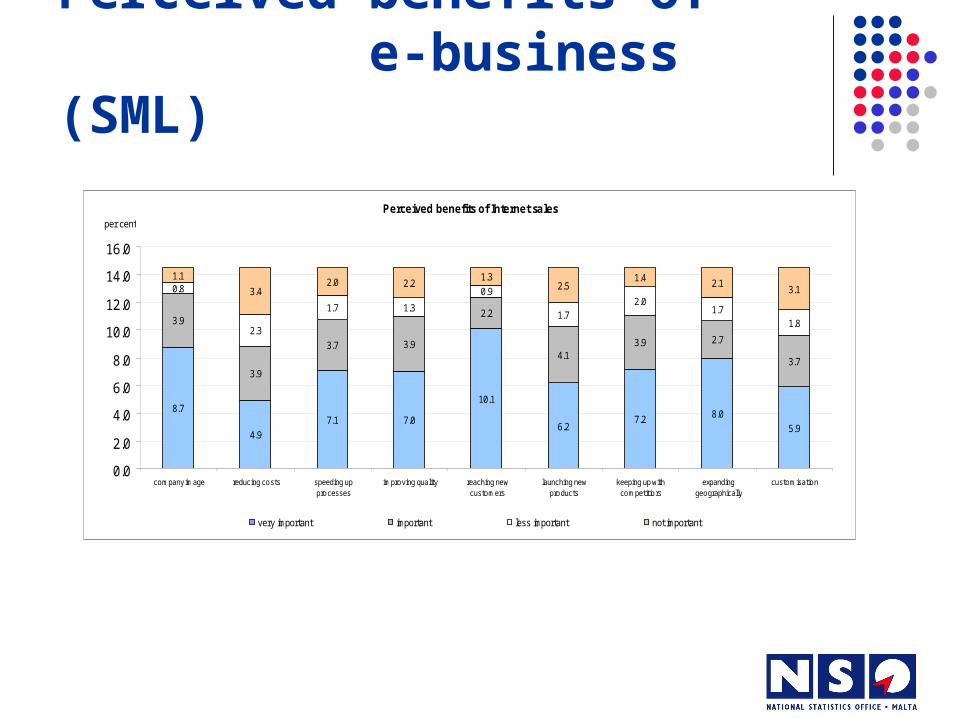
Perceived benefits of e-business (SML)
Perceived benefits of Internet sales
8.7
4.9
7.1 7.0
10.1
6.27.2 8.0
5.9
3.9
3.9
3.7 3.9
2.2
4.13.9 2.7
3.7
0.8
2.3
1.7 1.3
0.9
1.72.0
1.71.8
1.1
3.42.0 2.2
1.32.5
1.4 2.13.1
0.0
2.0
4.0
6.0
8.0
10.0
12.0
14.0
16.0
company image reducing costs speeding upprocesses
improving quality reaching newcustomers
launching newproducts
keeping up withcompetitiors
expandinggeographically
customisation
per cent
very important important less important not important
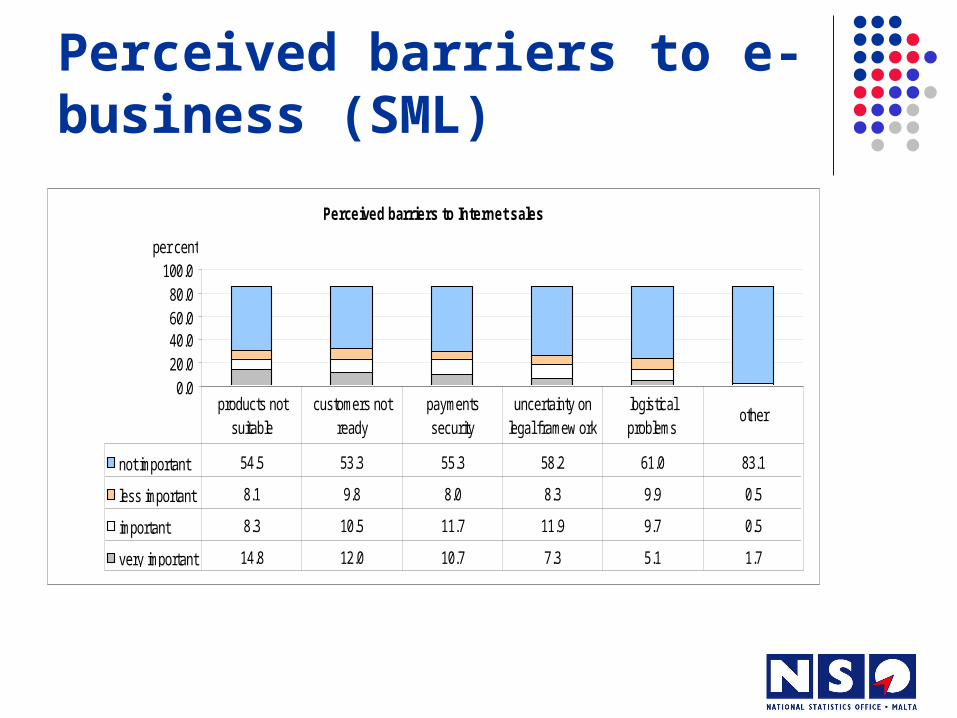
Perceived barriers to e-business (SML)
Perceived barriers to Internet sales
0.020.040.060.080.0
100.0per cent
not important 54.5 53.3 55.3 58.2 61.0 83.1
less important 8.1 9.8 8.0 8.3 9.9 0.5
important 8.3 10.5 11.7 11.9 9.7 0.5
very important 14.8 12.0 10.7 7.3 5.1 1.7
products not suitable
customers not ready
payments security
uncertainty on legal framew ork
logistical problems
other
ICT usage by individuals & households
• Aims to investigate level and type of computer usage by individuals and their households;
• A sample of 1,500 individuals aged between 15 and 74 years;
• Section of questionnaire addressed to individuals’ households;
• Response rate of 82 per cent.
Computer availability in households
• 48.4 per cent have a desktop computer;• 8.6 per cent have a portable computer (laptop);• 0.9 per cent have a handheld computer.
Categories not mutually exclusive.
Households w ith PCs
have 50.5
do not have 49.5
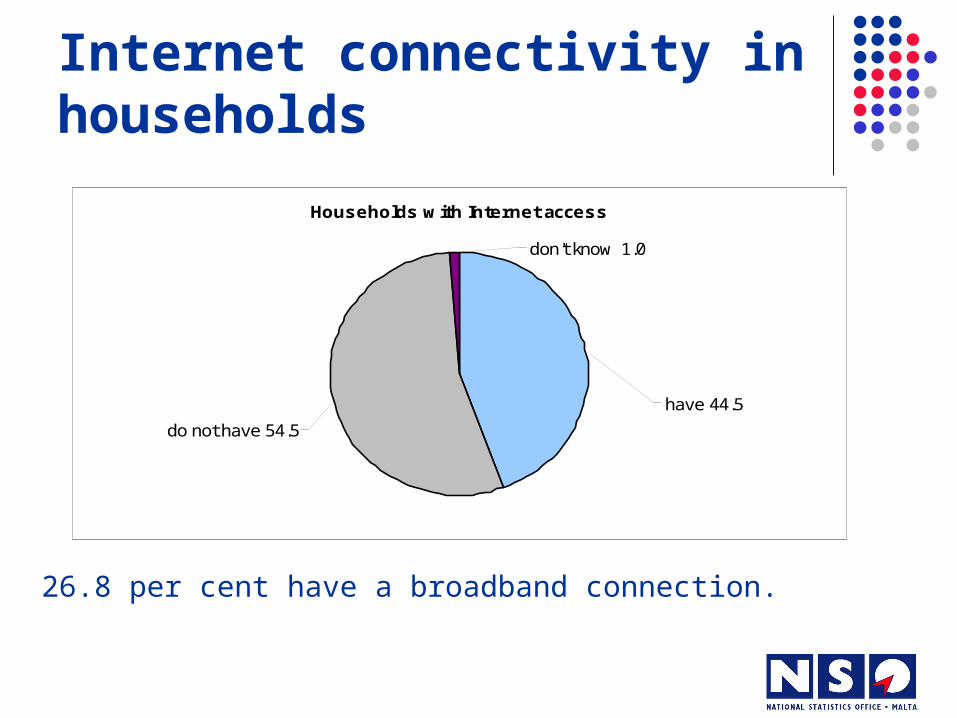
Internet connectivity in households
26.8 per cent have a broadband connection.
Households w ith Internet access
don't know 1.0
have 44.5
do not have 54.5
E-purchases
Orders/payments through the Internet by individuals
betw een 3 and 12 months 0.4
less than 3 months ago 10.5
more than 12 months 2.4
never 25.8
manual e-mails 6.4
no Internet 54.5
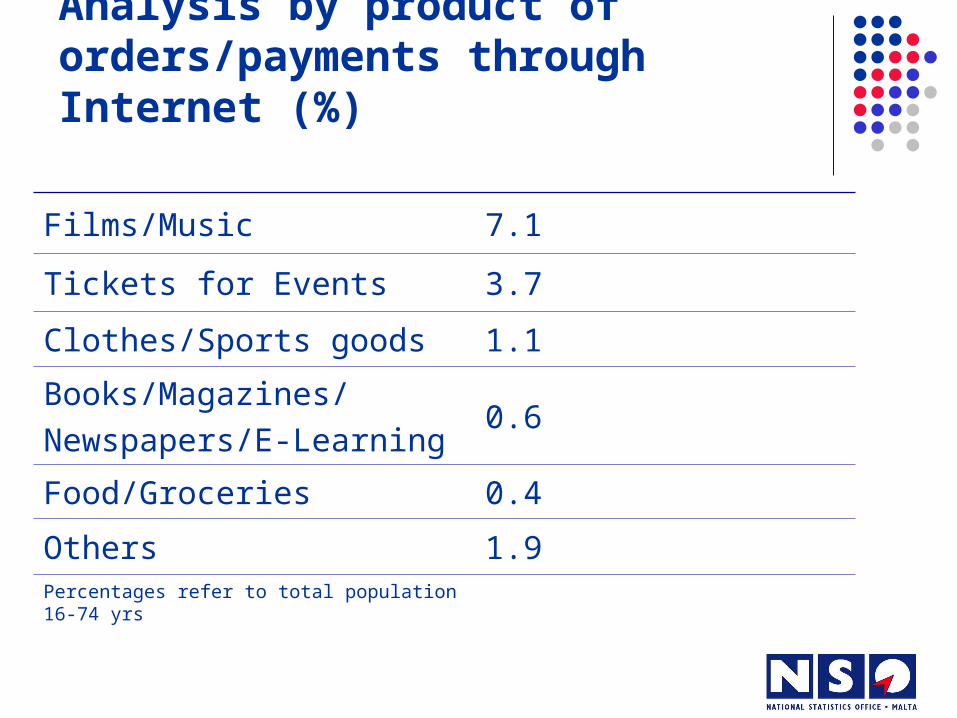
Analysis by product of orders/payments through Internet (%)