36
POLITECNICO DI MILANO MASTER OF SCIENCE IN MANAGEMENT ENGINEERING TECHNOLOGY PERFORMANCE EVALUATION ANALYSIS ONSHORE FIELD STUDENT: Ayan Maxutova COORDINATOR: Marika Arena April 2013

POLITECNICO DI MILANO MASTER OF SCIENCE IN MANAGEMENT ENGINEERING
TECHNOLOGY PERFORMANCE EVALUATION ANALYSIS
ONSHORE FIELD
STUDENT: Ayan Maxutova COORDINATOR: Marika Arena
April 2013

2
POLITECNICO
DI MILANO
INDEX
1. ABSTRACTION 6
2. DESCRIPTIVE REVIEW 7
3. THE PROJECT 9
3.1 COMPANY DESCRIPTION 9
3.2 ROLE IN THE PROJECT 1914
4. INTRODUCTION 15
5. PROBLEM FORMULATION 17
6. METHODOLOGY 18
6.1 DATA COLLECTION 18
6.2 WELLS OFFSET GROUPS DEFINITION 19
6.3 STATISTICAL ANALYSIS 19
7. CASE STUDIES 22
7.1 ONSHORE WELLS 22
7.1.1 ASSUMPTIONS 22
7.1.3 LEARNING PROCESS ANALYSIS 22
7.1.4 TRIPPING TIME BENCHMARK ANALYSIS 22
7.1.5 CIRCULATING TIME BENCHMARK ANALYSIS 23
7.1.6 NPT BENCHMARK ANALYSIS 24
7.1.7 NET BENEFIT ANALYSIS 25
7.1.8 COST BENEFIT ANALYSIS 27

3
POLITECNICO
DI MILANO
7.1.9 SAFETY 27
8. CONCLUSIONS 28
8.1 PERFORMANCE (ON AVERAGE PER WELL) 28
8.1.1 12 ¼’’ PHASE 28
8.1.2 8 ½’’ PHASE 29
8.1.3 AVERAGE WELL 29
8.2 CAPABILITY TO REACH THE TARGET 30
8.3 SAFETY 30
8.4 ALTERNATIVE TECHNOLOGY (CCS) 30
8.4.1 COUPLER CONCEPT 31
8.4.2 ADDING PIPE 31
8.4.3 PRESSURE CONTROL 32
8.4.4 HOW IT OPERATES 32
8.4.5 CLOSED LOOP SYSTEM 33
8.4.6 IN COMPARE WITH PCE 34
8.5 FUTURE SUGGESTIONS 34
8. REFERENCES 35

4
POLITECNICO
DI MILANO
Table of Figures
FIGURE 3.1. STRUCTURE OF ENI 9
FIGURE 3.2. DIVIDEND AND DIVIDEND YIELD 11
FIGURE 3.3. SHARE PERFORMANCE Q4 2012 11
FIGURE 3.4. EXPLORATION AND PRODUCTION 12
FIGURE 4.1. PCE TECHNOLOGY FINAL CONFIGURATION 16
FIGURE 4.2. PCE TECHNOLOGY APPLICATION OVER TIME 16
FIGURE 6.1. METHODOLOGY 18
FIGURE 6.2. NET BENEFIT ANALYSIS 18
FIGURE 7.1. ONSHORE TRIPPING TIME BENCHMARK ANALYSIS 21
FIGURE 7.2. ONSHORE CIRCULATING TIME BENCHMARK ANALYSIS 23
FIGURE 7.3. ONSHORE NPT BENCHMARK ANALYSIS 24
FIGURE 7.4. ONSHORE TIME PERFORMANCE ANALYSIS 26
FIGURE 7.5. ONSHORE COST BENEFIT ANALYSIS 27
FIGURE 8.4. TOTAL GAIN ANALYSIS 30
FIGURE 8.5. CONTINUOUS CIRCULATING COUPLER 31

5
POLITECNICO
DI MILANO
List of Tables
TABLE 3.1. ENI IN NUMBERS 13
TABLE 8.1. PCE TECHNOLOGY PERFORMANCE – SUMMARY TABLE 28
TABLE 8.2. 12 ¼” PHASE PERFORMANCE 29
TABLE 8.3. 8 ½” PHASE PERFORMANCE 30

6
POLITECNICO
DI MILANO
1. ABSTRACT
What is a well? According to a simplistic definition, a well is just a hole in the ground.
Actually, this definition does not capture the full complexity of the design and realization of
wells in the oil industry that can reach depth of 7000 metres and encounter environments
with extreme pressures and temperatures.
Drilling operations are conducted around the world, often in extreme climatic, environmental
and technical conditions: e.g. in deep waters, arctic and desert locations, in new countries on
the edge of the world. Completion concerns the activities, subsequent to drilling, for the
installation in the well of a battery of pipes and all the equipment that permit the extraction of
hydrocarbons under secure and integral conditions for people, the environment, the reservoir
and the integrity of the well itself.
For big Oil&Gas companies, that has an innovative view of the future and is going to face
increasingly challenging goals, technological innovation in this area is critical in order to
maximise performance while ensuring compliance with international standards of safety and
environmental protection.
The revolutionary PCE – permanent circulating equipment technology permits the continuous
circulation of mud in the well, which maintains a constant down hole pressure over the entire
drilling process, even during the trip in and out of the bottom hole assembly. This makes it
possible to work in wells in which there is the risk of both fracturing the formation (if the
hydrostatic load of the mud in circulation is excessive) and not being able to counterbalance
the pressure of the fluid layer (if the hydrostatic load of the mud in circulation is insufficient).

7
POLITECNICO
DI MILANO
2. DESCRIPTIVE REVIEW
Just like any other excavation activity, drilling an oil well involves two main actions:
overcoming the resistance of rock material in order to detach parts it from the formation and
transporting these parts to the surface to continue detaching new material, so that drilling can
continue without interruption.
The technique which has been used by the oil industry for more than century is called rotary
drilling where a bit, rotated by a system of pipes, excavates the rock.
The bit is positioned at the end of a string of hollow tubular rods with circular section joined
together using special couplings. With this string the bit can be run into the hole and run out
again using a draw work, transmitting the rotating movement generated on the surface by the
rotary table, giving it the weight needed to drill and therefore continue deepening the well.
The rock material excavated in this way is transported to the surface by a drilling fluid (simply
called mud) which circulates through the hollow drill string, is expelled through openings in
the bit and returns to the surface through the annulus between the wellbore and the drill
string.
As the programmed depths are reached the well is lined with pipes, called casing, with
decreasing diameter and just a little less than that of the drilled wellbore; these pipes are 12
meters long and are joined together, run into the hole to the set depth, cemented to the
wellbore wall using a cement slurry and anchored on the surface. The casing is cemented,
with rise of the cement slurry from several hundred meters up to the surface with the aim of
anchoring the casing to the ground, hydraulically isolating the formations drilled, as they
would otherwise cause a series of problems, and protecting the hydrocarbon-bearing levels.
This process is repeated until the programmed depth is reached and the well is then put into
production if hydrocarbon-bearing, or abandoned, if dry.
Oil wells can be drilled onshore and offshore using different rigs depending on the
environment they will be operating in. Both onshore and offshore drilling must fulfill precise
requirements and, as stated above, the two do not differ greatly except in the case of drilling
in deep and ultra deep water where floating rigs or drillships have to be used. In the latter
case it is not the operating sequence that differs but the use of more complex and expensive
equipment because the wellheads, safety equipment, etc. are located on the sea floor, far
from visual and manual control.
On rotary drilling, the technique which has been used for more than a century, the largest

8
POLITECNICO
DI MILANO
and most important component is the drilling rig which has three essential functions:
Lifting the excavation organs (drill string, bit) and well casing equipment;
Ensuring that these components continue to rotate;
Circulating the drilling fluid.
Drilling fluids (called muds because they originally and simply consisted of suspension of
clay in water) are circulated downhole through pipes and flow back up to the surface via the
annulus between the pipes and the wellbore, conveying drill cuttings generated by the action
of the bit. Muds have numerous functions which are all extremely important for successful
drilling and include:
Suspending and conveying cuttings from the bottomhole;
Cooling and lubricating the bit;
Containing fluids in the drilled formations by applying hydrostatic pressure;
Consolidating the wellbore walls, depositing cake on the walls during the filtration
process.
Continuous Circulation: is the ability to maintain uninterrupted flow of drilling fluid to the well
whilst all the steps to add (or remove) joints of “drill pipe” to the drilling string are performed
within the drilling process, including trips in and out of hole.

9
POLITECNICO
DI MILANO
3. THE PROJECT
3.1 COMPANY DESCRIPTION
Eni is one of the largest integrated energy companies in the world,
operating in the sectors of oil and gas exploration & production,
international gas transportation and marketing, power generation, refining
and marketing, chemicals and oilfield services. Eni is active in 90
countries with 79,000 employees.
The commitment of eni to sustainable development means that they grow and retain their
people, contribute to the development and wellbeing of the communities in which they
operate, protect the environment, and invest in technological innovation and energy
efficiency, mitigating the risks of climate change.
Fig.3.1: Structure of eni
TRACK RECORD OF EXCEPTIONAL EXPLORATION SUCCESS
Between 2008 and 2011 eni discovered around 4 bn boe of new resources at a leading unit
exploration cost of 1.7 $/boe. New resources discovered in 2012 amounted to 3,6 bn boe.

10
POLITECNICO
DI MILANO
STRONG PIPELINE OF GROWTH PROJECTS
Between 2011 and 2015 eni will add around 700kboe/d(1) of new production, of which 80%
will come from new giant projects with long plateau periods.
COMPETITIVE COST POSITION
The production is focused on conventional projects, contributing to contain technical risks
and operating costs.
LEADING POSITION IN EUROPEAN GAS MARKET
Eni one of the largest utilities in Europe, with a diversified gas supply portfolio and a strong
position in the industrial, power generation and retail markets.
POTENTIAL VALUE CREATION FROM DISPOSALS
The ongoing disposal of their stake in Snam, the regulated gas transport, distribution and
storage business, will simplify their corporate structure and significantly reduce debt.
ATTRACTIVE RETURNS TO SHAREHOLDERS
In 2012, eni paid a dividend of €1.08/sh (or $ 2.14/ADR), a yield of 5.92%(2). Interim
dividend for 2012 was 0.54 €/share. From Q1 2013, Eni will launch a buy-back program on
up to 10% of its capital.
RECOGNISED LEADER IN SUSTAINABILITY
We are listed on the FTSE4Good and the Dow Jones Sustainability Indices.

11
POLITECNICO
DI MILANO
DIVIDENDS AND SHARE PERFROMANCES
(1) assumption of $90/bbl Brent for 2012-13 and 85$/bbl
2014-15
(2) calculated on Eni avg
share price in Dec 2012
Fig.3.2: Dividend (euro/share) and dividend yield (%)
(3) Peer Group: BP,
Chevron, Conoco,
Exxon, Shell, Total
Fig.3.3: Share performance Q4 2012 (euro)

12
POLITECNICO
DI MILANO
PRODUCTION AND EXPLORATION
Fig.3.4: Exploration and Production
E&P is the main division. It is currently present in 43
countries and is focused on finding and producing oil
and gas. Eni’s strategy is to deliver organic
production growth with increasing returns over the
medium to long term, leveraging on a high-quality
portfolio of assets, exposure to competitive giant
projects and long-standing relationships with host countries. Growth will come from a number
of key hubs around the world, a strategy which combines geographical diversification with
scale benefits and project synergies.
GAS&POWER
G&P is engaged in all phases of the gas value chain: supply,
trading and marketing of gas and electricity, gas infrastructures,
and LNG supply and marketing. Eni sells more than 60% of its

13
POLITECNICO
DI MILANO
gas outside Italy and its leading position in the European gas market is supported by
competitive advantages, including its multicountry approach, long-term gas availability,
access to infrastructure, market knowledge, wide product range and strong customer base.
REFINING&MARKETING
R&M refines and markets fuels and other oil products primarily in
Italy and Central-Eastern European countries. Eni’s R&M division
is relatively small compared to the R&M segment of eni’s peers.
Eni is the largest refiner in Italy and the leading operator in retail
marketing of fuels with a market share of around 30%. Eni’s
strategy in R&M is to cut costs and enhance margins to return to
profitability.
ENI IN NUMBERS
Tab.3.1: eni in numbers
3.2 ROLE IN THE PROJECT
Before coming to Politecnico di Milano I was working in National Bank of the Republic of
Kazakhstan as software engineer of databases. I started working in eni on second year of my
Master degree as risk management consultant for eni. I choosed this work because it was
very interesting for me comparing to other subjects during my first year classes of the master
program. And it was giving me an opportunity for growth as a specialist for my future goals.
For the current project there were 3 of us working on it, and my responsibility included

14
POLITECNICO
DI MILANO
analysing the data through VBA. The data was kept in database, and as a part of my work I
created the VBA functions which analysed the data and gave us ready results out of the
existing database. My background allowed me fastly and easy learn VBA and use it to
simplify and automize the analysis, what was very comfortable as the program could be used
also for other cases.
After getting the results, we were comparing results and completing the overall view on the
technology. It will help in the future to decide should eni use this technology for onshore field
wells.

15
POLITECNICO
DI MILANO
4. INTRODUCTION
During my internship the main responsibility I had was risk management consulting for a
Oil&Gas companies. Different interesting projects I was consulting, and this one is related to
analysis of innovative technology called PCE (Permanent Circulating Equipment) which
allows continuous mud circulation in the well to maintain constant bottom hole pressure while
making-up or laying down drill pipe connections during Drilling Operations1. In this way
bottom hole pressure is kept constant and almost equal to the pore pressure. This ensures
that there are no pressure peaks due to interruptions of circulation which increases the risk of
the formation fracturing (or ballooning effects). The main advantage is the ability to drill in
conditions where there is a very narrow margin between pore and fracture gradient. Benefits
are also achieved in operations safety and NPT reduction.
Starting from its first implementation, the technology has been modified over the years in
order to adapt it to operational needs and to improve overall drilling performances in terms of
time and cost reduction and safety increase. This analysis considers only wells drilled from
year 2009, when the final configuration of PCE Technology has been consolidated.
Permanent Circulating Equipment final configuration (see Figure 4.1) is based on:
PCE Sub, that is a dual flapper tool with a side entry port, run in hole on top of drill
pipe stands. The number of subs required depends on borehole length to be drilled
with uninterrupted circulation;
PCE Manifold, that diverts the flow from the rig stand pipe manifold directly to the PCE
Sub. It is installed on the rig floor and connected to the stand pipe manifold.
1 Reference Document: 10 Golden Rules for eni Drilling Operations

16
POLITECNICO
DI MILANO
Fig.4.1: PCE Technology Final Configuration
Since its first application, eni has drilled as Operator 81 Wells Worldwide using PCE
Technology (see Figure 4.2):
8 wells have been drilled during the development Phase of the technology (before
year 2009);
starting from year 2009 other Operators started to use PCE Technology, with a total
number of 9 applications.
Fig.4.2: PCE Technology Application over the time
Permanent Circulating Equipment (PCE)

17
POLITECNICO
DI MILANO
5. PROBLEM FORMULATION
The main objective of this analysis is to evaluate the performance of PCE Technology
considering the following indicators:
Performance: Time and Cost savings;
Capability to reach the target;
Safety.
It is important to underline that the safety indicator, i.e. improvement of Drilling Operations
due to the existence of dynamic condition when using PCE is well known, sure and
unquestionable. However, its economic impact is extremely variable and not commensurable
with the operational economic impact considered in the analysis.
The analysis will be worked on Onshore Fields, further there is a possibility to analyse
Offshore field also.
18
POLITECNICO
DI MILANO
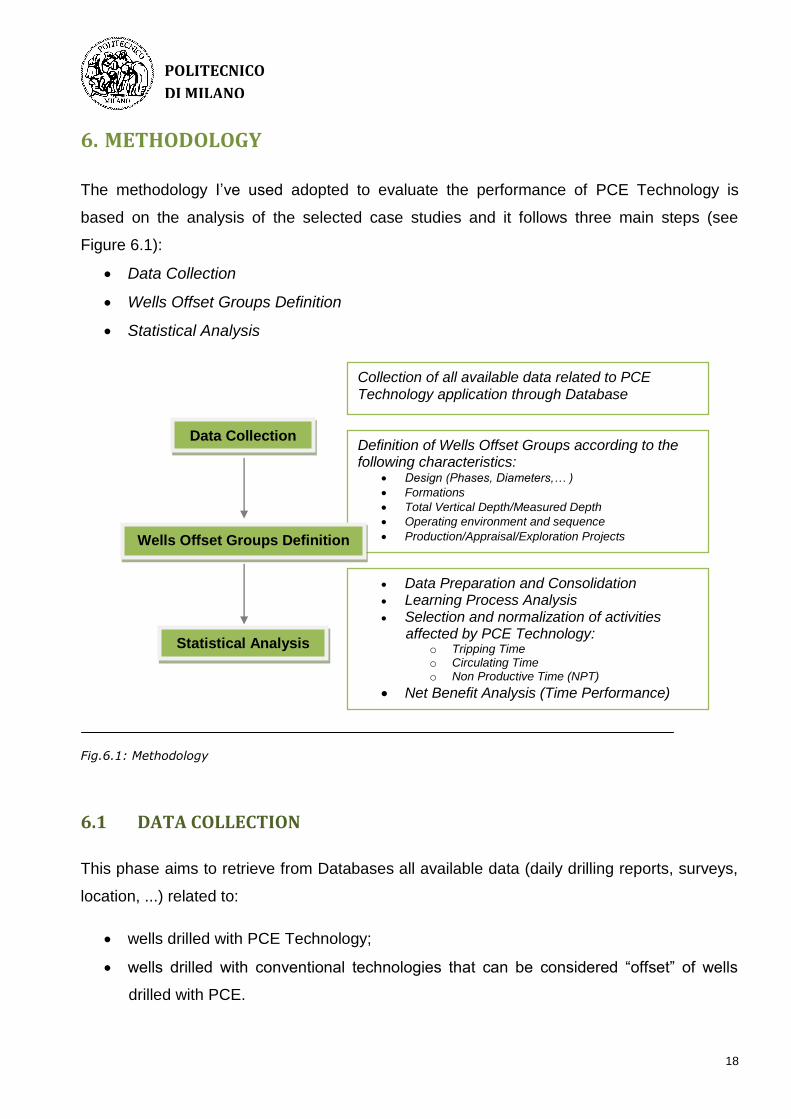
6. METHODOLOGY
The methodology I’ve used adopted to evaluate the performance of PCE Technology is
based on the analysis of the selected case studies and it follows three main steps (see
Figure 6.1):
Data Collection
Wells Offset Groups Definition
Statistical Analysis
Fig.6.1: Methodology
6.1 DATA COLLECTION
This phase aims to retrieve from Databases all available data (daily drilling reports, surveys,
location, ...) related to:
wells drilled with PCE Technology;
wells drilled with conventional technologies that can be considered “offset” of wells
drilled with PCE.
Collection of all available data related to PCE Technology application through Database
Definition of Wells Offset Groups according to the following characteristics:
Design (Phases, Diameters,… )
Formations
Total Vertical Depth/Measured Depth
Operating environment and sequence
Production/Appraisal/Exploration Projects
Data Preparation and Consolidation
Learning Process Analysis
Selection and normalization of activities affected by PCE Technology:
o Tripping Time o Circulating Time o Non Productive Time (NPT)
Net Benefit Analysis (Time Performance)
Data Collection
Wells Offset Groups Definition
Statistical Analysis

19
POLITECNICO
DI MILANO
The output of this phase is a list of wells with all related information drilled over the years to
be used for the analysis.
6.2 WELLS OFFSET GROUPS DEFINITION
In this phase all available information about wells are analyzed in order to group them
considering similarities related to the following characteristics:
Design (Phases, Diameters, ...);
Formations;
Well Total Vertical Depth (TVD) and/or Measured Depth (MD);
Operating Environment and Sequence;
Production/Appraisal/Exploration Projects.
The output of this phase are two groups of comparable wells: the first composed by wells
drilled using PCE Technology and the second without.
6.3 STATISTICAL ANALYSIS
The analysis carried out to evaluate the performance of PCE Technology is based on the
definition of statistic distributions and Monte Carlo simulations, in order to grant:
Objectivity;
Exhaustiveness;
Replicability.
DATA PREPARATION AND CONSOLIDATION
In order to prepare and consolidate the data for the analysis, activity descriptions available in
each well daily drilling report have been carefully examined and grouped by phases (e.g. 12
¼’’, 8 ½’’, etc...).
This data analysis allows to focus the study only on specific phases where PCE Technology
had been applied.

20
POLITECNICO
DI MILANO
LEARNING PROCESS ANALYSIS
For multiple-well drilling campaigns, performances tend to improve over the time, mainly due
to job familiarization, improvement coordination, development of better and more efficient
tools.
An analysis on the existence of a learning process for each considered Field during drilling
both with and without PCE Technology has been carried out, in order to identify and evaluate
improvements in the average drilling speed [m/day] for the grouped wells. The existence of a
strong learning curve complicates the comparison of drilling performances between wells
drilled in different periods of time because it is difficult to highlight only the effect of PCE
Technology.
SELECTION AND NORMALIZATION OF ACTIVITIES AFFECTED BY PCE TECHNOLOGY
Wells drilled both with and without PCE have been analyzed by phases, in order to compare
performances related to the following parameters affected by the use of PCE System:
NPT caused by circulation losses, drill string sticking, fluid influx, hole cleaning;
Tripping Time (normalized considering the phase length);
Circulating Time (normalized considering the phase length).
Specifically, for both wells drilled with and without PCE, statistical measures (mean, standard
deviation, minimum and maximum) and NPT probability have been calculated. A normal
distribution has been created for each performance parameter, truncating distributions tails at
minimum and maximum values of the dataset, in order to exclude extreme and not relevant
values.
Tripping Time and Circulating Time have been normalized using a continuous distribution,
because they are activities always available. NPT values, instead, have been modelled using
a discrete distribution because they are uncertain events that not always occur during Drilling
Operations.
NET BENEFIT ANALYSIS (TIME PERFORMANCE)
The Total Gain is obtained as total sum of the difference between Tripping, Circulating and
NPT distributions of wells drilled without and with PCE (Net Gain). The Total Gain is

21
POLITECNICO
DI MILANO
expressed as ratio between hours and meters [hrs/m], in order to compare the performances
of wells characterized by different values of phase depth.
The figure below shows how the process of calculating Net Gain for each indicator was held.
The indicators of wells drilled without PCE technology in grey box, minus the indicators of
wells drilled with PCE technology in yellow box, and the result is the Net Gain for each
indicator in red box. After, Monte Carlo simulations have been run, in order to combine
defined distributions for each indicator and to obtain the Total Gain from the implementation
of PCE for each phase.
Fig.6.2: Net Benefit Analysis
Finally, a “target well” has been defined for each Field, considering the average of each
phase length, in order to calculate the overall well duration with and without the use of PCE
Technology.

22
POLITECNICO
DI MILANO
7. CASE STUDIES
7.1 ONSHORE WELLS
ASSUMPTIONS
PCE Technology has been used during Drilling Operations for 13 Onshore wells; the analysis
considers only 7 wells already drilled when the study started and evaluates the performances
relate to the following hole sections, where PCE Technology has been applied):
12 ¼’’ Phase;
8 ¾’’ and 8 ½’’ Phases (considered together for the scope of the analysis due to their
operational analogies).
LEARNING PROCESS ANALYSIS
For each well considered for the analysis (12 wells), an Average Drilling Speed [m/day] has
been calculated.
There is no evidence about any learning process during Drilling Operations both with and
without PCE. As a consequence, it is relevant to carry out the analysis on PCE Technology
performance considering all the reference wells dataset.
TRIPPING TIME BENCHMARK ANALYSIS
The main output of the Tripping Time Analysis is the graph in Figure 7.1. Vertical axis maps
the Tripping Time normalized on phase depth; horizontal axis maps different hole sections
and the two groups of wells (drilled with and without PCE).
The difference between the mean value of Tripping Time (brown bullet) for wells drilled
without PCE and wells drilled with PCE represents the gain (if negative) or the loss (if
positive) of the Operation times between the two groups of wells. The range of variability
between the minimum and the maximum value for each hole section in correspondence to
the two groups of wells is represented with a vertical yellow line.

23
POLITECNICO
DI MILANO
Fig.7.1: Onshore Tripping Time Benchmark Analysis
As a result, a gain of 0,7 hrs/100 m (see Drill 8 ¾’’-8 ½’’ Phase) indicates that wells drilled
using PCE Technology had a Tripping Time of 35 hours less than wells drilled with
conventional technologies in correspondence of a Total Depth = 5000 m.
Regarding Tripping Time for Onshore Field:
there is a relevant improvement of the Tripping Speed during operations using PCE
Technology in 8 ¾’’ – 8 ½’’ Phases.
Tripping Time is comparable for all analyzed wells in 12 ¼’’ Phase.
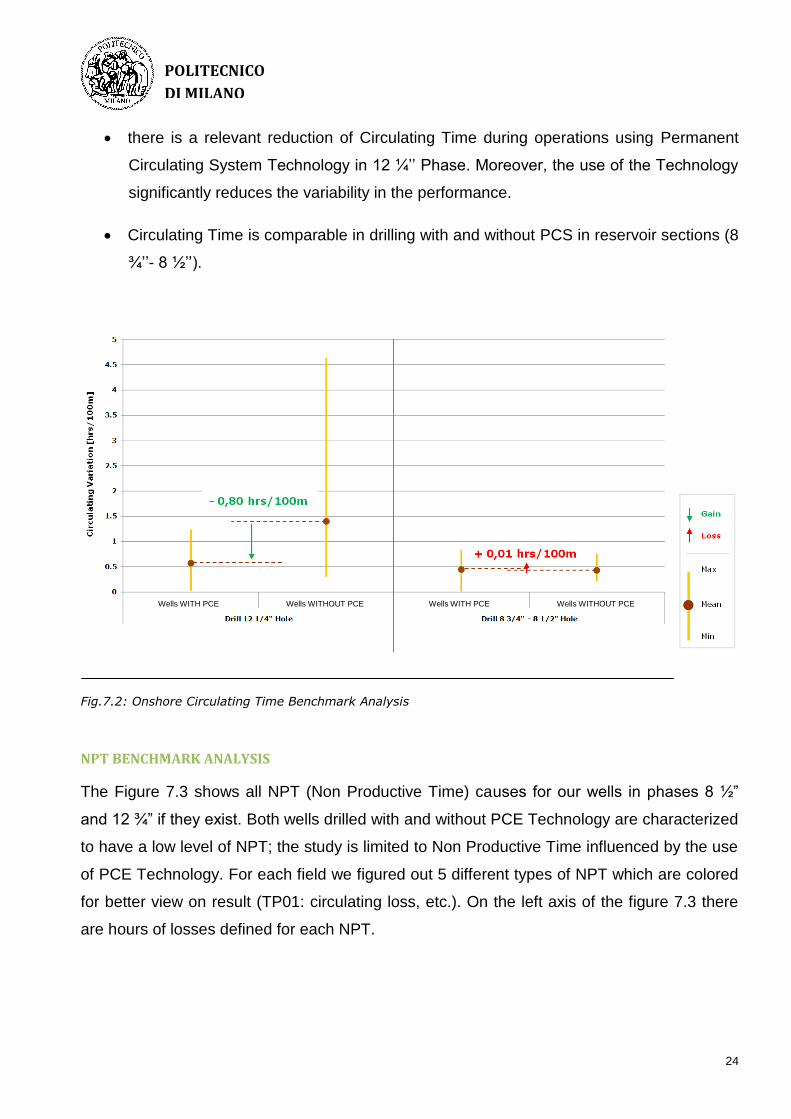
CIRCULATING TIME BENCHMARK ANALYSIS
Results of Circulating Time Benchmark Analysis are represented in the same way as for
Tripping Time Benchmark Analysis (Figure 7.2); see Paragraph 7.1 for more details.
Regarding Circulating Time for Onshore Field:
Wells WITH PCE Wells WITHOUT PCE Wells WITHOUT PCE Wells WITH PCE Wells WITH PCE Wells WITHOUT PCE Wells WITH PCE Wells WITH PCE Wells WITHOUT PCE Wells WITH PCE Wells WITHOUT PCE Wells WITH PCE Wells WITHOUT PCE Wells WITH PCE Wells WITHOUT PCE Wells WITH PCE Wells WITHOUT PCE Wells WITH PCE
24
POLITECNICO
DI MILANO
there is a relevant reduction of Circulating Time during operations using Permanent
Circulating System Technology in 12 ¼’’ Phase. Moreover, the use of the Technology
significantly reduces the variability in the performance.
Circulating Time is comparable in drilling with and without PCS in reservoir sections (8
¾’’- 8 ½’’).
Fig.7.2: Onshore Circulating Time Benchmark Analysis
NPT BENCHMARK ANALYSIS
The Figure 7.3 shows all NPT (Non Productive Time) causes for our wells in phases 8 ½”
and 12 ¾” if they exist. Both wells drilled with and without PCE Technology are characterized
to have a low level of NPT; the study is limited to Non Productive Time influenced by the use
of PCE Technology. For each field we figured out 5 different types of NPT which are colored
for better view on result (TP01: circulating loss, etc.). On the left axis of the figure 7.3 there
are hours of losses defined for each NPT.
Wells WITH PCE Wells WITHOUT PCE Wells WITHOUT PCE Wells WITH PCE Wells WITHOUT PCE Wells WITH PCE

25
POLITECNICO
DI MILANO
Fig.7.3: Onshore NPT Benchmark Analysis
As a result of Figure 7.3 we see that:
only one well drilled with PCE had non productive time related to Geological Problems
(in 8 ¾’’-8 ½’’ Phase);
wells drilled without PCE had limited NPT related to Circulation Losses and Geological
Problems (both in 8 ¾’’-8 ½’’ and 12 ¼’’ Phases).
NET BENEFIT ANALYSIS
The statistical combination of Tripping Time, Circulating Time and NPT allows to calculate
the overall Time Gain/Loss of the use of PCE Technology for the different hole sections.
Values have been normalized in order to consider the depth of each hole section.
This graph is the result of Monte Carlo Stimulation for the given depth and time spent. On the
right scale we see time (in hours) consumed for given phase and from the bottom scale we
see the depth (in meters) where the phase is. Overall the graph shows (see Figure 7.4):
the Net Benefit mean is represented by a brown line (P50);
Wells WITHOUT PCE Wells WITH PCE
Fie
ld 1
Fie
ld 2
Fie
ld 3
Fie
ld 4

26
POLITECNICO
DI MILANO
the range of variability between P25 (first quartile) and P75 (third quartile) for each
hole section is represented with a yellow area. Considering a reference Phase TD, a
wide range of values between the minimum and the maximum of the yellow area
highlights the existence of a high variability in the statistical analysis of parameters.
Fig.7.4: Onshore Time Performance Analysis
The use of PCE Technology brought relevant time reductions when used both for 12 ¼’’ and
8 ¾’’-8 ½’’ Phases; particularly:
considering 12 ¼’’ Phase, there is a relevant time gain (from about 45 hrs to about 55
hrs) that increases with the increase of Total Depth (Measure Depth) [m], with a
reduced range of variability (P25 – P75);
8 ½’’ Phase has a time gain (from about 20 hrs to about 40 hrs) that increases with the
increase of Total Depth (Measure Depth) [m], with a wider range of variability (P25 –
P75).

27
POLITECNICO
DI MILANO
COST BENEFIT ANALYSIS
The Time Benefit Analysis has been replicated for Costs, in order to evaluate the overall
economic benefit of the PCE Technology implementation. On this graph Monte Carlo
stimulation was done only for one phase.
Considering the Phase Total Depth (MD from 2500 m to 6500m), the use of PCE
Technology has brought clear advantages in terms of Costs, increasing with the length of
the wells.
Fig.7.5: Onshore Cost Benefit Analysis
SAFETY
Safety is the state of being "safe", the condition of being protected against consequences of
failure, damage, error, accidents or any other event which could be considered non-
desirable. This can take the form of being protected from the event or from exposure to
something that causes health or economical losses. PCE Technology improving safety by
simplifying the process and bringing its advantages into the work.
PCE
PCE

28
POLITECNICO
DI MILANO
8. CONCLUSIONS
The application of PCE Technology during Drilling Operations of Onshore Fields highlighted
overall positive performances in terms of:
Time and Cost savings;
Increased capability to reach the target;
Safety.
The three case studies show different levels of performances in correspondence of the
identified indicators, as summarized in the table below (Table 8.1).
Performance: Time&Cost Savings
Capability to Reach the Target
Safety
Onshore Field ++ + ++
++ : High Positive Impact + : Positive Impact
= : No Impact - : Negative Impact
Tab.8.1: PCE Technology Performance – Summary Table
Detailed analysis on three performance parameters are provided in the following Paragraphs.
8.1 PERFORMANCE (ON AVERAGE PER WELL)
12 ¼’’ PHASE
Considering both Fields, the use of PCE Technology brought relevant average Tripping and
Circulating Time reductions when used in 12 ¼’’ Phase (see Table 8.2).

29
POLITECNICO
DI MILANO
Tripping Time [h/100m] Circulating Time [h/100m]
Onshore Field -0.17 -0.83
Tab.8.2: 12 ¼’’ Phase Performances
8 ½’’ PHASE
Considering the three Case Studies, PCE Technology benefits are less relevant towards
Tripping and Circulating Time while drilling 8 ½’’ Section (see Table 8.3).
For the scope of the analysis 8 ½” Phase has been considered together with 8 ¾” Phase due
to their operational technologies.
Tripping Time [h/100m] Circulating Time [h/100m]
Onshore Field -0.70 +0.01
Tab.8.3: 8 1/2’’ Phase Performances
AVERAGE WELL
In Figure 8.4 we see the result of the distribution where Mean = -102,9 hours of saving time.
So this figure shows The Total Gain related to the use of PCE Technology when drilling an
hypothetical “average well” for the considered Case Studies, is always positive for Onshore
Field.
Time Gain
Time Loss
Time Gain
Time Loss
12 ¼” Phase
8 ½” Phase

30
POLITECNICO
DI MILANO
Fig.8.4: Total Gain Analysis
8.2 CAPABILITY TO REACH THE TARGET
The use of PCE Technology should be suggested in order to increase the probability to
successfully drill reservoir sections characterized by a high variability in the geological
structure of the area.
No relevant benefits can be identified from the analysis of the Onshore Fields.
8.3 SAFETY
The use of PCE Technology always brings a relevant qualitative benefit related to safety
increase, principally thanks to:
better capability to manage downhole pressure (mitigating influx/losses);
additional mechanical barriers (valves through drill pipe).
8.4 ALTERNATIVE TECHNOLOGY (CCS)
In December 1998, Ayling brought this continuous circulation concept before the Wells
Group of the Oil & Gas Industry Task Force, set up by the UK Government's Department of
Trade & Industry. Ayling said the concept was rated one of the top three most promising
technologies for reducing cost.
To implement the recommendations of the task force, an organization called the Industry
Technology Facilitator (ITF) was set up. ITF now has a membership of 14 oil companies. The
ITF acts as a catalyst to facilitate joint industry projects (JIP).
Maris managed to get the Continuous Circulation Coupler project approved as ITF's very first
JIP in April 2000, and funding for the project started in October 2000. By this time, Ayling

31
POLITECNICO
DI MILANO
said that he and private investors had spent over four years and $1 million in the
development of the coupler. He said that ITF had been the valuable key to bringing the
system forward and getting the operators involved.
Shell, BP, BG, Statoil, and Veba have now funded the outline design of the system, which
was carried out by Varco under contract to Maris and completed in May. At this point Varco
was selected as a natural choice to fabricate and market this product. "They know all about
the components of the coupler," Ayling said, and could distribute, market, and support the
coupler in the field.
Varco has now licensed the technology from CDL under a worldwide agreement that allows
CDL to retain ownership of the technology and receive royalties and allows Maris to continue
to develop the technology. Ayling said "The royalties from the coupler should generate
several million dollars per year, and this will fund enough research and development to make
a real difference to the industry."
COUPLER CONCEPT
At any stage in drilling operations, there is an optimum downhole pressure. The mud weight
and rate of circulation are adjusted to keep the pressure within the range required, but there
is no way to keep this pressure near constant.
Simply put, if the pressure is too low, oil and gas may begin to flow into the wellbore and
generate a 'kick.' If the pressure is too
high, the formation may fracture and
'lost circulation' may occur. In some
areas, these drilling margins are very
narrow.
As it happens, a significant component
of the downhole pressure is the
dynamic pressure drop in the annulus,
which is necessary to get the mud,
cuttings, and debris to circulate back to
Fig.8.5: Continuous Circulating Coupler
the surface. Drillers refer to this dynamic pressure drop as the Effective Circulating Density
(ECD), representing the mud density that would produce the same downhole pressure if the

32
POLITECNICO
DI MILANO
mud was not circulating. If it is possible to maintain a steady ECD, or steady downhole
pressure, continuously, there would be many benefits.
ADDING PIPE
Using the conventional system, whenever a new stand of drill pipe has to be added to the
drill string, drilling and mud circulation have to stop. The dynamic pressure drop to surface
disappears, and the downhole pressure temporarily drops, often to a level below the static
pressure. The cuttings and debris sink in the hole and settle on the bottom.
This static mud heats up. Then, when circulation begins again, there is a surge of pressure,
which usually overshoots the steady circulating pressure. The drill bit, which has usually
been raised off the bottom to lessen the chance of becoming stuck, has to drill through the
settled cuttings and debris before recommencing the drilling of the formation.
The downhole pressure difference between the circulating and static conditions can be
hundreds of psi, and the overshooting of the static pressure and the steady running
pressures can also be hundreds of psi.
Basically, at the bottom end of the hole being drilled, several miles from the drilling rig, the
effect of stopping circulation is at least highly inconvenient and can be disastrous.
PRESSURE CONTROL
With continuous circulation, the downhole pressure can be lowered to near the formation
pore pressure. This is called 'near balanced drilling' and can increase the rate of penetration
(ROP) of the drill bit dramatically. When the appropriate equipment is installed to handle oil
or gas in the returning mud, the pressure can even be maintained at a level of under
balance.
A major problem in under-balanced drilling is that the gas accumulates when drilling stops.
This has to be circulated out of the hole before drilling operations can properly resume. With
continuous circulation, the gas does not accumulate, and drilling can recommence as soon
as the new stand of drill pipe is connected.
For lateral wells, and even more so for extended reach wells, the continuous movement of
the returning mud and cuttings is vital to keeping the hole clear. Conventionally, in horizontal
sections, when circulation and drillstring rotation stop, the cuttings only have to sink a couple
of inches to settle - and perhaps, never move again. The is particularly the case since the

33
POLITECNICO
DI MILANO
renewed rotation of the drill string tends to mash the settled cuttings into the wellbore. The
resulting reduction in effective wellbore diameter can cause the 'bottom hole assembly' to
become stuck.
HOW IT OPERATES
The coupler operates like a control room airlock. The coupler is a pressure chamber that can
seal around a drillpipe tool joint. The tool joint is disconnected under pressure inside the
coupler. Mud is pumped into the lower half of the coupler and flows down the drillstring so
that the top drive sub no longer needs to supply the circulating mud.
The top drive sub can be retracted into the upper half of the coupler, and a barrier can be
closed between the two halves of the coupler. This done, the upper half can be de-pressured
and drained, and the top drive can be extracted from the coupler to fetch another stand of
drillpipe.
Meanwhile, the circulation of the drillstring continues with mud being supplied directly from
the lower half of the coupler. The new stand is inserted into the upper half of the coupler,
sealed, filled with mud, brought up to pressure, and the barrier is then removed so that the
stand can be connected to the drillstring, without any interruption to the flow of drilling fluid.
The components can be based on pipe rams for sealing against the drillpipe, a blind ram as
the barrier and upside down slips for the snubber.
CLOSED LOOP SYSTEM
The combination of a coupler and under-balanced drilling yields the 'closed loop system' that
can properly control the downhole pressure. The mud input pressure can thus be adjusted or
maintained at the optimum level through the entire drilling process. The ECD can be finely
adjusted and maintained at any desired level continuously. This is a real improvement in
safety, says Ayling.
For example, a kick is easier to detect. The pressure variations, which normally occur for up
to half an hour or more after each connection due to variations in the 'cuttings in mud
density,' the mud temperature and density itself, and accumulated gas, are now eliminated.
There are no reverberations from the last circulation stoppage to mask the subtle first signs
of a kick.

34
POLITECNICO
DI MILANO
Also, kicks are far less likely to occur since the dramatic drops in bottomhole pressure are
avoided.
A kick cannot occur while the mud is disconnected from the drillstring because it remains
connected and flowing at all times. If a kick occurs, the pressure can be immediately
adjusted and maintained, even while re-inserting stands of drillpipe to return the bit to
bottom, when this is needed.
IN COMPARE WITH PCE
CCS - Rig floor based system.
The coupler is a pressure chamber on the rig floor located over the rotary table, through
which the drillstring passes and which seals around the drillpipe pin and box during the
connection process.
LIMITATIONS:
• Complicate system to manage
• Not friendly use
• Big and cumbersome system
• Space demands on the rig floor
The most simple and effective technology that can maintain constant the bottomhole
pressure and avoid pressure fluctuation is PCE.
8.5 FUTURE SUGGESTIONS
This project gave me an opportunity to learn how the influence of the technology can be
measured and use this analysis for future development. It became very important and key
point to take a decision of using PCE technology in drilling wells on Onshore wells. The
experience got from this project will support my future work related to performance analysis
and it left good basement for my personal improvement in this field.
The qualitative part of this analysis are trusted and using real data of database in eni the
project could expand the limits and analyze also wells on Offshore field. In my opinion the

35
POLITECNICO
DI MILANO
results could be used for general evaluation of different technologies as the methodology
used in this project is covering all appeared issues. As a suggestion for a project, I would add
also the qualitative part using a questionnaire for managers who had an experience with this
technology. This absolutely could cover also all possibly appeared issues what is very
valuable when we are talking about huge investments in oil&gas industry.

36
POLITECNICO
DI MILANO
9. REFERENCES
1 ENI.COM
2 ONEPETRO.COM
3 SPE ANNUAL TECHNICAL CONFERENCE AND EXHIBITION, 26-29 SEPTEMBER 2004, HOUSTON, TEXAS
4 WWW.OFFSHORE-MAG.COM/ARTICLES/PRINT/VOLUME-61/ISSUE-11/NEWS/DRILLING-TECHNOLOGY-CONTINUOUS-CIRCULATION-COUPLER-SOLVES-PROBLEMS-WHEN-FLUID-STOPS-FOR-JOINT-CHANGE.HTML
5 WWW.ONEPETRO.ORG/MSLIB/SERVLET/ONEPETROPREVIEW?ID=00090702


