Page 1
h .
IflW ^eCY=r-- MASTER COPY- FOR REPRODUCTION PURPOSES
E 0 CUMENTATION PAGE
AD-A 97 16 --- 1b. RESTRICTIVE MARKINGS
1 4 .968 "1 3. DISTRIBUTION/ AVAILABILITY OF REPORT
2b. DECLASSIFICATION IOOWNGRADI DULE Approved for public release;N/A distribution unlimited.
4. PERFORMING ORGANIZATION REPORT NUMBER(S) a - S. MONITORING ORGANIZATION REPORT NUMBER(S)
PYU-7753 Final Reportis. NAME OF PERFORMING ORGANIZATION 6b. OFFICE SYMBOL 7a. NAME OF MONITORING ORGANIZATION
SRI International icable)
I AU. S. Army Research OfficeSADDRESS (Cty, Stae, and ZICode) 7b. ADDRESS (City, State., and ZIP Code)333 Ravenswood Avenue P. 0. Box 12211Menlo Park, CA 94025 Research Triangle Park, NC 27709-2211
Ba. NAME OF FUNOING/SPONSORING lab. OFFICE SYMBOL 9. PROCUREMENT INSTRUMENT IDENTIFICATION NUMBERORGANIZATION O applicable) DAAG29-84-K-0161U. S. Army Research Office
8c. ADDRESS (City, Stote, and ZIP Code) 10. SOURCE OF FUNDING NUMBERS
P.O0. Box 12211 PROGRAM IPROJECT ITASK ~ WORK UNITResearch Triangle Park, NC 27709-2211 ELEMENT NO NO. NO. ACCESSION NO
11. TITLE (Include Security Classification)
GUM AND DEPOSIT FORMATION IN DIESEL FUELS
12. PERSONAL AUTHOR(S) *Frank R. Mayo* and Theodore Mill (*Deceased)
13s. TYPE OF REPORT "13b. TIME COVERED 14. DATE OF REPORT (Year, Month,Day) S.PAGE COUNTFinal I FROM 1984 TO 1988 1 88-05-15 r 15
16. SUPPLEMENTARY NOTATION The view, opinions and/or findings contained in this report are thoseof the authr($),and sh uld not be' constjugd as an fficial Dpartment of the Army position,
17. COSATI CODES 18. SUBJECT TERMS (Continue on reverse if necessary and identify by block number)FIELD GROUP SUB-GROUP Fuels, gum deposits, oxidation
21 04
19N TRACT (Continue on reverse if necessary and identify by block number)We examined two aspects of the stability of diesel fuels in storage: the formation
of sediments in suspension, which subsequently clog filters, and the formation of soluble
gum, which passes the filters but then forms hard deposits on hot engine parts. Research
on fuel stability at SRI during the last 6 years has shown that soluble gum appears first
on storage, and then part of it grows into sediment. If the oxidation mixture is agitated
'% gently, the precipitating gum grows on the surface gum, and no loose sediment is formed.
We distinguished three mechanisms of gum formation: (1) a process intimately associated
with chain propagation and termination during oxidation, (2) a coupling of fuel molecules
by decomposing peroxides in the absence of oxygen, and (3) a condensation of naphthols and20. DISTRIBUTION /AVAILABILITY OF ABSTRACT 21. ABSTRACT SECURITY CLASSIFICATION
-UNCLASSIFIEDIUNLIMITED (3 SAME AS RPT. C3 OTIC USERS Unclassified22a. NAME OF RESPONSIBLE INDIVIOUAL 22b. TELEPHONE (Wncude Are Code) 22c. OFFICE SYMBOLTheodore Mill (415) 859-3605
DO FORM 1473, 4 MAR 83 APR edition rey be used until exhausted. SECURITY CLASSIFIKATION OF THIS PAGEAll other editions are obsolete. UNCLASSIFED
~ -V.A. ~UNCLASSIFIEDA
Page 2
XAA
4|
UNCLASSIFIED"CUmRv CLASSIFICAION OF ,1,4" PA,
aldehydes from the oxidation of alkylnaphthalenes. The polymeric oxidation products from a
JP-8 fuel are shown to be largely responsible for deposits in the Jet Fuel Thermal Oxidation
Tester (JFTOT). L
Oxidations of several pore hydrocarbons at 1000 and 43'C gave a wider range of
reactivities but no gum formation. Oxidations of fuels give gums at 100* and 130C in about
the same ratios as oxygen uptake; oxygen rate dependence on added initiator showed a
range from zero to first order, indicating several different mechanisms for oxidation.
5'i
UNCLASSIFIED
SECURITY CLASSIFICATION OF THIS PAGE
5~''S *S.~, ~ 5V '5' S.J ~ ~ 1 ~ ',5 % S * ,. % - 5. . S-S ..
Page 3
GUM AND DEPOSIT FORMATION IN DIESEL FUELS
FINAL REPORT
By: Frank R. Mayo and Theodore Mill
May 25, 1988
Prepared for: I
U.S. ARMY RESEARCH OFFICEP. 0. Box 12211
Research Triangle Park, NC 27709
Attn: Dr. David M. Mann
DAAG29-84-K-0161
SRI International333 Ravenswood AvenueMenlo Park, CA 94025
APPROVED FOR PUBLIC RELEASE; ;~
DISTRIBUTION UNLIMITED. "
:4
..
4.
.. . . . .. . -: " ' ' i ' ,' "
l 'i' i"
I ... .. . " .. . .... ... . . . - " : . .. 4.
Page 4
- I
THE VIEW, OPINIONS, AND/OR FINDINGS CONTAINED IN THIS REPORT ARE THOSEOF THE AUTHOR(S) AND SHOULD NOT BE CONSTRUED AS AN OFFICIAL DEPARTMENTOF THE ARMY POSITION, POLICY, OR DECISION, UNLESS SO DESIGNATED BY OTHERDOCUMENTATION.
piUl
Page 5
I L
.',
I
CONTENTS
INTRODUCTION .......................................................... I
EXPERIMENTAL METHODS AND RESULTS ...................................... 2
Oxidations at 130°C ................................................ 2Metal Surface Effects in Fuel Oxidation ............................ 3Oxidations at l00C ................................................ 6
Mechanisms of Gum Formation ....................................... 10Deposits from the Jet Fuel Thermal Oxidation Tester (JFTOT) ... 11Oxidations at 43°C ............................................ 11
RECOMMENDATIONS FOR FUTURE WORK ....................................... 12 I
REFERENCES ............................................................ 13
APPENDICES
A GUM AND DEPOSIT FORMATION FROM JET TURBINE AND DIESELFUELS AT 130°C
B GUM AND DEPOSIT FORMATION FROM JET TURBINEAND DIESEL FUELS AT 100°C
C SOURCE OF JFTOT DEPOSITS FROM AN OXIDIZED JP-8 FUEL
DSi.
i 5 .,'5'
.• .,'INSPFECTED
Acce3icjn Fo~r 71
-----
Np
NIN.0 N
Page 6
INTRODUCTION
The principal investigator, Dr. Frank R. Mayo, died in October
198/. This Final Report summarizes work conducted by him under Army
Research Office Contract DAAG29-84-K-0161 on the stability of
hydrocarbon fuels. Two reprints and a manuscript (Appendices A through
C) provide many of the data for this report.
Many fuels oxidize slowly during storage, and the sediment that
forms may precipitate and clog filters. When the filtered fuel,
containing soluble gum, comes in contact with hot metal, it may leav -
hard deposits that clog screens and narrow passages, making diesel and
jet turbine engines inoperable. The clogging process is difficult to
study because the yields of problem-causing deposits are small compared
with the large volumes of fuel passing through filters and small
openings.
It is generally accepted that formation of both sediment and hard
deposits results from oxidation of fuel, mostly during storage.
Deaerated fuels require higher temperatures to produce deposits.
The objectives of this work were to devise specifications for
stable diesel fuels, a test for the stability of fuel on hand, and a
mechanism for the formation of hard deposits from soluble gum on hot
metal. The specifications for stable diesel fuels and the test for the
stability of fuels are not addressed in this report.
Z"' %
*5
'
,%
'
Page 7
EXPERIMENTAL METHODS AND RESULTS
Oxidations at 130 °C
Research at SRI International on diesel fuel stability has been
supported by the Army Research Office for 6 years (Contract DAAG29-84-K-
0161); in addition, NASA supported research on jet turbine fuels for the
first 3 years of that period (Contract NAS3-22510). Generally, in these
experiments, the fuels were distilled in vacuum to remove preexistent
gum. We then measured the oxygen absorbed from air at constant
temperature and the amounts of soluble gum and sediment formed. Most
previous investigators measured sediment only, which is a minor
proportion of the total oxidation product. Our work began with
experiments at 130°C, where most oxidations proceed at a convenient rate
without added initiator.1 We used field ionization mass spectrometry
(FIMS) to identify the components of the fuels and the oxidation
products, with very little fragmentation of either.
Experiments with an unstable fuel showed that dimeric and trimeric
oxidation products accumulated in solution and then a precipitate
formed, with partial clearing of the discolored oxidized solution. This
observation is our best evidence that sediment comes from growth and
accumulation of soluble gum. Experiments were also performed with pure
hydrocarbons, n-dodecane, Tetralin, l-phenylhexane, and phenylcyclo-
hexane, which never gave any sediment, so that the oxidation products
could be identified by molecular weight alone. The monomeric oxidation
products were the hydroperoxides and the related alcohols and ketones.
Dimeric and trimeric products were also found; they contained two or
three complete hydrocarbon residues, less a few hydrogen atoms, and up p
to five oxygen atoms per molecule, but how the oxygen is distributed
among peroxide, alcohol, ketone, and ether groups is unknown.
A preliminary survey of nine diesel and two jet turbine fuels %
showed a wide range in rates of oxygen absorption and times at which
sediment appeared, but there was no correlation between the oxygen
2
Page 8
.P
absorbed and appearance of sediment. All the fuels absorbed oxygen %
slower than n-dodecane, although two were nearly as fast. Addition of
0.1 M t-Bu20 2 increased rates of oxygen absorption tenfold.
Simultaneous measurement of oxygen consumption and gum formation
showed that the pure hydrocarbons oxidize much faster than most fuels.
There is a different but somewhat similar order for rates of gum
formation, with some overlap among pure hydrocarbons and fuels.
However, the ratio of rate of gum formation to rate of oxygen absorption
measures the milligrams of gum produced per pmole of 02 absorbed. By
this relation, the fuels give much more gum for the oxygen absorbed than
most pure hydrocarbons. A notable exception is 2-ethylnaphthalene,
which has the highest rate of gum formation that we have measured and
gives more gum for the oxygen absorbed than some fuels.
N-Methylpyrrole and indene are in a class by themselves and are not
included in the discussion above. They have higher rates of oxygen
absorption and gum formation and give more gum for the oxygen absorbed
than any other substances we have tested. They are unacceptable in
fuels that are stored.
Cooxidations, especially of small proportions of indene or N- N
methylpyrrole in dodecane led to the following conclusions. To affect
the rate of oxidation, minor components of oxidation mixtures have to be
very reactive, and then they are rapidly consumed. These reactive
components may either accelerate or retard oxidation of the major
component, depending on their proportions. We have found no example of
a catalytic effect (without consumption) of a reactive additive.
Metal Surface Effects in Fuel Oxidation
One of our objectives was to determine the effect of metal surfaces
on fuel stability. However, a book appeared that treated this subject
competently.2 The book has been translated but not published by NASA,3
and both versions have a very limited availability in the United
States. Chapter 6 deals with relative rates of oxidation and gum
formation in the presence of many metal and alloy surfaces. In this
3
Page 9
4
section, review this chapter and draw some conclusions.
The authors used 0.5 g of metal powder in 50 g of T-6 jet fuel for
their experiments This fuel was produced by hydrodearomatization. It
contains no significant quantities of N, and S and has a low tendency
toward deposit formation in fuel systems. Some of its properties
follow: <10% boiling below 220°C, <98% below 315°C; density at 20°C,
840 g/L; <22% aromatic hydrocarbons, <1.5% bicyclic aromatic
hydrocarbons. Oxygen absorption was measured over an unstated period at
150°C and presented as the quotients of the rates of oxygen absorptions
with and without metal. At the ends of the experiments, solid products
and soluble gum were determined. These are presented as milligrams of
material per 100 g of fuel and also as the quotients of these weights in
the presence and absence of metal surfaces. These gum data are treated
as if they were rates over the same periods as the corresponding oxygen
absorptions.
Table 1 summarizes the results in Table 6.3 on pages 208-209 of the %
book. We have added code letters and arranged the relative rates of IA
oxidation in order of decreasing rates. These relative rates range from S
eight times to one-seventh the rate in the absence of metal (q). The
second column of figures gives the relative rates of gum formation in
order of decreasing rates; the code letters are repeated because the
orders in the two columns, though similar, are aot identical. The
spread in rates of gum formation is small, from one-half to twice the
rate in the absence of metal. The third column of figures shows the
quotients of the same code numbers in the first two columns, arranged in
order of decreasing magnitude. The larger numbers at the top of this
column show that more oxygen is required to produce a miliigram of gum
with these metals; the small numbers at the bottom show that these
metals give the most gum for the oxygen absorbed.
Denisov and Kovalev conclude that the principal effect of the metal
surfaces is to affect the rate of homogeneous oxidation by decomposing
hydroperoxides on the metal surface. If this decomposition produces
4
.r P.O -.
Page 10
Table 1
OXYGEN ABSORPTION AND GUM FORMATION BY T-6 JET
Code Metal Surfacea Relative Relative Relative
Letter Rb RC Ro/R%
a 100 Cr 8.12 a no datum a no datum
b Cu +20 Pbe 5.16 d 2 .16d c 2.54
c Cu +11 Pb +10 Sn 5.16 b 2.04d b 2.53
d 100 Pb 5.08 c 2.03 d 2.35
e Cu +11 Alf 3.12 f 1.76 e 1.91
f 65 Cu +33 Zn + 2 Pb 3.10 e 1.63 g 1.90
g Cu +10 Alg 3.02 g 1.59 p 1.84
h Cu + 6.2 Sb 2.57 h 1.5 1d 0 1.77
100 Cu 2.51 i 1.49 f 1.76
J Stainless steel 1.96 w 1.44 m 1.75
k 60 Cu + 40 Zn 1.86 j 1.31 h 1.70,
1 Fe + 12 Cr 1.86 k 1.18 i 1.68
m 100 Fe 1.56 1 1.13 1 1.65
n 100 Al 1.55 1.000 k 1.58
0 100 Sn 1.47 n 0.99 n 1.57
p Low-Ni stainless 1.42 m 0.8 9d s 1.56
No metal 1.000 x 0 .8 8d j 1.50
r 100 Zn 0.88 u 0.86 r 1.09
s 100 Mo 0.78 0 0.83 1.000
t 100 Nb 0.78 v 0.81 t 0.99
u 100 Mg 0.70 t 0.79 w 0.81
v 100 Ni 0.24 p 0.77 v 0.39
w 100 V 0.14 v 0.62 x 0.16
x 100 W 0.14 s 0 .5 0d w 0.097
a Metal powder, composition in weight %, with a surface area of about 300
cm /L. H wever, a, m, n, r, t, and v apparently have surface areas up to19000 cm2/L. I
b (Rate of oxygen absorption with mettl)Oate of oxygen absorption without
metal). Latter rate was 1.97 X 10- M /sec.
c (Gum + deposit with metal)/(gum + deposit without metal). Latter number
is 57.0 mg /lOOg fuel.
d Deposit noted. e +3 each Zn, Sb. f +5.5 each Fe, Ni. g +3 Fe + 1.5Mn.
5
N N I- ,vv 4 z. ~ -
Page 11
7, 7K %I.X V L* I,, .
free radicals, the oxidation is accelerated; if it does not, the
oxidp ion is retarded because the hydroperoxide is wasted.
Figure 1 is a revision of DeniLov and Kovalev's Figure 6.2 on page
210. The straight line corresponds to our correlation of the data.
Although this line predicts considerable gum formation without any
oxidation, it shows that, generally, rates of oxidation correlate well
with rates of gum formation. Chromium (a), which causes the fastest
oxidation, does not appear in Figure 1 because no gum data are
available.
We conclude that the effects of metal surfaces on rates of oxygen
ahsorption and gum formation are not now a promising field for
investigation. Even with 300 cm2 of surface per liter of fuel, the
effects of the metals and alloys tested are small to moderate, and the
effects in larger containers would be less. Our data suggest that
differences among fuels are greater than differences among effects of
metals (see below). Use of the proper stabilizers (e.g., BHT, lonol)
will probably essentially eliminate the effects of metals on the
homogeneous reactions.
Oxidations at 100°C
Our work at 130°C was followed by experiments at 100°C, mostly with
added t-Bu 202 to accelerate reactions.4 Both papers1'4 contain
references to the relevant literature that are not repeated here.
Copies of the papers are appended to this report. The t-Bu202
experiments were needed to accelerate reactions at lower temperatures
nearer to service temperatures and to determine the effects of initiator
concentrations on rates of oxidation and gum formation.
At 100°C, oxidations of dodecane, Tetralin, and two fuels are
autocatalytic; oxidations of the alkylnaphthalenes and all the other
fuels are self-retarding. With other pure hydrocarbons, trends are not
clear. No precipitate was obtained from any pure hydrocarbon, but most
of the fuels gave adherent (not particulate) precipitates (as well as
soluble gum) as uniform films on the parts of the reactors that were in
6
Page 12
2--
dP.
cc 0
3.
0 .0 .0xR=09
2
Ro5
JA-M-77535
Figue 1.Reltiverats ofoxidtio vs um ormaion
7.
Page 13
contact with liquid. We attribute the predominance of film formation to
the gentle agitation that was used and a tendency of precipitating gum
to precipitate on other gum. These results suggest that constant gentle
stirring of a fuel during storage might cause the sediment to adhere to
the tank walls, thereby reducing or even eliminating filtration
problems.
2-Methylnaphthalene and three fuels oxidize faster at 100°C with
0.03 M t-Bu2 02 than at 130°C without initiator. Thus, these substrates
have less ability to initiate and maintain their own oxidations than the
other and faster oxidizing fuels; they are self-retarding in oxidations.
The ratios of the rates of gum formation and oxygen absorption
indicate the relative amounts of gum formed for the oxygen absorbed. If
the mixture of mechanisms for gum formation is the same at 100°C and
130°C, then the ratios at the two temperatures should be the same; the
majority of them are similar, even with large differences in individual
rates of gum formation and oxygen absorption. Details of these
measurements are found in the paper on 100C oxidations.4
Experiments with different concentrations of t-Bu202 show three
patterns for rates of oxidation.4 In the classic pattern, the rate of
oxidation is half-order in initiator, corresponding to an initiation
that is first order in initiator and a termination that is second order
in peroxy radicals. However, in a second pattern, the rate of oxidation
is nearly independent of initiator concentration. We propose that this
fast oxidation gives a moderately unstable peroxide, the initiating
effect of which swamps that of t-Bu 202 . The third pattern, shown best
by two fuels,4 gives a rate of oxidation that is first order in
initiator, characteristic of inhibited oxidations. Many hydrocarbons
and fuels tested fall between these simple patterns.
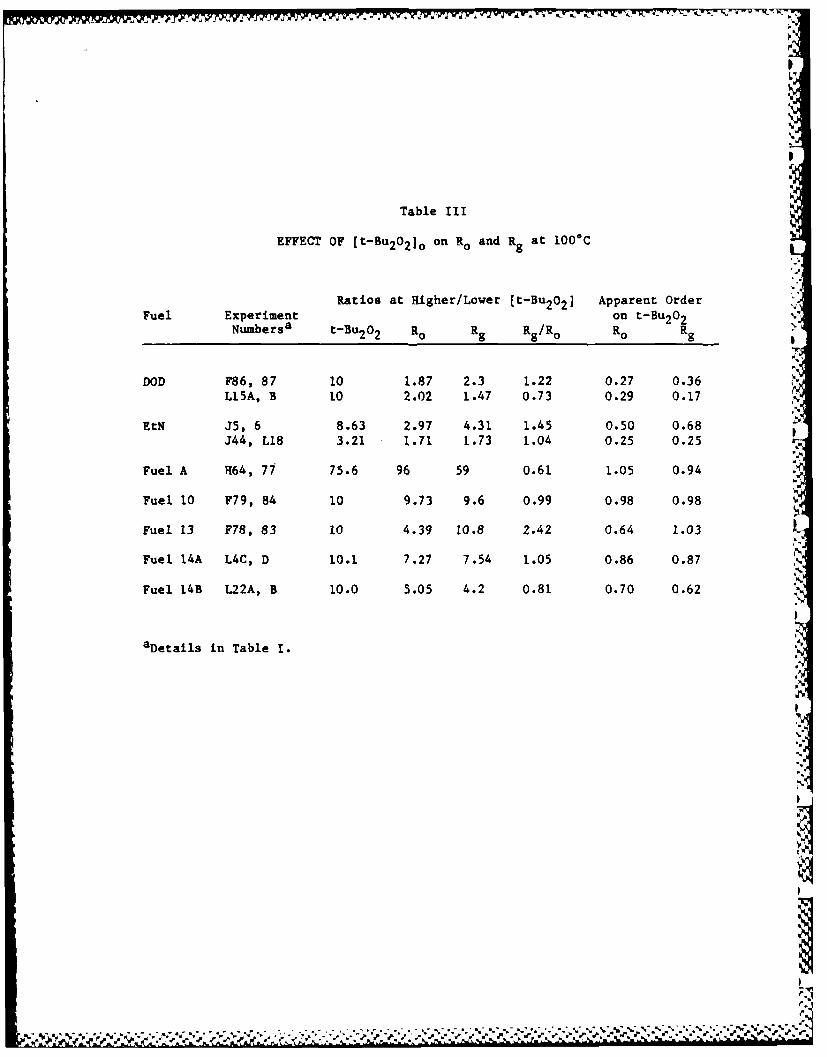
A later set of measurements on the rates of gum formation and Ioxidation (Rg/Ro) is shown in Table 2 for several fuels. These data
show that this ratio is in the range of 0.2-4.4 for all but two fuels.
8 I~
Page 14
-- wad ad
' 0~~ 0 0'
.- Fd N IL 06 In 2. u % .0. 3. to
4~~ .* 0o 0 0 - 0 t~ ' - 0N 4 4t
C4.0
t- DC C 0 W,0 0 ' 0C40
0 Aj--4 . 31
!4 04~ -4 .
00 41
S 4Vt C4 Q-
0 0 N 'A zt0 V t % '.C0 z t* = * * *
ps. C1 N o t4.0 ad N 0 0 0 4f 00
0 ~ ~~~~~ 0 t 0% .. 4 % 0 NO *
C4 0%0 a %0 00 C 040 uVtw lto34 -i -0 04 to
0 * 0
Og a~ Go% 0 - 04.0 0C% a%0 o. C4N-~ 00
0i go r- * 0 %a C.00 cc Nrt' 4' 0n 0 0 0 0 0 -t '4 44
C44 C4 -4 '0 0h .
-6 00
0 0. 0 .
z ~h. *
Page 15
Mechanisms of Gum Formation
We now discuss our three mechanisms of gum formation. '4 The first
mechanism is associated with chain propagation and termination during
oxidation. When enough oxygen is present to convert nearly all alkyl
radicals to alkylperoxy radicals, then one termination mechanism is
2RO2 -> R202 + 02, and this reaction is apparently a start in
building up larger molecules. However, this reaction alone gives only
dimeric products. To obtain trimeric and heavier products, the R202
must participate in chain propagation and then in more coupling to R-02-
R-02 -R, and so on. Experimentally, we find that the orders of rates of
oxidation and gum formation in t-Bu202 are nearly the same even though
they vary from 0.3 to 1.0 for different substrates. Thus, it appears
that both chain propagation and chain termination contribute to gum and
deposit formation.
A second mechanism of gum formation occurs in the absenre of oxygen
when a peroxide or hydroperoxide decomposes to a pair of alkoxy aod/or
hydroxy radicals. These radicals abstract hydrogen atoms from adjacent
fuel molecules to give alkyl radicals, which combine quickly in a cage
or near-cage reaction. Yields of 60% on the peroxide of coupling
products have been obtained with ethylnaphthalenes. However, oxygen can
intercept the alkyl radicals and convert the coupling to an oxidation
reaction. This mechanism may be important in determinations of gum in
the absence of oxygen. The postulated peroxides in the original gum may
give more thermally stable materials when the concentrates are heated.
A third mechanism is proposed for alkylnaphthalenes because, among
the pure hydrocarbons, they have high ratios of gum formation to
oxidation. Their hydroperoxides can decompose to naphthols and
aldehydes, which may condense to resins. The retarding properties of
the naphthols formed may account for the generally low rates of
oxidations of fuels and for the self-retarding oxidations of the
alkylnaphthalenes and many fuels.
The picture that emerges from our work is that most pure
hydrocarbons oxidize by long kinetic chains to give relatively high
10
r ! | | ....
Page 16
yields of hydroperoxides and little gum for the oxygen absorbed.
Ethylnaphthalene is outstanding in giving a high rate of gum formation,
and methylnaphthalene is notable for giving a very low rate of
oxidation, very short kinetic chains, low yields of hydroperoxide, and a
high ratio of gum formation to oxidation, more like a fuel. The slow
oxidations and high ratios of gum formation to oxidation in fuels may be
associated with their contents of alkylnaphthalenes.
Two new approaches to the mechanism of gum and deposit formation
were introduced during 1986. They are discussed below.
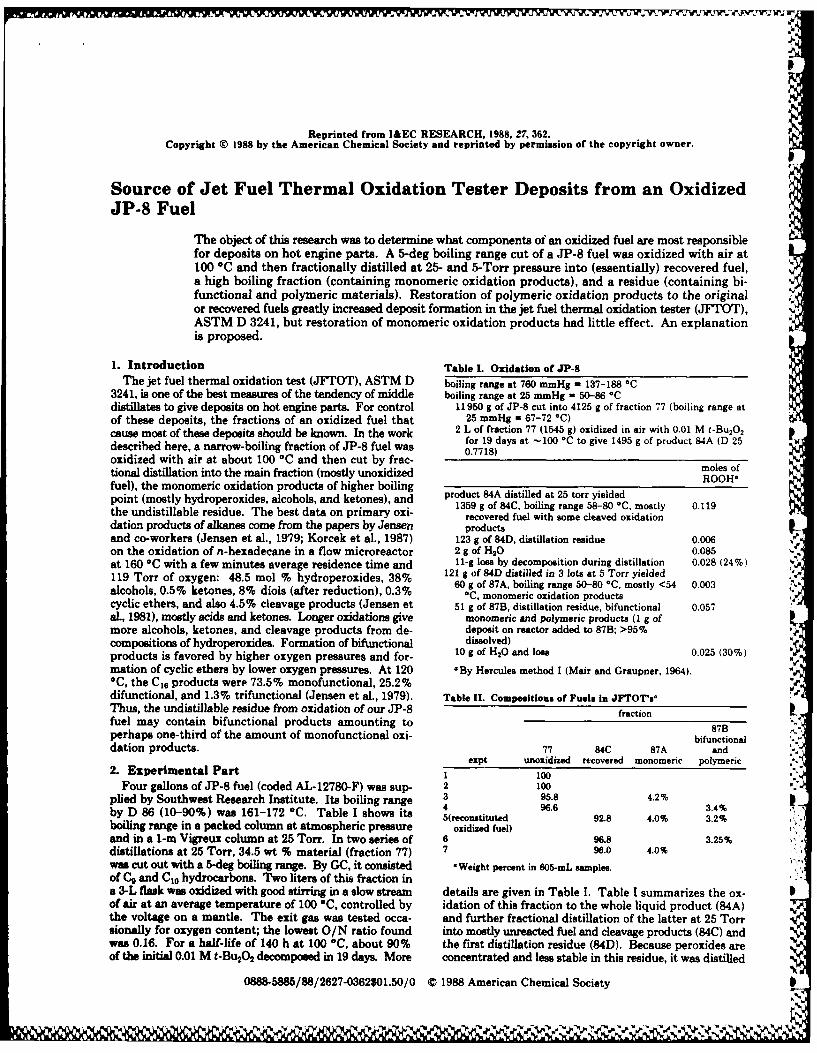
Deposits from the Jet Fuel Thermal Oxidation Tester (JFTOT). In
one approach, a jet fuel of narrow boiling range was oxidized at about
100°C and then separated by fractional distillation in vacuum into
(mostly) recovered fuel, monomeric oxidation products (hydroperoxides,
alcohols, ketones), and polymeric oxidation products. Results on
mixtures of these fractions show that the polymeric oxidation products
are the principal contributor to JFTOT deposits (see Appendix C).
SOxidations at 43*C. The second new approach involves oxidations at
43°C, the favored temperature for stability tests. This approach uses0
the commercial peroxide, Lupersol 221, (PrO-C-O-)2 , which has a half- S
life of 7 h at 43°C. Thus, more than 90% of this peroxide is decomposed
in 24 h and more than 99 percent in 48 h. Tests with a few hydrocarbons
and fuels show that some oxidations continue fairly rapidly after 24 h,
whereas others show a steadily decreasing rate and still others show
intermediate effects. We expect that the persistent oxidations indicate .6I
unstable fuels and that the slowest oxidations will correspond to stable
fuels; even after the oxidations of the stable fuels have been started, *4
they are not self-sustaining.
11
Page 17
I
,-s
RECOMMENDATION FOR FUTURE WORK
b
The results with metal ions, shown in Table 1, were obtained with a
stable jet fuel. A few results might be checked with a stable U.S. fuel
(diesel or jet) to see if they are comparable, and an unstable fuel
might also be tested, with an unstable fuel. A few oxidation and gum
experiments might be done with dissolved metals. The effects of the
soluble metals might be larger, but the pattern should be the same,
assuming that both dissolved metals and surfaces mostly affect prroxide
decomposition and free radical production. The missing effect of a
chromium surface on gum formation should be checked to see if it is
interesting.
Metals seem to be necessary to convert soluble gums to hardI
deposits, The effects of dissolved metals and surfaces on this reaction
should be checked. This field could be the most important remaining
problem in fuel stability.
12w
IV..-
, \,
Page 18
REFERENCES
i. F. R. Mayo and B. Y. Lan, "Gum and Deposit Formation from Jet a
Turbine and Diesel Fuels at 130°C," Ind. Eng. Chem. Prod. Res.Dev., 25, 333 (1986).
2. E. T. Denisov and G. I. Kovalev, The Oxidation and Stabilization ofJet Fuels, Khimiya Press, Moscow (1983).
3. NASA Technical Memorandum 77490 (1984).
4. F. R. Mayo and B. Y. Lan, "Gum and Deposit Formation from JetTurbine and Diesel Fuels at IO0°C, ' Ind. Eng. Chem. Res. 26, 215(1987).
*!
13
Page 19
Appendix A
GUM AND DEPOSIT FORMATION FROM JET TURBINEAND DIESEL FUELS AT 130*C
[Published in Ind. Eng. Chem. Prod. Res. Dev., 25, 333 (1986)]
%
10N
Page 20
b
GUM AND DEPOSIT FORMATION FROM JET TURBINE AND DIESEL FUELS AT 130 0 C
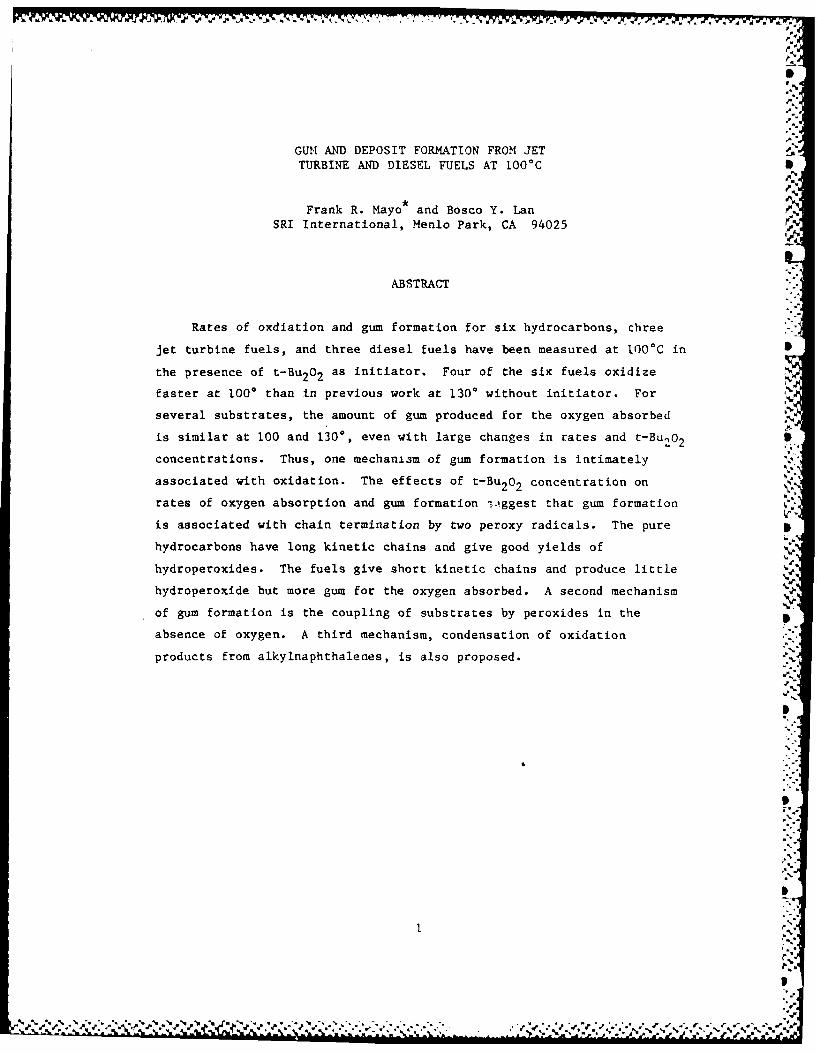
Frank R. Mayo*, and Bosco Y. Lan
SRI International, Menlo Park, CA 94025
ABSTRACT
The ultimate objective of this work is to devise an accelerated
test to compare rates of soluble gum aid deposit formation from jet
turbine and diesel fuels in storage and of hard deposits on hot engine
parts. This paper describes rates of oxygen absorption and gum
formation in air at 130*C. For a single fuel or hydrocarbon, the rate
of gum formation is closely proportional to the oxygen absorbed, even
when this rate varies with purification and additives. In general, pure
hydrocarbons absorb oxygen much faster than the fuels, but the fuels and
2-ethylnaphthalene give more gum for the oxygen absorbed than the other
pure hydrocarbons. Gum has two main sources. One appears to be
associated with the chain termination mechanism in oxidation, the other
with coupling of fuel molecules by peroxides in the absence of oxygen.
Other possibilities are discussed.
1Z
AV
Page 21
1. INTRODUCTION
This research is concerned with soluble gum and deposit formation
from jet turbine and diesel fuels during storage at ambient temperatures
and on oxidations with air at temperatures ur to 130°C, and ultimately
with the hard, insoluble deposits that form on hot engine parts. These
two groups of fuels have similar boiling ranges and are presumed to have
the same mechanism of oxidation, but the jet fuels have lower sulfur
contents and higher specified thermal stabilities. Extensive previous
work has been mostly empirical, measuring deposit, and sometimes soluble
gum, formation from numerous fuels at temperatures up to about 150*C.
The field has been repeatedly reviewed (see, e.g., Nixon 1962, CRC 1979,
Goetzinger et al., 1983).
The consensus is that most gum and deposit formation is associatedL
with oxidation by oxygen but that the rate of oxidation is not a measure
of rate of gum formation, that some sulfur, nitrogen, and oxygen
compounds increase gum formation and some do not, that the first
deposits are often rich in these elements, and that olefins, especially
conjugated ones, increase gum and deposit formation.
The object of the fuel research described here is to determine how
and why gum and deposits form in very small yields in oxidations of
fuels and pure hydrocarbons at 130°C, a convenient reaction tempera-
ture. A subsequent paper will describe similar reactions at 100°C with
added di-t-butyl peroxide.
2
0f
Page 22
We assume that the soluble condensation products (gum) are the
principal source of deposits that separate from solution and of the very
insoluble carbonaceous deposits that cause engine problems. Whether and
how the soluble gum is converted to hard deposits is a major unsolved
problem.
Our first publication (Mayo et al., 1976) on fuel stability showed
that oxidation of a jet turbine fuel of average molecular weight 198
gave tiny fractions of molecular weight up to 400 or 1500 by gelI
chromatography and precipitation from pentane. These products contained
hydroperoxides, alcohols, ketones, esters, and probably aldehydes.
Heating 5% of a fuel hydroperoxide concentrate with fuel in a sealed,
evacuated vessel at 2000 produced a small brown deposit, part of which
had a molecular weight of 1500. Hazlett et al. (1977) investigated the
oxidation of n-decane over a stainless steel surface and concluded thatS
deposit formation is closely associated with pyrolysis of hydroper-
oxides. Ceransky et al. (1985) investigated reactions of n-dodecane in
a JFTOT with an aluminum heater at 200 - 400*C. They obtained no
deposits but examined the effluent by gc and 1c. Decomposition products
of dodecyl hydroperoxides and C2 4 products appeard at the highest
temperatures. The present paper will give some support to these
suggestions and present alternatives.
This paper differs from most previous papers in four respects. All
fuels were distilled in vacuo and stored under nitrogen below OC.
Thus, we studied the inherent properties of the fuels instead of
properties after an unknown history. Second, we measured oxygen
absorption and gum formation together and found large differences in the
13
~~%~I S*V5
%, q - V I N -*.5 .~**5'~* 5 *~ ~5*5'5 ~ '~~/..~.% %.5. .:.*-*f.'.%' %5*
Page 23
amount of gum produced for the oxygen absorbed. Third, we dealt mostly 4
with soluble gum formation rather than with deposits (which were
measured when found) because none of our pure hydrocarbons and some of
our fuels gave no deposits under our experimental conditions. Fourth,
gum formation is discussed in terms of two distinct mechanisms, coupling
of free radicals during oxidation and coupling of fuel molecules by
peroxides in the absence of oxygen. We admit that gum and deposits
formation can be augmented temporarily by very reactive nitrogen, oxygen
and sulfur compounds in fuels (CRC Report, 1979), but these compounds .
are soon consumed. We have had no reason to give them special
consideration in our fuels.
2. EXPERIMENTAL PROCEDURES
2.1. Fuels
Fuels A and B were stable and moderately stable jet turbine fuels
and Fuel C was a No. 2 home heating oil, representing a very unstable
jet fuel. All were supplied by Dr. Ed Wong of NASA-Lewis Research
Center. The numbered fuels are diesel fuels supplied by Mr. S. R. I
Westbrook of the U.S. Army Fuels and Lubricants Research Laboratory at
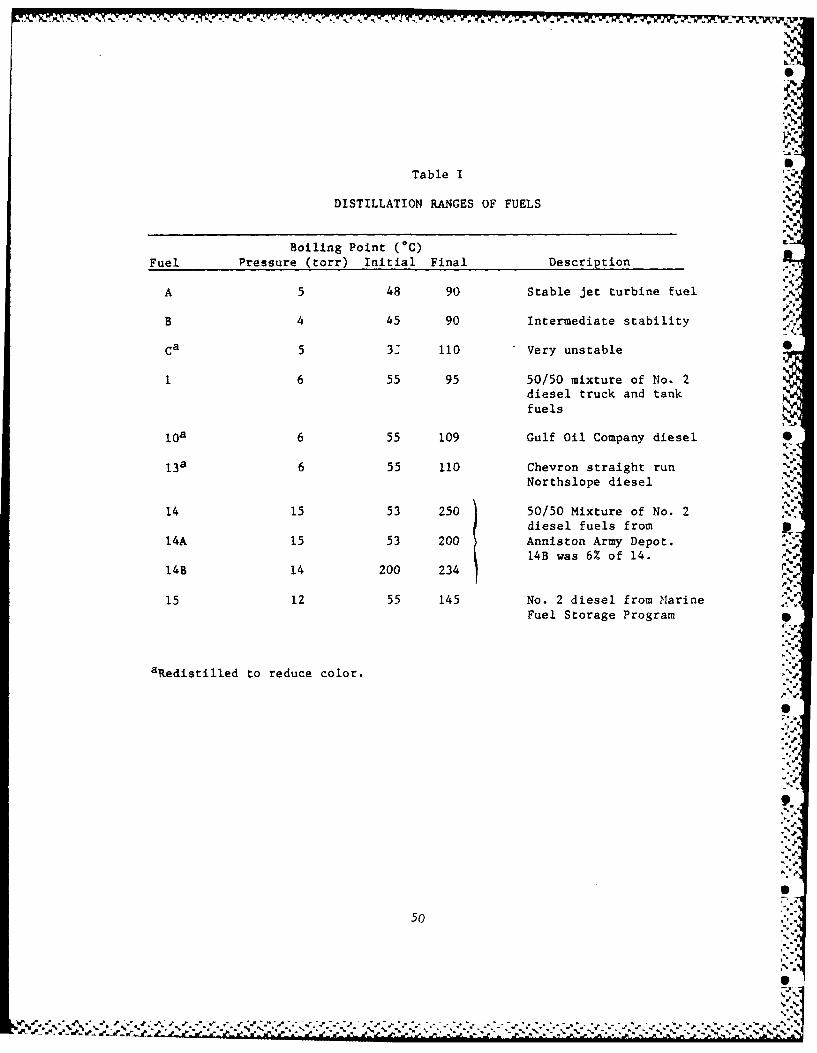
San Antonio. The boiling ranges of the most-used fuels are in Table I.
All of our hydrocarbons and fuels were distilled through a Vigreux S
column at 5-20 torr before use. This step eliminated the highest
boiling 2-5% of the fuels but was essential to eliminate whatever gum
41%
V VN V V-
%'S,'' ..'' is ".,, .,'.,''.J,'', .'.,'', ". ,, ." ../ _ , .,-.'.,''.' "'."... ".,''..', "'..'/ "" e"." -" , .-.,-,- ... ,.. " . ,.... , ... " , • a.€,
Page 24
S.
had accumulated before the fuel was distilled. The fuels were then.5
stored under nitrogen at -8*C until used. Some of the purchased "pure"
hydrocarbons exhibited marked induction periods on oxidation, but in %
some instances, chromatography through acidic alumina resulted in faster
oxidations at fairly steady rates.
Several fuels were chromatographed over acidic alumina and eluted
with hexane. The polar constitutents were then eluted with ether.
Table TI summarizes available elemental analyses of fuels, a distil-
lation residue, their polar fractions (see Section 3.4), and their
condensed oxidation products. The atomic H/C ratios of the fuels range
from 1.62 (Fuel C) to 1.89 (Fuel 1), but the residue from the vacuum
U
distillation of "unoxidized" Fuel C contains less hydrogen and nearly 5%
oxygen. The gums and deposits from oxidations have still lower H/C
ratios and still higher oxygen contents.
Figure 1 shows the gc traces for the polar fractions of Fuels 10
and 13. In Fuel 10, the major components are fluorene (C 3H1 0 ),
anthracene and phenanthrene (C140 10 ), their methyl derivatives (C1 5H 12 ),
dihydroanthracenes and phenanthrenes (C140 12 ), methyl derivatives of the
dihydro compounds (C15H14 and C16H 12 ), and C15H 12 . The polar eluent of
Fuel 13 gave a wider mix of products. The identified major peaks are ,1
carbazole (C12 H9 N) and its homologs. The data suggest that the
polynuclear aromatic hydrocarbons retard oxidation and gum formation in
Fuel 10 and that the carbazoles accelerate oxidation and gum formation
in Fuel 13.
Field ionization mass spectrometry (FIMS, also used for spectrum) .'
was used to analyze both unoxidized and oxidized fuels. To obtain the
complete molecular weight profiles of unoxidized fuel samples, a
5
Page 25
5- L sample of the unoxidized fuel was injected through a septum into
the evacuated 0.5-L glass expansion bulb of the batch inlet systen. The
resulting FIMS is therefore a molecular weight profile of the fuel
sample. Details are given by Malhotra et al. (1985).
A second field ionization mass spectrometer system was used to
analyze deposit precursors. It was equipped with SRI's activated foil
field ionization source. Fuel samples were analyzed for deposit N
precursors using vacuum evaporation preconcentration (St. John et al.,p
1978). The resulting FIMS represents the composition of the least
volatile components of the oxidized fuels, but the cutoff point was not.5
reproducible.
Table III summarizes FIMS of several fuels and illustrates the 5.,evolution of our analyses. Analyses marked a come from high resolution
FIMS that distinguishes among hydrocarbons with nearly the same
molecular weight, but do not include minor components of the fuels.
Other analyses are complete. These fuels were analyzed after vacuum
distillation but without oxidation. Fuel components are listed
according to their z numbers: z is defined by expressing the molecular
formula of a hydrocarbon as CnH2n+z. Thus z - +2 includes open-chain
alkanes; z - 0 includes alkenes and monocyclic alkanes; -2 includes
unsaturated cycloalkanes and bicyclic aliphatics; -6, alkylbenzenes; -8, p
indanes and tetralins; -12, alkylnaphthalenes; and -18, anthracenes and
phenanthrenes.
Figure 7 (presented with Figures 8 to ii to facilitate comparisons P
there) represents the molecular weight profile by FIMS for unoxidized
Fuel C. The first threp numbered pqk- differ by 14 units and I6
9
P,? .4 .'V '. r e I 0" P A P1 _P _P d
......... (t 5 v- N%,54I~~%. ~ ~ a
Page 26
correspond to alkylbenzenes, starting with xylenes. The next set of
prominent homologs, starting at 142, is mostly alkylnaphthalenes plus
some paraffins. Another set, starting at 168, corresponds to
acenaphthenes or z = 0 compounds. The higher boiling fraction of Fuel
14 is usually rich in hydrocarbon with high z number and may contain
some sulfur compounds.
2.2. Oxidations
Our oxidations were performed with - lO-mL weighed samples of
hydrocarbon or fuel in reactors of measured volume like that shown in
Figure 2, usually filled with air at ambient temperature and pressure
and then shaken in a silicone oil bath at 130*C. At intervals, the
reactors were cooled to room temperature and 70-pLsamples of gas were
withdrawn through a septum and analyzed for oxygen/nitrogen ratio by gas
chromatography on a 183 x 0.32 cm O.D. stainless steel column packed
with 13X molecular sieve and attached to a thermal conductivity
detector. The average 02 /N2 ratio found by gc for fresh air was
0.2553. The 02 /N2 at the end of a reaction period was compared with
that of fresh air at the same time to determine the fraction of oxygen
consumed, which was then used with the accepted 02 /N2 ratio in air, .
0.2682. - 1i torr pressure of water at 50% relataive humidity was
neglected.
7S
'0
'
Page 27
2.3. Determinations of Gum and Deposits
Soluble gum was deternined by evaporating a weighed 4-mL sample of
fuel in a stream of nitrogen from a capillary, without spattering, at
>200*C. The exact temperature depends on the evaporating fuel.
Evaporation took place from a 6-mL bottle like that shown in Figure 3,
preferably with the capillary resting lightly on the neck of the bottle
to avoid return of condensate. Evaporation required 10-20 minutes, was
carried nearly to completion, and was followed by prompt cooling under a
nitrogen stream. The residue (-0.1 mL) was then transferred with 1-2 mL
of reagent acetone to a tared aluminum dish, 25 mm in diameter, weighing
about 50 mg. This sample was then heated and brought to nearly constant
weight (-20 h) in a gentle stream of nitrogen in a furnace at 2000 C.
Weighings were made on a Perkin Elmer AD-2Z Electro Micro Balance. This
method usually gave results reproducible within 30% at low levels of
gum, about 5% at higher levels. In general, the gum data are averages
of two determinations.
Insoluble gum usually appeared as a fairly homogeneous dark film on
the glass in contact with the fuel. After removal of the fuel, the film
was rinsed with hexane and then dissolved in small portions of reagent
acetone or equal parts of acetone, ethanol, and benzene. The solutions
were transferred to our aluminum evaporating dishes and the residues
dried in vacuum. We propose that agitation of our oxidation flasks
caused deposition of films instead of sediments, consistent with our
idea that solids come from soluble gum.
........... N N I
Page 28
3. OXIDATION PRODUCTS
3.1. Fuel C 0
Table IV summarizes the results of an oxidation of distilled Fuel
C; they show steady increases in rate of oxygen absorption
(autocatalysis) and in concentration of higher molecular weight
material.
Figure 4 shows the molecular weight profile of distilled but
unoxidized Fuel C. The abscissa corresponds to the mass number of the
ions in the mass spectrometer. The full ordinate is. 10% of the sum of
all the ion intensities. Thus the 156 mass unit bar means that 8.8% of
the whole fuel consists of material of molecular weight 156. All the •
principal components have even mass numbers, as will all compounds of C,
H, and 0 (but not N). However, 1.1% of natural C is 13C, and so for any
12-carbon compound, about 13% of the molecules will contain one 1 3C and
have a molecular weight that is higher by one unit. Therefore, all the
major peaks will have an obvious satellite with mass number one unit
greater. Thus the 156 peak in Figure 4 is accompanied by a 157 peak
that is 13% as high. Other odd mass number are fragments of
molecules. Romologous series were discussed in Section 2.1.
Figures 5 to 8 summarize FIMS data after the four periods indicated
in Table IV. Each sample was spiked with 20 ppm of decacyclene (C36 H18 ,
molecular weight 450). The ordinate and the numbers in the upper left
corners of the figures are the percentages of the summed ion
intensities. Figure 5 shows the highest molecular weight fraction of
distilled but unoxidized Fuel C. Traces of the higher molecular weight
9
•k... . ,lll i il i i i l -.
Page 29
products can be seen in Figure 4. Figure 5 brings out the minute traces
of a great number of compounds swept over in the distillation or formed
between distillation and taking the spectrum.
Figures 6 to 8 show the FIMS after the three oxidation periods in
Table IV. Most of the material of molecular weight -250 corresponds to
incorporation of one to four atoms of oxygen into fuel molecules
(precursor monomers), retained because they are less volatile than the
fuel. Most of the material with molecular weights between 300 and 450
represents dimers of monomeric products plus oxygen. Material of
intermediate molecular weight presumably represents condensation of
monomer precursors and their fragments formed by cleavage of alkoxy
radicals. Figures 6 and 7 show that the development of monomeric
precursors and dimeric precursors, like the rate of oxygen absorption,
is autocatalytic. Development of trimers can also be seen.
During the oxidation period that ended with the product in Figure
8, the solution became lighter and a dark brown precipitate formed on
the reactor walls. During this period, the concentration of precursor %
monomers increased sharply (these may be the ones that don't condense
easily); and the concentrations of dimers and trimers appear to decrease
perceptibly (compared with the decacyclene standard), probably because
they have separated from the fuel mixture. This experiment is our best
evidence that soluble gum evolves into fuel-insoluble deposits.
The precipitate that formed, after washing with hexane and drying, J
weighed about 3 mg/g of initial fuel. Acetone extraction of this
residue gave 0.137 mg of extract/g initial fuel; its 1M1 in N-dimethyln
formamide was - 600. It therefore appears that the deposits precipitate Ile
000
10
rp- N"NIN
Page 30
because of their heteroatom contents as well as their higher molecular
weights.
Although the research described above provides excellent evidence
for the deposit formation by stepwise condensation of deposit precur-
sors, the data give us little indication of the chemical structures or
mechanisms involved. However, there is an indication with Fuel C of a
problem that becomes much more obvious with n-dodecane. Comparing
Figures 5 through 8 with Figure 4 shows that the oxidized products have
higher proportions of materials with odd mass numbers (in the spaces
between the peaks with even mass numbers). Odd mass numbers in C, H,
and 0 compounds, except those due to 1 3C or N compounds, mean that
fragmentation of parent molecules has occurred in the FIMS.
3.2. Pure Hydrocarbons
The multiple oxidation products from the many components of Fuel C
made further examination of oxidation products of Fuel C unpromising and
so our investigation of oxidation products turned to pure hydrocar-
bons. This work encountered two problems, decomposition of some
products during FIMS, and low yields of gum. We take up first the
monomeric products (e.g., C1 2 products from n-dodecane) and then
polymeric products (e.g., with multiples of 12 carbon atoms). Because
the extents of evaporation of the oxidation products in FIMS varied, so
do the proportions of monomeric and dimeric products reported. The
principal products measured by FIMS are therefore not listed in absolute
terms but in order of their observed abundance.
11
%4 - -U- '_:f 2 " o ' "
Page 31
The major primary oxidation products are the hydroperoxides, as
shown by titration (notes c-e to Table VIII. However, the hydroper-
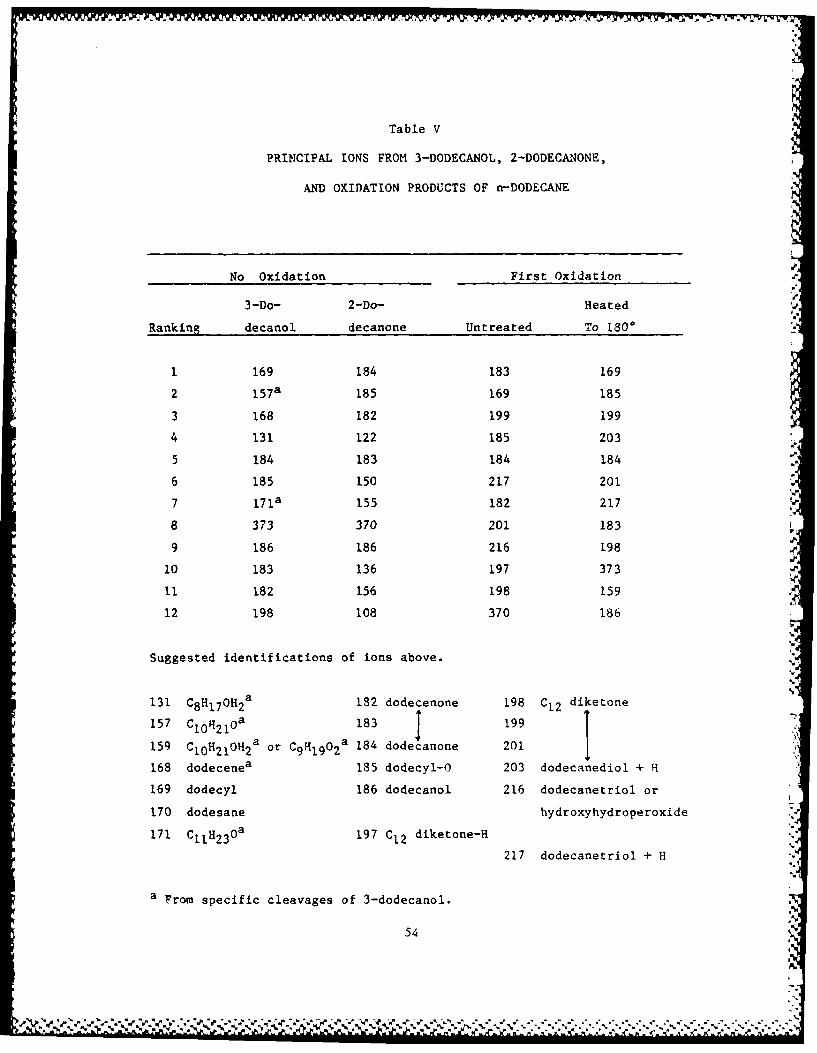
oxides are decomposed during FIMS. Thus, the DOD oxidation products
(Table V) show no ions from the hydroperoxide and only a few from the
alcohol. Unoxidized 3-dodecanol shows little parent ion; 2-docanone is
also cleaved during FIMS. Instead, the hydroperoxide and alcohol
decomposition products predominate: dodecene, dodecyl, dodecyloxy.
However heating the oxidation product to 180*C in the absence of air
showed that it still contained labile products such as hydroperoxides.
The hydroperoxides from the phenylhexanes and tetralin are more stable
(Table VI) but the FIMS show more of the ion corresponding to loss of
-02 Kfrom the hydroperoxide. 2-Ethylnaphthalene shows no significant
amounts of hydroperoxide but many products corresponding to a reaction
in the FIMS:
R
C10 H7 - C - Me C 1oH -OH + Me-CHOH10
This reaction resembles to the liquid-phase, acid-catalyzed rearrange-
ment of cumyl hydroperoxide to phenol and acetone.
We now consider the polymeric oxidation products. The products
from dodecane (Table VII) still show many products corresponding to loss
of H or OR (odd mass numbers) but no firm indication of cleavage of the
dodecane skeleton. Some unsubstituted dimer and trimer were detected,
but most of the dimers contain oxygen, up to five atoms per dimer,
apparently from the associated oxidation and coupling process. The
prominent dimers from the other hydrocarbons also contain oxygen (Table
12
Page 32
VI) but the unsubstituted dimer is prominent in the product from
phenylcyclohexane. Thus, coupling of hydrocarbons with benzyl hydrogen
atoms may be easier than with dodecane.
We know considerable about the structures of the polymeric
products; they contain an integral number of hydrocarbon units (minus
two hydrogen atoms per coupling) and several oxygen atoms. What we
don't know is the distribution of oxygen atoms among peroxide, ether,
alcohol, and carbonyl groups.
4. RATES OF OXIDATION
4.1. Preliminary Study
In our first oxidations, we measured rates of oxygen absorption by
several fuels at 1300 and observed the points where formation of a
precipitate, on the vessel walls or in suspension, was first seen, as
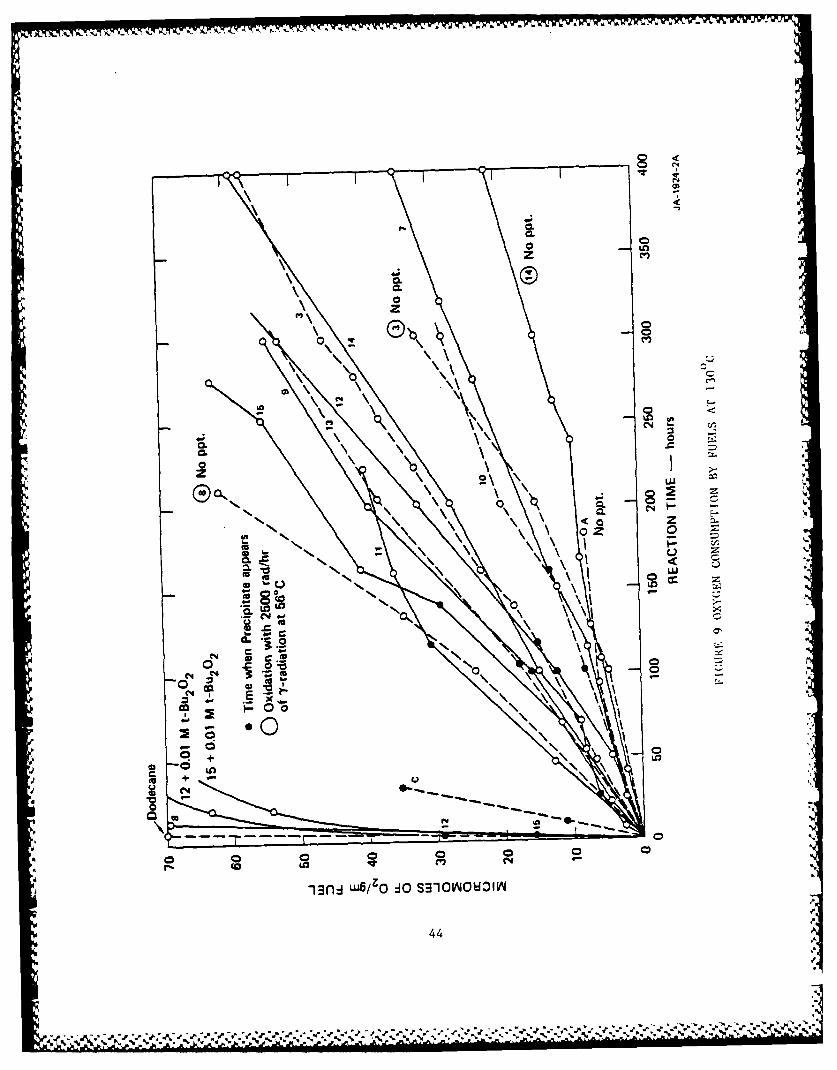
noted by solid points. The results are shown in Figure 9.
Figure 9 shows a wide range of rates of oxidation. Deposits
appeared in most fuels at about 100 to 150 hours, but over a consider-
able range of oxygen absorptions. Fuel 8 and dodecane, which oxidized
the fastest, gave no deposits. The slow oxidizing jet turbine Fuel A
also gave no deposits. Addition of 0.01 M t-Bu 202 to fuels 12 and 15
greatly accelerated rates of oxygen absorption but had no large effect
on the amount of oxygen consumed at the point where deposits appeared.
Fuel C, the least stable fuel, oxidized fairly rapidly and had absorbed --
the least oxygen when deposits appeared. Thus, there is no obvious
correlation between rate or amount of oxygen absorption and sediment
formation.
13
% %P, '-,k. L
Page 33
Curves with fuel numbers in circles were oxidized at 56°C with 2500
rad/hr of y-radiation. The radiation made the oxygen absorption at 560
about half as fast as at 130, but no deposits appeared in any of the
radiated runs, even though Fuels 3 and 14 had absorbed more than enough
oxygen to give a preciptate at 130*C. Apparently, at 56*C the gum
molecules did not become large enough to precipitate.
CRC Report No. 509 (p. 75, 1979) concluded that deposits separate
mostly because of the incorporation of heteroatoms into the oxidation
products rather than from increases in molecular weight. We propose
that precipitate formation also depends on the aromaticity and solvent
properties of fuel, and that gum formation, which usually far outruns
precipitate formation (see, e.g., Stavinoha, Brinkman, 1980), and
precipitate formation together would be a better guide to the formation
of hard deposits on hot engine parts.
4.2. Rates of Oxidation and Gum Formation in Air at 130 0 C
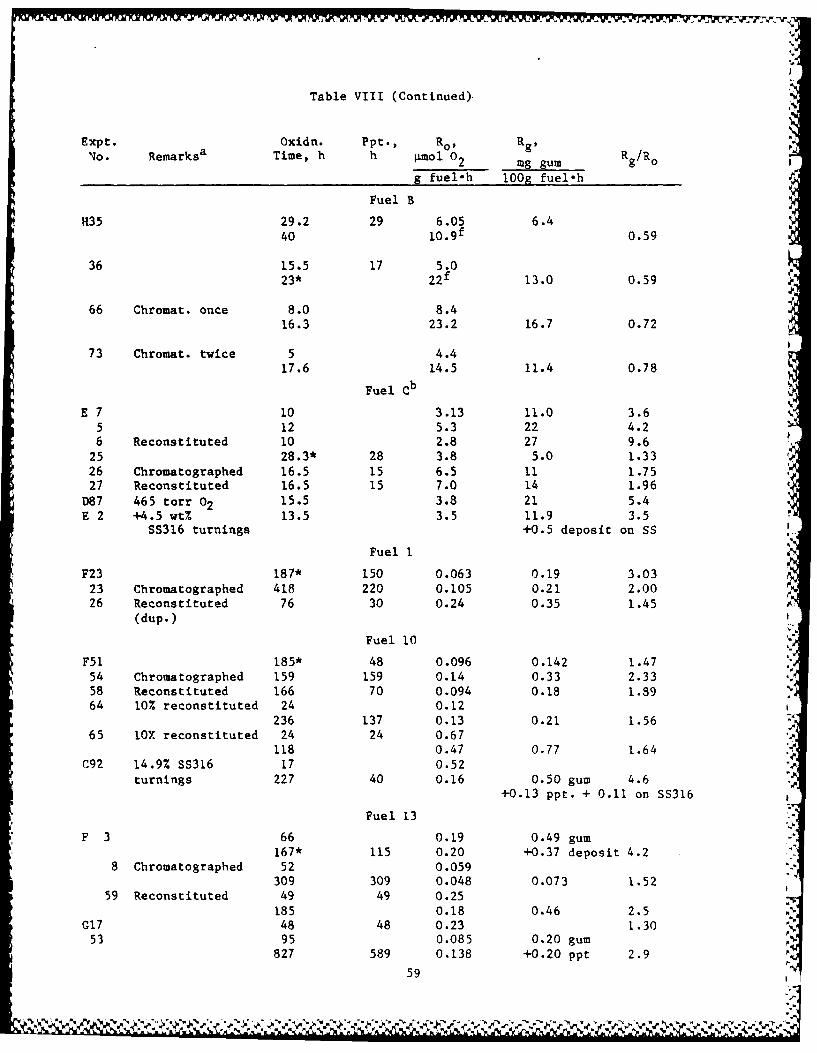
Table VIII contains most of the data on which this paper is based,
usually the better experiments, and abbreviations for the fuels used.
The experiments are numbered in nearly the order in which they were
done. "Dup." on some runs indicates that substantially the same results
were obtained in another experiment. Although additional data points
were measured for most runs, usually only the first and last are given
in Table VIII to provide a measure of autocatalysis or self-
retardation. In most runs, gum was determined only on the final
oxidation product; the rates of oxygen absorption (Ro) and gum formation
(Rg) are average values since zero times.
14
% %-
%- %0 %d~.f~ .~ '~
Page 34
Yields of hydroperoxides on the oxygen absorbed are given in
footnotes c to f, The yields appears to be highest with the fastest
oxidizing fuels but solvent effects apparently affect the stabilities of
the peroxides.
About half the oxidations were autocatalytic, but those of EtN and
Fuels A, 14A, and 15 were autoretarding. IND, NMP, 1-PH, and Fuels C,
1, 10, and 14B showed no clear trend. Fuel B oxidized rapidly after a
long induction period and apparently contained a retarder. The first
oxidation of DOD (B59) was the slowest. The last two runs shown, G69
and K80 (where the DOD was washed with concentrated H2 SO4 ) agree well.
The oxygen supply for the EtN run, J44, was nearly depleted in one hour;
the X86 runs, where fresh air was supplied after 30 minutes, are
faster. Without further addition of oxygen, the indicated Ro during the
second hour is 20. The decrease is probably real, because 35% of the
oxygen in the last charge remained.
Chromatography over acidic alumina caused faster oxidation of BCH,
the old and slower oxidizing EtN, and Fuels C, 1, 10, and 15, but slowed
the oxidation of Fuel 14. Usually, the reconstituted fuels, where the
original proportions of the ether extracts of the alumina were put back
into the hexane extracts, oxidized at the original rate. In oxidations
of Fuel 1, the original distilled fuel oxidized slowest the
reconstituted, fastest. These data suggest that alumina may remove
either a retarder or an accelerator, or both, and that the latter is
eluted by ether while the former is not recovered. However, these
effects are not well beyond experimental error.
15 -
% %.
e',,
Page 35
Figure 10 shows a clear pattern with Fuel 10 where experiments with
distilled, (lower set of solid points), chromatographed, (upper set of
solid points), and reconstituted (middle set of unfilled points) fuel
were run in triplicate. The intermediate runs in each set are listed in
Table VIII as F51, F54, and F58. The chromatographed fuel oxidized
fastest, at least initially, but the distilled and reconstituted fuels
are almost indistinguishable. Figure 10 shows the consistency of our
data on Ro and Rg and their close relation; gum formation in all runs
increases regularly with the oxygen absorbed. Precipitate formation is
delayed in oxidation of the chromatographed material, which gives only
an average amount of total gum. 0.25% of the original Fuel 10 was
eluted from the alumina by ether. Figure 11 shows the effects of
returning one-tenth (F64) and ten times (F65) this much of polar
fraction to the fuel eluted by hexane. P64 shows no significant effect
on R but precipitate formation is delayed. F65 shows a marked increase
in Ro and earlier formation of precipitate. Comparison of results in
Figures 10 and 11 suggests that the polar fraction from Fuel 10 contains
both a retarder and an accelerator, but an effect of the latter appears
only with a large proportion of polar fraction. .4
In general, Table VIII shows that none of the pure hydrocarbons
give insoluble precipitates during oxidation but all the fuels do. The
single exception is Experiment H34, with 11.8 mole % TET in DOD. During
this experiment, 630 mg of oily precipitate and 1543 mg of white
crystals per 100 g hydrocarbon separated during the oxidation. Analyses
are in Table II. They suggest that the crystals correspond to impure
tetralin hydroperoxide, melting at 43-450C (literature, 560). Analysis
of the oil corresponded closely to a dihydroperoxide of tetralin. The
16
V V% % y
Page 36
]I
yields of gum in the homogeneous solution were unexpectedly low,
probably because much of the soluble gum dissolved in the precipitates.
It appears that even the monomeric oxidation products of TET are
insoluble in DOD.
Figure 10 shows that our measurements of Ro and Rg are reliable and
consistent but that some unknown variable causes small differences in Ro
and parallel differences in R among supposedly identical runs. The
differences might be associated with the Pyrex reactor walls. At first,
the reaction flasks were rinsed with reagent acetone; later they were
treated with boiling nitric acid and rinsed; recently they have been
rinsed with reagent acetone and then heated in a glass annealing oven,I
after which they glisten like new.
5. CORRELATION OF RATES OF OXIDATION AND GUM FORMATION
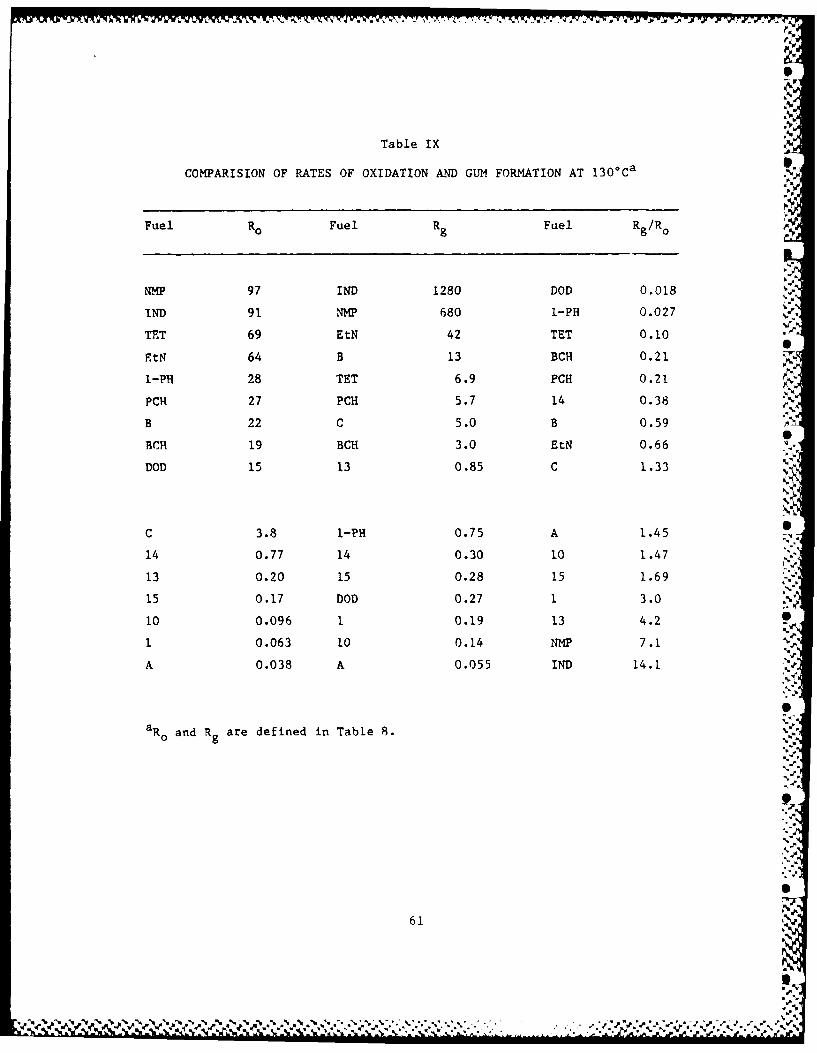
Table IX summarizes and ranks rates of oxidation and gum formation
from Table VIII, using the data marked (*) in that table, which are
usually from the longer runs. These average values neglect 5
autocatalysis and autoretardation. However, the range of results in
each column of data is so great that changing rates are not critical to
the rankings. The data in the Ro and R columns are listed in order of
decreasing magnitude but the ratios of R /R are listed in order of
increasing magnitude, to correspond better to the order for Ro . The
orders for substrates are somewhat different in each column and so the
ft
17
Peit
Page 37
fuel abbreviations are listed with each column of figures. NMP and IND
absor!) oxygen fastest. At least IND, (Russell, 1956) and probably NMP,
absorb oxygen below 100*C to give nearly 100% yield of a nonvolatile,
alternating polyperoxide. Although this peroxide as such does not
survive our gum test, the residual gum and the yields of gum for the
oxygen absorbed are higher than for any other substrate that we have
tested (last column). These conjugated unsaturated compounds are not
acceptable in fuels and they are neglected in the following discussion.
Among the other hydrocarbons and fuels, the rates of oxidation vary
over a range of 1800. The pure hydrocarbons oxidize faster than the
fuels, with a range in rates of 4.6. There is a larger spread of 580
between Fuels B and A. The upper part of the Ro column lists all the
hydrocarbons and only one fuel, B. Table 8 shows that B would have a
much lower Ro at a shorter reaction time.
Rates of gum formation for EtN and Fuel A vary by a factor of
nearly 800. To a first approximation, the order in the R columng
resembles that in the Ro column, but there is more overlap among the
hydrocarbons and fuels. The discrepancies between Ro and Rg are partly.9
resolved in the last R /Ro column where the largest numbers correspondg o]
to the formation of the most gum for the oxygen absorbed. Because of
parallels between Ro and Rg, the spread in the Rg /Ro ratios is smaller,
about 230 between DOD and Fuel 13. Except for EtN, all the hydrocarbons
produce less gum for the oxygen absorbed than all the fuels. C..V
The instabilities of Fuels A to C increase with their
alkylnaphthalene contents. All the diesel fuels are unstable as
measured by their R/R o ratios (Section 3.4) and contain substantial
18
S
%V
Page 38
proportions of naphthalenes and more condensed aromatic hydrocarbons.
Thus, the alkylated condensed aromatic hydrocarbons (not alkylbenzenes)
present in all the fuels appear to be the an important cause of gum
formation.
6. COOXIDATIONS OF FUELS AND ADDITIVES
6.1. Previous Work
In discussing our work on oxidations of mixtures, we shall present
first a summary of previous work, starting with the classic cooxidation
of cumene and tetralin by Russell (1955). These oxidations were done in
the presence of 0.02 M t-butyl perbenzoate to give a constant rate of
initiation at 90*C. The pure TET oxdized three times as fast as pure
cumene, but there is a minimum rate at 2.8% TET. The important point is
that addition of a fast-oxidizing hydrocarbon to a slow-oxidizing
hydrocarbon may either retard or accelerate the oxidation of the slow
hydrocarbon, depending on how much of the fast hydrocarbon is present.
The explanation by Russell (1955) still holds. A sharp minimum in rate
of cooxidation requires that one component have a high propagationN
constant and the other have a low termination constant, which is
characteristic of t-alkylperoxy radicals. Plots of rates of
cooxidations of most hydrocarbon mixtures are linear or slightly curving
functions between the rates of oxidation of the pure hydrocarbons, often
concave upward (Alagy et al., 1961; Mayo et al., 1968). We know of no
mixture that oxidizes faster than either component.
19
A *"- A'
Page 39
6.2. Dodecane and Indene
We shall use these relations first to account qualitatively for our i
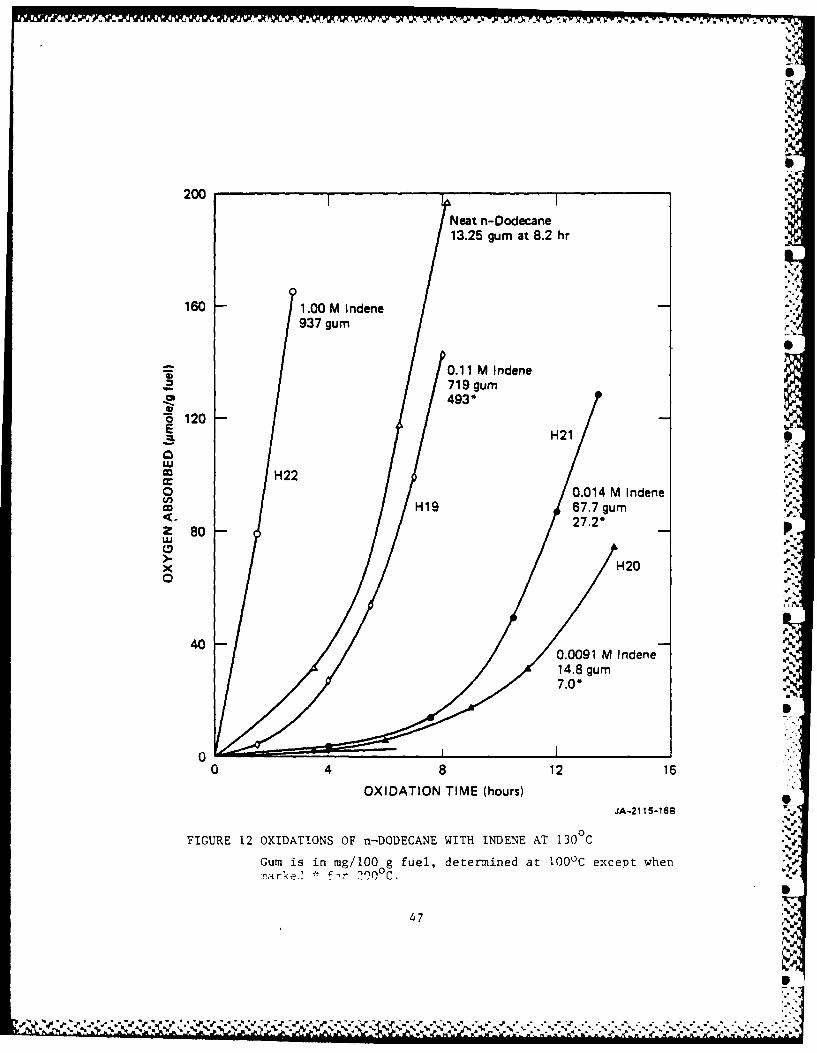
results on the oxidations of DOD with small proportions of IND.
As shown in Figure 12 IND alone oxidizes faster than DOD, and has larger
propagation and termination constants than DOD (Howard, 1972). In,' " ''
cooxidations with 0.009 M IND, IND retards the oxidation of DOD, but '
then the rate increases with increasing concentrations of IND and acts /
increasingly like oxidations of IND) in an inert solvent.
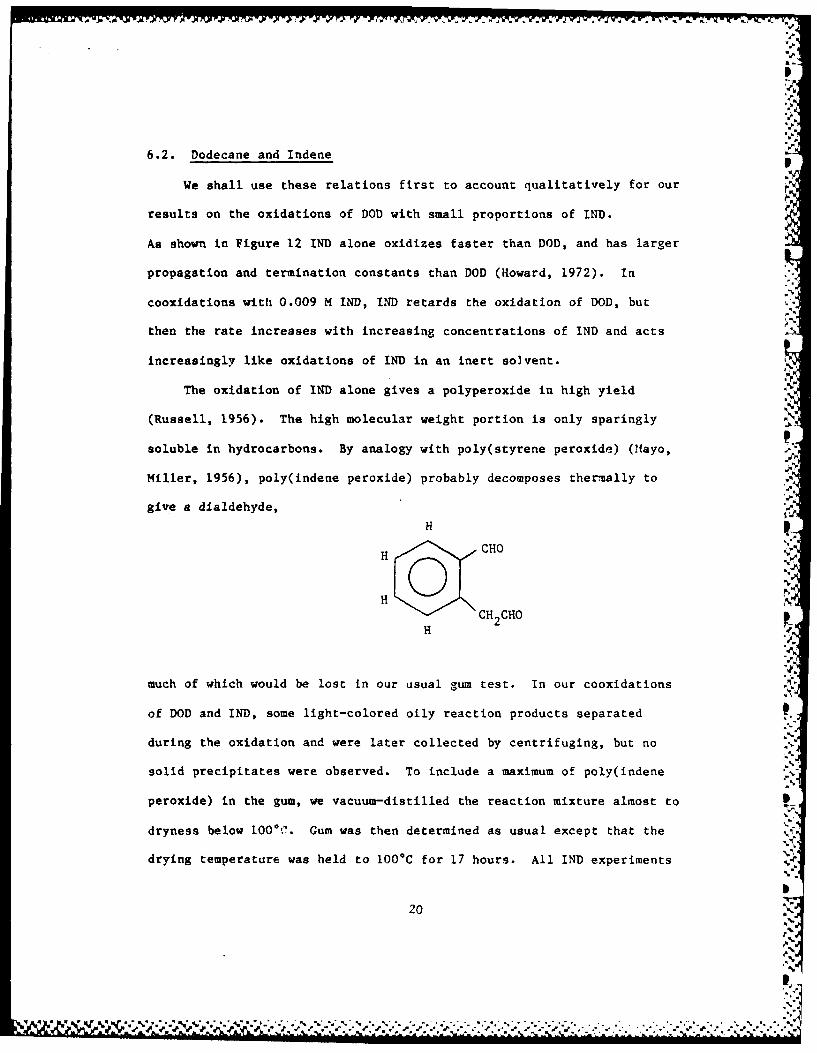
The oxidation of IND alone gives a polyperoxide in high yield
(Russell, 1956). The high molecular weight portion is only sparingly
soluble in hydrocarbons. By analogy with poly(styrene peroxide) (Mayo, ,
Miller, 1956), poly(indene peroxide) probably decomposes thermally to
give a dtaldehyde,
H
CH CHO !
much of which would be lost in our usual tum test. In our cooxidations
of DOD and IND, some light-colored oily reaction products separated
during the oxidation and were later collected by centrifuging, but no
solid precipitates were observed. To include a maximum of poly(ndene
peroxide) in the ree w vacuum-distilled the reaction mixture almost to
dryness below 100 . Gum was then determined as usual except that the
drying temperature was held to 0 C for 17 hours. All IND experiments
20
Page 40
gave more gum than oxidized DOD, even though more oxygen was absorbed in
the DOD experiments. Gum formation increases rapidly with the
concentration of IND up to 0.1 M indene, where gum formation was >50 %
times that in with DOD.
Some gum determinations were made at 200C instead of at 1000 C;
these results are also shown in Figure 12. The data suggest that the
2000 C procedure finds only about half as much gum as the 100C procedure %
for low amounts of gum, but that the difference decreases as the gum
increases.
6.3. Other Dodecane/Hydrocarbon Mixtures,5
,S
Cooxidations at 130C of pure DOD and of -10% of three pure
hydrocarbons with DOD are described in Table VIII and Figure 13. The
019 and G23 I-PH experiments show that the 10% solution in DOD gave a
lower rate of gum formation and required more oxygen to give a mg of gum
than either pure hydrocarbon. This I-PH had not been chromatographed
and the result was so unexpected that the I-PH was chromatographed and
the oxidation (C52) and cooxidation (G66) were repeated, with very good -
checks. These experiments indicate that -10% of 1-PH in DOD reduces
somewhat the rates of gum formation and oxygen absorption by DOD alone.
The oxidation of our first lot of EtN (G35) was so slow and gave so
much gum that it was checked and confirmed. Cooxidation showed that 10%
of this hydrocarbon reduces the rate of oxidation of DOD but reduces
more the rate of gum formation so that R /R o decreases many fold (Figure
14). This unexpected result requires confirmation with the faster
211
I-.
1 ],[ ,u ,dQ_, - m.' , ,' u- .- . . . - .. o o- - - .- -€ €. - -.- . - - - o. . .. -- . .'. .- ..'r.
Page 41
I-
oxidizing EtN. In the FIMS for this product, all the identified
oxidation peaks were associated with EtN.
A mixture of DOD containing 12% mole TET (134 in Table IV) oxidized
at a rate about half way between the rates for DOD (K80) and TET
(K81). Neither hydrocarbon alone gave any precipitate during oxidation
but both oil and crystals separated from the mixture. The mixture
produced much less soluble gum than either pure hydrocarbon, probably
because the soluble gum is more soluble in the oily precipitate than in
DOD. However, this low yield of gum is more than offset by the
precipitation of 630 mg of oily precipitate and 1543 mg of white
crystals per 100 g Fuel D. The analyzed crystals contained 73.19% C,
7.27% H, and no nitrogen, very close to tetralin hydroperoxide
(CIOH 1202 ). Tb"," melted at 43-45*C (literature 56*C) and contained by %
titration only 28% of the calculated peroxide if the sample were 100%
hydroperoxide. The analyzed oil showed 65.52% C, 6.33% H, and no
nitrogen, very close to what would he expected for a dihydroperoxide of
TET. The oil contained by titration 24.5% of the hydroperoxide in this
formula. The TET hydroperoxides are apparently soluble in TET but not
in DOD.
6.4. Mixtures of Dodecane with Nitrogen Compounds or Formic Acid
Figure 14 shows that there is no significant effect of 0.2 M
pyridine, t-butylamine, or formic acid on the rate of oxidation of
DOD. These compounds are apparently inert in oxidation. However,
0.0176 M NMP strongly retards the oxidation of DOD, but only
initially. With 0.17 M NMP, the retardation is prolonged. NMP alone
22
N '.
Page 42
oxidizes rapidly and so it must be incorporated in the products. FIMS
of the oxidation products of DOD, with the nitrogen-containing addi-
tives, show that dodecenones and dodecenones + 11 are the principal C12
products. The principal C24 products are the dimer + 2 0 and dimer + 2
0 + 1I, except with NMP where a different, unidentified group of products
is obtained.
6.5. Phenylcyclohexane and N Compounds
Distilled PCH was chromatographed through acidic alumina and
oxidized at 130*C. In Expt. F15, with three intermediate points not
shown in Table VIII, the rate of oxygen absorption by PCH was remarkably
constant over the whole II hours of reaction. 0.12 M t-BuNH2 in C73
retarded slightly the initial oxidation, but at 4 hours as much oxygen
has been absorbed as without t-BuNH2 . The Rg/Ro ratio is about twice
that without t-BuNH 2 but steady while the rate is increasing.
Table VIII shows that 0.14 M &MP retards oxygen absorption by PCH,
especially at the beginning, but increases gum formation to produce
cloudiness. The initial N14P corresponds to 1232 mg/l00 g PCH but no
more than 14% of the W4MP appears as gum.
6.6. Fuel A + NRP
The experiment with Fuel A in Table VIII shows that its oxidation
is slow and becomes slower with time. Addition of 0.2 M NMP results in
increasingly faster oxidation and early formation of a precipitate.
Again, the gum formed is considerably less than the NMP added.
23 1
.dE--' N~' . ~#%
Page 43
Elemental analyses of Fuel A, NW gum (not deposits) from Expt.
D94, and NMP alone indicate that the gum consists of 36% NMI, 44% of an
Aromatic portion of Fuel A, and 20% oxyen:
%0,
%C %H %N %S diff. H/C
Fuel A 86.37 13.27 <0.02 <0.02 0.32 1.83
Gum from oxidn. 68.04 5.90 6.17 - 0 19.9 1.03of A + NMP
NMP, calculated 74.30 7.06 17.27 0 0 1.40
Gum without NMP, 64.54 5.26 0 - 0 30.2 0.97calculated
The gum contain 2.8 0 atoms/NMP. These data are further evidence for
our generalization that the additives or impurities that most affect
oxidation and gum formation are most reactive and are consumed rapidly.
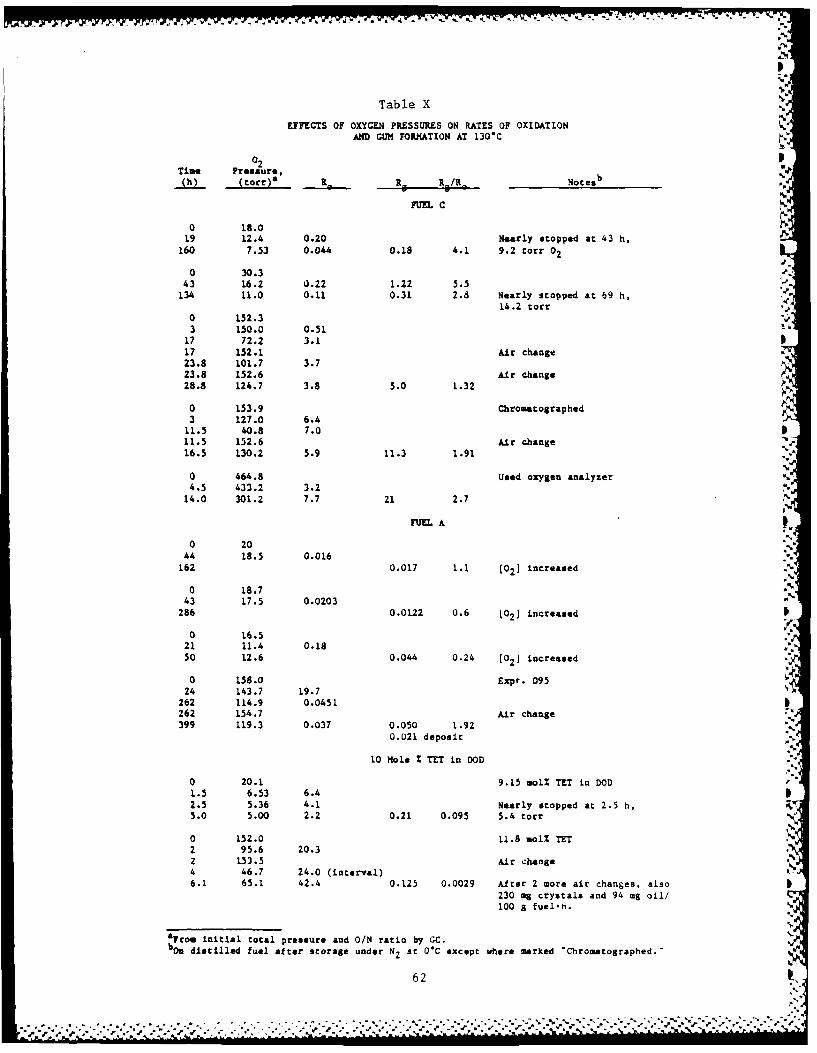
7. OXIDATIONS AT LOW OXYGEN PRESSURES
These experiments used blends of air, nitrogen, and oxygen at a
total pressure of one atmosphere, measured at 23-25*C. Changes in 0/
ratio were measured by our usual GC method except for the last Fuel C
experiment starting with 465 torr of oxygen. Here, the decrease in
total pressure corresponded closely to the consumption of oxygen and so
this experiment deserves inclusion in Table X.
Table X summarizes valid experiments with Fuels C and A, and DOD
containing -10 mole % TET, at initial partial pressures of oxygen of 16
to 465 torr in oxidations at 130*C without added initiator. The data
24
A%
Page 44
are calculated on a consistent basis from the initial atmospheric
pressures and the experimental O/N ratios from GC. Each set of data
usually represents one oxidation and shows how the oxygen concentration
changed with time.
7.1. Fuel C
Fuel C absorbs oxygen faster than any other fuel that we have -
tested, but not faster than most pure hydrocarbons; it also produces gum
faster than any other fuel except Fuel B after its induction period.
The results of the first two experiments agree fairly well. They
show that Ro decreases with decreasing oxygen pressure and approaches
zero at 9 to 14 torr of oxygen. The longest experiments have the lowest
R. values, at least partly because these long times include periods of
little reaction. The next two experiments establish a higher Ro in air
and maintenance or increase of Ro when oxygen pressure is maintained.
The last experiment with Fuel C and 60% oxygen in nitrogen shows no
further significant difference except marked autocatalysis. The
important conclusion is that Rg/Ro changes by a factor of less than two
between oxygen pressures of 18 and 465 torr. Thus, oxygen concentration
affects gum formation mostly through its effect on R.; there is no
evidence of a direct effect of oxygen concentration on gum formation.
However, at about 10 torr of oxygen, both reactions become very slow.
7.2. Fuel A
Fuel A is one of our slowest oxidizers and gum formers, and in any
experiment R. and presumably R8 decrease steadily from the beginning of
25
A AL* J1.%A.A ,... .. W w
Page 45
the oxidation, as shown in the last two Fuel A experiments in Table X.
This Table summarizes three experiments at initial oxygen pressures of
16 to 20 torr. All showed similar initial R0 values, but then a slow
increase in oxygen pressure. Because a similar increase occurred in a
reactor with no fuel, the increase must be due to leakage of air into
the reaction vessel, probably on cooling of the flask that had been
previously heated at more than atmospheric pressure. In all three
experiments, the total average Rg values are divided by earlier Ro
values and all the ratios are lower than in the 158 torr experiment. P
Apparently the Rg values are small because both Ro and R decreased with
time; thus, ratios based on early Ro values are too high. However, in0p
the first two Fuel A experiments the ratios are only about twice those
found at high pressure. Therefore, there is no evidence for a
significant effect of oxygen pressure'on the mechanism or efficiency of
gum formation at 19-158 torr.
Our difficulties with low oxygen pressure runs with Fuel A arise
because the oxidation is normally so slow and because it becomes slower
with time and lower oxygen pressures. Slight leakage then becomes 0
important. We therefore carried out the third oxidation of Fuel A by
determining O/N ratios at 0, 21 and 50 h in separate but very similar
runs, all using previously unpunctured septa for removing gas samples.
In all three runs, air-filled reaction vessels were evacuated to 80
torr, then nitrogen was admitted to 760 torr, all at 24°C.
The Ro results are inconsistent; only 72% as much oxygen was P
absorbed per gram of fuel in 50 h as in 21 h, which we attribute to poor
reproducibility in 130C oxidations. However, the R /Ro values agree
26
Page 46
fairly well with each other and with other data for Fuel A. Low
pressure oxidations with t-Bu 202 at 1000 are expected to improve
reproducibility.
7.3. 10 Mole % of TET in DOD
Two experiments with TET/DOD mixtures are listed in Table X. In
air, the reactions are fast and autocatalytic. With an initial 20 torr
of oxygen, the reaction starts at about the same rate, but this rate
decreases steadily until it approaches zero at 5 torr of oxygen.
8. SUMMARY AND CONCLUSIONS
Most previous work on fuel stability has emphasized solid deposits,
but this work deals mostly with soluble gum. Gum is always formed
before deposits and usually in greater quantity. Section 3.1 provides p.
good evidence that deposits come from soluble gum, and we suspect that
hard deposits on hot engine parts arise mostly from gum in solution in %
the fuel. None of our pure hydrocarbons gave deposits at 1000 or 130 0C
and none of our fuels gave deposits in y-initiated oxidations at 56*C
(Figure 9).
Both our own and previous work (Taylor, 1974, and many others) show
that oxidation is essential for the formation of gum and deposits,
except at pyrolysis temperatures. In the present work, there is a close
relation between the rates of oxygen absorption and gum formation at
130*C (see Figure 10 and some examples in Table VIII where gum was
27
N
Page 47
determined at more than one conversion). The relation is even
insensitive to oxygen pressure (Table X) and both reactions stop when
the oxygen pressure is reduced to 10-15 torr.
Table IX shows that all of our pure hydrocarbons absorb oxygen at
130*C faster than all our fuels, except Fuel B. Most of the
hydrocarbons also form gum faster than most of the fuels, because they
absorb oxygen so much faster. However, most of the fuels give much more
gum for the oxygen absorbed (high Rg/Ro ratio) than most of the
hydrocarbons, which give the least gum for the oxygen absorbed,
especially DOD. As noted in Section 5, IND and UTMP are special cases.
The Rg/R0 values in Tables VIII and IX provide a basis for
explaining the gum and deposit problem. From the definitions of Rg and
and the 8% oxygen content of Fuel 14 gum, the percent of the oxygen
absorbed in the C28 oxidation that appears in the final gum - 2.5 Rg/Ro
1 I%. EtN and Fuels A, 10, 13, and 14B have R /R ratios up to 10 times
that of Fuel 14 (0.4), and if their gums have comparable oxygen
contents, then they contain up to i0% of the oxygen absorbed. Further,
the R s in Tables 8 and 9 are taken after a heating period in which up
to two-thirds of the evaporated residue has been lost. They therefore
represent minimum R /Ro ratios.
Our oxidation work in progress with t-Bu 202 as initiator at 100C
indicates that the number of molecules oxidized per t-BuO" radical is in
the hundreds with the most reactive hydrocarbons but not far from one
with the least reactive fuels. Thus, gum formation during oxidation
appears to be associated mostly with the chain termination reaction, not
with the chain propagation reaction.
28 28%
N
ak -v n7 ,- .v'Ii'- .N %*i, q - .S'2 a;. .. . a1 *,"," *p 'd "~.f*I 'S;Z .
Page 48
',9.
Our work with oxidations of mixtures shows how small proportions of
the more reactive component may either accelerate or retard oxidation of
the less reactive component, but only by being consumed itself. We have
seen no indication of any truly catalytic eff.zt of any organic compound
on the rates of oxidation or gum formation. We propose that the low
rates of oxidation of fuels illustrate the minimum rates of oxidation of
some mixtures according to Section 6.1 and the retarding effects of
alkylnaphthalenes and their oxidation products. p
The close relation between Ro and R for single fuels and a general
background in the oxidation of hydrocarbons suggests a new mechanism for
gum and deposit formation. The basic mechanism for converting monomeric
to polymeric fuel units is proposed to be part of the chain termination
mechanism. In most oxidation reactions, chain termination is
bimolecular and involves two radicals:
2RO2 + alcohol + ketone + 02 (i)
2RO + R 0 + 0 (2)2 2 2 2(2
RO 2 * + Re + R202 (3)
2R. + R (4)
Reaction I contributes nothing to the required condensation reactions
except to provide oxygen compounds that are more reactive in oxidation
than hydrocarbons. Reactions 3 and 4 are significant only at low oxygen
pressures where R and Rg approach zero (Section 7). Thus Reaction 2
has to be responsible for most of the coupling of monomer to dimer. The
peroxide formed is probably stable up to 80-100*C but not at higher
29
p,
" " "
Page 49
temperatures. When the dialkyl peroxide decomposes in solution, it just
reinitiates oxidation, but when it decomposes in a viscous medium during
severe heating in the gum analysis, most of the resulting radicals
Attack the surrounding molecules and do not escape, as shown by
experiments with indene polyperoxide (Section 6.1 and Russell 1956) and
styrene polyperoxide (Mayo, Miller, 1956). Thus the dialkyl peroxides
made at low temperature survive to participate in gum formation during
gum determinations but those made at high temperatures do not. The
proportions of Reactions I and 2 depend on temperature and the fuel,
permitting considerable latitude in the yields of gum on the oxygen
absorbed and suggesting an explanation for relating gum tests at various
temperatures.
However, by itself, Reaction 2 can only produce dimer. To make
higher molecular weight products, the chain propagation Reaction 5 must
be considered:
RO2 . + RH + RO2H + Re (5)2 2.
For growth of the dimer, some of the RH reacting with peroxy radicals
must be polymers produced in Reaction 2 and thus able to oxidize and
grow further. The high oxygen contents of gums show that oxidized
monomers and polymers are more reactive than hydrocarbons in Reaction 5
(Section 3.2). This scheme requires that R /Ro should increase with
conversion unless dimer contributes heavily to gum. It also neglects
the possibility that some polynuclear aromatic hydrocarbons have first
order termination reactions and are autoretarding.
30
p..
' ' ' ' " " " "0 " € ' o''' " ."," .".' '.. ," ., v " € ." " , ." - . " . ."¢ . € ." - . ." .'.
Page 50
An older mechanism for gum formation is condensation by radicals
from pyrolysis of hydroperoxides (Mayo et al., 1976):
R021 2R +' '2 + ROH + H20RO 2H o RO * + HO. 9 R R2 01
This mechanism is supported by the good yields of dimer obtained when
the hydroperoxide of EtN was heated with EtN or when EtN was heated with
t-Bu2 02, both at 1500 in the absence of oxygen. However, in the
presence of oxygen, this C-C coupling is superseded by the oxidative
coupling mechanism above.
Still another mechanism is aldol-type condensations and esterifica-
tions of oxidation products (Mayo et al., 1976). Again gum formation
should be proportional to the concentration of accumulated oxidation
products, not to the rat- of oxygen absorption. We have no evidence for
this mechanism at this writing.
A widely held view is that small proportions of reactive nitrogen-p
and sulfur-containing compounds are largely responsible for formation of
gum and deposits (CRC Report No. 509, p.53, and many others). This
explanation must apply to many fuels; when it does, the fuel stability
should be improved as the reactive components are consumed, and examples
have been reported (Bowden, Brinkman, 1980; Stavinoha, Brinkman,
1981). Some nitrogen and sulfur compounds increase deposit formation
and some do not (Frankenfeld et al., 1983). The considerable recent -
literature on deposits from 2,5-dimethylpyrrole in fuels shows mostly
that this compound is unusually reactive in oxidation and that its
oxidation product is unusually insoluble. However, the present paper
and also Malhotra et al. (1984) show that pure alkylnaphthalenes and
other polynuclear aromatic hydrocarbons are also important sources of N1-.
931
% N' V!
Page 51
gum and that some of the least stable fuels have the highest proportions
of these hydrocarbons (Section 2.1). Instability from this source will
not change much with aging time.
Chromatography of fuels over alumina usually has some effect on
rate of oxygen absorption, but not much on Ra/Ro. Chromatography
apparently removes some trace impurities that may accelerate or retard
oxidation, as noted previously. As long as they are trace impurities,
they cannot contribute much to gum formation except through their effect
on Ro.
Although oxidations at 130°C proceed at a convenient rate and are
fairly reproducible, their relations to reactions at ambient tempera-
tures are uncertain. Indications are that the relative stabilities of
various fuels do not change much with temperature. However, we are now
trying to bridge the gap in fuel oxidations between 430 and 130*C with
t-Bu202 -initiated oxidations at 1000 and in longer experiments at 60*C.
These experiments will be presented in future papers, which are directed
toward a simple and reliable test for fuel stability.
This section concludes with a discussion of the largest and most
diverse effort we know about on fuel stability, carried out by the
Bureau of Mines in Bartlesville with support from the Western Petroleum
Refiners Association (Smith et al., 1958). Results were published in
two volumes. Volume I surveys gum and deposit formation from 34
distillate fuels and 250 blends at 43.3°C for 39 weeks in vented
bottles, with and without added materials. The second volume, "Studies
Relating to Causes of Instability", was probably intended to solve the
gum and deposit problem for good, but io did not.
I
• 32
Page 52
A:P
This work resembles some of our own. In retrospect, some of the
Smith techniques were faulty, but there is no indication that the faults
were recognized, or even that any experiment was repeated. All the 'P
fuels should have been distilled before they were used, to minimize
differences in the previous histories and initial gum contents of the
fuels. Further, apparent uncertainties in gum determinations are
greater than the differences among stable fuels.
Oxygen absorption was usually measured for 48 hours at 65.6°C
(1500F). All the fuels were thoroughly degassed before use; oxygen
absorption was then rapid for 1 to 4 hours before the rates became
steady and slow. To compare fuels, these slow rates were extrapolated
to zero time, thus obscuring possible interesting differences among
initial rates of fuels. The I to 4 hours required to reach the steady
rate suggest rate differences during this period and that oxygen
dispersion was inadequate.
Nine fuels were chromatographed over silica and alumina. Most of
the resulting fuels oxidized faster, but one oxidized slower. The
recovered polar compounds contain more N, S, and 0, and less H/C than
the fuels. Two reconstituted fuels oxidized faster than the originals,
and six, slower. The effects of chromatography on gum formation are
erratic, often large. Thus, as measured by rate of oxidation, fuels are
permanently altered by chromatography.
Our own results with chrnmatographed fuels are consistent with
those of Smith et al., which we consider reasonable. However, our Rg/Ro
ratios are ususally nearly constant for a single fuel at a single
temperature. Thus, this fundamental ratio is largely unaffected by
33
Nt
S
Page 53
trace components in fuels while changes in rates of oxidation alone may
be confusing.
Smith et al. also resolved nine whole fuels into polar, saturate,
monocyclic, and polycyclic aromatic fractions and compared their rates
of oxidation and gum formation in 48 hours at 65.6 0 C. We conclude that
the fractionations were not meaningful. Oxygen absorption rates for
saturated fractions vary 60-fold, for monocyclic aromatic fractions by
about 400-fold. However, we endorese some of the conclusions of Smith
et al: oxygen absorptions by the saturated fractions were steady; by
the polycyclic aromatic fractions were initially fast but then decreased
steadily; by the monocyclic aromatic fractions were slowest and became
slower; polycyclic aromatic fractions gave the most gum for the oxygen
absorbed.
The results above and in our Table IX show that rates of oxidation
alone with unknown rates of initiation are a poor guide to an under-
standing of gum and deposit formation, but that simultaneous measure of
oxygen consumption and gum formation provides considerable insight. Our
next paper will show that such measurements at known rates of initiation
permits still further progress.
We now propose a basic conclusion about tests for fuel stability.
In the absence of a known initiator, rates of oxygen absorption and gum
formation in hydrocarbon fuels depend on peroxides already present or
generated by light, traces of metals, or the initial slow oxidation.
The result is an induction period until the rates become large enough to
measure. This induction period will be long and poorly reproducible
below 80C because it will depend on unmeasurable differences among
34 S
Ilk
%
Ia
S..
Page 54
supposedly identical samples. Above 120°C the induction period is so 0.
compressed that the less measurable differences among fuel samples
become unimportant and a fairly fairly reproducible rate is soon
attained. This argument implies that devising a test for use below 50,
maybe below 80, for fuel stability that can be reproduced in different
laboratories is impractical until the differences among induction
periods can be eliminated. One solution is to perform the test at a
known rate of initiation (by peroxide, azo compound, or radiation).
Another route is to provide just enough initiation or radiation to
eliminate most of the induction period and then measure fuel
stability. A tiird route is to count aging time from when the sample
gives a measurable rate of oxidation and/or gum formation after a
previous period of radiation at test temperature or thermal initiation
at a higher temperature. A fourth route is to measure the eventual %
steady rate of oxygen absorption at test temperature and give little
attention to the time elapsed before this rate is attained. Whether any
of these versions will be more useful than the present uninitiated tests
will have to be determined by experiment.
Acknowledgements
Our research on diesel fuels was supported by the U.S. Army
Research Office under Contracts No. DAAG29-80-C-0122 and DAAG29-84-(-
0161 and on jet turbine fuels by the Lewis Research Center of the
National Aeronautics and Space Administration under Contract NAS3-
22510. We are indebted to Drs. Eed Wong and David Bittker of NASA for
advice and consultation and to Dr. S. E. Buttrill, Jr., Mr. G. A. St. a
John, Dr. R. Malhotra, and Dr. Doris Tse for the FIMS data. 5
35
.5"
Page 55
Literature Cited
Alagy, J; Clement, G.; Balaceanu, J.-C. Bull. Soc. Chim. 196]1, 28, 1792.
Bowden J. N.; Brinkman, D. W. "Stability Characteristics of Some Shale .and Coal Liquids", 1960; Final Report to Department of Energy onContract No. EY-77-A-02-4162.
Buttrill, S. E., Jr.; Mayo, F. R.; Lan, B., St. John, G. A.; Dulin, D.NASA Contractor Report 165534, January 1982.
Cernansky, N. P.; Cohen, R. S. ; Reddy, K. T. Final Report on NASAGrant Award NAG3-183, June 1985.
CRC Report No. 509 Coordinating Researcl, Council, Atlanta, 1979.
CRC Report No. 509 p. 53.
CRC Report No. 509 p. 59, 76.
Frankenfeld, J. W.; Taylor, W. F.; Brinkmnan, D. W. Ind. Eng. Chem.Product R. & D. 1983; 22, p. 608, 615, 622.
Goetzinger, J. W.; Thompson, C. J.; Brinkman, D. W., "A Review ofStorage Stability Characteristics of Hydrocarbon Fuels", 1952-1982;Bartlesville Energy Technology Center, U.S. Department of Energy,1983.
Hazlett, R. N.; Hall, J. 14.; Matson, M4. rInd. Eng. Chem., Product R. & D.,1977, 16(2), 171.
Howard, J. A. Advances in Free Radical Chemistry, 1972, 4, p. 49.
?4alhotra, R.; Coggiola, J.; Young, S. E.; Tse, D.; Buttrill, S. E., Jr."Analysis of Middle Distillate Fuels by High Resolution FieldIonization Mass Spectrometry", Preprints, ACS Division of FuelChmcistry, 1985, 30 (1), 192.
Mayo, F. R.; Miller, A. A. J. Amer. Chem. Soc. 1956, 78, 1023.
Mayo, F. R.; Syz, M. C.; Mill T.; Castleman, J. K. Advances in ChemistrySeries, 1968, 75, 38.
Mayo, F. R.; Richardson, H.; Mayorga, G. D.; Preprints ACS Division ofPetroleum Chemistry, 1976, 20(l), 38.
Nixon, A. C. in "Autoxidation and Antioxidants", Vol. 2, edited by W.0. Lundberg, Interscience, New York, 1962.
36
A:~
Page 56
't
Russell, G. A. J. Amer. Chem. Soc. 1955, 77, 4583.
Russell, G. A. J. Amer. Chem. Soc. 1956, 78, 1035, 1041.
St. John, G. A.; Buttrill, S. E., Jr.; Anbar, M. A.C.S. SymposiumSeries, 1978, 7'.223.
Smith, H. M.; Ward, C. C.; Schwartz, F. G. and eight others; r"Distillate Fuel Storage Stability", Western Petroleum RefinersAssociation Tulsa, and U. S. Bureau of Mines, Bartlesville, 1958
Stavinoha, L. L.; Brinkman, D. W. "Accelerated Stability Test Techniquesfor Diesel Fuels", Report to U.S. Department of Energy under Contract *DE-AC19-79BC10043; 1980, p.38 ff.
Stavinoha, L. L.; Brinkman, D. W. "Optimization of Accelerated StabilityTest Techniques for Diesel Fuels", 1981, Final Report to U.S.Department of Energy on Contract No. DE-ACI9-79BC-10043.
Taylor, W. F. Ind. Eng. Chem. Product R & D 1974, 13(2), 133.
37
% %
Page 57
Figure 1 GC Polar Components of Fuels 10 and 13
Figure 2 Reaction Flask for Oxidations
Figure 3 Evaporation Bottle for Gum Determinations
Figure 4 Molecular Weight Profile of Distilled but Unoxidized Fuel C
Figure 5 F1 Mass Spectrum of the Deposit Precursors Isolated from
Vacuum-Distilled, Unoxidized Fuel C
Figure 6 Fl Mass Spectrum of the Deposit Precursors Formed in Fuel Cafter Oxidation for 4.25 Hours at 130C
Figure 7 F1 Mass Spectrum of the Deposit Precursors Formed in Fuel Cafter Oxidation for 7.17 Hours at 130°C
Figure 8 Fl Mass Spectrum of the Deposit Precursors Remaining in Fuel a,
C after Oxidation for 11.7 Hours at 130C
Figure 9 Oxygen Consumption by Fuels at 130*C e
Figure 10 Oxidation of Fuel 10 in Air at 130C
Figure 11 Oxidation of Reconstituted Fuel 10 at 130*C in Air with 0.1,1, and 10 Times Original Proportion Polar Compounds
Figure 12 Oxidations of n-Dodecane with Indene at 130*C Gum is inmg/IO0 g fuel, determined at 100C except when marked* for2000C
Figure 13 Cooxidations of n-Dodecane with 1-PH and EtN at 1300 C
Figure 14 Oxidations of n-Dodecane and Additives at 130C
38a
%
/.
'a
Page 58
C4~
Co 1N
Ln o
(nz Z N
Lo Co - CoC.,C4 v. C w
C,, ..C,4
C.) C~
C,' (NZz
C14L
oLOW
LC~q W%
39 rN~
Page 59
AJON
rr 316orV
JIP-320522-23A -
FIGURE 2 REACTION FLASK FOR OXIDATIONS
40-
Page 60
N. Inlet-~.
Top of FurnaceCapillary
Fuel
supportsJA-320522-24A
FIGURE 3 EVAPORATION BOTTLE FOR GUMDETERMINATIONS
41
Page 61
-.T 14l rlxlwA1k 'Mru~w17WtWLr' t'A
K
lop
10 15
W I-- Standard
1700 z 20 ppm of Decacylenez z
wj 142 t0
U. 12 . 118 U.
0168182 0
z ~ 198
cc 106 210210I I 224A
100 200 270 10203040500MASS (AMU) JA21 MASS (AMU) .JA-21 15-1
FIGURE 4 MOLECULAR W,EIG1RT PROFILE OF OLS- FIGURE 5 Fl MASS SPECTRUM OF THE DEPOSIT V
TILLED BUT UNOXIDIZED FUEL C PRECURSORS ISOLATED FROM VACULM- N
DISTILLED, UNOXIDIZED FUEL C N
10U'
z Deposit Dimers StandardLuPrrr 20 ppm
z Monomers
220Lu
u 20
..... ; ,1 ..... ...... . I T .. .. I, , ... .... ... ..., .
100 200 300 400 500 600 700 800
MASS (AMU).JA-2115-2A
FIGURE 6 Fl MASS SPECTRUM OF THE DEPOSIT PRECURSORS FORMED IN FUEL C AFTER
OXIDATION FOR 4.25 HOURS AT 1300 C
42 5
Page 62
2Lu
U)z Precursor Maoners Dimons Trimersw L
z
0l-
U
100 2020 40 0 60 70 0MAS(AU
4c d
tr.
MAS(MU A21S)
FIUE7FzASSETU FTH EOI RCROSFRE
z Procirsor Dimers TrirnI.- Monomersz
Lu
U.0
zLu Standardcc 20 ppm
u
100 200 300 400 500 600 700 8oo
MASS (AMU)%JA- 211 S-3A *
FIGURE 8 F1 MASS SPECTRUM OF THE DEPOSIT PRECURSORS RLMAININGIN FUEL C AFTER OXIDATION FOR 11.7 HOURS AT 130 C
43 i01
if...V
Page 63
C-
CL C1C%
CL z
CL.
CLC
00
00I
UP 000. I
+0L
+
La lw
13n~C. alz o-11O3I
N 44
Page 64
Gum in mrg/100 g fuel- 54.9125
A • 51.850 40.03
20a3 Precipitates
32.54.= 26.302
35.95 o 25.94A
-= 29.24 C15 Reconstituted
0 25.78
uw Chromatographed 5cDs, F58 o0 Distilled
0A
z iC I-I
x A 3 Precipitates0
5 F
F51
0 40 80 120 160 200
OXIDATION TIME (hours)JA-1924-16A
FPTURE 10 OXIDATION OF FUEL 10 IN AIR AT 130°C
45
Page 65
30 1 1
*1i F65
0 20Ept ppt.
o _10 Times the Proportion jPw U of Polar Compounts
w~ in Figure 5occF6
z 10
0 Runs in Figure 5.pipI.
0I0 40 80 120 160
OXIDATION TIME (hours)JA-1924-17A
FIGURE 11 OXIDATION OF RECONSTITUTED FUEL 10 AT 130 0 CIN AIR WITH 0.1, 1, ANT) 10 TIMES ORIGINALPROPORTION OF POLAR COMPOUNDS
46V
I
Page 66
200
Neat n-Dodecane13.25 gum at 8.2 hr
160 1.0MIndene "937 gum
0S
a0 11i M I ndene719 gum493.
5 120EH21
o 0.014 M IndeneH19 67.7 gum
27.2 po o
X H20o
0.0091 M Indene
14.8 gum7.0*
0 4 8 12 16OXIDATION TIME (hours)
JA-2115-168
FIGURE 12 OXIDATIONS OF n-DODEGANE WITH INDENE AT 130 0C
Gum is in. mg/100 g fuel, determined at 1001C except whennak * f ,r 2')00 C.%
47
il
K A -Z 2y
Page 67
I-HTo 289/ Lmole at 10 h, 6.68"
G52,
200 I To 232 / mole at 11 h, 1.48*
000 00 0 + 6.1 1 -PH (not chromatographed) G 19 '13.3* DOD + 9.4% 1-PH (chromatographed) G66
To 24389 mole at 10.25 h, 1.48
160 T 2.463 a
156.0 ° 6
E .179.1-PH
DOD120 DOD + 10% EtNTo Neat EtN
0
0o
ccV-
< G35z
°Mq gum/100 g fuel
- --
0
0 2D 40 60 80Et"
OXIDATION TIME (hours)
JA-2115s-288."
FIGURE 13 COOXIDATIONS OF n-DODECANE WITH I-PH AND EtN AT 13n° "o'
48
G3..5- "= 'I i ..
Page 68
200
Neat n-Dodecane
Neat NMPE23
0.23 M Formic Acid, C80416.5% Yield RO H
150
0.184 Mo ~t-BuNH 2 -... - 0.0175 M t-BuNH , C52
2 ~- 0.0225 M Pyridine, C42
I C52
0
LU
x0
50 0.226 M Pyridine, C53
00 2 4 a81 21
OXIDATION TIME - hoursJA-1924-SA
FIGURE 14 OXIDATIONS OF n-DODECANE AND ADDITIVES AT 130 C
49
Page 69
i !.
Table I
DISTILLATION RANGES OF FUELS
Boiling Point (0 C)Fuel Pressure (torr) Initial Final Description
A 5 48 90 Stable jet turbine fuel %%11
B 4 45 90 Intermediate stability
Ca 5 3J 110 Very unstable 0
1 6 55 95 50/50 mixture of No. 2diesel truck and tankfuels
i0a 6 55 109 Gulf Oil Company diesel •
13a 6 55 110 Chevron straight run %J1
Northslope diesel
14 15 53 250 50/50 Mixture of No. 2diesel fuels from -
14A 15 53 200 Anniston Army Depot.14B was 6% of 14. e
14B 14 200 234
15 12 55 145 No. 2 diesel from MarineFuel Storage Program .J.
aRedistilled to reduce color.
p..-'1
1 %1
50
Page 70
Table II
ELEMENTAL ANALYSES OF FUELS AND FRACTIONS
Sample %C %H %N %S %0a H/C
Crystals from DOD/TET 73.2 7.3 0 19.5 1.18Oil 65.5 6.3 0 28.2 1.15
Fuel A 86.4 13.3 <0.02 <0.03 < 0.36 1.83
Fuel B 86.5 12.9 0.65 --0 1..78Fuel C 87.6 11.9 <0.02 0.03 0.17 1.62
Distln. residue, 85.5 8.2 1.37 4.9 1.12unoxidized
Polar concentrate 74.9 6.0 0.20 18.9 0.98
Fuel 1 85.9 13.7 0 0.4 1.89
Fuel 4, pyridine-sol. 73.2 4.9 0.35 21.5 0.80wall deposit, 1127 h
Fuel 10 85.7 13.15 0.73 0.40 1.83
Polar fraction 86.6 8.6 0.94 2.01 1.98 1.18
Gum, 185 h 72.8 5.90 1.01 20.3 0.97
Wall deposit, 185 h 66.9 4.78 0.98 27.4 0.85
Fuel 13 84.6 12.8 0 2.7 1.80
Polar fraction 80.0 9.1 1.14 9.0 0.85 1.35
Gum, 368 h 72.1 6.1 0.99 20.8 1.01 1
Wall deposit, 368 h 71.5 5.1 0.86 22.6 0.84
AcMe-insol. deposit 73.0 5.1 0.86 21.0 0.84
Fuel 14 87.0 13.0 0 -0 1.77
Distillation residue 87.1 11.8 0.09 1.06 1.61
Fuel 14A 85.9 11.9 0.43 1.7 1.66
Final sol. gum L4A 84.1 6.3 0 9.6 0.89
Fuel 14B 87.1 11.4 0 0.9 1.56
Fuel 15 86.9 13.1 0 -O 1.80
ao and 0 + S by difference
51 .
p.
Page 71
Table TII
Compositions of Fuels in Mole % by FIMS
Fuel z-Number
+2 0 -2 -4 -6 -8 -10 -12 -14 -16 -18
Aa 26 38 25 1.1
Ba 27 24 15 26 8
Ca 6 4 3 16 15 55 1
1 18 15 12 1 13 14 3 18 4 1 1
10 13 10 10 4 19 16 3 24 1
14A 13 11 9 1 16 18 3 24 4 1 0.4
14B 7 3 2 4 5 5 5 7 13 13 23 b
15 14 13 9 19 17 1 22 2 2 1
aproportbons of major components only.I
bAlso 6% of Z - -20 and 8% of either z = -26 (C1 7H8 , C1 8HIO, and C 19H12 ) 0
or some dibenzothiophenes with 2-4 C in alkyl substituents. The latterseem more probable.
d.
52%
% v V
Page 72
Table IV
RESULTS OF THE OXIDATION OF VACUUM-DISTILLED FUEL C p
Time at 130*C (h) 0 4.25 7.17 11.7
02 consumed (imol/g) 0 5.46 10.9 26.9
Lmol/g * ha 0 1.28 1.87 3.52
Deposit Precursor Properties
Concentration (ppm)b 74 132 2540 2600 S
Number av. mol. wt., Mn 435 388 355 318
Weight av. mol. wt., Mw 496 440 419 381
aDuring preceding interval
bBased on total materials found by FIMS
.1
ke e531
Z-21 "I
Page 73
Table V
PRINCIPAL IONS FROM 3-DODECANOL, 2-DODECANONE,
AND OXIDATION PRODUCTS OF nr-DODECANE
No Oxidation First Oxidation
3-Do- 2-Do- Heated
Ranking decanol decanone Untreated To 1800
1 169 184 183 169
2 15 7a 185 169 185
3 168 182 199 199
4 131 122 185 203
5 184 183 184 184
6 185 150 217 201
7 171a 155 182 217
8 373 370 201 183
9 186 186 216 198
10 183 136 197 373
11 182 156 198 159
12 198 108 370 186
Suggested identifications of ions above.
131 C8H170H2 a182 dodecenone 198 C12 diketoneI
157 C "20a 183 11991159 CioH 2 10H2 aor C9TI19O2a14 odcne 20
168 dodecenea 185 dodecyl-O 203 dodecanI ediol + H
169 dodecyl 186 dodecanol 216 dodecanetriol or
170 dodesane hydroxyhydroperoxide
171 ClIH2 3 Oa 197 C1 2 diketone-H
217 dodecanetriol + HI
a From specific cleavages of 3-dodecanol.
54
F, A
Page 74
Table VI
FIMS FROM OXIDATIONS OF OTHER HYDROCARBONS AT 1300C
Hydrocarbon I-PH PCH(Expt. C50) TET EtN
Mol. wt. of parent RH 162 160 132 156Dimer, R2 322 318 262 310
Reaction time, h 2.0 5.5 2.0 4.0 4.5 29
02 absorbed, 49.3 135 36.6 119 356 139Ipmole /g
Rank of PeakIntensities
1 fl+ RH Rt Rt R+ ketone
2 RH ROR RH ROH RH+2 0 dimer + 0'- C2H4
3 ketone R+ RH+2 0 R11+2 0 ROH parent
ROll RH+2 0 ROll ketone RH-2H RH+O-C2H
5 RH+2 0 ketone ketone R2+20 prn H2O2
6 unsat. R-2 OR ketone OH ketone dimer + 0 RH + 0
ke tone
7 R2 ketone dimer dimer+ 2 0ketone -C2H6
8 R2 + 0 RO* dimer
9 OH ketone RH-3H dimer + 2 0
S.
55
Page 75
6
Table VII I
PRINCIPAL IONS FROM OXIDATION PRODUCTS OF N-DODECANEOF MASS NUMBER ;337
Ranking Untreated Heated
1 370 373 -.
2 385 385
3 399 399 -C
4 371 371
5 401 355
6 386 367
7 400 353
8 387 337
9 383 350 -
10 415 369
11 368 374
12 369 386
I
Suggested identifications of ions above, neglecting carbon loss.
337 Dimer - H 374 .4'.
3 38a Dimer C24 H50 383 Dimer triol -3 H
350 Dimer ketone - 2H 385 - R
353 Dimer + 0 - H 386 + H
355 Dimer + 0 + H 387
367 Dimer diketone + H 399 Dimer + 4 0 - 3 H
368 & 400
369 401 .
370 4 02 a Dimer + 4 0 -
371 Dimer diol + H 415 Dimer + 5 0 - 3 I t'
373 5 06a Trimer, C36H7 4
aNot enough for ranking.
56
"; ?Z ;::,' .:' .:--:2"-'-: . ?.:,.. . ,. .-. ;,: . - . '. -... ,...:...C ,- ,?C-CC-. -. :..- - , ?..-...-C ,: 4,.
Page 76
Table VIII
Oxidations of Hydrocarbons and Fuels in Air at 130"
Expt. Oxidn. Ppt., RRg, INo. Remarksa Time, h h MImol 02 mg gum Rg/Ro
g fuel-h IOg fueloh
n-Dodecane (DOD)
K80 H2S04 washed, 2.0 7.6c 1.16 0.152distilled 4.0 13.0 0.38 0.029
6.0* 14.7 c 0.27 0.018
Dodecane Mixtures (sec also IND, NP)
C42 0.0225 M pyridine 3.5 9.38.2 26
53 0.226 M pyridine 2.0 10.56.5 23
43 0.175 M t-BuNH2 3.5 178.2 36
52 0.184 M t-BuNH2 2.0 148.3 32 1.31 0.042
80 0.23 M HCO2H 2.0 5.68.0 25 0.77 0.030H34 11.8% TET in DOD 2.0 20
6.1 4 6b 0.185 0.0041G19 8.1% 1-PH 5.5 11.7
11.0 21 0.13 0.006266 9.4% chromat. 1-PH 3.0 7.7
10.3 23.7 0.14 0.006131 9.1% EtN 2.0 1.37
62.0 1.4968 9.9% chromat. EtN 3.0 0.29
46.5 3.6 0.010 0.00028
Tetralin (TET)
K81 Chromat., distId. 0.57 75d 6.4 0.0760.93* 69d 6.9 0.010
Bicyclohexyl (BCH)
C59 26 0.12
517 0.73 0.185 0.2674 22 0.20395 Chromatographed 83 1.8196 Chromat., then 1.0 1.49
distilled 9.0* 18.9 3.9 0.21
1-Phenylhexane (1-PH)
G70 1.5 0 .70 a
2.5 10 0.56 0.056G23 3.5 24
5.0 289.0" 28 0.75 0.027
52 Chromatographed 3.5 195.5 22
10 29 0.67 0.023
57
Page 77
Table VIII (Continued)
Expt. Oxidn. Ppt.R Ro t R,1No. Remarksa Time, h h 4mol 02 mg gum Rg/Ro
fuel'h IOg fueloh
Phenylcyclohexane (PCH)
F15 Chromatographed 2.25 2811.0* 27 5.7 0.21
C73 0.119 M t-BuNH2 2.0 20 9.6 0.484.0 4 29 15.2 0.53
F 9 0.139 M NMP 2.0 2.518.0 6.4 4.7 0.71
38 Chromatographed + 3.0 2.50.140 M N14P 29.0 29 8.5 6.2 0.72
10 0.224 M pyridine 2.0 287.0 31 6.2 0.20
16 Chromatographed + 2.5 220.211 M pyridine 10.0 28 7.8 0.29
2-Ethylnapthalene (EtN)
G3 2 0.92
62 0.33
35 Chromat. (dup.) 6 7.6
28 4.7 6.4 1.37
J44 Fractionally 0.94 89 68 0.76
K86 Distilled 0.5 6 5e 22 0.34 I1.0* 6 4e 42 0.66
2.0 4 2e 42 1.00
Indene (IND)
G44 Neat, 14.7 M 3.0* 91 1280 14.1H20 0.0091 M in DOD 14 5.3 0.50 0.094
21 0.0145 M in DOD 13.5 9.5 2.01 0.2119 0.108 M in DOD 8 18 62 3.45
22 1.00 M in DOD 2.75 60 340 5.6
N-Methylpyrrole (NMP) ..
E23 Neat, 11.3 I 2.25* 97 684 7.1C41 0.0176 M NMP 3.5 0.40
in DOD 50 5.791 0.169 H NUP 4 0.54
in DOD (dup.) 27 0.50 0.20 0.38
Fuel Ab
D70 21.0 0.092 ,i-182 0.044
71 24.0 0.087 0.053 0.61D95 24 0.20 0.050 gum 1.92
399 262 0.037 +0.021 deposit
E16 48.0 0.082 b
448* 448 0.038 0.055 1.45
D94 0.206M NMpa(dup.) 17.5 17 0.2464.0 0.82 0.44 0.54
58
% %-----"-I
Page 78
"%A~~ -1 -I -A - -r - - - --IU
Table VIII (Continued)
Expt. Oxidn. Ppt., Ro, Rg, P
No. Remarks Time, h h Pmol 02 mg gum Rg /Ro
g fuel-h 100g fuel-h
Fuel B
R35 29.2 29 6.05 6.440 10.9 f 0.59
36 15.5 17 5.023* 22f 13.0 0.59
66 Chromat. once 8.0 8.416.3 23.2 16.7 0.72
73 Chromat. twice 5 4.417.6 14.5 11.4 0.78
Fuel Cb
E 7 10 3.13 11.0 3.6
5 12 5.3 22 4.26 Reconstituted 10 2.8 27 9.6
25 28.3* 28 3.8 5.0 1.3326 Chromatographed 16.5 15 6.5 11 1.7527 Reconstituted 16.5 15 7.0 14 1.96
D87 465 torr 02 15.5 3.8 21 5.4E 2 +4.5 wt% 13.5 3.5 11.9 3.5
SS316 turnings +0.5 deposit on SS
Fuel I
F23 187* 150 0.063 0.19 3.0323 Chromatographed 418 220 0.105 0.21 2.0026 Reconstituted 76 30 0.24 0.35 1.45
(dup.)
Fuel 10
F51 185* 48 0.096 0.142 1.4754 Chromatographed 159 159 0.14 0.33 2.3358 Reconstituted 166 70 0.094 0.18 1.8964 10% reconstituted 24 0.12
236 137 0.13 0.21 1.5665 lOX reconstituted 24 24 0.67
118 0.47 0.77 1.64C92 14.9% SS316 17 0.52
turnings 227 40 0.16 0.50 gum 4.6+0.13 ppt. + 0.11 on SS316
Fuel 13
F 3 66 0.19 0.49 gum
167* 115 0.20 +0.37 deposit 4.28 Chromatographed 52 0.059
309 309 0.048 0.073 1.5259 Reconstituted 49 49 0.25
185 0.18 0.46 2.5G17 48 48 0.23 1.3053 95 0.085 0.20 gum
827 589 0.138 +0.20 ppt 2.9
59
L% 'A
Page 79
Table VIII (Concluded)
Expt. Oxidn. Ppt., Ro , Rg,No. Remarks a Time, h h jwol 02 mg gum Rg/Ro
g fuel-h 100g fueleh
Fuel 14
G17 48 48 0.23 0.29 1.30
53 Chromatographed 95 0.085827 600 0.138 0.40 2.94
C28 29.3 7 0.4958* 0.77 0.30 0.38
G62 Chromatographed 115 0.19 .4,
230 0.20
Fuel 14A
L4A Distilled 72 72 0.220 Snext 164 0.164 0.51 gumtotal 236 0.181 0.29 deposit 4.3
Fuel 14B
L4B Distilled 72 72 0.42next 66 0.50 3.96 soluble •total 138 0.46 0.94 depositlO.6
Fuel 15 -
F66 24 0.48167* 50 0.17 0.28 1.69
67 Chromatographed 28 0.71 p96 40 0.52 1.12 2.17
68 Reconstituted 28 0.21194 140 0.18 0.31 1.72
•Data used in Table 9. p.
apercentages are in mole % for pure hydrocarbons, weight % for fuel mixtures
bSee also Section 3.1 for details on Fuel C, also Section 7 for oxidations at low
02 pressure
c,de,fYields of hydroperoxide in % on 02 absorbed, respectively, for each group of
experiments: c50 , 60; d -100, -100; e63 , 60, 77; f5, 2. •
60
e. -e-7A-
Page 80
Table IX
COMPARISION OF RATES OF OXIDATION AND GUM FORMATION AT l3 00Ca
Fuel RoFuel R 9Fuel R 9/Ro
NMP 97 IND 1280 DOD 0.018
IND 91 N" 680 I-PH 0.027
TET 69 EtN 42 TET 0.10
E 64 B 13 BCH 0.21
1-PHR 28 TET 6.9 PCH 0.21
PCH 27 PCH 5.7 14 0.38
B 22 C 5.0 B 0.59
BCH 19 BCH 3.0 EtN 0.66V"
DOD 15 13 0.85 C 1.33%
C 3.8 1-PH 0.75 A 1.45
14 0.77 14 0.30 10 1.47
13 0.20 15 0.28 15 1.69
15 0.17 DOD 0.27 1 3.0
10 0.096 1 0.19 13 4.2
10.063 10 0.14 NMP 7.1
A 0.038 A 0.055 IND 14.1
a., and R are defined in Table 8. .%.f
a 61
N N N Nf%..1 ? . . . . .. r .. % % .
Page 81
: : i 'i J'.. J..' ..... ..... d, ',. ,--, ,: - - - . ..' .. - . . . . .
Table X %
EFFECTS OF OXYGEN PRESSURES ON RATES OF OXIDATIONAND GUM FORMATION AT 130"C
02Time Pressure,(h) R Rtorr)8 8 8 /R^ Notes
b
FUEL C
0 18.019 12.4 0.20 Nearly stopped at 43 h,
160 7.53 0.044 0.18 4.1 9.2 torr 02
O 30.343 16.2 0.22 1.22 5.5134 11.0 0.11 0.31 2.8 Nearly stopped at 69 h,
14.2 torr0 152.33 150.0 0.51
17 72.2 3.1 317 152.1 Air change23.8 101.7 3.723.8 152.6 Air change28.8 124.7 3.8 5.0 1.32
0 153.9 Chromacographed3 127.0 6.4
11.5 40.8 7.011.5 152.6 Air change V16.5 130.2 5.9 11.3 1.91
0 464.8 Used oxygen analyzer4.5 433.2 3.2
14.0 301.2 7.7 21 2.7
FUEL A
0 20
44 18.5 0.016162 0.017 1.1 (02] increased
0 18.743 17.5 0.0203 %
286 0.0122 0.6 L02] increased
O 16.521 11.4 0.1850 12.6 0.044 0.24 021 increased
0 158.0 Expr. 09524 143.7 19.7
262 114.9 0.0451262 154.7 Air change399 119.3 0.037 0.050 1.92
0.021 deposit
10 Hole % TET in DOD
0 20.1 9.15 moi% TET in DOD
1.5 6.53 6.42.5 5.36 4.1 Nearly stopped at 2.5 h,5.0 5.00 2.2 0.21 0.095 5.4 torr
0 152.0 11.8 mol% TET2 95.6 20.32 153.5 Air change4 46.7 24.0 (interval)6.1 65.1 42.4 0.125 0.0029 Alter 2 more air changes, also
230 mg crystals and 94 mg oil/100 g fuel'h.
ayro initial total pressure and OIN ratio by GC.bOn distilled fuel after storage under N2 at 0"C except where marked "Chromstographed."
62
.. . . . .... ... .... ,'Iii- I...
Page 82
a_
4'
'5V,
',t
Appendix B
La*
GUM AND DEPOSIT FORMATION FROM JET TURBINE 'AND DIESEL FUELS AT 100°C
[Published in Ind. Eng. Chem. Prod. Res. Dev., 26, 215 (1987)j
WI.
i.-
.
N-
I
'ft
ft.
".. -¢..... .. . .. ;. .... : .:.. .. ....'2.....i.. -.z . . . .... . .:.,... . :'::- . . : - - -:: - . - - . - - -' . ,- 2 '; ' - ' ' ' '; 2 , ¢ '.' '? , , ' . ft
Page 83
GUM AND DEPOSIT FORMATION FROM JET ON
TURBINE AND DIESEL FUELS AT 1000C a
._.
Frank R. Mayo* and Bosco Y. LanSRI International, Menlo Park, CA 94025
ABSTRACT
Rates of oxdiation and gum formation for six hydrocarbons, three
jet turbine fuels, and three diesel fuels have been measured at 100C in
the presence of t-Bu 202 as initiator. Four of the six fuels oxidize
faster at 1000 than in previous work at 130* without initiator. For
several substrates, the amount of gum produced for the oxygen absorbed
is similar at 100 and 1300, even with large changes in rates and t-Bu2 02 I
concentrations. Thus, one mechanism of gum formation is intimately
associated with oxidation. The effects of t-Bu2 02 concentration on
rates of oxygen absorption and gum formation --iggest that gum formation
is associated with chain termination by two peroxy radicals. The pure ff
hydrocarbons have long kinetic chains and give good yields of
hydroperoxides. The fuels give short kinetic chains and produce little
hydroperoxide but more gum for the oxygen absorbed. A second mechanism
of gum formation is the coupling of substrates by peroxides in the
absence of oxygen. A third mechanism, condensation of oxidation
products from alkylnaphthalenes, is also proposed.
-
..2
rD e::e
Page 84
1. INTRODUCTION
Our previous paper on gum and deposit formation (Mayo, Lan, 1986)
described rates of oxidation and gum formation from pure hydrocarbons
and fuels in air at 1300. (All temperatures are Centigrade.) The pure
hydrocarbons oxidized faster than the fuels but the fuels gave more gum
and deposits for the oxygen absorbed. Cooxidations of fuels with
additives showed that only those that were most reactive in oxidation
had much effect (positive or negative) on the rates of oxidation and
that such additives were soon consumed. Evidence with Fuel C showed
that soluble oxidation products and gum are the first products formed
and that as gum accumulates, it eventually precipitates. However, no
precipitate was obtained from oxidation of any pure hydrocarbon.
2-Ethylnapthalene, which gave the most gum of any hydrocarbon, is
apparently a good solvent for gum.
The present Paper describes similar experiments at 1000 in the
presence of di-t-butyl peroxide (t-Bu2O 2 ). We had several motives in
this work. We want to bring our experimental work closer to the temper-
ature range of practical fuel stability problems; we expect to need
chain initiators to obtain convenient rates of oxidation at lower
temperatures; and we want to determine the effect of rate of initiation
on rates of oxidation and gum formation.
2. EXPERIMENTAL
2.1. Fuels
The fuels used were described previously (Mayo, Lan, 1986). Fuel
A was a stable jet turbine fuel; C was an unstable No. 2 home heating
oil; the others were diesel fuels. Fuel 14B was the highest boiling 6%
of Fuel 14; Fuel 14A was the remainder of 14.
2
NON.
Page 85
%
2.2. oxidation Procedures
Oxidations were run on 1O-mL samples of fuels in the presence of
about 100 mL of air. Depletion of oxygen was measured by gas chroma-
tography at 500C as described earlier (Mayo, Lan, 1986). t-Bu 202 (ICN
Pharmaceutical, 97% by the HCI method of Mair and Graupner 1964 ) was
initially weighed in the reactor for each run and later delivered by
syringe (D - 0.798). Hydroperoxides were determined by their refluxing A
NaI-i-PrOH method.
2.3. Gum Determination
Most of the peroxide survived the oxidations and so we did not use
our previous evaporation technique in a nitrogen stream at atmospheric
pressure; decomposing peroxide might cause at least some coupling of
fuels to dimers. In some runs, the peroxide was removed by adding about
50% of dodecane and distilling at 15 torr. (Dodecane boils higher than
the peroxide but below most fuels.)
The procedure adopted is the following. A weighed 4-mL sample of '
oxidized fuel was put into a 25-mL flask with a short neck and a glass
ball joint 23 mm in diameter to hold a Viton O-ring. The other part of Athe joint was attached with a clamp to 30 cm of 10-mm Pyrex tubing, bent
at a 1350 angle 12 cm above the joint. The bend led to a 25 mL p
distilling flask, used as receiver. The fuel was then distilled at \l Atorr with a very small flame until the pot was nearly dry. The 12 cm of
vertical tubing provided some reflux and returned "bumped" liquid. The
clamp was then removed (for space considerations) and the pot and
vertical part of the distilling setup, still at 1 torr, were immersed in
a glass bath 6 cm in diameter and 20 cm high. This bath was nearly full
of a mixture of t,80% ethylene glycol and 20% water. It was heated to P
smooth and gentle boiling with a gas flame. The boiling temperature was
maintained at 130 ° by occasional replacement of the evaporated water.
The distilling set-up was left at this temperature for five minutes to
3 .
- ,. . - . % % < , ). . ,-. .......-. ,: . ........ .,. ..- ... . ..-..... ,.*... ,. o. . S. ..
r. Z . L. '' X.4, , r :'I" I i:''I:'i " t '
- " :'' "
-" "- '
5."
Page 86
provide a reproducible point for completing the gum determination. The
set-up was then removed from the bath, clamped, cooled, and eventually
opened to air. The side arm was rinsed with reagent acetone to separate
this hold-up from the rest of the fuel. The hold-up in the formerly
vertical tuoe and the residue in the pot were then transferred with
several portions of reagent acetone (total - 2mL) to 50 mg aluminum
weighing pans from which the solvent was evaporated on a warm hot
plate. These pans were then heated for 20 h at 200C in a slow stream
of nitrogen and then weighed on a microbalance.
Although the absolute values of our gum determinations are of
dubious significance, the gum contents are assumed to provide valid
comparisons. By use of data for oxidation, Experiment K89A with Fuel 14
during 28 days at 100C, some educated guesses can be made about the
extent of gum formation. Fuel 14, normalized to 100 g, absorbed 1.65
mmoles, 52.8 mg of oxygen and gave about 90 mg of dimers and higher
oligomers (evaporation residue) and then 32.4 mg of "gum" after heating
for 20 hours at 200*C. By carbon analysis, this "gum" contains 0.03% of
the original carbon in the fuel and (by differences from C + H + N)
about 8% oxygen, 2.67 mg, 5.1% of the oxygen absorbed. This experiment
also yielded a black film on the Pyrex flask. The film was thoroughly
rinsed with hexane and then extracted with an acetone/ethanol/benzene
mixture. After evaporation of this solution and drying at 1 torr, the
deposit weighed 32.24 mg; it was not heated. That 5% of all the oxygen
absorbed appeared in the film gum and probably another 5% in the
deposit, even after significant losses at 2000, was surprising. This
situation is discussed further in Section 3.3.
Our evaporation technique in g,= determination has been tested by
using the oxidized Fuel 14A from Experiment L4A. Four pairs of evapora-
tions were performed with 2-3.5 g samples of fuel: (1) evaporation to a
6-mm circle of liquid, (2) evaporation to dryness (residue would not
flow), (3) evaporation to dryness and then for 10 minutes longer, and
(4) by vacuum distillation. In the last procedure, the fuel was
concentrated almost to dryness at I torr. A cold finger containing dry
4
12
.. . . . . . . . . .VN"' : : - : - . ."- - . A' .1' ,t ' : ,
Page 87
ice was then inserted and the distillation was continued to dryness, all 'U
parts of the distilling flask being heated to about 1000C. This
procedure is expected to remove physically all the monomeric products
from the higher boiling products. The latter were then transferred to,%
the usual aluminum dish with reagent acetone. Although the first
weights of the four dishes before heating varied considerably, the final
weights of the residues after 20 hours of heating all fell between 118.6 6
and 124.7 mg/100 g fuel and averaged 121.2. Thus, for large residues (4
mg on the dishes), the differences among these evaporation procedures
are insignificant and reproducibility is excellent.
3. RESULTS AND DISCUSSION
3.1. Oxidation and Gum Formation
Our data on rates of oxidation (Ro) and gum formation (Rg) are ?
summarized in Table I. Most of the headings need no explanation. The
abbreviations for the pure hydrocarbons used correspond, respectively,
to n-dodecane, tetralin, 2-ethylnaphthalene, 2-methylnaphthalene,
phenylcyclohexane, and 1-phenylhexane. When several nxidation periods
are indicated for one run number, fresh air was usually supplied for
each. Rates for intervals illustrate the reproducibility of our results
and how the rates change with time. Runs in which >78% of the oxygen
was consumed in any period are omitted because of possible effects on
rates. The highest consumptions of oxygen in runs in Table I are: for
H55, Fuel B, 78%; L18, EtN, 75%; F87, DOD, 70%; and J37A, DOD, 66%.
Only three recent TET runs are included. For these, the TET had
been washed with 2M NaOH and water and then distilled at 18 torr, with
rejection of the first and last portions. Even with efforts to exclude
oxygen and and to store at low temperatures, the rates of oxidation were
independent of how much t-Bu 202 was present, and the TET accumulated
titratable peroxide. Aldrich EtN, fractionally distilled in vacuum in a
good column at NASA, oxidized faster than Aldrich material distilled
here with a poor column. MeN oxidized much slower than EtN. It appears
%%
.J.
Page 88
a
that the rates of oxidation of alkylnaphthalenes depend on the formation
of hydroperoxides, their conversion into napthol inhibitors, and the
efficacy of the latter (Larsen et al. 1942).
The oxidations of DOD and Fuels B and C are autocatalytic;
oxidations of the alkylnaphthalenes and all the other fuels are self-
retarding. With other pure hydrocarbons, trends are not clear. No
precipitate was obtained from any pure hydrocarbon but most of the fuels
gave adherent precipitates (as well as soluble gum) as uniform films on
the parts of the flasks in contact with liquid.
In oxidations of Fuel 14, there were no other solids at reaction
temperature, but a faint cloudiness appeared on cooling the reaction
mixtures. We interpret this cloudiness to decreasing solubility of the
deposit in fuel and we count it as soluble gum. We think that the
continuous gentle shaking of our reactor causes all the deposits to grow
on the surface films. The ratio of insoluble/soluble gum with t-Bu2 02
in Experiment K89A, - 1, is the largest that we have seen at SRI.
As indicated in Section 2.1, Fuel 14 was fractionated into lower
(14A) and high boiling (14B) fractions. The higher-boiling 14B absorbed
oxygen somewhat faster than 14A at 0.01 M t-Bu 2 02 and gave gum deposits
about twice as fast.
Table 1 shows a wide range of rates of oxidation and gum formation
and their ratios. They are summarized in Table II. P
Tahle I gives some yields of hydroperoxides on the oxygen "-
absorbed. The best yields are associated with the fastest oxidations.
Some titration of TET hydroperoxide showed more peroxide than the oxygen
absorbed. Such results are ascribed to unmeasured oxidation at room
temperature before titration.
3.2. Comparison of Results at 100 and 130C
Rates of oxidation, gum formation, and their ratios in oxidations
at 100 and 130* are compared in Table II. Values at 130*C are taken
from our previous paper (Mayo and Lan, 1986) and are listed in order of
6 'A
AZ
........ " 9
Page 89
lA
decreasing magnitude in the R and Rg columns and in order of increasingmagnitude in the R /Ro column. Values at 1000 come from runs marked
with astcrisks in Table I and are listed immediately to the right of the
130 ° values without respect to the 100* rank. With 0.03-0.04 M t-Bu202
at 1000C, differences among hydrocarbons and fuels are much smaller than
at 1300 without initiator. The rankings for Ro for and above Fuel C are
similar at the two temperatures; the rates at 1300 are 1-6 times those
at 100*C. However, MeN and Fuels A, 10 and 13 oxidize faster at 1000
than at 130 0C. Thus, these fuels have less ability to initiate and
maintain their own oxidations and have shorter kinetic chain lengths
than the other and faster oxidizing fuels; they are self-retarding in
oxidations.
Use of t-Bu 202 at 1000 also narrows the range of Rg. Again, the
faster oxidizers give gum faster at 130 than at 1000; the reverse
applies to the slow oxidizers.
The RE/R o ratios tell us the relative amounts of gum formed for
the oxygen absorbed. If the mixture of mechanisms for gum formation is -'
the same at 100 and 1300, then the ratios of Rg/R o for the two
temperatures should be the same. The last column of Table II shows that
5 of the 12 ratios are between 0.5 and 2, 7 between 0.3 and 3, even with
large differences in R and Rg alone. The experimental error in
measuring low rates of oxygen absorption and gum formation may
contribute to the larger discrepancies.
This section shows that a controlled rate of initiation is impor- -'
tant to understand gum formation and that it will be important at lower
temperatures where reactions are much slower.
3.3. Effects of Concentration of t-Bu2 02
Table III summarizes effects of changes in t-Bu 202 concentrations
from three-fold to 76-fold for each of several fuels on R., Rg, and
their ratios. The smaller effects of t-Bu202 are associated with the
hydrocarbons and fuels that oxidize fastest at 1000 without t-Bu 202.
However, the R /Ro ratios for a single fuel are little affected by the
+ 0-
7 '5
SW'
- % P e es *r .*~*~ A~ ~~t.4v
Page 90
.Ju
changes in Ro and Rg, showing that the mechanism of gum formation is
intimately related to the mechanism of oxidation. The last two columns
give the apparent orders (n) of Ro and Rg on the initial concentration
of t-Bu202, calculated from the relation:
Ratio of Ro (or Rg) values - ratio of [t-Bu2O 2 n .
In conventional long chain oxidations, n = 0.5 but as the kinetic chain
length approaches zero, n approaches 1. n - I is also characteristic of
inhibited or self-retarding oxidations. The fastest (longest chain)
oxidizers, DOD and EtN, have n values of < 0.3 in Table III. These low
values are consistent with their fairly fast oxidations without t-Bu2 02
and neglect of autocatalysis or self-retardation. The other, slower
oxidizing fuels have n values closer to 1, corresponding to short chains
and/or self retardation. The orders for Ro and Rg are nearly parallel.
Table IV presents the same basic data in another manner. The
first two columns of data give the moles of oxygen absorbed and t-Bu2 02
decomposed in the whole reaction mixtures. Details for each experiment
are given in Table I. The t-Bu202 decomposed is calculated from the
equation (Raley et al., 1948):
initial t-Bu2 02log finl tBu2 - 0.002143 t (in hours)
The kinetic chain length (number of molecules of oxygen absorbed in
chain propagation for each t-BuO- radical produced) is equal to
(AO2/2AtBu 2 02) -1/2, where the 1 is the net oxygen absorbed in chain
termination for radicals of two alkylperoxy radicals. The kinetic chain
lengths range up to 130 with the pure hydrocarbons (except MeN) and are
substantially higher with low t-Bu 202 concentrations and long times than .
with high peroxide concentrations. The oxygen absorbed at long reaction
times probably includes contributions from autocatalysis, which is
neglected in the calculations. The fastest oxidizing Fuels B and C also
I " "S
Page 91
I-
give significant chain lengths, but the other fuels give little chain
provagation and therefore little hydroperoxide.I
The last two columns of figures in Table IV give the mg of gum
formed in the listed experiments and the mg of gum per mmole of t-Bu2 02
decomposed. For most single fuels, this ratio changes only moderately
with the amount of t-Bu 202 decomposed. As with chain lengths, the
highest yields of gum tend to occur at the lowest concentrations of t-
Bu202 (Table I) and the longest reaction times where autocatalysis would
distort results the most. Autocatalysis may account for the deviations
in gum yields with DOD and EtN. The yields of gum are in the range 3 toI
2000 mg/mmole t-Bu 2 02 decomposed. Variations in the yields of gum with
different fuels correspond to difference efficiencies in the coupling
reaction. On this basis, EtN is the most efficient gum former, followed
by 14B, 14A, PCH, 1-PH, TET, 13, 10, B, C, and A. MeN and DOD are the
least efficient gum formers. This order agrees poorly with those for Rg
and Rg/R o in Table II, which have different bases.
3.4. Mechanisms of Gum Formation
This section presents three mechanisms for formation of soluble
gum in air at and below 130*C, which requires hours. They are probably
related to the mechanisms of deposit formation on heated metal tubes in
a Jet Fuel Thermal Oxidation Tester (JFTOT, ASTM, 1975), where a stream
of n-dodecane containing dissolved oxygen was exposed to a hot tube for
28 seconds at various temperatures between 190 and 538*C (Hazlett et al.
1977). However, the deposits, which are more practically important, are
mostly insoluble and higher in N, S, and aromatics than the gums and the
fuels. In the Hazlett work (1977) the concentration of hydroperoxides p
reached a maximum when the dissolved oxygen was exhausted at 282 0 C.
Between 282 and 385*C, the peroxides decomposed, mostly to alcohols, but
partly to ketones, and initiated pyrolysis to CO and smaller alkanes and
alkenes. A later paper (Hazlett 1980) shows that deposits start to form
during the oxidation, but that most of them appear during the
decomposition of peroxides. He concludes that the deposits are formed
9
Page 92
at high free radical concentrations.
Our previous paper (Mayo, Lan 1986) proposed that gum formation
starts with coupling of two alkylperoxy radicals in the chain
termination of oxidation and that growth beyond dimer depends on
converting dimer to peroxy radicals by chain propagation. Tables 3 and
4 are consistent with these proposals, which we have no reason to
change. The Tables do not resolve the questions of the relative
contributions of propagation and termination to gum formation because
the orders on t-Bu2O2 are parallel. Tables 3 and 4 show that
autocatalysis in fast oxidations obscures the effect of t-Bu2 02, but
that most fuels have short kinetic chain lengths and a small range for
mg gum/6t-Bu 02 2
The second mechanism is the coupling of fuel molecules and their
oxidation products in the absence of oxygen. We have two new
examples. In one experiment, 10.3 g of oxidation product L18 containing
5.80 mg gum and 0.853 mmole of hydroperoxide was heated for 24 h at 135-
1500 in an evacuated tube. The usual gum determination then gave 258 mg
of yellow oil and white crystals after distllation at I torr, and 84.1
mg of "gum" after 20 h heating at 2000, an increase of 78.3 mg, 13.5
times the gum formed in the oxidation scep. If the additional material
is all dimer (C24H22), 0.252 mmole was produced by 0.853 mmole of
hydroperoxide, a yield of 30% after (and 95% before) the 20-h heating at
200 ° .
In another experiment, 9.86 g, 63.1 mmole, of EtN and 1.486 g,
9.84 mmole, of 97.6% t-Bu202 was heated in a sealed evacuated tube at
1500. An aliquot was then concentrated at 1 torr, finally for 5 min at
130*. The residue corresponded to 2.084 g, 6.71 mmole, of mostly
crystalline, white dimer, a yield of 68.2% on the peroxide used.
Thus the coupling of hydrocarbons by peroxides in the absence of
oxygen produces dimers (and presumably some oligomers) in good yield
without incorporation of oxygen (except possibly from the peroxide).
Oxygen prevents this direct coupling and gives gums containing several
percent of oxygen. The yield of coupling products in oxidation are very
10
%I
.pZ
Page 93
a.
low but vary greatly (Section '.3) and the products contain oxygen. The
oxygen pressure at which one coupling reaction replaces the other is
unknown.
The extraordinarily high yields of gum for the t-Bu202 decomposed
from the best NASA EtN in Experiments J44B and L18 suggests that another
mechanism of gum formation is involved. This mechanism has not yet been
investigated, but it might involve some reaction like the condensation
of naphthaldehyde and naphthol; both are possible secondary products
from the oxidation of EtN.
4. SUMMARY AND CONCLUSIONS
This paper extends our previous work (Mayo and Lan, 1986) on
oxidation and gum formation in pure hydrocarbons, jet turbine, and
diesel fuels at 130*C without added initiator to 1000 with added t-
Bu2O2 Three of the six fuels and MeN oxidize faster at 1000 than at
130*. These fuels have short kinetic chain lengths in oxidation and do
not produce much hydroperoxide. Thus, comparison of individual rates of
oxidation and gum formation for various fuels at unknown rates of
initiation is of dubious significance. However, for any single
substrate, the amount of gum produced for the oxygen absorbed (Rg/Ro)
tends to be similar at 1000 and 1300, even with large changes in rates
of oxidation and gum formation and t-Bu202 concentration. Thus, one
mechanism of gum formation is intimately associated with ongoing
oxidation.
The effects of t-Bu 202 concentration on rates of oxygen absorption
and gum formation show that the kinetic orders of these reactions range
from 0.25 to 1.0 but have a similar magnitude for each hydrocarbon or
fuel. In general, the pure hydrocarbons have small kinetic orders and
long kinetic chains and give good yields of hydroperoxides and low
yields of gum for hte oxygen absorbed. Most of the fuels have kinetic
orders approaching one and short kinetic chain lengths and produce
little hydroperoxide but much gum for the oxygen absorbed.
'% % % V %WPP e.
-- 6 -%L-.
Page 94
Another mechanism of gum formation is the coupling of substrates
by peroxides in the absence of oxygen. This is an efficient mechanism
for coupling and the products contain little or no oxygen if they are
made from hydrocarbons. This mechanism is replaced by the oxidation
termination mechanism when gaseous oxygen is present. The oxygen
pressure at the transition is not yet known.
The last paragraph of Section 3.4 proposes that products of
oxidation of EtN condense to give high yields of gum by a third
mechanism. This is consistent with a report of Kiiko (1982) that a
resin is the principal oxidation product of 1-methylnaphthalene and that
much more naphthaldehyde than naphthoic acid is formed.
Gum formation by aldol condensations and esterifcation of oxida-
tion products (Mayo, 1975) and by aldehyde-hydroperoxide interactions
leading to polyesters (Sauer et al., 1958) have been proposed, but so
far we have seen no need for these mechanisms. L
ACKNOWLEDGEMENT
Our research on diesel fuels was s.pported by the U.S. Army
Research Office under Contract DAAG 29-84-K-0161. Our research on jet
turbine fuels was supported by NASA-Lewis Research Center under Contract
NAS3-22510.
1!
,J
'-.
1// / | !
Page 95
REFERENCES
ASTM Method D-3241-74T, "Tentative Method of Test for Thermal OxidationStability of Turbine Fuels", Philadelphia, PA (1975).
Hazlett, R. UT., Hall, J. M1., and Matson, M. Ind. Eng. Chem., Product Rand D, 1977, 16, 171.
Hlazlett, R. N., Fractions of Free Radical Chems., Pryor, W. A. ed.,4Academic Frontiers 1980, p. 195.
Kiikn, I. I., The Soviet Chemical Industry, 1982, 14:11, 1303; The RalphMc Elroy Co., Inc.
Larsen, R. G., Thorpe, R. E., and Armfield, F. A. Ind. Eng. Chem. 1942,34(183).
Mair, R. D., and Graupner, A. J., Anal. Chem. 1964, 36 (1), 194.
Mayo, F. R., Richardson, R1., and Mayorga, G. D. Preprints, ACS Divisionof Petroleum Chemistry, 1975, 20 (1), 38.
Mayo, F. R., and Lan, B. Y., Manuscript submitted to Ind. Eng. Chem.,Product R&D, 1986, in press.
Raley, 3. H., Rust, F. F., and Vaughan, W. E., J. Amer. Chem. Soc. 1948,70, 1336.e,
Sauer, R. W., Weld, A. F., and Headington, C. E., Preprint, ACS Divisionof Petroleum Chemistry, 1958, 3, 95.
131
Jb F 13
Page 96
0 0 0 0 t *0i 0-~r. P- ON 4% ai %D % K Ln
Ir- I.. A .4A r-.0
41 % 00 ' ~- 0 f 4 0% m r- l -4r crim-~ 0 0 CN -4 1.4 4 .. 4 -4 .-4 C"wl7 CIA U7C4Ul
00 0 00 0 0 04 0 0000 0
00
0 -l
-C4 4 MMICy 4aW0 0% 0C0 '0 0 WJ -4CM0m CkJ "~) OC'1C -4 N4 -4M 4 U4CN
"1 -4
0 E-4 0.- a40 0 C'4 41V I=0C -
--
00~%00 0C r=~ x * C0 aJ 0- a C4 r0 -
uZ m Q .4t
4. 14 0 434. w 41sC
a c 00 0 00 a O 4-4 0- % M4 C4~ - -0 00 0 000 0 0 0
Z4
43 N (%
Page 97
-ft9-7 169 GU AMO DEPOSIT FORMTION IN DIESEL FUELS(U) SRIl 2/2I INTERNATIONAL MENLO PARK CA F R MAYO ET AL. 15 MAY 63
SRI-PYU-7753 RR-21165. 7-EG DRR29-94-K-161 2IJCLSIFIED F/G 21/4 NL.ElllllglllF
K -E -- I
Page 98
PN
N
Ii,,1 __I1 (IInI111112 1.6
UTION TEST CHART S
l. %
o
S::.
w
U
Page 99
r- C4- n0 -r 4 - -TL
03
-: 0: 1*
0.0 (30 ONL % in LM C)0%0kmc co
0n 0 A- (LQ0%%A -4 .- n-
-4 .4 04 T -t N O 0 -T 00 0 0 -Ai@ i 41i 4e
Q6 1-4 N 0- -
0-4f
:3~~~ x 0 U0e
8 4--4 P40 Z%
C4 '0 '00 4L o or0.0 Cr.
cN'0 z ..- s U.40 ~ 0 --
N LA'..".t -~ N '-'s
Page 100
4c
00 Vi0 0
V4 a; V V
o p6441
0041
Ln J4Q 00 9 '00(U
0 -. '-0 C 'IN -t 4 Occ.a
-4 0U 4
(U (A
0- .(4 0 Q-0
-~~~ a- a..- -
0 ~~~ 000 00 000 ~ -7'
-- 4 r,.J . 4
I.,~~~. 0., %0 1. 04
(0- 40 TC0 -4 0 4
C4 - 1-4 . % :.1 o .4 c5 0 u 4cc40 . Nc 39 03 CIO c'-0 .0 U
000 0 0 i 8 wI-400--c
4) 0 a .c
0 s(U $a0ON0 0 wa L
M. N-4- m t c 45 go N 4 4 40. 0 -4N4 -4 U -2 -(4~
4 -0
-t 04-I4 4 C - 4d C41.5. -4 1U ( .4 c - fU (U 0
4) .5 C6 S1 L91W41L -. C'0LOk 00C6 g4 0 0 UW O
cc cc- ca 0 0.
z 4. 0 -4
0n 00 47% Q 0 4 cc =1 c 0 0= "go N -0 tN (9 Go 0 0 -4 '0 IN 4( I-s 4J
'4 4) Ok 0.0ZU.a5
Page 101
c I0 0 1- '0 0
en en 'o00% i4 Ul 0% - -T 00 0 0 ; 4- 0 8 C;. - 0 N t
-5--4
0 2 S 0'. E" X IA 3 I.O .00- _ C_ ow -4 go Ca C. -4 m. V
m4- .4 .4O ~ nc 000 NO 00 -7 en-4
O -1.4 03
0 C-O C400 C-0 ON I r- co0 C0 .- d I . St C * . N 00 0 l . - I A
1-4 N4 Go
zn 4j
>e 6 4 CJ 41 Aj 0en C4 i en %C &M 0 0 C 4 0 0 -r 4
0I .4t %Q N0 0
CL0 .0t4-4 "a x- eq 414
w4 04cI4 0 o r
w. n I e 0 0 41 1 5ps4 -0 cc E0 0. u 0-4z
.0 w 4ok
0 '.04 IA,40 -4
to1 0414 (1 c ' %a 0D 04 Z 0 0)a
0 IT5 co -0 1 .4~~~~.~c -4 -44' 0- .1 4 0
cmIz( Y 0 0
0
Ch at j 0 1V4 0 0 %C e 0
4n%14CMIdA -4 -
o 0 c1o04 GO' N ON N 0 0 J
ta~ 6. I u ~ 0000 fn sj 0~ 0.
I- -4 -4 *6 go i41- 4 4 n c
Page 102
Table III
EFFECT OF (t-Bu202] o on R. and R at 1000C
Ratios at Higher/Lower [t-Bu 2O2 ] Apparent Order
Fuel Experiment on t-Bu202Numbersa t-Bu2 0 2 Ro Rg Rg /Ro Ro R "
DOD F86, 87 10 1.87 2.3 1.22 0.27 0.36L15A, B 10 2.02 1.47 0.73 0.29 0.17
EtN J5, 6 8.63 2.97 4.31 1.45 0.50 0.68J44, L18 3.21 1.71 1.73 1.04 0.25 0.25
Fuel A H64, 77 75.6 96 59 0.61 1.05 0.94
Fuel 10 F79, 84 10 9.73 9.6 0.99 0.98 0.98
Fuel 13 F78, 83 10 4.39 10.8 2.42 0.64 1.03 1
Fuel 14A L4C, D 10.1 7.27 7.54 1.05 0.86 0.87
Fuel 14B L22A, B 10.0 5.05 4.2 0.81 0.70 0.62 4M
aDetails in Table I.
'.5.m
.5
'4
. . . . . . ° - ... . o - .. , .......-.- -.- -. -%-. . .. .'.'..' .' ' 'b, ,'%' ,'% '.' ''. °.''"
S..., %
Page 103
Table IV
RELATIONS OF t-Bu202 DECOMPOSED TO KINETIC CHAIN LENGTHSAND GUM YIELDS
KineticExpt. O0 a Chain Gum, Mg Gum
Substrate Number Millimhles At-Bu2 0 Lengthb mg At-Bu2 02
DOD F86 1.334 0.046 14 0.24 5.3F87 1.241 0.254 2 0.72 2.83J37A 0.942 0.066 6.7 0.8 13.3L15A 0.351 0.013 13 0.59 46L15B 0.561 0.103 2.2 0.68 6.6
J37B c 0.330 0.092 1.3 0.9 9.6
TET H96 1.427 0.0092 77 0.50 54
EtN J5 0.278 0.0088 15 1.03 117J6 0.650 0.065 4.5 3.5 54J44B 0.363 0.0017 106 1.92 1130
L18 2.209 0.0053 130 11.3 2120
MeN L14 0.170 0.0421 1.5 0.476 11.3
PCH G37 1.476 0.028 26 1.76 63
1-PH L21A 0.296 0.011 13 0.664 60
A H64 0.121 0.0325 1.3 1.15 35H57 0.335 0.1755 0.46 3.18 18.1H77 0.796 0.296 0.85 4.64 15.7
B H55 1.174 0.0732 7.5 1.77 24
C H54 1.389 0.081 8.0 1.80 22
10 F84 0.1165 0.0540 0.6 1.74 32
F79 0.0899 0.281 -0 7.8 28
13 F83 0.146 0.055 0.82 1.95 35G59 0.400 0.213 0.54 7.7 36F78 0.0513 0.237 -,0 7.9 42
14 K89B 0.902 0.333 0.80 2.5 75
14A L4C 0.212 0.069 1.0 6.7 97
L4D 0.919 0.505 0.4 41 81
14B L22A 0.298 0.050 3.1 14.5 293L22B 0.439 0.30 0.24 31 104
a Mmoles t-Bu202 decomposed during oxidation.
b Kinetic chain length - (AO2/2 At-Bu2 02 ) -1/2.
c Contained -3 mole% anthracene.
N N
Page 104
I
Appendix C
SOURCE OF JFTOT DEPOSITS FROM ANOXIDIZED JP-8 FUEL
Page 105
Reprinted from l&EC RESEARCH, 1988, 27, 362.Copyright 0 1988 by the American Chemical Society and reprinted by permission of the copyright owner.
Source of Jet Fuel Thermal Oxidation Tester Deposits from an OxidizedJP-8 Fuel
The object of this research was to determine what components oi an oxidized fuel are most responsible
for deposits on hot engine parts. A 5-deg boiling range cut of a JP-8 fuel was oxidized with air at100 *C and then fractionally distilled at 25- and 5-Tort pressure into (essentially) recovered fuel,a high boiling fraction (containing monomeric oxidation products), and a residue (containing bi-
functional and polymeric materials). Restoration of polymeric oxidation products to the originalor recovered fuels greatly increased deposit formation in the jet fuel thermal oxidation tester (JFTOT),ASTM D 3241, but restoration of monomeric oxidation products had little effect. An explanation ~ am
is proposed.
1. Introduction Table I. Oxidation of JP-8
The jet fuel thermal oxidation test (JFTOT), ASTM D boiling range at 760 mmHg = 137-188 *C3241, is one of the best measures of the tendency of middle boiling range at 25 mmHg - 50-86 0 Cdistillates to give deposits on hot engine parts. For control 11950 g of JP-8 cut into 4125 g of fraction 77 (boiling range atof these deposits, the fractions of an oxidized fuel that 25 mmHg = 67-72 °C)cause most of these deposits should be known. In the work 2 L of fraction 77 (1545 g) oxidized in air with 0.01 M t-Bu202
for 19 days at -100 *C to give 1495 g of product 84A (D 25described here, a narrow-boiling fraction of JP-8 fuel was 0.7718)oxidized with air at about 100 *C and then cut by frac- moles oftional distillation into the main fraction (mostly unoxidized 1o1esofuel), the monomeric oxidation products of higher boiling R8i 2 epoint (mostly hydroperoxides, alcohols, and ketones), and product 84A distilled at 25 torr yieldedthe und stlla le resdu . T e b st dat o pr ma y o i-1359 g of 84C, boiling range 58-80 °C, mostly 0.119the undistillable residue. The best data on primary oxi- recovered fuel with some cleaved oxidationdation products of alkanes come from the papers by Jensen productsand co-workers (Jensen et al., 1979; Korcek et al., 1987) 123 g of 84D, distillation residue 0.006on the oxidation of n-hexadecane in a flow microreactor 2 g of H 20 0.085at 160 *C with a few minutes average residence time and 11-g loss by decomposition during distillation 0.028 (24%)119 To" of oxygen: 48.5 sol % hydroperoxides, 38% 121 g of 84D distilled in 3 lots at 5 Torr yielded
60 g of 87A, boiling range 50-80 *C, mostly <54 0.003alcohols, 0.5% ketones, 8% diols (after reduction), 0.3% *C, monomeric oxidation productscyclic ethers, and also 4.5% cleavage products (Jensen et 51 g of 87B, distillation residue, bifunctional 0.057al., 1981), mostly acids and ketones. Longer oxidations give monomeric and polymeric products (Q g ofmore alcohols, ketones, and cleavage products from de- deposit on reactor added to 87B; >95%compositions of hydroperoxides. Formation of bifunctional dissolved)products is favored by higher oxygen pressures and for- 10 g of H20 and loss 0.025 (30%)mation of cyclic ethers by lower oxygen pressures. At 120 *By Hercules method I (Mair and Graupner, 1964).*C, the C16 products were 73.5% monofunctional, 25.2%difunctional, and 1.3% trifunctional (Jensen et al., 1979). Table II. Compositions of Fuels in JFITOT'sThus, the undistillable residue from oxidation of our JP-8 fractionfuel may contain bifunctional products amounting to 87Bperhaps one-third of the amount of monofunctional oxi- bifunctionaldation products. 77 84C 87A and
expt unoxidized recovered monomeric polymeric2. Experimental Part 1 100
Four gallons of JP-8 fuel (coded AL-12780-F) was sup- 2 100plied by Southwest Research Institute. Its boiling range 3 95.8 4.2%
4 96.6 3.4%by D 86 (10-90%) was 161-172 *C. Table I shows its 5(reonstituted 92.8 4.0% 3.2%boiling range in a packed column at atmospheric pressure oxidized fuel)and in a 1-m Vigreux column at 25 Tort. In two series of 6 96.8 3.25%distillations at 25 Ton, 34.5 wt % material (fraction 77) 7 96.0 4.0%was cut out with a 5-deg boiling range. By GC, it consisted 'Weight percent in 605-mL samples.of C, and CIO hydrocarbons. Two liters of this fraction ina 3-L flask was oxidized with good stirring in a slow stream details are given in Table I. Table I summarizes the ox-of air at an average temperature of 100 SC, controlled by idation of this fraction to the whole liquid product (84A)the voltage on a mantle. The exit gas was tested occa- and further fractional distillation of the latter at 25 Torsionally for oxygen content; the lowest O/N ratio found into mostly unreacted fuel and cleavage products (84C) andwas 0.16. For a half-life of 140 h at 100 *C, about 90% the first distillation residue (84D). Because peroxides areof the initial 0.01 M t-Bu 202 decomposed in 19 days. More concentrated and less stable in this residue, it was distilled
0888-5885/88/2627-0362$01.50/0 C 1988 American Chemical Society
,W " .
Page 106
Ind. Eng. Chem. Res., Vol. 27, No. 2, 1988 363 1%
Table I1. Results of Jet Fuel Thermal Oxidation Teat (JYOT), ASTM D 3241vol of deposit by
change in TDR spun max thickness by DMD,d cm3 xpressure, mmHg' deposit ratingb visual rating' DMD,' cm X 10 10 -
1 0 8 at 51 I 7 at 36 252 0 10 at 51 1 9 at 44 303 0 11 at 51 3 (spot) 9 at 50 284 125 in 46 min 30 at 32 <3P 664 at 32 11055 125 in 54 min 22 at 32 <3P 319 at 18 572 .6 125 in 64 min 22 at 32 <3P 575 at 32 10127 0 12 at 51 I 18 at 34 33
'At filter. bHighest rating observed on heating tube at indicated distance (mm) from cool fuel inlet end. IP - peacock variety of colors.'Deposit measuring device, which utilizes dielectric breakdown voltage to define deposit thickness (Stavinoha et al., 1986). The last numberon each line is the position on the heating tube, as in b.
in three portions at 5 Torr and separated into distillate not readily adsorbed but the polymeric and polyfunctional(87A, monomeric oxidation products) and a residue (87B) ones are. The presence of some low-boiling polar productswhich could not be safely concentrated further. in the oxidized fuel and the addition of monomeric oxi-
Fuel samples of 605 mL were made up as shown in Table dation products apparently enhance the solubility of theII. The original 84A contained 4.1 wt % 87A and 3.5 wt polymeric decomposition products enough so that fewer% 87B, but the quantities of these materials available were of them are absorbed. It should follow that addition tonot quite sufficient to make these proportions in the ex- fuels of small proportions of good solvents for gum shouldperiments listed in Table II. The blends were evaluated discourage deposit formation. Thus, the practical effectby the JFTOT, ASTM D 3241, with previous aeration of of "detergents" in reducing deposit formation may be duethe samples with a mixture of 10% oxygen and 90% ni- mostly to their solvent properties.trogen. The test was run at 282 *C, which gave a rea-sonable deposit with the neat JP-8. Acknowledgment
For gum preparation and analysis, 25 mL, 19.35 g offraction 77 was oxidized with 0.1 M t-Bu 20 2 for 168 h at Research at SRI International was supported by Con-
100 °C, 11.16 mmol of 02 was absorbed. The product was tract DAAG29-84-K-01161 with the U.S. Army ResearchOfc.Research at SwRI was supported by SwRI usingconcentrated up to a liquid temperature of 85 *C, leaving Office.
0.594 g of concentrated gum, a yield of 4.0 wt % fraction the U.S. Army's Belvoir Fuels and Lubricants Research77. This gum was miscible with hexane, even on chilling, Facility at SwRI operated under Facility Contractand no precipitate could be separated. Analyses were as DAAK70-85-E-0054.follows: fraction 77,85.70% C, 14.02% H, 0.25% N, 0.40%S, 100.37% total; concentrated gum, 70.70% C, 9.14% H, Literature Cited0.80% N, 0.44% S, 18.92% 0 by difference. The H/C Hazlett, R. N. Frontiers of Free Radical Chemistry; Pryor, W. A.ratio decreased from 1.95 in the fuel to 1.54 in the gum Ed.; Academic: New York, 1980; p 197.concentrate, with significant concentration of nitrogen and Jensen, R. K.; Korcek, S.; Mahoney, L. R.; Zinbo, M. J Am. Chem.possibly uSoc. 1979, 101, 7574; 1981, 103, 1747.
Korcek, S.; Jensen, R. K.; Zinbo, M.; Mahoney, L. R. Prepr. Pap.-Am. Chem. Soc. Div. Pet. Chem. 1987, 32, 1.
3. Results and Discussion Mair, R. D.; Graupner, A. J. Anal. Chem. 1964, 36, 194.Table III shows that experiments 4-6, which contain Stavinoha, L. 14 Barbee, J. G.; Buckingham, J. P. "Thermal Stability
polymeric and some polyfunctional monomeric oxidation Deposit Measuring Device," Proceedings of the 2nd Internationalproducts, consistently give the most deposits. The dif- Conference on Long-Term Storage Stabilities of Liquid Fuels;
Stavinoha, L. L., Ed.; Southwest Research Institute: San Antonio,ferences are most impressive with the deposit thicknesses TOt18;p60and volumes determined by the deposit measuring device TX, Oct 1986; p 600.of Stavinoha et al. (1986). The most deposit is obtained * Deceased October 30, 1987. Correspondence should be ad-from the polymeric oxidation product blended into dressed to Theodore Mill at SRI International.unoxidized fuel (experiment 4). The next most deposit is SRI International.obtained from the same oxidation product in recovered Southwest Research Institute.oxidized fuel. Addition of monomeric oxidation product Frank R. Mayo,*t Leo L. Stavinoha,l George H. Lee'to fuel does not contribute to deposit formation; it evenreduces the amount of deposit obtained with the polymeric Chemistry Laboratory
oxidation product. SRI InternationalThese results are consistent with the following expla- Menlo Park, California 94025
nation of deposit formation. Deposits come mostly from and Southwest Research Institute
decomposition of peroxides (Hazlett, 1980) at or near the San Antonio, Texas 78284
surface of the hot metal, but to form deposits, some Received for review February 4, 1987products must be adsorbed (deposited) on the surface. The Revised manuscript received August 3, 1987data indicate that monomeric decomposition products are Accepted September 8, 1987
Ik
; .' . . r~e. #' .,,,. .'..'..',¢ , .. ,, ,"._r,,.".,.'.,'.'--, -. ," .-. '-._,".,,% _.' .-. ,-.-, . ,, .- .. - . -. .. ..-.. ,,. ..- - . ,