35.7 % 48.5% 30.5% 32.5% 15.21 % 13.11 % 12.24% 29.81 % 69.77 % 18.21 % 25.09% 18.21 % 29.09% 15.01 % 90% 25.4% 27.5% 41.5% 27.5% 14.32 % 6.60 % 12.5 % 30.5% 15.21 15.01 % 27. 13. 32.5% 29.0% 27.5% 30.5% Enterprise Email Marketing Solutions & Services Latest results and analysis of email response data including industry and language comparison AND TRENDS LATEST RESULTS Email Benchmark Report 2012 - ASIAN EDITION
Transcript
35.7%48.5%
30.5%
32.5%15.21%
13.11%
12.24%
29.81%
69.77%
18.21%25.09%
18.21%
29.09%
15.01%90%
25.4%
27.5% 41.5%
27.5%14.32%
6.60%
12.5%
30.5%15.21%
15.01%27.5%
13.5%
32.5%
29.0%
27.5%
30.5%
Enterprise Email Marketing Solutions & Services
Latest results and analysis of email response data including industry and language comparison
AND TRENDS
LatESt RESULtS
Email Benchmark Report 2012 - ASIAN EDITION
Contents – emarsys Email Benchmark Report 2012 – asian Edition
Introduction
Bounces
Open Rate
Click Rate
Unsubscribe Rate
Comparing Industries
Comparing Industries for the Last Two Years
Comparing Languages
Comparing Languages for the Last Two Years
Summary of Results
Recommendations
About emarsys
2
3
4
5
6
7
8
11
12
15
16
16
1
emarsys Email Benchmark Report 2012 – asian Edition – Introduction
the emarsys Email Benchmark Report celebrates its tenth birthday. For the last 10 years we have analysed response data from our clients and provided insight into email marketing trends. this year, not only have we have collected data from over 70,000 B2B and B2C campaigns (newsletters, promotional email) sent by over 1000 businesses across different countries and industry sectors, we introduce the new “asia Edition” of the Benchmark Report with figures and insights specific to the asian region.
the data, collected between January 1st and December 31st 2011 was analysed to produce detailed statistics on:
• Open and click-through rates • Bounces and unsubscribes • Response by industry • Response by language
this year we feel it’s time to retire one statistic - that is the format of emails sent. Over 98% of emails are sent using HtML (with a text copy) so there is no longer any need to measure this level of activity.
In previous years, our analysis included a comparison of campaign success metrics in 14 European languages and a detailed breakdown of results by industry. this year, we incorporate metrics based on the Chinese language into our first asian Edition, as China grows in its wired population and internet as well as email usage. In addition like last year, we complemented it with an overview of response trends over the last two years.
to ensure the most accurate results, we distinguish between the first two campaigns (“introductory campaigns”) and all campaigns thereafter (“on-going campaigns”) for the analysis of bounce and unsubscribe rates. as a general industry tendency, the first two campaigns have significantly higher bounce and unsubscribe rates than later campaigns as some rogue data may have been imported in the initial set up and therefore has to be analysed separately.
there is also a proliferation of daily deal providers and companies who have adopted this methodology over the over the course of 2011 which we feel could skew the results, in terms of frequency of send. We have therefore levelled the data on these types of businesses to ensure continuity and quality of our report.continuity and quality of our report.
2
Email Benchmark Report 2012 - Asian Edition
Internal test campaigns, campaigns without clickable call-to-actions or campaigns with immediate incentives (e.g. “click here to see who won the sweepstake”) that lead to a non-representative high response, have not been taken into consideration.
Bounces– emarsys Email Benchmark Report 2012 – asian Edition3
Fig. 2: Average bounce rates, comparing B2B to B2Cthe performance in both the B2C and B2B sectors, which was good in 2010, has further improved last year.
Bounces (in %)
Bounces: First Mailings
Fig. 1: Average bounce rates in a year-on-year comparison the trend continues: In 2011, the bounce rates have once again improved getting lower in both first mailings and on-going campaigns.
Bounces: Ongoing Campaigns
7.89 %
6.79 %
14.59 %
8.29 %
10.86 %
2.50 %
1.84 %
4.62 %
2.86 %
3.08 %
B2B First Mailings B2B ongoing
Bounces B2B vs B2C (in%)
15.17 %
8.87 %
10.45 %
7.05 %
7.85 %
6.13 %
3.88 %
4.09 %
2.90 %
2.49 %
B2C First Mailings B2C ongoing
3.56 %
2.36 %
2.75 %
2.36 %
1.73%
14.09 %
8.13 %
11.03 %
8.00 %
6.64 %
2007
2007
2007
2008
2008
2008
2009
2009
2009
2010
2010
2010
2011
2011
2011
emarsys Email Benchmark Report 2012 – asian Edition – Open Rate
B2B
Fig. 4: Average open rate (HTML recipients only), comparing B2B to B2Cas already indicated by the overall results for the total open rate, open rates decrease slightly for both the B2B and the B2C sector. a notable factor is that in the B2C sector, the return rate is significantly smaller than last year.
Open Rate (in %)
Fig. 3: Average open rate (recipients of HTML emails only)the open rate shows another decrease; however, the decline in percentage is significantly smaller than last year.
Open Rate B2B vs. B2C (in %)
34.9 %
30.24 %
25.07 %
22.73 %
29.29 %
B2C
37.33 %
32.19 %
31.11 %
27.90 %
25.21 %
33.18 %
28.56 %
28.02 %
24.04 %
22.18 %
4
2007
2007
2007
2008
2008
2008
2009
2009
2009
2010
2010
2010
2011
2011
2011
Email Benchmark Report 2012 - Asian Edition
Click Rate– emarsys Email Benchmark Report 2012 – asian Edition5
B2B unique B2B total
Fig. 6: Individual (min. 1 click/recipient) and total (all clicks) click rates when comparing B2B to B2CFor B2B companies, there is a small increase for both individual click rates and the total amount of clicks. this becomes even more noticeable for B2C companies with regard to both first and on-going mailings.
Click Rates (in%)
Fig. 5: Individual (min.1 click/recipient) and total (all clicks) click rates in a year-on-year comparisonafter years of steady decline there is a positive trend to be observed: In 2011, clicks increased once again. Both the individual click rate and the total click rate increase by half a percentage point last year.
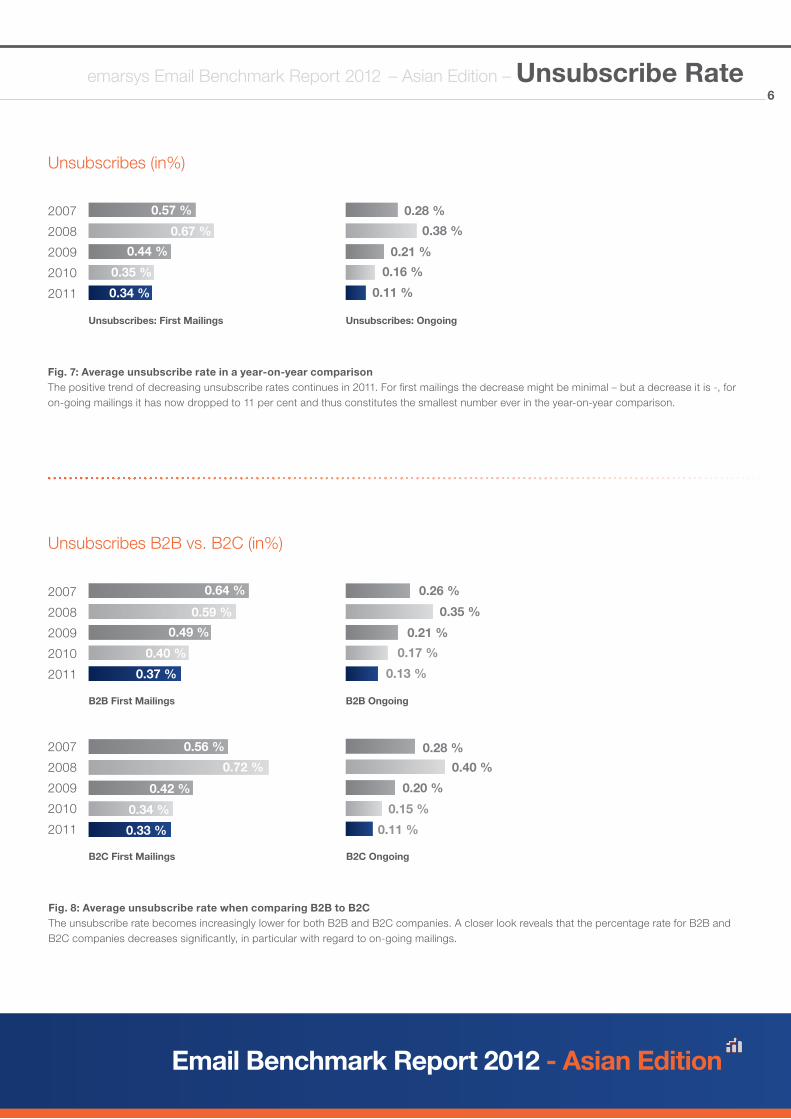
Fig. 8: Average unsubscribe rate when comparing B2B to B2Cthe unsubscribe rate becomes increasingly lower for both B2B and B2C companies. a closer look reveals that the percentage rate for B2B and B2C companies decreases significantly, in particular with regard to on-going mailings.
Unsubscribes (in%)
Fig. 7: Average unsubscribe rate in a year-on-year comparison the positive trend of decreasing unsubscribe rates continues in 2011. For first mailings the decrease might be minimal – but a decrease it is -, for on-going mailings it has now dropped to 11 per cent and thus constitutes the smallest number ever in the year-on-year comparison.
Unsubscribes B2B vs. B2C (in%)
B2C First Mailings B2C Ongoing
Unsubscribes: First Mailings Unsubscribes: Ongoing
0.57 %
0.67 %
0.44 %
0.35 %
0.34 %
0.28 %
0.38 %
0.21 %
0.16 %
0.11 %
0.64 %
0.59 %
0.49 %
0.40 %
0.37 %
0.26 %
0.35 %
0.21 %
0.17 %
0.13 %
0.56 %
0.72 %
0.42 %
0.34 %
0.33 %
0.28 %
0.40 %
0.20 %
0.15 %
0.11 %
6
2007
2007
2007
2008
2008
2008
2009
2009
2009
2010
2010
2010
2011
2011
2011
Email Benchmark Report 2012 - Asian Edition
Industries Bounces Clicks Unique Clicks Total Open Rate Unsubscribes
Comparing Industries– emarsys Email Benchmark Report 2012 – asian Edition
In 2011, the highest open rate was tracked for companies in the administration and energy sectors, followed by publishing and media companies and producers of industry and consumer goods. the highest click rate, on the other hand, can be observed in the education and consulting sectors.
Comparing Industries in 2011
7
emarsys Email Benchmark Report 2012 – asian Edition – Comparing Industries for the Last Two Years8
Bounces Unique Clicks
Education/ Consulting
Non-Profit
Publishing/Media
Retail/ E-Commerce
Travel/Leisure
Administration/ Energy
Financial Services
Industrial/ Consumer Goods
Marketing/ Agencies
Technology/Telecom
Pharmaceutical/ Health
Daily Deal
8.51 %
7.11 %
8.04 %
3.28 %
3.28 %
2.98 %
4.07 %
4.03 %
3.64 %
2.20 %
1.68 %
2.15 %
3.01 %
2.45 %
1.51 %
5.85 %
5.64 %
3.99%
5.38 %
9.09 %
6.60 %
6.37 %
9.26 %
7.52 %
8.13 %
8.15 %
8.04 %
2.42 %
3.62 %
2.35 %
2.85 %
4.28 %
5.86 %
2.66 %
1.02 %
1.28 %
3.17 %
1.88 %
5.74 %
6.06%
7.19 %
8.56 %
5.62 %
6.83 %
7.44 %
6.53 %
2010 2011
Email Benchmark Report 2012 - Asian Edition
Comparing Industries for the Last Two Years– emarsys Email Benchmark Report 2012 – asian Edition 9
total Clicks Open Rate
Education/ Consulting
Non-Profit
Publishing/Media
Retail/ E-Commerce
Travel/Leisure
Administration/ Energy
Financial Services
Industrial/ Consumer Goods
Marketing/ Agencies
Technology/Telecom
Pharmaceutical/ Health
Daily Deal
15.88 %
25.83 %12.83 %
15.02 %
12.42 %
26.41 %16.87 %
10.73 %
10.43 %
14.90 %
7.73 %
11.58 %
9.08 %
5.88 %
22.40 %
14.51 %
25.33 %
21.72 %
29.49 %
21.68 %
22.51 %
30.35 %
27.82 %
28.65 %
13.05 %
23.36 %17.78 %
14.74 %
10.41 %
22.92 %13.64%
10.62 %
8.44%
13.87%
10.55 %
10.13%
9.90 % 24.98 %
25.17 %
18.76 %
27.94 %
20.79 %
21.60 %
25.41 %
21.44 %
34.74 %
2010 2011
Comparing Industries for the Last Two Years– emarsys Email Benchmark Report 2012 – asian Edition
Unsubscribes
10emarsys Email Benchmark Report 2012 – asian Edition – Comparing Industries for the Last Two Years
Education/ Consulting
Non-Profit
Publishing/Media
Retail/ E-Commerce
Travel/Leisure
Administration/ Energy
Financial Services
Industrial/ Consumer Goods
Marketing/ Agencies
Technology/Telecom
Pharmaceutical/ Health
Daily Deal
0.21 %
0.22 %
0.18 %
0.28 %
0.15 %
0.01 %
0.13 %
0.14 %
0.15 %
0.17 %
0.11 %
0.08 %
0.19 %
0.20 %
0.13 %
0.18 %
0.14 %
0.08 %
0.33 %
0.08 %
0.10 %
0.17 %
0.12 %
2010 2011
Email Benchmark Report 2012 - Asian Edition
Comparing Languages– emarsys Email Benchmark Report 2012 – asian Edition11
Languages Bounces Clicks Unique Clicks Total Open Rate Unsubscribes
German 1.69 7.50 12.28 27.04 0.13
English 1.93 4.62 7.69 15.94 0.12
Spanish 4.02 5.38 8.07 16.84 0.06
Italian 2.51 5.19 8.29 21.48 0.09
Chinese 3.46 2.29 3.60 13.91 0.02
Dutch 1.67 7.54 11.38 22.18 0.20
French 1.73 5.75 9.32 19.32 0.16
Swedish 1.14 9.25 13.09 21.82 0.17
Norwegian 1.62 10.27 14.78 23.27 0.13
Finnish 1.77 17.28 23.00 29.11 0.14
Polish 1.74 10.84 16.37 17.08 0.06
Hungarian 1.04 5.00 6.97 17.97 0.09
Czech 0.90 8.31 12.82 14.72 0.13
Danish 1.39 13.22 18.34 29.42 0.10
Comparing Languages in 2011
a noticeable fact is the ongoing positive trend for both open rate and click rate in Scandinavian campaigns. Finnish and Danish campaigns lead in both open rate and click rate and thus achieve the best results when comparing languages.
emarsys Email Benchmark Report 2012 – asian Edition – Comparing Languages for the Last Two Years
Bounces Unique Clicks
12
English
Dutch
Swedish
Norwegian
Polish
German
Spanish
Italian
Chinese
Finnish
French
Hungarian
Czech
Danish
3.44%
1.88 %
1.28 %
2.41%
2.98 %
2.25 %
4.23 %
3.35 %
2.57 %
2.53 %
2.83 %
4.35 %
2.58 %
0.91 %
4.41%
7.68 %
7.70 %
10.49%
8.05 %
7.37 %
4.07 %
5.45 %
1.15 %
11.64 %
6.31 %
7.32 %
9.79 %
13.90 %
1.93 %
1.67 %
1.14 %
1.62 %
1.74 %
1.69 %
4.02 %
2.51 %
3.46 %
1.77 %
1.73 %
1.04 % 5.00 %
0.90 %
1.39 %
4.62 %
7.54 %
9.25 %
10.27 %
10.84 %
7.50 %
5.38 %
5.19 %
2.29 %
17.28 %
5.75 %
8.31 %
13.22 %
2010 2011
Email Benchmark Report 2012 - Asian Edition
Comparing Languages for the Last Two Years– emarsys Email Benchmark Report 2012 – asian Edition13
total Clicks Open Rate
English
Dutch
Swedish
Norwegian
Polish
German
Spanish
Italian
Chinese
Finnish
French
Hungarian
Czech
Danish
7.83 %
12.17 %
11.01%
18.65%
13.23 %
12.08 %
6.45 %
9.30 %
3.87%
16.38 %
10.59 %
11.77 %
16.57 %
20.10 %
17.50%
25.94 %
22.13 %
25.05%
18.67 %
29.26 %
17.87 %
25.65 %
28.50 %
26.13 %
23.33 %
27.29 %
20.81 %
27.07 %
7.69 %
11.38 %
13.09 %
14.78 %
16.37%
12.28 %
8.07 %
8.29 %
3.60%
23.00 %
9.32 %
6.97 %
12.82 %
18.34 %
15.94 %
22.18 %
21.82%
23.27 %
17.08 %
27.04 %
16.84 %
21.48%
13.91%
29.11 %
19.32%
17.97 %
14.72%
29.42 %
2010 2011
Comparing Languages for the Last Two Years– emarsys Email Benchmark Report 2012 – asian Edition
Unsubscribes
14
English
Dutch
Swedish
Norwegian
Polish
German
Spanish
Italian
Chinese
Finnish
French
Hungarian
Czech
Danish
0.17%
0.29 %
0.21 %
0.16%
0.07 %
0.17 %
0.05 %
0.08 %
0.01 %
0.21 %
0.17 %
0.13 %
0.12 %
0.13 %
0.12 %
0.20 %
0.17 %
0.13 %
0.06 %
0.13%
0.06 %
0.09 %
0.02 %
0.14 %
0.16 %
0.09 %
0.13 %
0.10 %
emarsys Email Benchmark Report 2012 – asian Edition – Comparing Languages for the Last Two Years
2010 2011
Email Benchmark Report 2012 - Asian Edition
Summary of resultsthis year’s benchmark report shows that there has been a general positive increase on the number of clicks despite a small decline in the overall open rates in western countries as well as in Chinese-speaking ones. this trend is applicable to both B2B and B2C. Unsubscribe rates and bounce rates continue to fall (except in Chinese-speaking countries) indicating that the improvement in quality of email addresses and database cleansing continues. While nearly all figures are at their lowest level since our records began 10 years ago, Chinese regions experience a slight surge in bounces and unsubscribes. the recent rise in internet usage which leads to an increase in inactivated email accounts may skew and undermine the increase in these numbers, yet this may also hint that Chinese senders require more aggressive data-cleansing.
Major industry and language differencesthe Scandinavian countries continue to dominate the open and click rate although the Finnish have overtaken the Danish from last year on clicks with an impressive 17.28%.English and Chinese click rates remain the lowest whilst Germany slipped from top position last year on open rates to third. With regards to industries, there doesn’t seem to be any particular trend taking place, as last year’s industry/consumer led in the open rate but this year administration/energy took pole position. But despite the high open rates they only came third in clicks. the emergence of the ‘daily deal’ sector (now in a separate category) had the lowest overall open and click rate with 14.5% and 3.99% respectively.
Why are there signs of improvement in click rate despite lower open rates? there may be many reasons for improvement in clicks, despite the fall in open rates. One reason may be that more focused messages are being delivered to a more segmented and targeted audience. the ‘one size fits all’ email is at last showing signs of decline as customers become more selective in the communications they wish to receive.another reason may be that with the ever increasing amount of email received, there is ‘inbox clutter’ where emails fight for attention. Poor subject lines that aren’t compelling, despite the more focused approach, cannot stand out amongst the ‘clutter’ and therefore may not be opened.Email clients now by default, do not display images on first opening. this means that some emails may be read without graphics, (a requirement for tracking open rates), and are not recorded in this report.
Summary of Results and Recommendations– emarsys Email Benchmark Report 2012 – asian Edition15
Recommendations
a report from Radicati Group indicates that email continues to grow with some 294 billion email messages sent globally each day - Our inboxes are continually populated with more and more irrelevant messages. SPaM arriving into your inbox has now almost been eradicated with sophisticated filters at both the ISP and on the desktop but what we still receive is overwhelming and getting your messages read continues to be challenging. Emails with compelling and relevant subject lines that are tested using a/B or multi-variant testing will continue to see improvements in both opens and clicks.
Whilst years ago, people would tend to ‘eyeball’ every email, our time is now more valuable and we open less emails as a percentage of what we receive. If you want to get your email read, you have to ensure relevant and attention-grabbing subject lines that are tested using a/B or multi-variant testing before sending. Have interesting focused content, and offers that are targeted to the recipient’s preferences. In essence great content and good data will be even more valuable in the future.
More than ever customers are reading their email on mobile devices. ReturnPath predict that by the end of 2012 more email will be opened on mobile devices than desktops. this means that sending desktop ready emails only will mean that fewer emails will be read and even fewer will be actioned. econsultancy suggests that a whopping 41% of emails not optimised for mobile will either be closed or deleted, destined never to be opened on a desktop and read as you intended. Our thoughts for the coming year are: if you don’t optimise for both desktop and mobile don’t be surprised that next year the open and click figures will be markedly less than this year.
about emarsys
emarsys is one of the largest providers of email, mobile and social marketing automation solutions in the world sending out over 50 billion emails each year on behalf of more than 1000 ‘blue chip’ clients such as eBay, Volvo, Garmin, a.S. Watson, Zurich and timeOut.
Our industry leading solution is designed to meet the complex needs of our customers, providing all you need for driving multi-channel online marketing success and increasing ROI - through the most comprehensive email, mobile, and social media marketing automation solutions in combination with our unrivalled deliverability expertise.
emarsys Email Benchmark Report 2012 – asian Edition – About emarsysSummary of Results and Recommendations– emarsys Email Benchmark Report 2012 – asian Edition16
VIENNA • LONDON • MUNICH • BERLIN • ZURICH • PARIS • HONG KONG • BEIJING • MOSCOW • ISTANBUL
35.7%48.5%
30.5%
32.5%15.21%
13.11%
12.24%
29.81%
69.77%
18.21%25.09%
18.21%
29.09%
15.01%90%
25.4%
27.5% 41.5%
27.5%14.32%
6.60%
12.5%
30.5%15.21%
15.01%27.5%
13.5%
32.5%
29.0%
27.5%
30.5%
Contact Us
emarsys LtdUnit F, 5/F China Overseas Building, 139 Hennessey RoadWanchaiHong Kong
Phone: +852 3168 2500Fax: +852 3168 2515
emarsys WorldwideViennaLondon Munich Berlin ZurichParis Hong Kong Bejing MoscowIstanbul
Stay up-to-date with email marketing best practice advice. Subscribe to our e-newsletter at www.emarsys.com