Page 1
Session 5: Emission accounts
(focus on greenhouse gas emissions)
1
E-TRAINING ON THE COMPILATION AND APPLICATION OF
ENVIRONMENTALLY EXTENDED SUPPLY-USE TABLES (EE-SUTS)
IN AFRICA
Dr. Michael Vardon
Expert and Advisor
[email protected]
March-April 2018
Dr. Anand Sookun
Expert and Advisor
[email protected]
Page 2
Economic Commission for Africa
www.uneca.org
Outline of the Presentation
A. Why emissions accounts?– Why greenhouse gas emissions (e.g. carbon dioxide, CO2)
B. Emission issues– Climate change
C. Overview of Emission accounting
D. The general structure of the emissions account– greenhouse gas emissions account
E. Data sources and approaches
F. Account presentation and communication
G. Questions and homework
Page 3
Economic Commission for Africa
www.uneca.org
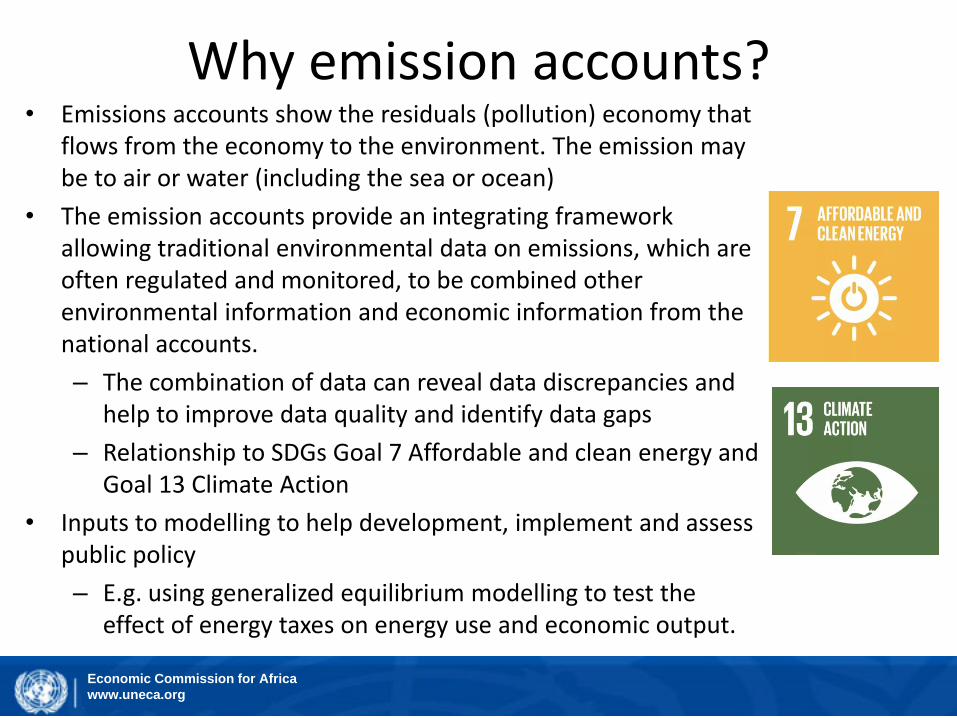
Why emission accounts?• Emissions accounts show the residuals (pollution) economy that
flows from the economy to the environment. The emission may be to air or water (including the sea or ocean)
• The emission accounts provide an integrating framework allowing traditional environmental data on emissions, which are often regulated and monitored, to be combined other environmental information and economic information from the national accounts.
– The combination of data can reveal data discrepancies and help to improve data quality and identify data gaps
– Relationship to SDGs Goal 7 Affordable and clean energy and Goal 13 Climate Action
• Inputs to modelling to help development, implement and assess public policy
– E.g. using generalized equilibrium modelling to test the effect of energy taxes on energy use and economic output.
Page 4
Economic Commission for Africa
www.uneca.org
Climate change
Link of climate change and greenhouse gas emissions
• Climate change will change patterns of economic production (e.g. to agricultural yields)
• Reducing greenhouse gas emissions will require changes in production and consumption
Page 5
Economic Commission for Africa
www.uneca.org
Increasing greenhouse gas emissions
Total global emissions are increasing
Action to limit emissions
• The United Nations Framework Convention on Climate Change (UNFCC) 1992
– Kyoto Protocol 1997
– Paris Agreement 2015https://data.worldbank.org/indicator/EN.ATM.GHG
T.KT.CE
Page 6
Economic Commission for Africa
www.uneca.org
The System of Environmental-Economic Accounting (SEEA)
• Linking environmental and economic information related to emissions
• Combines physical information of emissions to air, land or water with economic information from the System of National Accounts (SNA)
• Air emissions covered in Section 3.6.3 of the SEEA Central Framework– “Emissions to air are gaseous and particulate
substances released to the atmosphere by establishments and households as a result of production, consumption and accumulation processes. The SEEA air emissions account records the generation of air emissions by resident economic units, by type of substance.”
Page 7
Economic Commission for Africa
www.uneca.org
Residence and territory principles: a key difference between air emission accounts and statistics (including
UNFCCC greenhouse gas inventory reporting)
Source: Manual for Air Emissions Accounts
Page 8
Carbon cycle
Source SEEA EEA, Fig. 4.1
Page 9
9
592 at 1750 (pre industrial revolution)
+244 from 1750 to 2012
Source: Fig 1, Ajani and Comisari 2014, Carbon accounting in Australia https://coombs-
forum.crawford.anu.edu.au/sites/default/files/publication/coombs_forum_crawford_anu_edu_au/2014-
09/carbon_accounting_discussion_paper_revised_sept_2014.pdf, prepared using Global Carbon Project; Feely et al. 2004; Holmém
2000; Lal 2004; Steffen and Hughes 2013.
Atmosphere
836 ±0.21a+ 5.2 ±0.2 during 2012
BiosphereOceans
a. Atmospheric CO2 reported in parts per million (ppm) was converted to tonnes of C using Carbon Dioxide Information Analysis Centre.
b. For carbon stocks in soil inorganic carbon, methane clathrates, carbonate rocks, marine sediments and Earth’s crust, see Ajani et al. 2013
Fig 1 and cited references.
All figures are Gt C
(giga (billion) tonnes
carbon)
Permanent removals from atmosphere
- 0.1 a year
(carbon deposits on ocean floor)
Geosphere
Fossil fuels
10 000b
Surface ocean 900
Deep ocean 36 400
Global carbon stocks and flows
+163 maximum 2013 to 2050
to stay within 2o warming limit
Biomass 560
Soil organic carbon
1600
Page 10
Carbon stock account
SEEA EEA, Table 4.6
Page 11
Economic Commission for Africa
www.uneca.org
Inclusion of the atmosphere as a asset
• Netherlands 2017 London Group Paper
https://seea.un.org/sites/seea.un.org/files/l
g23_the_seea_eea_carbon_account_lg20
17.pdf
Page 12
Economic Commission for Africa
www.uneca.org
Eurostat Manual for Air Emission Accounts
• Consistent with SEEA
• Latest edition 2015
• It has eight (8) chapters– Introduction
– Conceptual foundations
– Reporting to Eurostat
– Emission model and overview of compilation approaches
– Data access
– Adjusting data to residence principle
– Assigning emissions to economic activities
– Uses of air emissions accounts
• Only in Englishhttp://ec.europa.eu/eurostat/
web/products-manuals-and-
guidelines/-/KS-GQ-15-009
Page 13
Economic Commission for Africa
www.uneca.org
Key industries for air emission accounts
• Agriculture
• Mining
• Manufacturing
• Electricity
• Transport
• Also emission from landfills
Industry classification should be by ISIC Revision 4 http://unstats.un.org/unsd/cr/registry/default.asp
Page 14
Economic Commission for Africa
www.uneca.org
SEEA Central Framework: Air emission account (table 3.7)
Page 15
Economic Commission for Africa
www.uneca.org
Air emission account
• Not as large as some of the other accounts (e.g. water and energy physical supply and use tables)
• This is because it is just looking at the supply of missions to the environment by the economy
• Columns showing industries, households and Rest of World, can be further subdivided, e.g.
– Electricity industry can be shown
– Mining, manufacturing and transport can be further subdivided
• Note these is already a a division within households showing “transport”, “heating” and “other”
Page 16
Economic Commission for Africa
www.uneca.org
Greenhouse gas emissions account (CO2 equivalent)
Source: Michael Vardon, ANU
Agriculture Mining Manufacturing Electricity Transport All other
industries Transport Heating Other
Greenhouse gases
Carbon dioxide (CO2) - - - -
Methane (CH4) - - - -
Nitrous oxide (N2O) - - - -
Ozone (O3) - - - -
Chlorofluorocarbons (CFCs) - - - -
Hydrofluorocarbons (HFCs and HCFCs) - - - -
Other - - - -
TOTAL Greenhouse gases - - - - - - - - - - - - - -
TOTAL SUPPLY
(GHG to
environment) Subtotal
households
SUPPLY
TOTAL USE (GHG
by environment) Emissions
from land fill
Households IndustrySubstotal
industry
Page 17
Economic Commission for Africa
www.uneca.org
Carbon Dioxide equivalent(CO2 equivalent or CO2 e )
Source IPCC 2007, IPCC Fourth Assessment Report:
Climate Change 2007. Intergovernmental Panel on Climate
Change. Cambridge University Press, Cambridge
Used so that different greenhouse gases can be aggregated together
Page 18
Water (freshwater, sea and oceans)
HouseholdsTransport
Simplified diagram of air and water emissions (physical units, e.g. tonnes)
Key
Emissions to water
Emission to air
Source: Michael Vardon, ANU
Air (Atmosphere)
ElectricityMiningAll other
IndustriesAgriculture ManufacturingWater supply
& Sewerage
Page 19
Households
(transport)
Transport
Diagram of flows of greenhouse gas emissions
(CO2 equivalent)
Key
Greenhouse gas emission to air
Source: Michael Vardon, ANU
Air (Atmosphere)
ElectricityMiningAll other
IndustriesAgriculture Manufacturing Landfill
Households
(heating)
Households
(other)
Page 20
Example diagram and table flows of greenhouse gas emissions (CO2 equivalent)
Greenhouse gas emission to air
Source: Michael Vardon, ANU
Households
(transport)
Transport
Air (Atmosphere)
ElectricityMining
13
All other
IndustriesAgriculture Manufacturing
27 74 152 41 28
35
Landfill
Households
(heating)
Households
(other)
8
1
13
Agriculture Mining Manufacturing Electricity Transport All other
industries Transport Heating Other
Greenhouse gases
Carbon dioxide (CO2) 10 20 60 150 40 25 305 35 7 42 10 357 357
Methane (CH4) 2 6 7 1 16 1 1 2 19 19
Nitrous oxide (N2O) 1 1 2 - 1 3 3
Ozone (O3) 1 2 3 - 3 3
Chlorofluorocarbons (CFCs) 4 2 6 1 1 7 7
Hydrofluorocarbons (HFCs and HCFCs) 2 1 3 - 3 3
Other 0 - - -
TOTAL Greenhouse gases 13 27 74 152 41 28 335 35 8 1 44 13 392 392
TOTAL SUPPLY
(GHG to
environment)
TOTAL USE (GHG
by environment) Subtotal
households
Emissions
from land fill
SUPPLY
IndustrySubstotal
industry
Households
Page 21
Economic Commission for Africa
www.uneca.org
Data sources
UNFCCC report
Energy accounts or statistics
Electricity industry reporting /statistics/survey
Transport reporting /statistics/surveys
Administrative information
Household survey or census
Page 22
Economic Commission for Africa
www.uneca.org
UNFCCC Greenhouse Gas Inventory Reporting
• National emission inventories are detailed and elaborated data systems including
• They provide an excellent data source for GHG accounts
• Liaise closely with the compilers of the inventory
Source: Eurostat Manual for Air Emission Accounts, Fig 6.
Page 23
Economic Commission for Africa
www.uneca.org
Greenhouse gas inventory reporting
By six activity based categories
• Energy
• Industrial processes
• Solvent
• Agriculture
• Waste
• LULUCF (Land use and cover change)
http://di.unfccc.int/ghg_p
rofile_non_annex1
http://unfccc.int/resource/docs/publicati
ons/08_unfccc_kp_ref_manual.pdf
Page 24
Economic Commission for Africa
www.uneca.org
Energy accounts (or statistics) to greenhouse gas emissions accounts
The so-call energy first approach
• Using coefficients you can convert use of fossil fuels to the CO2
equivalent emissions
Source: Eurostat Manual for Air Emission Accounts, Fig 7.
Page 25
Economic Commission for Africa
www.uneca.org
Issues likely requiring residence adjustments
Source: Eurostat Manual for Air Emission Accounts, Table 4.
Page 26
Economic Commission for Africa
www.uneca.org
Tools and guidelines
https://www.epa.gov/energy/greenhouse-gas-equivalencies-
calculator
https://www.ipcc-
nggip.iges.or.jp/public/2006gl/
Page 27
Economic Commission for Africa
www.uneca.org
Examples of emission accounts
• Australia• Sweden• Canada • EU countries (e.g. UK,
France, Germany, Netherlands, Sweden)
• Botswana energy account also includes information on CO2 emissions from electricity generation and coal
https://www.wavespartnership.org/sites/waves/files/kc/Botswana%2
0Energy%20Accounts%20Technical%20Report_final.pdf
http://www.abs.gov.au/ausstats/[email protected] /Latest
products/4604.0Main%20Features12015-
16?opendocument&tabname=Summary&prodn
o=4604.0&issue=2015-16&num=&view=
Page 28
Economic Commission for Africa
www.uneca.org
Communication of accounts• Tables are not enough
• Figures and graphics
• Explanatory text highlighting key figures and trends
• Presentations and meetings with key stakeholders
• Uses (e.g. Nationally Determined Contributions)– Indonesia
WAVES Briefing: Focusing on
energy and climate changehttps://www.wavespartnership.org/sites/waves/file
s/kc/Energy%20thematic%20doc_FINAL.pdf
https://resource.wur.nl/nl/show/
Peat-bog-emissions-nullify-
what-forests-store.htm
Page 29
Economic Commission for Africa
www.uneca.org
Indicators from emissions accounts
• Comparisons between industries
• Decoupling (absolute and relative)
• Intensity measures
Source: Manual for air emission accounts , Figs. 11, 12 & 13
2011
EU-28
EU-28EU-27
Intensity measures. Kg of CO2 equivalents per euro of GVADecoupling of air emissions from value added
Environmental-economic profiles of CO2 emissions for
selected industries
Page 30
Economic Commission for Africa
www.uneca.org
Consumption versus production view of greenhouse gases
• The difference is between imports and exports
• Net exporters would have higher emissions than net importers using the production approach (and vice versa for the consumption approach)
Source: ABS Completing the Picture, Fig 2.3
http://www.abs.gov.au/ausstats/[email protected] /Latestprod
ucts/4628.0.55.001Main%20Features1May%202012
Page 31
Economic Commission for Africa
www.uneca.org
https://www.wavespartnership.org/en/knowled
ge-center/natural-capital-accounting-action-
swedens-carbon-accounting-informs-its-
carbon-tax
Uses of emissions accounts in modelling and policy
• Input-output modelling
• Computable general equilibrium modelling
• Tax policy
– South Africa
– Sweden
– New Zealand
http://www.treasury.gov.za/publications/
other/GHG_Emissions_Intensity_Bench
marks_for_SA_Carbon_Tax.pdf
https://www.wavespartnership.o
rg/sites/waves/files/images/SEE
A%20and%20New%20Zealand
%20Carbon%20Tax.pdf
Page 32
Economic Commission for Africa
www.uneca.org
Questions
?
Page 33
Economic Commission for Africa
www.uneca.org
Homework
After reading Section 3.6 SEEA Central Framework please complete the worksheet provided
Please follow the instructions provided on the worksheet
33