E1 Office of the President TO MEMBERS OF THE COMMITTEE ON EDUCATIONAL POLICY: DISCUSSION ITEM For Meeting of May 15, 2013 ACADEMIC PERFORMANCE INDICATORS AT THE UNIVERSITY OF CALIFORNIA EXECUTIVE SUMMARY In this era of reduced State support for higher education, one of the untold stories is what the faculty and students of the University of California have accomplished, against all odds. As funding for UC core educational expenses declined by nearly $900 million and mandatory costs increased by $1.2 billion, the faculty stepped up, teaching more while also undertaking scholarly research and staying true to the University’s public service mission. Students, too, have met the challenges created by two decades of roller-coaster funding. Graduation rates for undergraduates have risen dramatically during the past 20 years, and it is taking less time than ever for them to complete their degrees. Meanwhile, academic and administrative efficiencies, in combination with painful program cuts and hiring restraints that largely protected the University’s instructional activities, have enabled UC campuses to maintain excellence in the educational enterprise while reducing costs. Yet it is likely that providing a quality education to undergraduate, graduate academic, and graduate professional students will be increasingly challenging. The governor has called for a five percent increase in State funding of UC for 2013-14, but significantly increased mandatory costs, including non-salary expenses such as contributions to health benefits and the retirement plan, are expected to consume most if not all of the additional funding. Moreover, there is no provision for enrollment growth, and a clear expectation that tuition will be frozen at this year’s level. This discussion item offers evidence that UC has so far found ways to progress in fulfilling its instructional mission despite fiscal impediments. It also provides context for both current realities and future possibilities and outlines potential components of strategies to support student and faculty success in the future. Key indicators of instructional performance show that to date the University has managed to sustain and even improve important outcomes for its students, almost always outperform other elite public universities, and sometimes match top private universities. Comparisons will typically be with the 28 U.S. public and 26 U.S. private universities that are members of the Association of American Universities (AAU), a consortium of 60 U.S. and two Canadian elite
Transcript
E1 Office of the President TO MEMBERS OF THE COMMITTEE ON EDUCATIONAL POLICY:
DISCUSSION ITEM For Meeting of May 15, 2013 ACADEMIC PERFORMANCE INDICATORS AT THE UNIVERSITY OF CALIFORNIA
EXECUTIVE SUMMARY In this era of reduced State support for higher education, one of the untold stories is what the faculty and students of the University of California have accomplished, against all odds. As funding for UC core educational expenses declined by nearly $900 million and mandatory costs increased by $1.2 billion, the faculty stepped up, teaching more while also undertaking scholarly research and staying true to the University’s public service mission. Students, too, have met the challenges created by two decades of roller-coaster funding. Graduation rates for undergraduates have risen dramatically during the past 20 years, and it is taking less time than ever for them to complete their degrees. Meanwhile, academic and administrative efficiencies, in combination with painful program cuts and hiring restraints that largely protected the University’s instructional activities, have enabled UC campuses to maintain excellence in the educational enterprise while reducing costs. Yet it is likely that providing a quality education to undergraduate, graduate academic, and graduate professional students will be increasingly challenging. The governor has called for a five percent increase in State funding of UC for 2013-14, but significantly increased mandatory costs, including non-salary expenses such as contributions to health benefits and the retirement plan, are expected to consume most if not all of the additional funding. Moreover, there is no provision for enrollment growth, and a clear expectation that tuition will be frozen at this year’s level. This discussion item offers evidence that UC has so far found ways to progress in fulfilling its instructional mission despite fiscal impediments. It also provides context for both current realities and future possibilities and outlines potential components of strategies to support student and faculty success in the future. Key indicators of instructional performance show that to date the University has managed to sustain and even improve important outcomes for its students, almost always outperform other elite public universities, and sometimes match top private universities. Comparisons will typically be with the 28 U.S. public and 26 U.S. private universities that are members of the Association of American Universities (AAU), a consortium of 60 U.S. and two Canadian elite
COMMITTEE ON -2- E1 EDUCATIONAL POLICY May 15, 2013
research universities. Six of UC’s nine general campuses are AAU members, an achievement that no other public university system comes close to matching. The following academic indicators present the most important of UC’s educational achievements:
For entering UC freshmen, four-year graduation rates have increased from 37 percent (1992 entering class) to 60 percent (2007 entering class); UC’s current rate is higher than AAU publics (53 percent) and lower than AAU privates (81 percent).
For entering UC freshmen, six-year graduation rates (which are a U.S. standard for comparisons among colleges and universities) have increased from 76 percent (1992 entering class) to 83 percent (2005 entering class); UC’s current rate is higher than AAU publics (76 percent) and lower than AAU privates (90 percent).
For entering UC transfers, two-year graduation rates have increased from 29 percent (1992 entering class) to 53 percent (2009 entering class).
For entering UC transfers, four-year graduation rates have increased from 77 percent (1992 entering class) to 85 percent (2007 entering class).
From 2006 through 2012, undergraduates reported consistently high levels of satisfaction with their overall academic experience (82 percent) and the quality of faculty instruction (89 percent) though their satisfaction with the cost of that education decreased from 71 percent to 60 percent.
For academic doctoral degrees, in a special study by the National Research Council, the percent of UC students finishing in six years (or eight years for arts and humanities) was overall higher than it was for the four comparison AAU publics for three of the five disciplinary areas and lower than it was for the four comparison AAU privates which were the highest in all five fields.
Time to the academic doctoral degree is exactly the same – 5.7 years – for UC, other AAU publics, and AAU privates.
These achievements can be attributed to many factors. The faculty role is key, of course. And faculty have done their part as shown by changes over time and comparisons with peer universities in the following productivity and effort indicators:
The number of bachelor’s degrees per UC ladder faculty member have increased from 5.5 in 2005-06 to 5.8 in 2010-11; UC’s current number is higher than AAU publics (4.3) and much higher than AAU privates (2.3).
The number of doctoral degrees per UC ladder faculty member have increased from 0.4 in 2005-06 to 0.5 in 2010-11; UC’s current number is higher than AAU publics (0.4) and the same as AAU privates (0.5). Putting the bachelor’s and doctoral degrees together shows that UC ladder faculty are graduating more undergraduate and doctoral students each year (6.3) than are AAU publics (4.7) and AAU privates (2.8).
The number of student credit hours (SCH) per ladder faculty member have increased from 693 in 1990-91 to 782 in 2010-11 (12.8 percent increase), with a 10.5 percent increase in SCH from 2005-06 to 2010-11. SCH is a better measure of faculty workload than is number of courses taught because it is a nationally recognized measure that simultaneously considers both unit-value of the course and the number of students enrolled.
COMMITTEE ON -3- E1 EDUCATIONAL POLICY May 15, 2013
UC can take a great deal of pride in these many accomplishments. At the same time, it must continually ask whether the greater efficiency, productivity, and faculty involvement in instruction have come at too high a cost to the quality of a UC education and/or to faculty attainments in the research and service parts of their jobs. Vigilance, creativity, and commitment to sustaining UC’s excellence in its teaching, research, and public service missions continue to be needed, particularly as the University faces a still uncertain future. If current trends should continue, instructional workload would continue to rise. A commonly used indicator of instructional workload is the student-faculty ratio, which has increased by 17.5 percent, from 20.0 to 23.5, over the last 20 years, but mostly over the last five, because of decreased funds to hire faculty and UC’s choice to continue to meet Master Plan commitments to undergraduate enrollment. If the recent trend continued over the next five years, the 20-year high student-faculty ratio would increase another 7.7 percent, to 25.4. Depending on UC’s financial circumstances, there could be tough choices to make about how best to sustain UC’s excellence as a public research university. Should circumstances and choices result in a further increase in instructional workload, UC will employ a wide variety of strategies to meet its responsibility to students. Ladder faculty will do their part. According to projections, on average, it would require another ten percent increase in student credit hours per ladder faculty member. At the same time, a wide variety of other strategies would be used. Many have been previously described to the Regents. An extensive compilation of strategies is provided toward the end of this report. They include, for example, ensuring that needed courses are available; providing roadmaps, such as degree audit systems, to timely degree completion; reviewing student progress regularly and providing academic counseling for those falling behind; offering high-quality online general education and gateway courses, plus online learning supplements for particularly challenging courses; and adjusting the balance of academic staffing so that more of the teaching is done by lecturers and other faculty who are not expected to excel at research as well as teaching. Whether or not instructional workload continues to increase, the University anticipates that even improvements in its fiscal environment will not obviate the need to increase academic effectiveness further. In doing so, UC will focus on outcomes (i.e., the goals to be accomplished) rather than inputs. The report ends with a proposed set of instructional outcomes addressing graduation rates, time to degree, and educational quality and the approach to achieving them. The methods for achieving them would be chosen by the individual campuses which can craft the strategies that best fit their local environments. The best way, that is, to sustain UC’s academic excellence in a period of continuing financial exigencies is to give the UC campuses and system the flexibility – as well as the resources and authority – they need in order to produce the desired outcomes for each campus and the University as a whole.
BACKGROUND In 1868, the newly created University of California and the University of California at Berkeley were one and the same. Today, Berkeley is one of ten campuses of the University of California system. The campuses range in age from 144 to eight. According to the Carnegie classification
COMMITTEE ON -4- E1 EDUCATIONAL POLICY May 15, 2013
system, eight are Research Universities (very high research activity), San Francisco is a Special Focus Institution, and Merced is not yet classified. Of the nine general campuses, six are members of the Association of American Universities (AAU), a consortium of the top U.S. and Canadian research universities. Each of the nine older campuses gets identified as one of the best in one or another rating/ranking system. All UC campuses have great strengths, and the younger general campuses are clearly following the same trajectory the older ones followed from fledgling to the equivalent of a full-blown world-class research university. California is one of just a few states with the population numbers, economic diversity, and natural and human resources to make this possible. It has been the only one with the ambition and foresight to do so. The 21st century has been a difficult one for institutions of higher education. Like most of them, UC has recently experienced an extraordinary reduction in the resources that traditionally supported its core teaching, research, and public service missions. Since 2007-08, State support dropped 27 percent, a reduction of nearly $900 million. Only a portion of these cuts plus the $1.2 billion in unfunded mandatory cost increases (38 percent) have been offset by increases in tuition and fees. State funds as well as student tuition and fees – UC core funds – have traditionally been the main revenue sources for faculty compensation, other instructional costs, and some staff compensation. In response to the recent extraordinary reductions in State funds, the campuses individually and as a system have focused on cost-saving efficiencies, new revenue sources, cessation of “non-essential” activities, and new ways of carrying out and funding the University’s teaching, research, and public service missions. There is clear evidence that through a wide variety of measures the campuses have achieved many academic efficiencies and sustained if not enhanced essential elements of UC’s excellence. Doing so has been a difficult and painful process that is not yet over. There are encouraging signs that there will be some greater predictability in the State’s funding for UC and some funding increases. Nonetheless, many believe the University must adjust to a new reality of permanently diminished State resources. In this environment, there is continuing collective interest in exploring options to ensure the University can sustain its core endeavors without compromising the excellence, innovation, and intellectual vitality that have fueled the State’s economy for almost 150 years and made UC the best public system of higher education in the nation. For a variety of reasons, including Regental interest, this report focuses primarily on the University’s instructional mission and the ladder faculty who are key to achieving that mission. Following brief sections on faculty responsibilities and work patterns, the report presents indicators of how and how successfully UC campuses have addressed their instructional mission. It includes information, as available, about changes in input and output over the last two decades and about how UC compares to similar institutions of higher education, particularly public research universities. The report ends with a discussion of the complex, and campus-specific, mix of levers that have been used to date and recommendations as to how best to move forward
COMMITTEE ON -5- E1 EDUCATIONAL POLICY May 15, 2013
as UC continues to adjust to its changed and still changing funding, always with the intention of sustaining and enhancing UC’s excellence as a world-class research university. FACULTY RESPONSIBILITIES UC’s mission-related activities in teaching, research, and public service are carried out by talented, committed people with a variety of titles and job descriptions (e.g., professor, professor-in-residence, lecturer, researcher, agronomist). As of October 2012, there were 19,368 headcount faculty (or the equivalent of 16,508 full-time faculty (FTE)); about half of these were ladder faculty, both tenured and non-tenured, in the professorial series; another 15 percent had “equivalent” titles (such as acting professor, lecturer with security of employment or potential security of appointment, astronomer or agronomist); the remainder held other faculty titles, such as lecturer, professor in residence, professor of clinical ___, visiting, adjunct or health sciences clinical professor. The 9,578 headcount (or 8,613 FTE) ladder faculty on whom this report focuses constitute the core of UC’s academic enterprise. The responsibilities of these faculty have been clear at least since 1935 when records show the then UC President promulgated them. Today, these responsibilities and resulting criteria for advancement “up the academic ladder” are codified in what is known as the Academic Personnel Manual (APM) and excerpted here.
APM 210-1 d. Criteria for Appointment, Promotion, and Appraisal. The review committee shall judge the candidate with respect to the proposed rank and duties, considering the record of the candidate’s performance in (1) teaching, (2) research and other creative work, (3) professional activity, and (4) University and public service…. Superior intellectual attainment, as evidenced both in teaching and research or other creative achievement, is an indispensable qualification for appointment or promotion to tenure positions [italics in the original]. Insistence upon these standards for holders of the professorship is necessary for maintenance of the quality of the University as an institution dedicated to the discovery and transmission of knowledge.
[NOTE: The term “creative work” is used to recognize the fact that “in certain fields such as, but not limited to, Art, Architecture, Dance, Music, Literature, and Drama, distinguished creation should receive consideration equivalent to that accorded to distinction attained in research. (The UCLA CALL, Appendix 5, Section V.B)] It is clear from the APM, and all UC ladder faculty experience this reality, that although they are all certainly teachers, their job is different from that of K-12 teachers, the model with which virtually everyone is familiar. It is different too from that of community college instructors or faculty counterparts at comprehensive (primarily baccalaureate or master’s) institutions. Ladder faculty cannot succeed at UC if they are not well-regarded, productive researchers, scholars, and creators as well as effective teachers and mentors. Moreover, both their teaching and their research must evidence superior intellectual attainment which must be sustained throughout their careers and affirmed in regular, post-tenure reviews. These realities are part and parcel of
COMMITTEE ON -6- E1 EDUCATIONAL POLICY May 15, 2013
working as ladder faculty in a research university with very high research activity or, simply put, of serving as a ladder faculty member at any UC campus. It is these realities too that bring outstanding undergraduate and graduate students to UC, to experience a high-quality education provided in a world-class research environment. ALLOCATION OF FACULTY TIME Most UC academic employees have flexible work schedules that include considerable time on campus during “usual weekday work hours,” as well as on or off campus during the weekends, early in the morning, and throughout the night. In the late 1970s and early 1980s, the Academic Senate and UC administration jointly sponsored a series of studies on how much full-time UC faculty from the then eight general campuses worked in a 24-hour a day, seven-day week and what they did when they were working. Faculty from all fields except dentistry, law, medicine, nursing, optometry, public health, and veterinary medicine participated. The participation rate was extraordinarily high – above 90 percent. Meticulously conducted by an independent group with external advisors, the work provided virtually the same picture each year. Different faculty participated each year, and no faculty member reported on more than two consecutive days Monday through Friday or both weekend days plus either Friday or Monday using a time log. The consistency of results and the expense of the undertaking led to a decision to stop conducting the survey. What did these studies show? Given the similarity of year-to-year findings, just the results from nearly 1,000 faculty who participated in the research in 1983-84 are described. During the academic year when classes were scheduled (i.e., not intersession or summer), faculty worked 61.3 hours in a seven-day, 24-hour a day week. Depending on whether one counted instruction in the context of faculty research activities, they spent 26.0 or 33.3 hours a week (54.3 percent of total work time) on instructional activities. Professional activity and university and public service took up another 12.1 hours a week. The remainder of the time (23.2 hours, 37.8 percent) was spent in research and other creative activity. Because of the way in which these time allocation studies were done, one can be confident that UC faculty in the late 1970s and early 1980s worked well beyond the standard 40 hours per week job and devoted the largest share of their time to instructional responsibilities. Those most familiar with typical work patterns of current UC faculty believe the same is true today. In fact, using data and informed estimates, a UC Berkeley dean (unaware of these earlier studies) recently came up with similar conclusions about total faculty work hours per week and the proportion of these hours devoted to instructional activities. The entire series of time allocation studies included activities in all four areas of UC ladder faculty responsibility, but they focused heavily on instructional activities. They were prompted by policymakers’ questions about faculty work habits, particularly their investment in instruction. Continued financial strains on UC today and the importance as well as public prominence of UC’s instructional mission have again focused attention on teaching. To address these questions thoughtfully, it is useful to understand the range of instructional activities ladder faculty perform and the synergistic integration of those activities with their research.
COMMITTEE ON -7- E1 EDUCATIONAL POLICY May 15, 2013
INSTRUCTIONAL ACTIVITIES OF LADDER FACULTY Instruction at the University’s ten campuses takes many forms and occurs in many settings. It includes but goes far beyond the most familiar image of a professor lecturing to students in a large auditorium or discussing with students around a seminar table. Selecting, preparing, updating, and, as needed, completely reworking course materials are integral parts of teaching. Likewise, instruction encompasses hours devoted to answering students’ questions, assisting them with challenging concepts, and providing an opportunity for exchange about specific course assignments. Instruction also involves mentoring and apprenticeship for most graduate students and many undergraduates. It also includes evaluation of students’ work, administration of exams, and supervision of teaching assistants, who increase in number as student enrollments increase. Given national accountability trends, ladder faculty and others who teach UC students must also devote effort to documenting student learning in ways that meet new expectations from both regional and professional accreditors. Less obvious but nonetheless critical are ladder faculty responsibilities for developing new courses, general education requirements, undergraduate capstones, and undergraduate and graduate degree programs. Ladder faculty also routinely review the content and structure of existing degree programs to ensure continued intellectual vitality, instructional rigor, and scholarly relevance. These departmental reviews occur roughly every seven years, but they may occur any time there are serious concerns about a degree program. Critical to quality assurance, the reviews involve a department self-study, surveys of students and faculty, performance indicators, and a site visit by campus and external ladder faculty. Collectively, these reviews support robust teaching and learning throughout the system. The balance of ladder faculty instructional efforts is embedded in research activities. In the conduct of their own research, ladder faculty supervise doctoral students as part of the learning process required for advanced degree programs. In labs, field stations, arts studios, and other settings, students receive instruction and guidance, as well as hands-on experience, in the conduct of original inquiry. Ladder faculty also co-author research and other scholarly reports with graduate students and often enough undergraduates.
Ladder faculty research also provides an important foundation for the entire undergraduate curriculum. UC undergraduates learn not only the basics of a field but also the big questions, the latest findings, and the methods by which scholarship is carried out. Not as well known is the fact that an increasing number of undergraduates participate directly in research. As of 2010-11, according to the 2012 University of California Undergraduate Experience Survey (UCUES), 56 percent of seniors had done some kind of research or creative project with faculty and 54 percent had taken at least one student research course. These experiences help develop the critical thinking, communication, and problem solving skills, as well as domain-specific knowledge, that employers are looking for and that are useful across many different careers, many different life circumstances, and in all areas of citizenship. In sum, ladder faculty provide undergraduate and graduate students with opportunities to learn in a wide variety of ways and circumstances, including regularly scheduled courses. Teaching often
COMMITTEE ON -8- E1 EDUCATIONAL POLICY May 15, 2013
occurs outside the classroom, and the many activities that comprise instruction are not captured in the very significant but not singular measure of the number of courses taught or number of hours a week in a regular classroom. To perform well as teachers, ladder faculty at a research university such as UC are expected to be on the cutting edge of their fields and to reflect their research and creative work in their multifarious instructional activities with undergraduate and graduate students alike. CHALLENGES TO UC’S EXCELLENCE IN INSTRUCTION It is well known that in recent years there have been both an extraordinary decrease in State funding for the University and also an extraordinary increase in mandatory costs to the University. The loss in operational funds has been only partially offset by tuition increases, cost savings, and revenue generation. Virtually every long-term UC employee today would report that she or he has a markedly increased workload. For UC faculty involved in instruction, a clear expression of the increasing instructional workload is the continuing increase in the student-faculty ratio. As shown below, over the last 20 years and particularly the last five years, the rate of growth of UC students has been much greater than the rate of growth of the faculty (Display 1) and consequently the student-faculty ratio has risen from 20.0 to 23.5 in 2010-11 (Display 2). This is a 17.5 percent increase in workload over 20 years, but much of the increase has occurred over the last five years. The “budgeted” student-faculty ratio remains as a distant memory at 18.7. The current student-faculty ratio varies across the campuses, in 2010-11 ranging from a low of 19 to a high of 29. The 23.5 student-faculty ratio is based on general campus student full-time equivalents and general campus faculty full-time equivalents (e.g., all faculty who participate in instruction, not just ladder faculty). If the student-faculty ratio only considered ladder faculty, then in 2010-11 it would be 31.8 systemwide (campus range from 27.7 to 37.9). Although ladder faculty, as previously described, have instructional responsibilities that are theirs alone, these other faculty contribute meaningfully to the work of instruction, and their greater or lesser employment in instructional roles is a choice every university makes as it seeks to ensure that ladder faculty have sufficient time to succeed in all aspects of their job – teaching, research and other creative work, professional activity, and University and public service.
COMMITTEE ON -9- E1 EDUCATIONAL POLICY May 15, 2013
Display 1: Actual and projected percent growth in numbers of students and of faculty, UC, 1990-91 to 2015-16
Student and Faculty Growth 1990‐91 to 2010‐11 with projections to 2015‐16
Student Full‐time‐equivalent Growth
Faculty Full‐time‐equivalent Growth
Projected student value if 2005‐2011 trend continues
Projected faculty value if 2005‐2011 trend continues
COMMITTEE ON -10- E1 EDUCATIONAL POLICY May 15, 2013
Display 2: Actual and projected increases in student-faculty ratio, UC, 1990-91 to 2015-16
Source: UCOP Institutional Research, Accountability methodology; see Display 1 for complete description of methodology.
In the face of the greater workload that the increase in students per faculty member represents, campuses have adopted a wide range of approaches to providing outstanding education to undergraduate, graduate academic, and graduate professional students, while also sustaining the University’s research and public service missions. With the exception of a limited number of systemwide administrative initiatives that have been reported to the Regents, each campus has crafted the mix and balance of approaches that are best suited to that campus. These have also been reported to the Regents. There is good evidence these approaches have not only sustained but also enhanced student achievement, done so without diminishing undergraduates’ positive perceptions of their UC academic experiences, and done so with increased instructional efforts from the faculty. The next sections present that evidence with a variety of academic indicators. It is one of the largely untold stories of what UC faculty, students, and staff have accomplished, against all odds. UNDERGRADUATE INSTRUCTION A variety of academic indicators suggest that, despite the evident challenges, the educational outcomes for UC’s undergraduates remain positive and some have continued to improve during
18
19
20
21
22
23
24
25
26
1990‐91
1991‐92
1992‐93
1993‐94
1994‐95
1995‐96
1996‐97
1997‐98
1998‐99
1999‐00
2000‐01
2001‐02
2002‐03
2003‐04
2004‐05
2005‐06
2006‐07
2007‐08
2008‐09
2009‐10
2010‐11
2011‐12
2012‐13
2013‐14
2014‐15
2015‐16
Student‐Faculty Ratio
Student‐Faculty Ratio
Projected value if 2005‐2011 trend continues
25.3
23.5
20.0
COMMITTEE ON -11- E1 EDUCATIONAL POLICY May 15, 2013
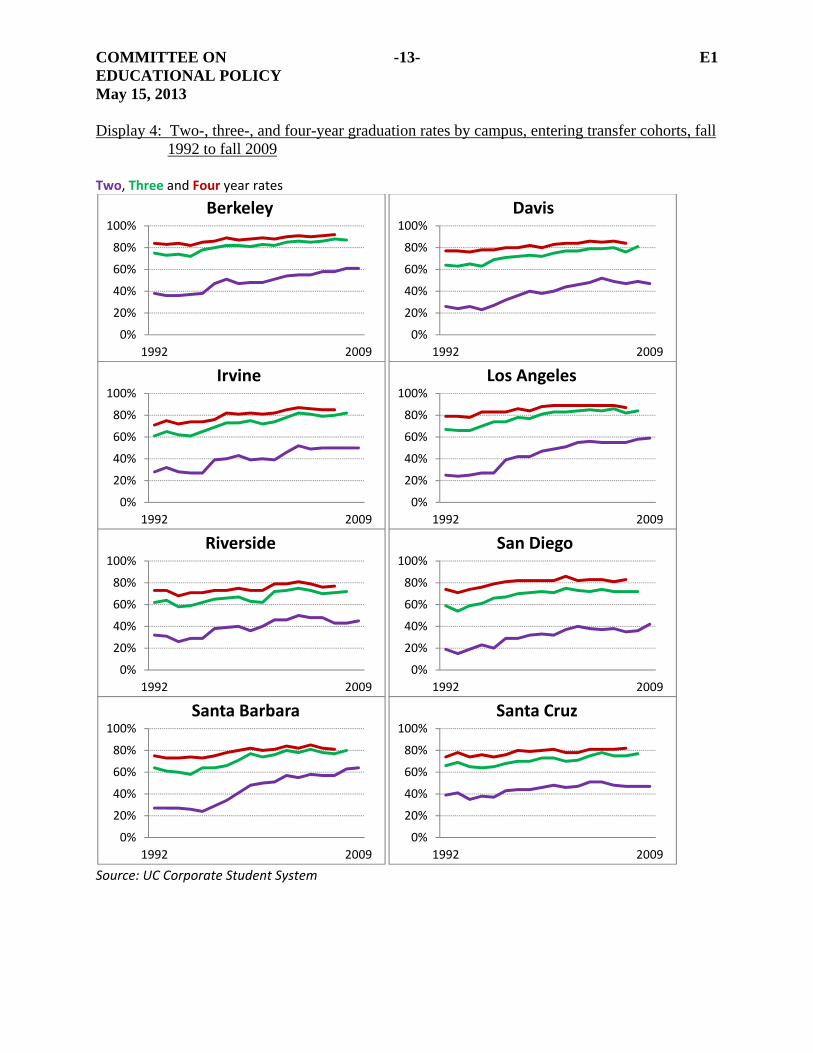
this time. There are also indicators that suggest that faculty have increased both their workload and their productivity during this period. Moreover, for many of these indicators UC does better than the average of other AAU public universities and about the same as AAU private institutions, which tend to have greater resources. Undergraduate graduation rates have increased and time to degree has decreased. All measures of UC undergraduate graduation rates and time to degree have improved over the last two decades for students who entered as freshmen and for those who entered as transfers. For those who entered as freshmen, four-year rates increased from 37 percent (1992 entering cohort) to 60 percent (2007 entering cohort. Six-year graduation rates, as defined by the Integrated Postsecondary Data Education System (IPEDS), are the nationally accepted performance measure of student success for those entering baccalaureate or higher degree-granting institutions as freshmen. Six-year rates increased from 76 percent (1992 entering cohort) to 83 percent (2005 entering cohort), slightly more than a ten percent increase. For undergraduates entering UC as transfers, two-year graduation rates increased from 29 percent (1992 entering cohort) to 54.4 percent (2010 entering cohort), an increase of 88 percent over that time period. Four-year graduation rates also increased from 77 percent (1992 entering cohort) to 85 percent (2007 entering cohort), an increase of almost nine percent. One of UC’s points of pride is that it educates many undergraduates who come from low-income families. In 2009-10, for example, 35 percent of all UC undergraduates were recipients of Pell Grants, awards available only to students from families with incomes under $50,000. In comparison, the University of Virginia had about 11 percent, University of Michigan, Ann Arbor, about 15 percent, Stanford, about 17 percent, and Illinois about 18 percent. Pell Grant students are as able and committed as are students from middle- and upper-income families, but all too often they have been less well-prepared by their K-12 schools for what college requires. In general, fewer complete the bachelor’s degree and those who do take longer compared to undergraduates who never had a Pell Grant. This is the case at UC as well; however, the differences between Pell and non-Pell Grant students are not as large. At UC, 80 percent of the freshmen who entered fall 2005 who received a Pell grant sometime during their undergraduate years graduated within six years. This 80 percent figure is lower than UC’s average but greater than or within three percentage points of the six-year graduate rates of four of the eight general campuses (Merced excluded). The 80 percent figure needs to be improved but it is also an interim achievement of which to be proud. Displays 3 and 4 provide details on graduation rates for students entering since 1992 at each campus. Merced is not included in these displays because it is too new to have meaningful trends. The campuses vary in where they were in 1992 and where they are now, but all have been increasing their four-year and two-year graduation rates for freshmen and transfers respectively, and all have room to increase these rates further. Doing so saves students and their families money, and increases the number of students UC can serve at the same cost. So long as the quality of the undergraduate academic experience is sustained, further increases in efficiency are a win-win for everyone.
COMMITTEE ON -12- E1 EDUCATIONAL POLICY May 15, 2013
Display 3: Four-, five-, and six-year graduation rates by campus, entering freshman cohorts, fall 1992 to fall 2007
Four, Five and Six year rates
Source: UC Corporate Student System
0%
20%
40%
60%
80%
100%
1992 2007
Berkeley
0%
20%
40%
60%
80%
100%
1992 2007
Davis
0%
20%
40%
60%
80%
100%
1992 2007
Irvine
0%
20%
40%
60%
80%
100%
1992 2007
Los Angeles
0%
20%
40%
60%
80%
100%
1992 2007
Riverside
0%
20%
40%
60%
80%
100%
1992 2007
San Diego
0%
20%
40%
60%
80%
100%
1992 2007
Santa Barbara
0%
20%
40%
60%
80%
100%
1992 2007
Santa Cruz
COMMITTEE ON -13- E1 EDUCATIONAL POLICY May 15, 2013
Display 4: Two-, three-, and four-year graduation rates by campus, entering transfer cohorts, fall 1992 to fall 2009
Two, Three and Four year rates
Source: UC Corporate Student System
0%
20%
40%
60%
80%
100%
1992 2009
Berkeley
0%
20%
40%
60%
80%
100%
1992 2009
Davis
0%
20%
40%
60%
80%
100%
1992 2009
Irvine
0%
20%
40%
60%
80%
100%
1992 2009
Los Angeles
0%
20%
40%
60%
80%
100%
1992 2009
Riverside
0%
20%
40%
60%
80%
100%
1992 2009
San Diego
0%
20%
40%
60%
80%
100%
1992 2009
Santa Barbara
0%
20%
40%
60%
80%
100%
1992 2009
Santa Cruz
COMMITTEE ON -14- E1 EDUCATIONAL POLICY May 15, 2013
UC’s graduation rates compare favorably to peer institutions, particularly the publics. Four- and six-year graduation rates for the 28 non-UC AAU publics averaged 53 percent and 76 percent respectively for the entering freshmen cohorts, fall 2003 – the most recent year for which comparable data are available; for the 26 AAU privates these averages were 81 percent and 90 percent respectively. Four- and six-year graduation rates at UC for the same 2003 entering freshman cohort were 57 percent and 82 percent. The most recent UC data show figures of 62 percent and 84 percent respectively. Clearly, both four- and six-year graduation rates at UC exceed those of the AAU publics but trail those of the AAU privates. Finding exactly the right comparison is really impossible. Because undergraduate degree completion and time to degree are hot-button topics these days and because UC campuses vary in their performance, a special group of “the best” AAU flagships of U.S. public university systems was selected and their performance compared to that of UC’s AAU campuses, as a further examination of UC’s performance. The results are shown in Display 5. Display 5: Six-year graduation rates, UC and leading AAU public flagships, entering freshman
cohorts, fall 1992, 1997 and 2005
1992 1997 2005
Berkeley 84% 86% 91% Davis 75% 78% 83%
Irvine 73% 78% 86%
Los Angeles 78% 87% 89%
Santa Barbara 73% 76% 82%
San Diego 81% 85% 86%UC AAUs 77% 82% 86%UC System 76% 80% 83%
COMMITTEE ON -15- E1 EDUCATIONAL POLICY May 15, 2013
UC’s average six-year graduation rates at its six AAU campuses (86 percent) exceed those of four of the six selected public AAU flagships. The exceptions are Michigan and Virginia. Six-year graduation rates at Berkeley (currently 91 percent) and Los Angeles (currently at 89 percent) are comparable to those at Michigan, but they do not reach the performance level of Virginia which, at 94 percent, has the highest six-year graduation rate for any public research university in the country. Overall, UC has improved its six-year graduation rates over time, has good rates absolutely and compared to peer institutions, and has room to improve still further. Undergraduates continue to be satisfied with their overall academic experience and the quality of faculty instruction. The best source of information about undergraduates’ experience at the University comes from UCUES, UC’s biennial survey of undergraduates. Remarkably, a very high percentage of students from 2006 through 2012 have been satisfied with their overall academic experience and with the quality of faculty instruction. (See Display 6.) Most importantly, the percentage has not decreased despite the many changes campuses have had to make as funding has decreased. The UCUES data were combed to be sure that these two very positive findings were not counterbalanced by negative findings. The only negative is undergraduates’ decreasing belief that the UC education they receive is a good value for the cost. Clearly this finding reflects the steep increases in tuition over the last few years. Overall, however, the UCUES data indicate that the efficiencies so far achieved have not substantially lowered students’ opinions about the overall quality of education they are receiving. Display 6: Undergraduate student satisfaction, UC, 2006 through 2012
Item 2006 2008 2010 2012
Overall academic experience 82% 83% 82% 82%
Quality of faculty instruction - 89% 89% 89%
Value of your education for the price you’re paying 71% 70% 63% 60% Source: University of California Undergraduate Experience Survey (UCUES), 2006‐2012; percent of students reporting that they are very satisfied, satisfied, or at least somewhat satisfied with their experiences at UC.
Faculty are graduating more undergraduate students and teaching more undergraduate and graduate students. There are many reasons why graduation rates for undergraduates have increased, their time to degree has decreased, and their satisfaction has remained high. Principal among them are the leadership and commitment of UC faculty. Here the focus is on increases in degree production and teaching by UC ladder faculty; other factors will be described later.
COMMITTEE ON -16- E1 EDUCATIONAL POLICY May 15, 2013
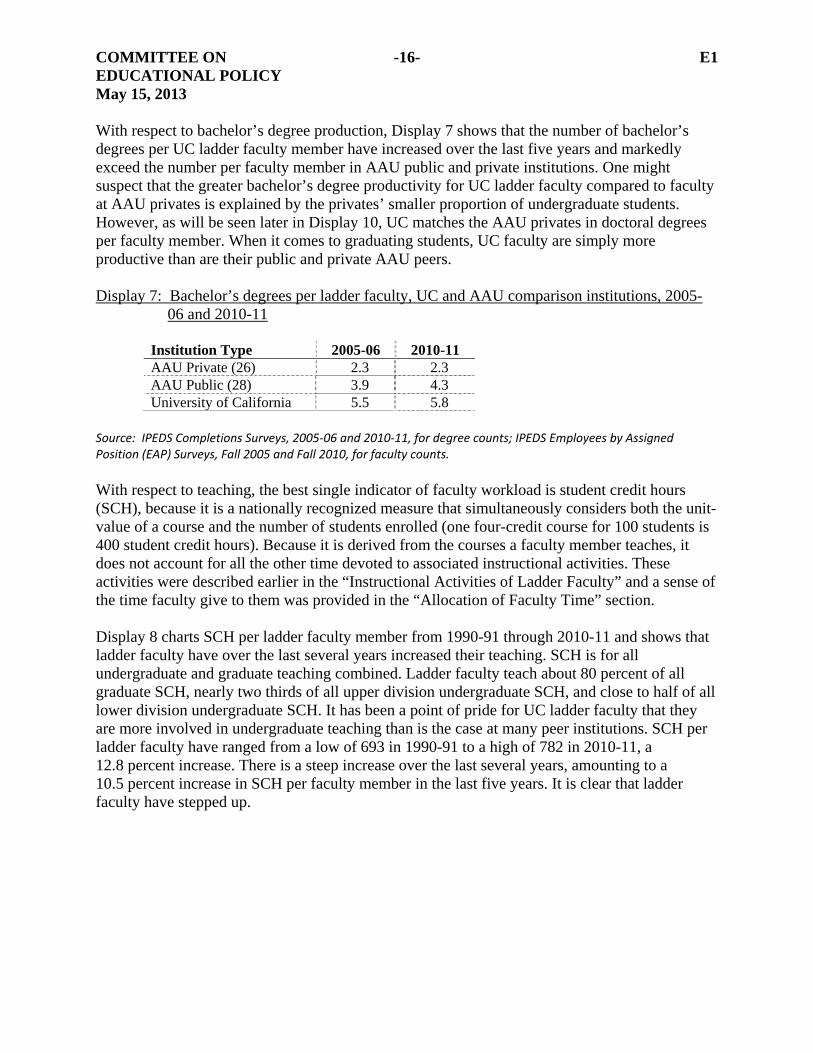
With respect to bachelor’s degree production, Display 7 shows that the number of bachelor’s degrees per UC ladder faculty member have increased over the last five years and markedly exceed the number per faculty member in AAU public and private institutions. One might suspect that the greater bachelor’s degree productivity for UC ladder faculty compared to faculty at AAU privates is explained by the privates’ smaller proportion of undergraduate students. However, as will be seen later in Display 10, UC matches the AAU privates in doctoral degrees per faculty member. When it comes to graduating students, UC faculty are simply more productive than are their public and private AAU peers. Display 7: Bachelor’s degrees per ladder faculty, UC and AAU comparison institutions, 2005-
06 and 2010-11
Institution Type 2005-06 2010-11 AAU Private (26) 2.3 2.3 AAU Public (28) 3.9 4.3 University of California 5.5 5.8
Source: IPEDS Completions Surveys, 2005‐06 and 2010‐11, for degree counts; IPEDS Employees by Assigned Position (EAP) Surveys, Fall 2005 and Fall 2010, for faculty counts. With respect to teaching, the best single indicator of faculty workload is student credit hours (SCH), because it is a nationally recognized measure that simultaneously considers both the unit-value of a course and the number of students enrolled (one four-credit course for 100 students is 400 student credit hours). Because it is derived from the courses a faculty member teaches, it does not account for all the other time devoted to associated instructional activities. These activities were described earlier in the “Instructional Activities of Ladder Faculty” and a sense of the time faculty give to them was provided in the “Allocation of Faculty Time” section. Display 8 charts SCH per ladder faculty member from 1990-91 through 2010-11 and shows that ladder faculty have over the last several years increased their teaching. SCH is for all undergraduate and graduate teaching combined. Ladder faculty teach about 80 percent of all graduate SCH, nearly two thirds of all upper division undergraduate SCH, and close to half of all lower division undergraduate SCH. It has been a point of pride for UC ladder faculty that they are more involved in undergraduate teaching than is the case at many peer institutions. SCH per ladder faculty have ranged from a low of 693 in 1990-91 to a high of 782 in 2010-11, a 12.8 percent increase. There is a steep increase over the last several years, amounting to a 10.5 percent increase in SCH per faculty member in the last five years. It is clear that ladder faculty have stepped up.
COMMITTEE ON -17- E1 EDUCATIONAL POLICY May 15, 2013
Display 8: Actual and projected student credit hours per ladder faculty full-time equivalent
(FTE), UC, 1990-91 to 2015-16
Source: UCOP Institutional Research, Faculty Instructional Activities Report. *Data for 2001‐02 are not available. **2005‐06 data do not include UC Merced.
GRADUATE EDUCATION Graduate academic and professional degree programs are essential elements of elite research universities. For years, UC has lagged behind its AAU public and private peers in this area. As of 2010, 21.8 percent of UC’s student body were graduate students, compared to 27.2 percent for the other AAU publics and 52.8 percent for the AAU privates. UC has long sought to increase its number and percent of graduate students, particularly for the newer campuses. In fact, the recently adopted model for distributing State funds includes “incentive funding” to help the newer campuses do so. Over the last ten years, the numbers of UC graduate students have increased from 37,787 (Fall 2000) to 49,863 (Fall 2010); however, because of the continuing rise in undergraduate enrollment, graduate students have not increased meaningfully (from 21.1 percent to 21.8 percent) in their representation in the UC student body. An increase in this percentage to achieve parity at least with AAU publics continues to be a UC goal. There are fewer academic indicators altogether for UC’s graduate than undergraduate students. The types of degrees (e.g., MD, Ph.D., JD, MA) and associated expectations for a graduate vary widely; consequently, the experiences and requirements for the different types of degrees vary
600
650
700
750
800
850
900
1990‐91
1991‐92
1992‐93
1993‐94
1994‐95
1995‐96
1996‐97
1997‐98
1998‐99
1999‐00
2000‐01
2001‐02*
2002‐03
2003‐04
2004‐05
2005‐06**
2006‐07
2007‐08
2008‐09
2009‐10
2010‐11
2011‐12
2012‐13
2013‐14
2014‐15
2015‐16
Student Credit Hours per Ladder Faculty FTE(General Campus Only)
Student Credit Hours per Faculty FTE
Projected value if 2005‐11 trend continues
COMMITTEE ON -18- E1 EDUCATIONAL POLICY May 15, 2013
widely. There is a very wide range in the expected time to complete various degrees and in how much more experience (e.g., residency, postdoctoral fellowship) is expected before the graduate actually embarks on the career for which she or he has been preparing. In these circumstances, summary statistics for UC can be misleading as can comparisons if the indicators encompass a wide or widely differing set of graduate degrees or even degree fields. For example, median years to doctorate for 2007-09 exit cohorts ranged from 6.7 to 7.4 for arts and humanities doctorates and from 5.3 to 5.7 for physical sciences, mathematics, engineering, and computer sciences. This report will focus only, and briefly, on graduate students seeking the doctorate. This is where there are the best data, the greatest similarity in expectations as to degree requirements, and the majority (53 percent in 2010) of the total graduate academic and professional student enrollment. Doctoral degree completion rates and time to degree vary by field; UC’s indicators are generally the same as or better than those for AAU publics and the same as or worse than those for AAU privates. Display 9 illustrates the field-based variation described above, as well as the variation within UC, selected AAU publics, and selected AAU privates themselves. For five fields, the percent of students who complete the doctorate in six years (eight years for arts and humanities) is graphed for all UC campuses (except Merced) that offer the degree in that field and for four elite AAU publics and AAU privates (study by the National Research Council). Clearly, graduation rates are greater for engineering/computer science and biological/health sciences than they are for social science/psychology or arts/humanities. Just as clearly, UC campuses vary across fields in their performance, as do the selected AAU publics and privates, each group of which has one university that is lower than the other three in all five fields. Overall, UC students’ doctoral completion rates in five fields are higher than those for the four selected AAU publics for three of the five fields and lower than those for the four selected AAU privates for all five fields. Other indicators (UC Annual Accountability Report 2012, Display 5.4.2, p. 50) show field-based variation in median years to the doctorate. For all seven fields combined, UC, the other AAU publics, and the AAU privates had exactly the same 5.7 median years to the doctorate. UC’s was the same as or shorter than those of the AAU publics and privates for the fields of physical sciences and mathematics, engineering and computer and information sciences, life sciences, arts, humanities, and professional and other. For one field, social sciences and psychology, UC median time was longer than the AAU publics and privates.
COMMITTEE ON -19- E1 EDUCATIONAL POLICY May 15, 2013
Display 9: Doctoral completion rates by field, UC and AAU comparison institutions, graduate student cohorts entering 1996-97 to 2000-01 (1996-97 to 1998-99 for humanities)
Source: 2005‐06 National Research Council’s Assessment of Doctorate Programs (released in 2010).
Faculty are graduating more doctoral students and teaching more graduate students. Doctoral productivity is always low compared to bachelor’s productivity, as can be seen in a comparison of Displays 7 and 10. In this context, the increase from 0.4 to 0.5 doctoral degrees per ladder faculty member from 2005-06 to 2010-11 is probably a meaningful indication of increased productivity at UC. Comparisons for 2010-11 show that UC produces somewhat more
68%
59%
56%
54%
53%
52%
49%
45%
41%
38%
36%
35%
34%
34%
34%
32%
62%
55%
52%
40%
39%
33%
32%
30%
28%
28%
26%
25%
24%
24%
23%
20%
0%
Arts and Humanities Soc Sci and Psych
67%
66%
63%
60%
49%
47%
46%
44%
42%
41%
40%
39%
38%
37%
35%
34%
34%
63%
61%
60%
59%
58%
53%
53%
51%
49%
47%
45%
44%
41%
36%
35%
29%
Physical Sciences Engineering/CS
63%
61%
58%
55%
53%
52%
52%
51%
49%
49%
46%
45%
42%
36%
36%
35%
30%
Bio and Health Sci
COMMITTEE ON -20- E1 EDUCATIONAL POLICY May 15, 2013
doctorates per faculty member than do the other AAU publics and the same as do the AAU privates. The faculty teaching data reported earlier (Display 8) combine undergraduate and graduate students and cannot be disaggregated. Given that total student credit hours per faculty member have increased, it is likely that faculty teaching of graduate students has increased because total student credit hours for lower division undergraduates, upper division undergraduates, and graduates have all steadily increased during this same period. Display 10: Doctoral degrees per ladder faculty, UC and AAU comparison institutions, 2005-06
and 2010-11
Doctoral degrees per ladder faculty
Institution Type 2005-06 2010-11 AAU Private (26) 0.5 0.5 AAU Public (28) 0.3 0.4 University of California 0.4 0.5
Source: IPEDS Completions Surveys, 2005‐06 and 2010‐11, for degree counts; IPEDS Employees by Assigned
Position (EAP) Surveys, Fall 2005 and Fall 2010, for faculty counts. LOOKING TO THE FUTURE UC can take a great deal of pride in these many accomplishments. At the same time, it must continually ask whether the greater efficiency, productivity, and ladder faculty involvement in instruction have come at too high a cost to the quality of a UC education and/or to ladder faculty attainments in the research and service parts of their jobs. Vigilance, creativity, and commitment to sustaining UC’s excellence in its teaching, research, and public service missions continue to be needed, particularly as the University faces a still uncertain future. If current trends in ladder faculty and student numbers should continue for the next five years as projected in Display 1, the student-faculty ratio would continue to rise from the current 20-year high of 23.5 to an unprecedented 25.4. (See Display 2.) Instructional workload would continue to rise. Depending on UC’s financial circumstances, there could be tough choices to make about how best to sustain UC’s excellence as a public research university. Should circumstances and choices result in a further increase in instructional workload, UC would employ a wide variety of strategies to meet its responsibility to students. Ladder faculty would do their part. According to projections of current trends (Display 8), on average, it would require another ten percent increase in student credit hours per ladder faculty member. The main strategies used to increase graduation rates, reduce time to degree, and provide an academically rich and rewarding education are identified below as those that focus on structure, students, and faculty.
COMMITTEE ON -21- E1 EDUCATIONAL POLICY May 15, 2013
Structure-Focused Strategies
Review and adjust, as appropriate, requirements for undergraduate and graduate degrees. Degree program requirements can accumulate over time to the point that they do not well reflect current views of what is essential for a high-quality program. Reviewing programs with a high number of requirements and eliminating those that are outdated can streamline programs in an educationally sound manner that promotes improved time to degree. Provide roadmaps to timely degree completion. Undergraduate and graduate students alike benefit from having explicit models of which courses to take and hurdles to clear year by year. These roadmaps must be specific to each student’s degree program and must also reflect the course offerings and hurdles program faculty are committed to having available. Under these conditions attentive advisors and motivated students together can achieve timely degree completion and, in special circumstances, completion well below the norm; for example, a three-year bachelor’s degree or Ph.D.
Expand summer session capacity and encourage summer enrollment. Summer enrollments of UC students have risen steadily over the past decade, from 11,800 full-time equivalent (FTE) enrollments in 2001 to 15,800 FTE in 2011. Offering high demand courses (e.g., gateways, overflow writing sections, pre-calculus, statistics for social sciences doctoral students) during the summer provides students with more opportunities to get the courses they need and stay on track to complete their degrees in a timely manner. Review student course-taking needs regularly to identify any bottlenecks and remove them. Determining campus course needs requires careful planning and regular updates in order to anticipate and meet enrollment needs in a timely fashion. One approach to addressing projected bottlenecks for which a department has not planned is maintenance of a “bridge” fund reserve. Set aside by central campus administration, these funds are distributed to departments to cover unmet course needs on a one-time or short-term basis. Offer online high-enrollment, general education, and/or gateway (e.g., pre-major, introductory major) undergraduate courses. With the right choice of course topic, campus approval for general education or major credit, and largely asynchronous interaction of the enrolled student with course content, instructors, and fellow students, online courses can greatly increase undergraduate students’ opportunities to complete bachelor’s degree requirements in a timely way.
Offer online courses that bring the substantial expertise of faculty across the ten-campus (and National Laboratories) system to students from multiple campuses to enrich undergraduate and graduate education. Online offerings, whether synchronous or asynchronous, make it possible for faculty to offer courses on very specialized topics, those that would get very small enrollments from just their own campus, in a cost-effective way by enrolling students from their own and other campuses at the same time. They also make it possible to turn to expertise on other campuses
COMMITTEE ON -22- E1 EDUCATIONAL POLICY May 15, 2013
rather than hire a special instructor on one’s own campus, just as departments on the same campus often turn to another department to provide particular learning opportunities for their students (e.g., advanced statistics).
Student-focused Strategies
Enhance the preparation of freshman and transfer students to succeed at UC through a variety of strategies prior to full-time enrollment at UC. Prior to enrolling as full-time undergraduates at a UC campus, some students would benefit from additional preparatory work that ensures they enter with the requisite knowledge and skills for the UC courses they will immediately take. For example, there are a number of community college transfers entering science disciplines who would be well served by better articulation of pre-major requirements to ensure those requirements are met upon admission. Review student progress regularly and provide academic counseling for those lagging. Degree audit systems are important tools for ensuring students make timely progress to graduation. These systems compare students’ academic work with requirements of degree programs in which they are enrolled. They may be used to improve (1) academic advising (provide feedback to ensure students takes classes that fulfill major or other graduation requirements), and (2) curriculum planning (provide better information about students’ course needs). Resources to support staff advisors to work with students on degree audits also are key. In general, the technologically based systems are used for undergraduates, but regular reviews of progress, whether technology based or not, are useful for graduate students as well. Create instructional enhancements. For courses known to have high retake rates (e.g., organic chemistry), offer online (or other) supplements to improve student learning and successful completion of the course the first time it is taken.
Faculty-focused Strategies
Continue to increase the student credit hours provided on average by each ladder faculty member. Projections of student enrollments and total faculty numbers, as described earlier, indicate that faculty will be asked to increase their instructional workload over the next few years. They will expect to do so. Based on current projections, SCH per ladder faculty member should grow by approximately ten percent over the next five years. Though not calibrated in courses per year, additional hours would represent a further increase in teaching effort.
Adjust the balance of academic titles involved in meeting instructional needs. In addition to ladder faculty, employees with a variety of other academic titles, such as lecturers, provide instruction. Different academic titles have different job descriptions, for some of which teaching is the principal activity. Given that ladder faculty are responsible equally for teaching and research, economies can be achieved by altering the balance of
COMMITTEE ON -23- E1 EDUCATIONAL POLICY May 15, 2013
academic titles so that somewhat more of those teaching are in positions where instruction is virtually their entire job. The extent of ladder faculty teaching at all levels is a point of pride for the UC system, and in any re-balancing ladder faculty would continue to be the major providers of instruction, teaching courses for lower- and upper-division undergraduate students and also for graduate students. Adjust ladder faculty instructional responsibilities based on their preference and performance. There is variation in the degree of scholarly engagement and research productivity among faculty and often for the same individual during his or her professional career. Campuses can employ flexible mechanisms to encourage faculty members to concentrate energies on teaching if they so choose. These efforts could use incentives and rewards in a manner that takes advantage of faculty strengths and that is consistent with their evolving interests over the course of their University careers.
CONCLUSION
Over the last several years, the University has demonstrated that it can become more efficient in both its administrative and academic activities. In contemplating academic efficiency and determining what constitutes the best return for each dollar invested – public or private – UC must balance the notions of economies achieved with the quality of the instruction, research, and public service produced. This is what UC faculty, staff, administrators, and students seek and in many ways have thus far found. High-performing ladder faculty dedicated to the proposition that UC is and should be a world-class public research university, with all that entails, are essential to UC’s success. Their job description and advancement require that they demonstrate superior intellectual attainment in both teaching and research or other creative achievement. The same expectations would apply were they at any other world-class public or private research university. UC must maintain an environment in which it can recruit and retain such pre-eminent faculty. If it does, evidence presented earlier shows that they will work far beyond a 40-hour work week and devote about half their UC work time, and about two-thirds of a 40-hour work week, to instructional activities and carry them out very well. As UC moves into a future that can reasonably be expected to remain challenging even if it improves, it must continue to craft complex sets of adaptations that will support ladder faculty success, and sustain and enhance excellence in all of UC’s academic endeavors. The campuses individually and as a system have been doing that. They do it differently, according to their own particular context, goals, and resources. Overall, they have been successful judged by such important outcomes as graduation rates, time to degree, and student satisfaction, and judged in comparison to their public and private research university peers. If the University or the State is looking for concrete goals to espouse, the focus should be on outcomes, and not on specific adaptations that are expected to achieve the outcomes. This approach stays with the essential and recognizes the need for each campus to work somewhat differently to achieve overarching goals that all the campuses share.
COMMITTEE ON -24- E1 EDUCATIONAL POLICY May 15, 2013
In terms of UC’s instructional mission, an example of meaningful instructional outcomes on which the campuses could all focus would be the following four:
Maintain or increase the percent of undergraduate students who graduate within six years with a bachelor’s degree.
Increase the proportion of undergraduates completing a bachelor’s degree in four years if they enter as freshmen and two years if they enter as transfers.
Maintain or increase graduate enrollments and for some programs decrease time to degree.
Sustain or enhance the positive evaluations of students and faculty with respect to the quality of education provided.
It is no easy matter to establish meaningful, achievable, measurable goals and a reasonable timetable for doing so. Should any goals be established for UC, as has been done in the past and is again proposed now, they should be about important outcomes not inputs. UC looks to be directly involved in setting them and determining how they will be achieved. From long experience, the University knows that meaningful achievements come about in differing ways on the campuses. The UC system might well be thought of as a family with ten high-functioning brothers and sisters, certainly not as a family with ten high-functioning clones. The UC family has a shared view of what it means to be a high-functioning campus and recognizes that achieving that status is best done in somewhat differing ways depending on the age, stage, and particular characteristics of each campus. All campuses expect to succeed in the circumstances given to them in achieving the teaching, research, and public service missions of the University. The best way, then, to sustain UC’s academic excellence in a period of continuing financial exigencies is to give the UC campuses and system the flexibility – as well as the resources and authority – they need in order to produce desired outcomes for each campus and the University as a whole.