132
E3 Opportunity Assessment: Developing the future energy workforce Final Report 2021
E3 Opportunity Assessment: Developing the future
energy workforceFinal Report 2021

Research team
Research team
• Institute for Sustainable Futures, University of Technology Sydney (UTS)
• Monash University
With the support of:
• Australian Power Institute
• Climate-KIC Australia
• Energy Efficiency Council
• EnergyLab
• Startupbootcamp Australia
• Ultima Capital Partners Pty Ltd
Work Package 1: Institute for Sustainable Futures, UTS
• Jay Rutovitz• Chris Briggs• Sarah Niklas• Alison Atherton• Franziska Mey
Work Package 2: Monash University
• Dirk Visser• Annette Bos• Scott Ferraro• Farzaneh Mahmoudi
Work Package 3:
Lead: Institute for Sustainable Futures, UTS.
Support: Monash University, Climate-KIC Australia, EnergyLab, Startupbootcamp Australia, Ultima Capital Partners Pty Ltd
• Samantha Sharpe• Scott Dwyer• Darren Sharp• Genevieve Mortimer
Project management: Energy Efficiency Council and Australian Power Institute
• Holly Taylor• Kate Jennings• David Pointing
Citation
Rutovitz, J., Visser, D., Sharpe, S., Taylor, H., Jennings, K., Atherton, A., Briggs, C., Mey, F., Niklas, S., Bos, A., Ferraro, S., Mahmoudi, F., Dwyer, S., Sharp, D., and Mortimer, G. (2021). Developing the future energy workforce. Opportunity assessment for RACE for 2030.
Acknowledgements
The authors would like to thank the many stakeholders involved in the development of this report. In particular, interviewees and the Industry Reference Group members who have given so generously of their time.1
Whilst their input is very much appreciated, any views expressed here are the responsibility of the authors alone.
Disclaimer
The authors have used all due care and skill to ensure the material is accurate as at the date of this report. The authors do not accept any responsibility for any loss that may arise by anyone relying upon its contents.
1 A full list of organisations that have contributed to this report is found in Appendix 1.
E3 Opportunity Assessment: Developing the future energy workforce 3

Executive summary
E3 Opportunity Assessment: Developing the future energy workforce4

Australia’s ability to reach net zero emissions and realise the opportunities offered by such a transformation is intrinsically linked to how it approaches the transition to an entirely clean energy sector. The Reliable, Affordable, Clean Energy Cooperative Research Centre (RACE for 2030) was established as a collaborative mechanism to address the multi-faceted nature of this undertaking. Australia needs to understand its current position so it can develop the pathways needed to meet targets for 2030 and 2050 while maximising job creation for the Australian energy workforce and wider economy.
This opportunity assessment describes a pathway to understanding the present and future energy workforce in Australia. Developing the workforce is crucial to enabling the clean energy transition and realising the RACE for 2030 vision of a customer-centred clean energy system, and to the successful translation of RACE for 2030 research outcomes to industry impact.
BackgroundThis opportunity assessment, Developing the future energy workforce, addresses several fundamental questions about Australia’s energy sector, including how to measure the workforce, how training and skills can be fit for the future, and how to strengthen Australia’s innovation pathways. The work is separated into three work packages addressing:
1. Market size, workforce and employment;
2. New skills development; and
3. Innovation pathways.
Work Package 1: market size, workforce and employmentWork Package 1 is focused on the development of a robust methodology to characterise the current and future energy workforce in Australia. To date, there has not been a systematic national framework for measurement or monitoring. By developing the ability to adequately track and forecast clean energy jobs, Australia will put itself in a strong position to assess how the energy sector contributes to overall employment and the economy over time, and to identify the needs of the future energy workforce. This is critical for demonstrating the role and impact of clean energy across a wide range of sectors, both now and into the future, for managing the transformation of the workforce, and for maximising the jobs and opportunities offered by the global shift to low carbon.
Work Package 2: new skills developmentThe clean energy transformation is expected to substantially change the global energy workforce, with the International Labour Organization (ILO, 2019) estimating it will create twenty-five million jobs and lead to the loss of seven million jobs. Significant effort will be required to understand the new skills and occupations involved, as well as the underpinning training and professional development pathways required, to deliver this transition. Work package 2 is focused on helping to facilitate the effective and strategic growth of Australia’s energy workforce through new skills development.
Work Package 3: innovation pathwaysWork Package 3 focuses on understanding how transformative change through innovation could be leveraged to enable the clean energy transition. Due to the scale of the changes required to achieve decarbonisation in the energy sector, and the extent of the disruption involved, Australia must accelerate and strengthen its energy innovation pathways. This Work Package explores how this can be achieved, including by enhancing collaborations and leveraging policy, strategic capacity-building and diverse investments into energy innovation.
“ Making the energy transition just and people-centred is critical for governments to make consistent progress on addressing climate change. Managing the transition starts with improved employment data.”
Daniel Wetzel, International Energy Agency.
E3 Opportunity Assessment: Developing the future energy workforce 5

MethodologyThe opportunity assessment used quantitative and qualitative data to capture a holistic view of pathways to mapping the energy sector workforce, skills and training landscape, and innovation pathways. A wide range of domestic and international stakeholders, including the project’s Industry Reference Group, were consulted through interviews, workshops and surveys, with the breakdown by stakeholder type shown in Figure E1.
In total, eighty interviews were conducted across the three work packages, and there were eighty-six workshop attendances. This collaborative approach has been critical in ensuring the project has engaged with, and is aligned with, the needs of industry, government, academia and other stakeholders.
Figure E-1. Stakeholder involvement
Governmental/intergovernmentalorganisations 35%
Industry & industry associations 47%
Academia 16%Consultants 2%
WorkshopsGovernmental/
intergovernmentalorganisations 25%
Non-governmental organisations 3%
Academia 17%
Consultants 10%Industry & industry associations 45%
Interviews
Results and discussionMeasuring and forecasting the clean energy workforceThere has not been systematic measurement of the clean energy sector in Australia since the NSW Sustainable Energy Development Agency (SEDA) survey in 2001/2003. Recent studies estimate the renewable energy workforce to be at least 30,000 and the energy efficiency workforce to be between 59,000 and 236,000. However, there is no reliable baseline information, and no consistent method of projection apart from some types of renewable energy. By 2030 the clean energy sector could increase by somewhere between 130,000 and 200,000 jobs (WWF 2020a and 2020b, Murphy 2020).
The current value of the Australian renewable sector is estimated as $18.6 billion (CEC, 2021). There are no current estimates for the value of the energy efficiency sector. If the ratio of sector value to employees were the same as in Canada (Eco Canada 2019), and if the range of Australian employment
estimates is correct, the Australian energy efficiency sector would have a value of between $11 billion and $45 billion. This would give an indicative total value for the clean energy sector of between $30 billion and $63 billion. If the ratio of value to employee number were to remain the same as it is today, and the projections are correct, total sector value could increase to between $64 billion and $110 billion by 2030.
The opportunity assessment reviewed alternative methodological approaches, including surveys of different types, input-output modelling, macro-econometric modelling, and computable general equilibrium modelling.
There was widespread consensus that good quality baseline information followed by systematic projections are needed, and that these should be for the entire energy sector, broken down by sub-sectors, rather than an assessment of the clean energy sector alone. Consistency across the traditional and emerging energy sectors is important, as there is an increasing need for integration of all forms of energy. The only way to accurately
E3 Opportunity Assessment: Developing the future energy workforce6
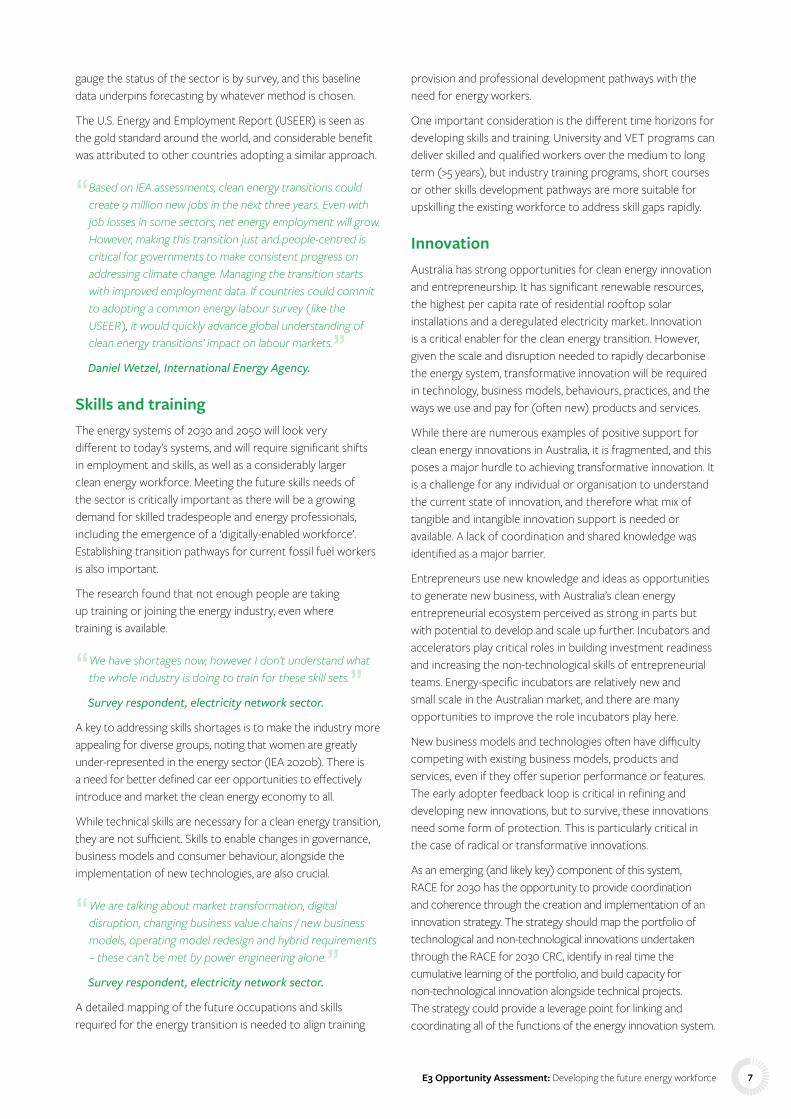
gauge the status of the sector is by survey, and this baseline data underpins forecasting by whatever method is chosen.
The U.S. Energy and Employment Report (USEER) is seen as the gold standard around the world, and considerable benefit was attributed to other countries adopting a similar approach.
“ Based on IEA assessments, clean energy transitions could create 9 million new jobs in the next three years. Even with job losses in some sectors, net energy employment will grow. However, making this transition just and people-centred is critical for governments to make consistent progress on addressing climate change. Managing the transition starts with improved employment data. If countries could commit to adopting a common energy labour survey ( like the USEER), it would quickly advance global understanding of clean energy transitions’ impact on labour markets.”
Daniel Wetzel, International Energy Agency.
Skills and trainingThe energy systems of 2030 and 2050 will look very different to today’s systems, and will require significant shifts in employment and skills, as well as a considerably larger clean energy workforce. Meeting the future skills needs of the sector is critically important as there will be a growing demand for skilled tradespeople and energy professionals, including the emergence of a ‘digitally-enabled workforce’. Establishing transition pathways for current fossil fuel workers is also important.
The research found that not enough people are taking up training or joining the energy industry, even where training is available.
“ We have shortages now; however I don’t understand what the whole industry is doing to train for these skill sets.”
Survey respondent, electricity network sector.
A key to addressing skills shortages is to make the industry more appealing for diverse groups, noting that women are greatly under-represented in the energy sector (IEA 2020b). There is a need for better defined car eer opportunities to effectively introduce and market the clean energy economy to all.
While technical skills are necessary for a clean energy transition, they are not sufficient. Skills to enable changes in governance, business models and consumer behaviour, alongside the implementation of new technologies, are also crucial.
“ We are talking about market transformation, digital disruption, changing business value chains / new business models, operating model redesign and hybrid requirements – these can’t be met by power engineering alone.”
Survey respondent, electricity network sector.
A detailed mapping of the future occupations and skills required for the energy transition is needed to align training
provision and professional development pathways with the need for energy workers.
One important consideration is the different time horizons for developing skills and training. University and VET programs can deliver skilled and qualified workers over the medium to long term (>5 years), but industry training programs, short courses or other skills development pathways are more suitable for upskilling the existing workforce to address skill gaps rapidly.
InnovationAustralia has strong opportunities for clean energy innovation and entrepreneurship. It has significant renewable resources, the highest per capita rate of residential rooftop solar installations and a deregulated electricity market. Innovation is a critical enabler for the clean energy transition. However, given the scale and disruption needed to rapidly decarbonise the energy system, transformative innovation will be required in technology, business models, behaviours, practices, and the ways we use and pay for (often new) products and services.
While there are numerous examples of positive support for clean energy innovations in Australia, it is fragmented, and this poses a major hurdle to achieving transformative innovation. It is a challenge for any individual or organisation to understand the current state of innovation, and therefore what mix of tangible and intangible innovation support is needed or available. A lack of coordination and shared knowledge was identified as a major barrier.
Entrepreneurs use new knowledge and ideas as opportunities to generate new business, with Australia’s clean energy entrepreneurial ecosystem perceived as strong in parts but with potential to develop and scale up further. Incubators and accelerators play critical roles in building investment readiness and increasing the non-technological skills of entrepreneurial teams. Energy-specific incubators are relatively new and small scale in the Australian market, and there are many opportunities to improve the role incubators play here.
New business models and technologies often have difficulty competing with existing business models, products and services, even if they offer superior performance or features. The early adopter feedback loop is critical in refining and developing new innovations, but to survive, these innovations need some form of protection. This is particularly critical in the case of radical or transformative innovations.
As an emerging (and likely key) component of this system, RACE for 2030 has the opportunity to provide coordination and coherence through the creation and implementation of an innovation strategy. The strategy should map the portfolio of technological and non-technological innovations undertaken through the RACE for 2030 CRC, identify in real time the cumulative learning of the portfolio, and build capacity for non-technological innovation alongside technical projects. The strategy could provide a leverage point for linking and coordinating all of the functions of the energy innovation system.
E3 Opportunity Assessment: Developing the future energy workforce 7
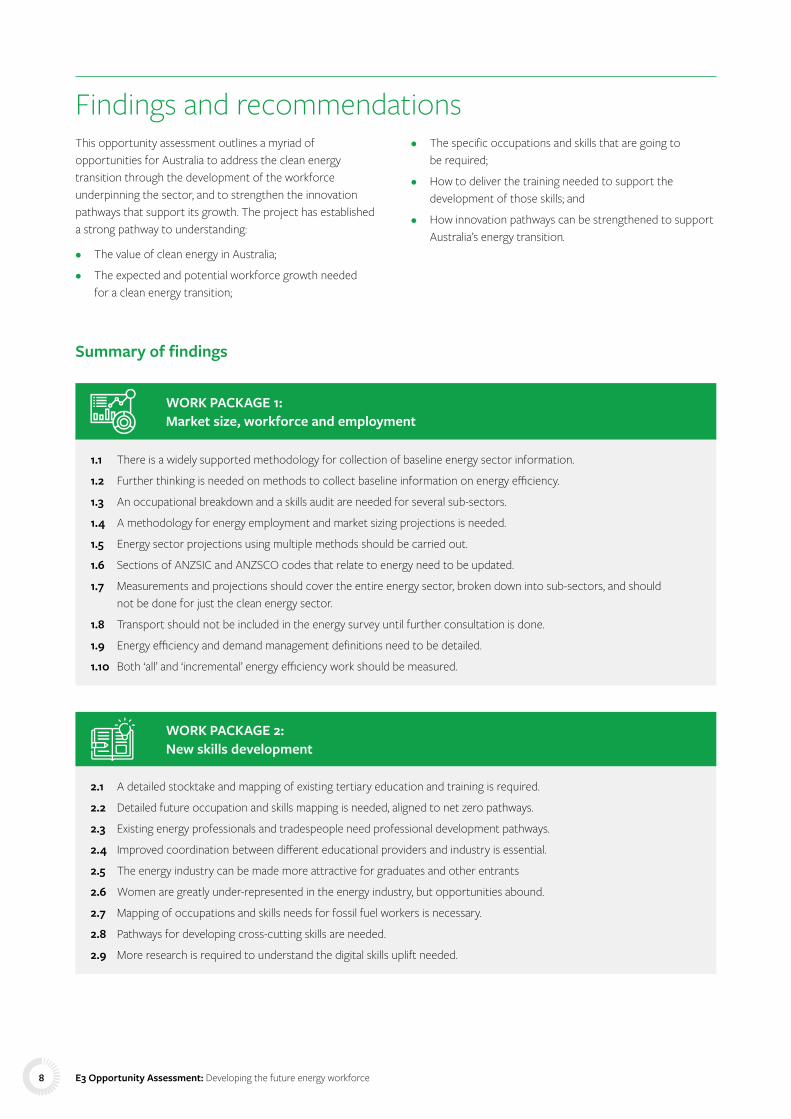
Findings and recommendationsThis opportunity assessment outlines a myriad of opportunities for Australia to address the clean energy transition through the development of the workforce underpinning the sector, and to strengthen the innovation pathways that support its growth. The project has established a strong pathway to understanding:
• The value of clean energy in Australia;
• The expected and potential workforce growth needed for a clean energy transition;
• The specific occupations and skills that are going to be required;
• How to deliver the training needed to support the development of those skills; and
• How innovation pathways can be strengthened to support Australia’s energy transition.
Summary of findings
WORK PACKAGE 1: Market size, workforce and employment
1.1 There is a widely supported methodology for collection of baseline energy sector information.
1.2 Further thinking is needed on methods to collect baseline information on energy efficiency.
1.3 An occupational breakdown and a skills audit are needed for several sub-sectors.
1.4 A methodology for energy employment and market sizing projections is needed.
1.5 Energy sector projections using multiple methods should be carried out.
1.6 Sections of ANZSIC and ANZSCO codes that relate to energy need to be updated.
1.7 Measurements and projections should cover the entire energy sector, broken down into sub-sectors, and should not be done for just the clean energy sector.
1.8 Transport should not be included in the energy survey until further consultation is done.
1.9 Energy efficiency and demand management definitions need to be detailed.
1.10 Both ‘all’ and ‘incremental’ energy efficiency work should be measured.
WORK PACKAGE 2: New skills development
2.1 A detailed stocktake and mapping of existing tertiary education and training is required.
2.2 Detailed future occupation and skills mapping is needed, aligned to net zero pathways.
2.3 Existing energy professionals and tradespeople need professional development pathways.
2.4 Improved coordination between different educational providers and industry is essential.
2.5 The energy industry can be made more attractive for graduates and other entrants
2.6 Women are greatly under-represented in the energy industry, but opportunities abound.
2.7 Mapping of occupations and skills needs for fossil fuel workers is necessary.
2.8 Pathways for developing cross-cutting skills are needed.
2.9 More research is required to understand the digital skills uplift needed.
E3 Opportunity Assessment: Developing the future energy workforce8

WORK PACKAGE 3: Innovation pathways
3.1 Opportunities exist to align and develop technological and non-technological knowledge.
3.2 Innovation networks accelerate knowledge diffusion and could be strengthened.
3.3 Diversity of actors providing guidance on stakeholder needs ensures a range of perspectives.
3.4 Energy-specific incubators and accelerators play critical roles in innovation pathways.
3.5 The creation and support of a clear, united vision for clean energy transformation is critical.
3.6 There are opportunities to address financing and funding gaps.
3.7 Agile regulatory systems should address privacy and consumer protection issues.
3.8 There are multiple barriers to energy innovation pathways.
3.9 RACE for 2030 should develop an innovation strategy and start-up register.
3.10 Developing a broader portfolio of financing and funding support for innovation is needed.
3.11 An energy innovation policy lab should be established.
Research recommendations The accompanying research recommendations are summarised in Table E1 and expanded in the research roadmap in Appendix 7. Resources should be directed to each of the projects to understand how best to develop the future energy workforce whilst capitalising on the many gains that can be achieved by moving towards a net zero emissions future. Some key recommendations are to:
• Develop and conduct the first and second surveys of the Australian energy sector workforce and value – the Australian Energy and Employment Report (AEER) – modelled on the U.S. Energy and Employment Report and the Australian pilot survey (research roadmap projects 1 & 2);
• Develop 5-, 10-, and 20-year projections by energy sub-sector, occupation and location, using employment indicators, input-output, and macro-econometric modelling (projects 6a, 6b, and 6c);
• Design for inclusion – enable tracking of energy managers in the energy workforce survey – the AEER – by designing a process to capture this important element in non-energy sectors (project 3);
• Identify occupational breakdowns for energy efficiency, energy management, storage, and other sectors to allow
occupational projections alongside gross employment projections (projects 4a, 4b, and 4c);
• Undertake detailed stocktake and mapping of existing tertiary and vocational education and training courses, and gap analysis to identify priority course content (projects 10 & 11);
• Undertake mapping of occupations and identify the generic technical and other skills needed (project 12);
• Undertake review of continuing professional development (CPD) pathways for energy professionals (project 13); and
• Develop an innovation strategy for RACE for 2030 that assesses and then builds required innovation capabilities across the projects and actors involved in RACE for 2030 (project 19).
The findings and outcomes from the research contained in the roadmap will play a critical part in Australia’s transition to a net zero emissions economy underpinned by a clean energy sector. The projects will have deep and wide-reaching impacts across numerous sectors, reflective of the all-encompassing approach needed for Australia to both achieve a net zero emissions future and realise the jobs and opportunities this offers.
E3 Opportunity Assessment: Developing the future energy workforce 9

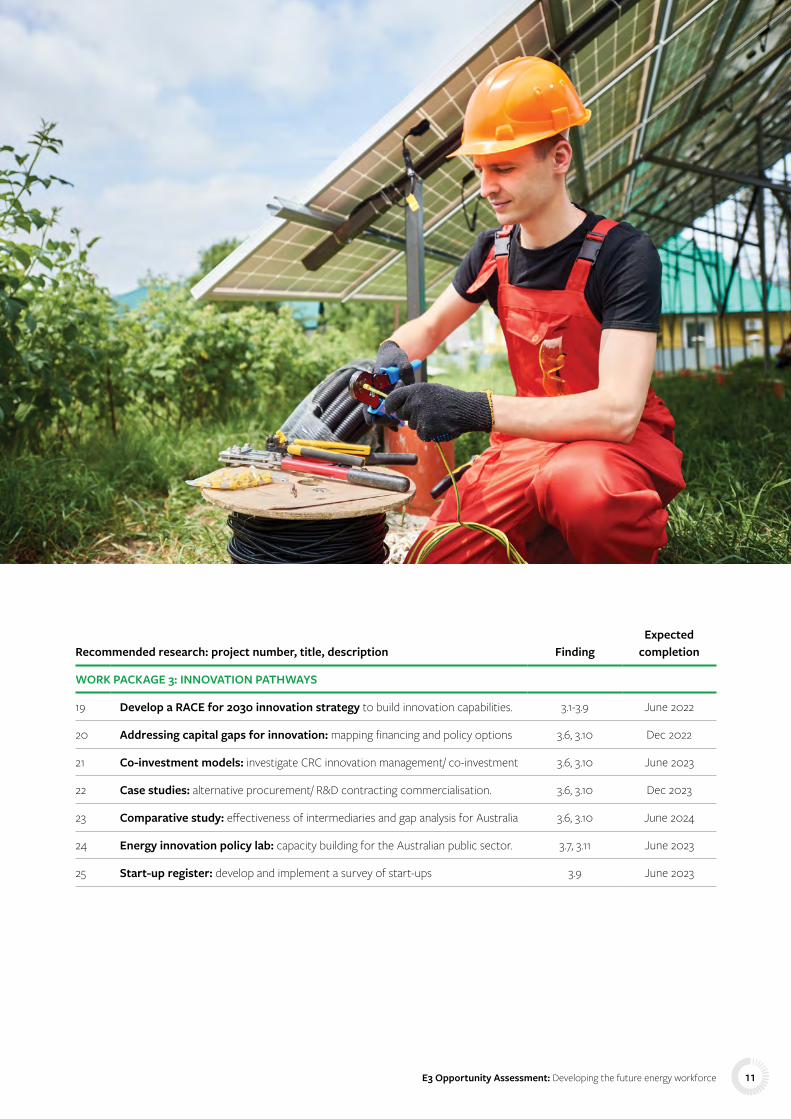
Table E1. Research roadmap summary
Recommended research: project number, title, description FindingExpected
completion
WORK PACKAGE 1: MARKET SIZE, WORKFORCE AND EMPLOYMENT
1 + 2 Australian Energy Employment Report (AEER): conduct the first and second surveys of the Australian energy sector workforce and value, modelled on the U.S. Energy and Employment Report and the Australian pilot survey.
1.1, 1.7, 1.10 Dec 2022 (1) Dec 2024 (2)
3 Tracking the energy management workforce in the AEER: design the process to ensure coverage of the energy management workforce.
1.2 Feb 2022
4 Energy workforce occupational breakdowns: identify breakdowns for a) energy efficiency, b) energy management, storage and c) other sectors as needed to enable detailed occupational projections.
1.3 Dec 2023 (4a) June 2024 (4b) Dec 2024 (4c)
5 Developing Australian I/O tables for energy workforce analysis: undertake development to utilise Australian I/O tables, and potentially macro-econometric modelling, for energy workforce projections.
1.4 Mar 2022
6 Energy sector workforce projections: develop 5-, 10-, and 20-year projections by energy sub-sector, occupation, and location for a) the electricity sector, to accompany the 2022 Integrated System Plan and the 2020 Whole of System Plan, and b) and c) the entire energy sector following each AEER.
1.5, 1.10 Dec 2022 (6a) June 2024 (6b) Dec 2025 (6c)
7 Energy sector consultation on ANZSCO and ANZSIC codes: identify gaps in current codes relating to the modern energy sector.
1.6 Dec 2022
8 The future transport workforce – where does it overlap with the energy sector workforce? – review and consultation.
1.8 Dec 2022
9 Energy efficiency definitions: determine boundaries to be used in the AEER. 1.9 Dec 2021
WORK PACKAGE 2: NEW SKILLS DEVELOPMENT
10 Detailed stocktake and mapping of existing tertiary and vocational education and training courses: review all current training and programs.
2.1 Dec 2021
11 Scoping report: identifying priority course content for tertiary and vocational offerings: undertake gap analysis of training course offerings
2.1 Dec 2022
12 The energy workforce: identifying skills of the future energy workforce: undertake mapping of occupations, identifying generic, technical, and other skills
2.2, 2.8, 2.9 June 2022
13 Professional development pathways for energy professionals: review and gap analysis for continuing professional development across the energy sector.
2.3 Dec 2022
14 + 15 + 16
RACE workforce development labs: 14) improving coordination and collaboration between training sector and industry, 15) increasing energy sector employment attractiveness, and 16) promoting diversity in the energy sector.
2.4 Dec 2022 (ongoing
thereafter)
17 Ensuring a just transition for fossil fuel workforce: identify opportunities for skills transfer and upskilling opportunities for fossil fuel workers.
2.7 Dec 2023
18 Developing energy literacy, digital and cross-cutting skills for non-traditional energy professionals: identify pathways to improving energy literacy, in non-traditional energy professionals like bankers, real estate agents, etc.
2.8 June 2023
E3 Opportunity Assessment: Developing the future energy workforce10
Recommended research: project number, title, description FindingExpected
completion
WORK PACKAGE 3: INNOVATION PATHWAYS
19 Develop a RACE for 2030 innovation strategy to build innovation capabilities. 3.1-3.9 June 2022
20 Addressing capital gaps for innovation: mapping financing and policy options 3.6, 3.10 Dec 2022
21 Co-investment models: investigate CRC innovation management/ co-investment 3.6, 3.10 June 2023
22 Case studies: alternative procurement/ R&D contracting commercialisation. 3.6, 3.10 Dec 2023
23 Comparative study: effectiveness of intermediaries and gap analysis for Australia 3.6, 3.10 June 2024
24 Energy innovation policy lab: capacity building for the Australian public sector. 3.7, 3.11 June 2023
25 Start-up register: develop and implement a survey of start-ups 3.9 June 2023
E3 Opportunity Assessment: Developing the future energy workforce 11

Executive summary 4List of abbreviations 14
1 Introduction 161.1 RACE for 2030 17
1.2 Theme E3: Developing the future energy workforce 17
2 Background 202.1 Lack of robust measures to characterise and project the future energy workforce in Australia 21
2.2 Unclear pathways for skills and occupations required to deliver a clean energy transition 22
2.3 Innovation pathways are complex 23
3 Methodology 283.1 Literature review 29
3.2 Rapid review 30
3.3 Stakeholder consultations 30
3.4 Questionnaire/survey 31
4 Work Package 1: Market size, workforce and employment – results and discussion 32
4.1 Australia – indicative size and forward estimates 33
4.2 Methodologies for measuring and projecting the clean energy workforce 35
4.3 International approaches – overview 38
4.4 Discussion 41
5 Work Package 2: Skills for the energy transition – results and discussion 545.1 Identifying the skills and skilled workers required for a successful energy transition 55
5.2 Training and professional development programs required to ensure adequate skills 60
5.3 Pathways for closing the skills gap 64
6 Work Package 3: Energy innovation pathways – results and discussion 726.1 Mapping opportunities across Australia’s energy innovation system 73
6.2 Barriers to transformative innovation 80
6.3 Strengthening innovation pathways 82
7 Conclusion 867.1 Summary of findings 88
7.2 Next steps for RACE for 2030 96
8 References 98
Contents
E3 Opportunity Assessment: Developing the future energy workforce12

9 Appendices 106Appendix 1 – Stakeholders consulted 108
Appendix 2 – Selected Australian studies reporting on the clean energy sector 110
Appendix 3 – Work Package 1 and 2 survey 112
Appendix 4 – Studies included in the Work Package 2 rapid review 115
Appendix 5 – Case studies in clean energy employment monitoring and reporting 116
Appendix 6 – Literature reviewed for Work Package 1 120
Appendix 7 – Research roadmap 124
List of figures Figure E-1. Stakeholder involvement 6
Figure 1. Information priorities from a survey of the clean energy workforce (N=140) 18
Figure 2. Dynamics of transitions 23
Figure 3. Systems innovation model with four connected concepts 24
Figure 4. Incremental versus transformational innovation in systems innovation model 24
Figure 5. Preference for survey and projections to be clean energy or energy sector as a whole (N=38) 46
Figure 6. The energy efficiency market 49
Figure 7. Value chain of different clean energy technologies 55
Figure 8. How participants foresee shortages in skills/ roles will change in the next five years (N=35) 56
Figure 9. Participant agreement that cross-cutting skills are critical to enable Australia’s energy transition (N =36) 57
Figure 10. Ranking of sectors by emission reduction potential to 2030 64
Figure 11. Energy-related public R&D as a percentage of GDP 74
List of tablesTable E1. Research roadmap summary 10
Table 2. Number and types of stakeholders consulted 31
Table 3. Estimates of the Australian clean energy sector 33
Table 4. International approaches to energy sector employment – IEA countries 39
Table 5. Ranked importance of survey characteristics 41
Table 6. Time horizons of most importance for energy sector projections 42
Table 7. Summary of methodological approaches 42
Table 8. Proposed scope – energy categories 47
Table 9. Approach to defining energy efficiency by category 51
Table 10. Ranked order of priority for who should possess cross-cutting / soft skills 57
Table 11. Summary of barriers and facilitators of a clean energy transition 59
Table 12. Current nationally recognised training and accredited qualifications 60
Table 13. Functions of innovation systems 73
Table 14. Barriers to transformative clean energy innovation 80
Table 15. Opportunities to strengthen Australia’s energy innovation system 83
Table 16. Research roadmap projects linked directly to delivering RACE for 2030 milestones 96
Table 17. Regular monitoring of the clean energy sector – Australia and best practice approaches 116
E3 Opportunity Assessment: Developing the future energy workforce 13

List of abbreviations
ABS Australian Bureau of Statistics
ACT Australian Capital Territory
AEMO Australian Energy Market Operator
AER Australian Energy Regulator
AISC Australian Industry and Skills Committee
ANZSCO Australian and New Zealand Standard Classification of Occupations
ANZSIC Australian and New Zealand Standard Industrial Classification
ARENA Australian Renewable Energy Agency
ASQA Australian Skills Quality Authority
BAU business as usual
BIM building information modelling
CEC Clean Energy Council
CEM Certified Energy Manager
CEFC Clean Energy Finance Corporation
CGE computable general equilibrium
CMVP Certified Measurement and Verification Professional
COVID-19 coronavirus
CPD continuing professional development
CSIRO Commonwealth Scientific and Industrial Research Organisation
CVC corporate venture capital
DER distributed energy resources
DISER Department of Industry, Science, Energy and Resources
DM demand management
DNSP distributed network supply provider
EE energy efficiency
EEC Energy Efficiency Council
EECS Energy Efficiency Certification Scheme
EM energy management
EnMS energy management systems
ESD Education for Sustainable Development
EV electric vehicles
FTE full time equivalent
GBCA Green Building Council of Australia
GDP gross domestic product
HVAC heating, ventilation, and air conditioning
I/O input-output
IBER integrated building energy retrofit
IEA International Energy Agency
ILO International Labour Organization
IP intellectual property
IRCs Industry Reference Committees
IRG Industry Reference Group
ISP Integrated System Plan
IRENA International Renewable Energy Agency
ISF Institute for Sustainable Futures
LCREE Low Carbon and Renewable Energy Economy (UK)
LED light-emitting diode
LEED Leadership in Energy and Environmental Design
LNG liquefied natural gas
LPG liquefied petroleum gas
LRET/ SRES large-scale renewable energy target/ small-scale renewable energy scheme
MW megawatt
NAICS North American Industry Classification System
NEM National Electricity Market
NSW New South Wales
OECD Organisation for Economic Co-operation and Development
PPP public–private partnership
R&D research and development
E3 Opportunity Assessment: Developing the future energy workforce14

RACE for 2030
Reliable, Affordable, Clean Energy for 2030 Co-operative Research Centre
RBA Reserve Bank of Australia
RE renewable energy
RTO registered training organisation
SANRA scale for the quality assessment of narrative review articles
SBIR Small Business Innovation Research
SEDA Sustainable Energy Development Authority
USEER U.S. Energy and Employment Report
UTS University of Technology Sydney
VC venture capital
VET vocational education and training
VPP virtual power plant
WSAA Water Services Association of Australia
WWF World Wide Fund for Nature
E3 Opportunity Assessment: Developing the future energy workforce 15

1 Introduction
E3 Opportunity Assessment: Developing the future energy workforce16

1.1 RACE for 2030The Reliable, Affordable, Clean Energy for 2030 Cooperative Research Centre (RACE for 2030) is an industry-led research collaboration to drive energy innovation across the supply chain to deliver improved, lower cost and lower emission energy services for energy customers. RACE for 2030 will increase distributed clean energy uptake by increasing load flexibility and support the growth of Australian energy technology businesses. RACE for 2030’s research lessons will be driven into the market through market transformation programs to deliver the targets of:
• Reducing energy costs;
• Cutting carbon emissions; and
• Increasing customer load flexibility to allow increased penetration of renewables in the grid and increased reliability.
RACE for 2030 has four program themes:
• RACE for Business;
• RACE for Homes;
• RACE for Networks; and
• RACE for Everyone (covering cross-sectoral issues).
1.2 Theme E3: Developing the future energy workforce
Developing the future energy workforce is crucial to realising the RACE for 2030 vision of a customer-centred clean energy transition, and for the successful translation of RACE for 2030 research outcomes into industry impact. This development will need to occur in both traditional and new energy sectors, in allied industries, and among energy users.
The operation and performance of distributed energy assets and services, and their interaction with the energy system, are becoming increasingly important. This means that the development of energy management capacity and skills across the supply chain and in allied sectors, such as buildings, maintenance, transport, manufacturing, telecommunications, mining, and resources will be crucial to a smooth transition. There is a critical need to build industry capacity and develop skills for service and technology providers, customers and utilities because of the speed of change.
There is also a need to strengthen interaction and communication between the established energy sector and the start-up community. Rapidly changing technology is creating new business opportunities for start-ups, but the rate of uptake often depends on how quickly established energy businesses adapt and adopt to these new opportunities.
The project was driven by the following question:
What are the skills, innovation and learning programs required for the workforce to facilitate the energy transition with a customer‑centric and increasingly decentralised energy system, and how can they be best delivered?
The purpose of the developing the future energy workforce opportunity assessment is to describe a pathway to understanding the present and future energy workforce in Australia. The project seeks to understand the expected and potential workforce growth for a rapid and equitable transition, the specific occupations and skills that are going to be required, how to deliver the training needed, and how innovation pathways can be strengthened to support Australia’s energy transition.
The project included three work packages on:
1. Market size, workforce and employment;
2. New skills development; and
3. Innovation pathways.
The project produced a research roadmap – refer to Appendix 7 – specifying priority research projects for theme E3 for the duration of RACE for 2030, including consideration of relevant barriers and solutions.
This project was led by the University of Technology Sydney, with the support of Monash University, and in collaboration with the Australian Power Institute, Climate-KIC Australia, the Energy Efficiency Council, EnergyLab, Startupbootcamp Australia and Ultima Capital Partners.
E3 Opportunity Assessment: Developing the future energy workforce 17
1.2.1 Work Package 1: Market size, workforce, and employmentWork Package 1 focused on the development of a methodology to measure and project the clean energy market and workforce, including:
• Measuring the current clean energy market size ($) and workforce (job numbers) in Australia
• Projecting the size and composition of the future energy workforce under a range of transition pathways; and
• Providing a detailed breakdown of occupational and skills requirements.
Part of the task was to define the scope of clean energy to be included in the measurement and projection: this was assumed to include renewable energy, energy storage, energy efficiency and demand management, and some aspects of networks and transport. However, this was overtaken by the outcomes of the consultation, which made clear that measuring the energy sector as a whole and breaking it down into the relevant sectors and sub-sectors was preferred to measuring the clean energy sector alone. This is both a research finding and a recommendation of this work package.
This methodology is therefore expected to be a framework for an annual/biennial large-scale survey and a method for using the survey data to project the future energy workforce.
1.2.1.1 Why measure the energy workforce?
The energy sector is undergoing a transition away from carbon intensive fuels, requiring workforce changes on the scale of previous industrial revolutions, and this transition will accelerate over the next decade. Current energy sector employment worldwide is approximately 58 million with about half in the fossil fuel industries. While overall energy employment may increase to close to 100 million in 2050, the fossil fuel workforce is expected to shrink by nearly a quarter, from around 29 million to 22 million jobs. At the same time the energy efficiency, energy flexibility and grid upgrade workforce is expected to more than double, from about 17 million to 36 million jobs (IRENA, 2020).
This pattern is likely to be reflected in Australia. Employment in fossil fuel generation in the eastern states, which makes up about one third of the current power generation workforce, could be reduced by 49 to 78 per cent in the next 15 years.2 At the same time, new skills are required. They range from the advanced energy management needed to achieve the targeted 40 per cent increase in energy productivity by 2030 in the National Energy Productivity Plan, to constructing and managing energy storage such as pumped hydro and batteries, to building emerging industries such as green hydrogen and green steel. Further, the workforce in the renewables sector will need to expand significantly if these emerging industries are to succeed, as demand for renewable power will
2 ISF analysis of AEMO 2020 ISP, Central, Step Change and High DER scenarios.
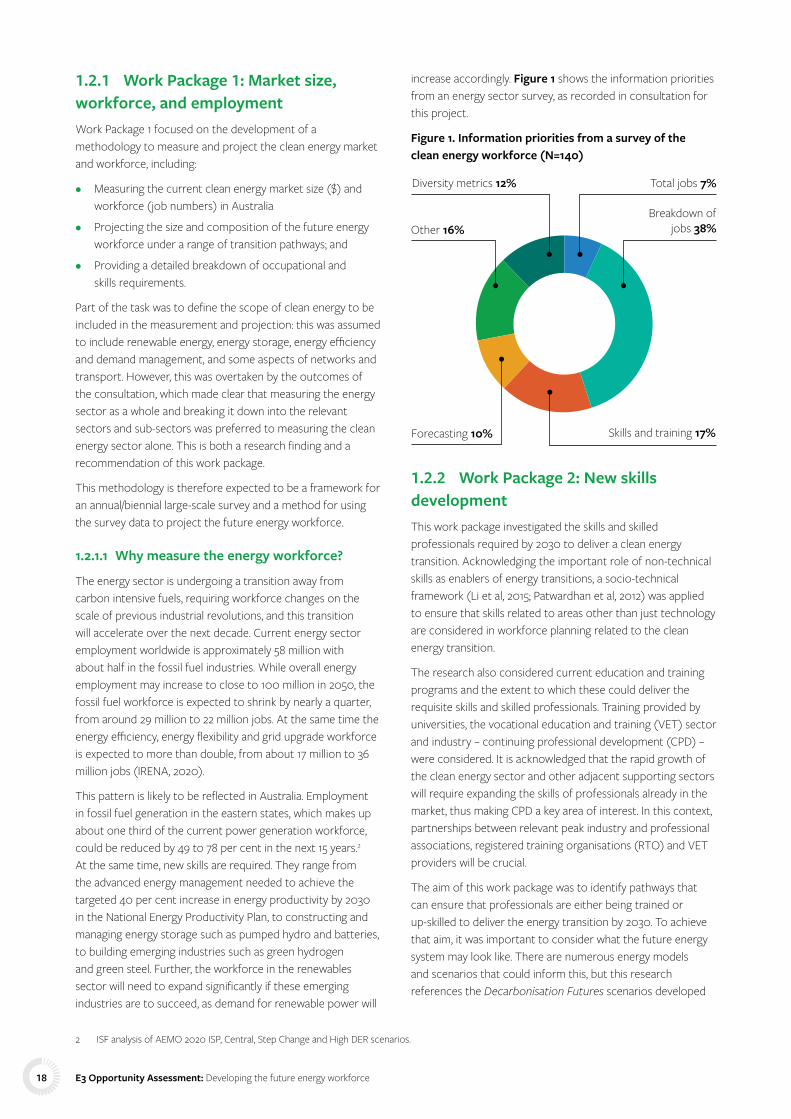
increase accordingly. Figure 1 shows the information priorities from an energy sector survey, as recorded in consultation for this project.
Figure 1. Information priorities from a survey of the clean energy workforce (N=140)
Total jobs 7%Diversity metrics 12%
Skills and training 17%Forecasting 10%
Breakdown ofjobs 38%Other 16%
1.2.2 Work Package 2: New skills developmentThis work package investigated the skills and skilled professionals required by 2030 to deliver a clean energy transition. Acknowledging the important role of non-technical skills as enablers of energy transitions, a socio-technical framework (Li et al, 2015; Patwardhan et al, 2012) was applied to ensure that skills related to areas other than just technology are considered in workforce planning related to the clean energy transition.
The research also considered current education and training programs and the extent to which these could deliver the requisite skills and skilled professionals. Training provided by universities, the vocational education and training (VET) sector and industry – continuing professional development (CPD) – were considered. It is acknowledged that the rapid growth of the clean energy sector and other adjacent supporting sectors will require expanding the skills of professionals already in the market, thus making CPD a key area of interest. In this context, partnerships between relevant peak industry and professional associations, registered training organisations (RTO) and VET providers will be crucial.
The aim of this work package was to identify pathways that can ensure that professionals are either being trained or up-skilled to deliver the energy transition by 2030. To achieve that aim, it was important to consider what the future energy system may look like. There are numerous energy models and scenarios that could inform this, but this research references the Decarbonisation Futures scenarios developed
E3 Opportunity Assessment: Developing the future energy workforce18

by ClimateWorks Australia and CSIRO (ClimateWorks Australia, 2020).
1.2.3 Work Package 3: Innovation pathwaysThis work package looked at how existing energy innovation pathways support the clean energy transition, and was framed by two key research questions:
• How are current innovation pathways supporting Australia’s energy transition?
• How can innovation pathways be strengthened for greater impact in supporting Australia’s energy transition?
Given the scale and disruption we expect will be needed to rapidly decarbonise the energy system, standard innovation will not be sufficient to transition to a clean energy system. Transformational innovation will be required to deliver change in technology, business models, behaviours, practices, and the ways we use and pay for (new) products and services. The innovation required to deliver peak carbon emissions by 2030 on the pathway to net zero by 2050 will largely depend on non-technological innovation up until 2030, and then on a combination of technological and non-technological innovation from 2030-2050 (IEA, 2020).
1.2.3.1 Defining innovation with a transformational framing
In defining innovation and innovation pathways, this research adopted Schot and Steinmueller’s (2018) three frames of innovation policy and positioned this work within the third frame.
The first frame, emerging in the post-WW2 period saw innovation policy supporting R&D activities with a focus on activating private sector investments in new knowledge and technology to drive consumption-based growth. The second frame emerged in the 1980s and saw innovation policy as supporting national systems of innovation as new knowledge systems are rapidly influenced by globalisation. The role of innovation policy is focused on understanding and building networks and clusters, ensuring linkages between different elements of the innovation system, and enabling entrepreneurship. The third frame considers innovation as a source of transformative change. It acknowledges the role of innovation in meeting the challenging environmental and social goals the global community has set for itself in the United Nations Sustainable Development Goals (SDGs), including the important role of SDG17 Partnerships, and in the United Nations Framework Convention on Climate Change ‘Paris Agreement’.
The third frame highlights the important role that innovation – particularly under frames one and two – can play in facilitating the level of change required to address sustainability goals. The third frame argues for a directionality to innovation and innovation policy towards transformational change – in this
case transformed clean energy systems. Transformed energy systems include “socio-technical system transformations (or transition) (which include) changing skills, infrastructure, industry structures, products, regulations, user preferences and cultural predilections…radical change in all elements of the configuration” (Schot and Steinmueller, 2018, p. 1562).
Adopting the third frame means that the focus is on certain aspects of innovation, such as:
• Widening the justification for policy intervention – in addition to market and system failures, policy intervention rationales rest on addressing a further four failures:
– In directionality – the inability to explore a diverse range of options – including those beyond incumbents – and then focus on a certain direction to concentrate resources and build up capabilities;
– In co-ordination – the inability to coordinate horizontally across various domains, for example, energy, mobility, and health;
– In articulation – the inability to get actors to focus on articulating shared expectations and visions, build new networks and shape new markets; and
– In reflexivity – the inability to monitor, reflect, and where necessary, question assumptions;
• Acknowledging that innovation occurs across multiple pathways – there will be no single (right) pathway;
• Understanding that pathways will involve multiple forms of innovation – including technological, organisational and social innovation;
• Understanding that innovation involves selection – where some practices, technologies, markets and business models will become dominant, and some existing configurations will be retained but transformed;
• Framing innovations as experiments – but then providing direction and resources to scale transformative change beyond a pilot or trial; and
• Managing destabilisation processes – and the phasing out of unsustainable practices.
Work Package 3 used this system to identify the transition dynamics of clean energy innovation. This involved identifying the strengths, barriers, challenges and opportunities of the current energy innovation pathways in Australia, and identifying where opportunities and leverage points exist to increase the impact and scale of clean energy innovation in order to achieve net zero ambitions.
E3 Opportunity Assessment: Developing the future energy workforce 19

2 Background
E3 Opportunity Assessment: Developing the future energy workforce20
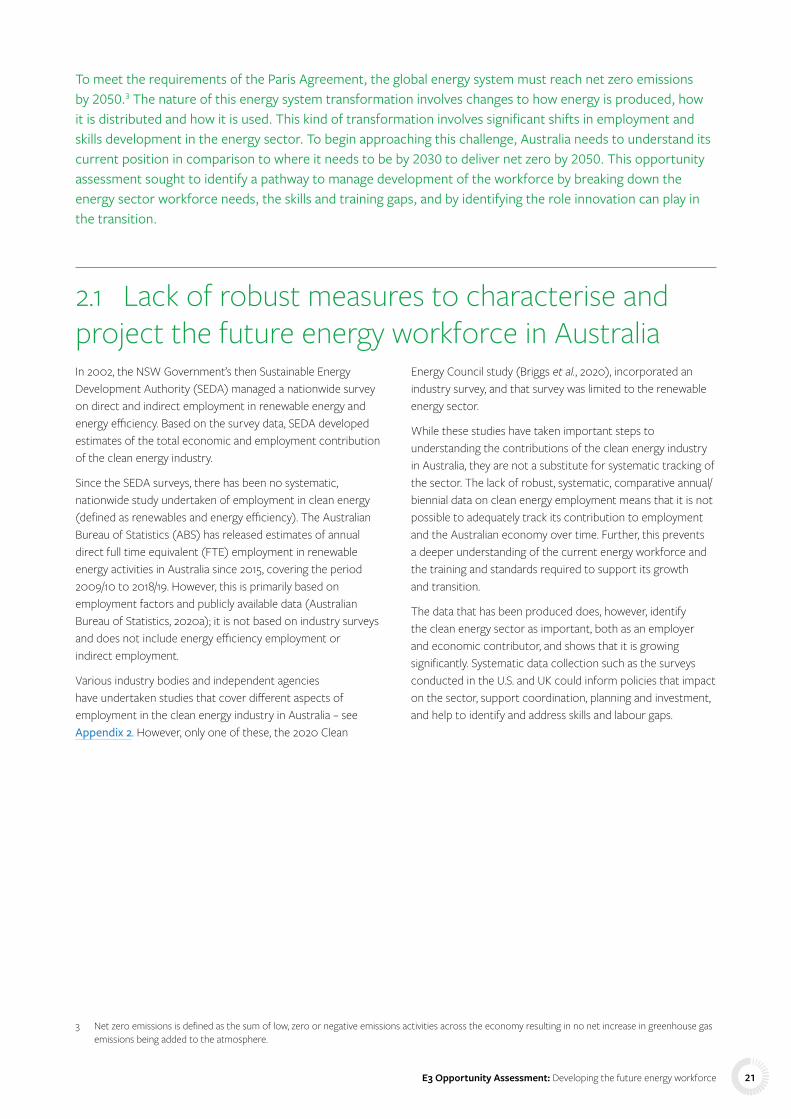
To meet the requirements of the Paris Agreement, the global energy system must reach net zero emissions by 2050.3 The nature of this energy system transformation involves changes to how energy is produced, how it is distributed and how it is used. This kind of transformation involves significant shifts in employment and skills development in the energy sector. To begin approaching this challenge, Australia needs to understand its current position in comparison to where it needs to be by 2030 to deliver net zero by 2050. This opportunity assessment sought to identify a pathway to manage development of the workforce by breaking down the energy sector workforce needs, the skills and training gaps, and by identifying the role innovation can play in the transition.
2.1 Lack of robust measures to characterise and project the future energy workforce in Australia
3 Net zero emissions is defined as the sum of low, zero or negative emissions activities across the economy resulting in no net increase in greenhouse gas emissions being added to the atmosphere.
In 2002, the NSW Government’s then Sustainable Energy Development Authority (SEDA) managed a nationwide survey on direct and indirect employment in renewable energy and energy efficiency. Based on the survey data, SEDA developed estimates of the total economic and employment contribution of the clean energy industry.
Since the SEDA surveys, there has been no systematic, nationwide study undertaken of employment in clean energy (defined as renewables and energy efficiency). The Australian Bureau of Statistics (ABS) has released estimates of annual direct full time equivalent (FTE) employment in renewable energy activities in Australia since 2015, covering the period 2009/10 to 2018/19. However, this is primarily based on employment factors and publicly available data (Australian Bureau of Statistics, 2020a); it is not based on industry surveys and does not include energy efficiency employment or indirect employment.
Various industry bodies and independent agencies have undertaken studies that cover different aspects of employment in the clean energy industry in Australia – see Appendix 2. However, only one of these, the 2020 Clean
Energy Council study (Briggs et al., 2020), incorporated an industry survey, and that survey was limited to the renewable energy sector.
While these studies have taken important steps to understanding the contributions of the clean energy industry in Australia, they are not a substitute for systematic tracking of the sector. The lack of robust, systematic, comparative annual/biennial data on clean energy employment means that it is not possible to adequately track its contribution to employment and the Australian economy over time. Further, this prevents a deeper understanding of the current energy workforce and the training and standards required to support its growth and transition.
The data that has been produced does, however, identify the clean energy sector as important, both as an employer and economic contributor, and shows that it is growing significantly. Systematic data collection such as the surveys conducted in the U.S. and UK could inform policies that impact on the sector, support coordination, planning and investment, and help to identify and address skills and labour gaps.
E3 Opportunity Assessment: Developing the future energy workforce 21

2.2 Unclear pathways for skills and occupations required to deliver a clean energy transition Similar to the International Renewable Energy Agency’s projections (IRENA, 2020), the International Labour Organization (ILO, 2019) estimates that the clean energy transformation will create 25 million jobs globally and 7 million job losses. Of the job losses, it is thought that five million people will find similar jobs in other industries; however, 1 to 2 million will need to retrain into other occupations. Aside from transferring jobs, 20 million new jobs are projected, with large investments required to train workers in the skills needed.
These projections demonstrate that substantial shifts in the energy workforce will be required. Specifically, these ‘green jobs’ are thought to require both technical (occupation-specific) skills and more general skills such as knowledge of sustainable development. Furthermore, our rapid review found that willingness and ability to engage across teams and disciplines are needed, as well as entrepreneurial, marketing and consulting skills.
Fien and Guevara (2013) suggest that it may be more helpful to think in terms of ‘green skills’ for jobs and offer a classification that goes beyond ‘green jobs’. They identify new skills associated with the following employment situations:
• Existing jobs requiring additional skill sets related to ethics, sustainability or environmental awareness;
• New jobs being created within existing industries, for example energy efficient building and construction or renewable power generation, which may require additional or different technical skills;
• New and expanded industries using existing technical skills along with ethical understanding and new technical skills, for example the renewable energy industry; and
• New and expanded industries using new occupations, though these are still being developed.
While it is becoming increasingly clear that the energy transition will necessitate a shift in skills, there is currently limited insight into what exact skills and skilled professionals are needed, where they can be trained, and what the barriers are for developing the skills and professions required. The rich literature on Education for Sustainable Development (ESD) offers some insights into the non-technical skills required (UNESCO, 2017; Brundiers et al., 2021).
E3 Opportunity Assessment: Developing the future energy workforce22

2.3 Innovation pathways are complex2.3.1 A socio-technical perspective on the energy transitionTransitions can be understood as large-scale reconfigurations of socio-technical systems that occur over decades (Markard et al., 2012). Energy systems are subject to technological, infrastructural, institutional and behavioural lock-ins which create strong path dependencies that hinder climate stabilisation efforts (Fouquet, 2016). Transitions research suggests that incremental change is insufficient to shift unsustainable systems like fossil fuel energy systems that instead require radical transformation to usher in systemic sustainable solutions (Rotmans et al., 2001). Sustainability transitions face the dual challenges of accelerating radical technological innovation, and demand-side issues of social and user acceptance (Turnheim & Sovacool, 2020; Kemp & Van Lente, 2011).
Systems transformations are holistic: “Transformations do not necessarily result from top-down approaches. They emerge from the co-evolution of multiple interdependent factors and the active engagement of diverse stakeholders” (UN Environment 2019). Transformative pathways to sustainable development require:
• Visions and narratives to guide systemic innovation towards sustainability;
• Social, policy and governance innovation;
• The phasing out of unsustainable practices;
• Socio-technical experimentation;
• Engaging and enabling actors and stakeholders collectively and in collaboration with each other; and
• Mobilising relevant human, socio-organisational, and financial resources.
Experimentation has been a focal point of transition studies and plays an enabling role in transformative change (Smith & Raven 2012). Sengers et al. (2019) note that experimentation is designed to “promote system innovation through social learning under conditions of uncertainty and ambiguity”. Real-world experimentation in the clean energy transition can be supported via multi-actor arenas such as urban living labs that utilise processes of social learning and participant co-creation for socio-technical innovation at the local scale (Liedtke, Welfens, Rohn, & Nordmann, 2012; Puerari et al., 2018). Urban living labs, demonstration projects and innovation districts have an important place-based focus where new practices and infrastructures are tested and operationalised in diverse forms ranging from emerging, grassroots initiatives to large-scale, planned and corporate-led projects across multiple cities (Sharp & Raven 2021).
Transition dynamics explain how the shift from one system to another involves the build-up and breakdown of innovations through established regimes (Geels & Schot 2010). Dominant systems face competition from niche actors such as start-ups and other actors who experiment with disruptive technologies and practices that place transformative pressure on regimes and can lead to destabilisation over time as alternatives emerge.
As Loorbach et al. (2017, p. 607) explain (Figure 2):
“ The actual transition is then chaotic and disruptive and new combinations of emerging alternatives and transformative regime elements grow into a new regime. In this process elements of an old regime that do not transform are broken down and phased out.”
Figure 2. Dynamics of transitions
Optimisation Destabilisation
Experimentation Acceleration
Chaos
Emergence
Institutionalisation Stabilisation
Breakdown Phase out
From Loorbach et al. (2017)
E3 Opportunity Assessment: Developing the future energy workforce 23

2.3.2 Applying a systems innovation approach Transformation of the energy system requires a methodology for shaping, testing and identifying combinations of interventions and ‘leverage points’ to drive growth, build resilience and foster a thriving sector. Systems innovation is a new model of innovation to catalyse systemic change and it is underpinned by four connected concepts:
• Learning by doing: Experience, exploration, and sense-making across multiple, connected experiments can create options, momentum and learning about how to achieve and accelerate transformation at scale;
• Demand-led: Catalysing systemic change through innovation means connecting the supply of innovation with demand-side actors: problem-owners and those with high ambition for change;
• Leverage points: Understanding and using the transformational properties of systems is the key to transformation; system innovations are designed to simultaneously intervene across multiple levers of change including technologies, business models, infrastructure, skills and capabilities, networks, consumer demand, financing models, policy and regulatory frameworks, perception and social norms, community participation and production systems; and
• Portfolio approach: A portfolio approach means supporting many different but connected initiatives to create combinatory effects and synergies, or to explore alternatives to learn what works in unlocking change.
Figure 3. Systems innovation model with four connected concepts
SystemInnovationPrinciples
Learn by doing
Portfolio approach
Demand led
Leverage points
The energy system in Australia is transforming, and this requires a different approach to current research and adoption investment. Innovation-as-usual – typically siloed, fragmented and focused on supplying the market with technology-led solutions – will likely lead to incremental outcomes and not drive the transformation needed to grow productivity at the rate required.
Figure 4. Incremental versus transformational innovation in systems innovation model
Siloed and fragmented activities, oftenfocused on technical improvements
Wide appreciation ofchange levers
Project finance model Portfolio financial model
Single projects andincremental change
Portfolio of connected innovationprojects that learn from each other
SYSTEM INNOVATIONINCREMENTAL TRANSFORMATIONAL
E3 Opportunity Assessment: Developing the future energy workforce24

2.3.3 Energy innovation contextThe clean energy transition challenge has two dimensions:
1. The need to scale up the deployment of available technologies to meet 2030 targets, the focus of which will need to be on non-technological innovation and driving adoption. This includes:
– Developing and validating new business models, revenue, and organisational structures; and
– Introducing and empowering customers and users to new roles; and
2. The development, deployment and scaling of a further suite of technologies and clean energy options to reach net zero by 2050. This will require:
– Multiple innovation pathways for a variety of energy options that are at varying stages of technology readiness to be deployed at scale and quickly.
In both cases this implies a different type of learning; there will need to be concurrent rather than sequential learning from innovations. Greater public intervention will be required to reduce uncertainty and risk in the development and application of new business models and technologies.
Innovation and commercialisation process
Clean energy innovation and commercialisation is already a complex entrepreneurial journey (Bumpus, 2017). Innovation and commercialisation are also staged processes, although they are not linear and involve multiple feedback loops. The resources and support structures required in each of these stages are different, and although they may involve similar actors – or even the same actors – it will be in different ways and utilising different resources. Two specific, critical, and inter-related areas where this support is necessary and different at each stage are in public policy and funding and financing.
E3 Opportunity Assessment: Developing the future energy workforce 25

2.3.4 Public policy role in accelerating clean energy innovationAccelerating clean energy innovation and adoption is a policy priority for many jurisdictions and governments globally (Doblinger et al., 2019; Watson, 2021). The role of government is identified as critical in accelerating and diffusing innovation pathways; their role in multiple stages of the innovation systems includes:
• Educating people;
• Funding research and development (R&D) and providing incentives for private actors to invest in R&D through intellectual property (IP) regimes;
• Providing demand-pull for new energy innovations by acting as first and large customers through public procurement;
• Investing in infrastructure;
• Setting enabling regulatory structures;
• Providing conducive financing environments and mechanisms that can successfully blend public and private finance to support innovation and adoption; and
• Supporting tacit knowledge creation and exchange through networks (IEA 2020a).
It is also widely acknowledged that meeting these policy priorities requires new approaches, institutions and policy interventions (Hekkert et al., 2020; IEA, 2020a; Kattel and Mazzucato, 2018).
The emergence of mission-oriented or demand-led policy mixes is seen as providing a mechanism to coordinate the vast range of public policy actions and actors to address these ‘grand challenges’ such as net zero by 2050. The way innovation pathways are framed in this report – innovation for transformative change – already implies an extended and altered role for public policy. This involves not just addressing market and systems failures, but also considering the directionality and coordination of innovations, as well as capacity for demand articulation, reflexivity and the phasing out of unsustainable practices. This requires an examination of the capabilities and capacities of public policy actors and institutions to address these new functions, highlighting a need to identify and address capability and institutional gaps. The role for government here cannot just be “about de-risking and levelling the playing field but tilting the playing field in the direction of desired goals – creating and shaping markets … driving private investment” (Kattel and Mazzucato, 2018, p. 788).
Determining the range and type of capabilities needed by policy actors to support their expanded role in innovation is an acknowledged gap in our knowledge. Kattel and Mazzucato (2018) posit that four sets of new capabilities are required in the public sector:
• A market formation role that combines leadership and engagement with a wide set of actors – including bottom-up engagement processes;
• An ability to find coherent policy portfolio (instruments and funding), coordinate this portfolio and then be able to evaluate implementation, that goes beyond market failure-based evaluation, and integrated user research, social experiments and reflexivity;
• The provision of a diverse range of expertise; and
• The development of organisational fluidity for managing new missions.
2.3.5 Funding and financing for clean energyClean energy innovations, especially those involving new technology, can have long commercialisation time horizons, and therefore require sustained and relatively large capital inputs compared with other start-up technology opportunities such as those in fintech and IT. The requirement to obtain enough funding to survive the long timelines associated with research development and deployment for products and services is colloquially known as bridging the “valley of death” (Sharpe et al., 2013). In clean energy commercialisation this can be particularly pronounced as products and services usually require extensive field testing and are subject to higher levels of regulatory and commercial scrutiny, but investment returns can be low due to the highly regulated and conservative nature of energy utilities (Bumpus 2019; Young et al., 2020). Mobilising adequate finance across the various development stages of new energy technologies and business model adoption in a timely manner to achieve net zero by 2050 is a critical challenge to address (Stern 2015, Mazzucato and Semieniuk, 2018).
The amount of financing support available to renewable energy is only one side of the story; where this investment is directed and how it is allocated is equally important, as a diverse portfolio of clean energy innovation is needed. Investment needs to spread across a wide range of energy innovation options, covering different forms of renewable energy, energy efficiency, storage, networks and more.
Different financing sources are important at each stage of innovation development. Adequate investment, and an investment structure that covers the entire development cycle from concept to sustained growth/exit, are critical in complex sectors such as energy (Bumpus 2019). The financial instrument type and the intermediary can have just as much impact on the successful development and deployment of innovation as the source – and even amount – of financing involved.
Typical financial instruments for clean energy innovation include grants, co-investment, R&D tax credits, equity, debt finance and bonds. Each of these instruments has different characteristics in terms of who they’re accessible to, the risk
E3 Opportunity Assessment: Developing the future energy workforce26

and return ratio, as well as the costs and terms of securing the funding. These differing characteristics can impact the commercialisation process, and have the effect of skewing the innovation pathway in a particular direction. For example, equity investors using a traditional venture capital (VC) fund structure, with a ten-year fund lifetime and portfolio firms that require approximately five years of funding prior to trade sale or acquisition, will preference investments that meet these requirements by delivering a return in the approximately five-year period, and avoid investments that will take longer to mature. As Mazzucato and Semieniuk (2018) point out, when there is a prevalence of one kind of finance in a sector this can determine the types of innovation that are pursued, or not, with potentially detrimental effects. Therefore, maintaining diversity in the available financial mechanisms is essential to ensuring adequate and suitable funding is available to support the broad range of energy innovations required to meet net zero ambitions.
As with any transformational technology, the more patient investors that are involved – such as institutional investors, public investment/ green banks, philanthropic investors and corporate investors – the more likely they will be able to use targeted financing sources (Sharpe et al., 2013). Private, community based, and not-for-profit funders are unlikely to provide finance for early-stage clean energy technologies. There is also a key gap in clean energy finance at the deployment stage, because they require capital-intensive
investments that are too large for VC investors but too risky for banks/debt finance. When we consider the pathways needed to catalyse innovation to achieve clean energy futures, especially in the context of RACE for 2030, these are significant gaps.
The role of intermediaries in the clean energy funding and financing space is also an important influence on the success and directionality of innovation pathways. Intermediaries can provide specialist knowledge and due diligence, and they can reduce transaction costs and information asymmetries between potential investors. In early-stage investments this means knowing who is investment ready and why, what IP is valuable and why, and what the expected development trajectory is. In many early-stage commercialisation markets, VC funds play this role, however not so much in the energy sector for the reasons mentioned. This has resulted in some direct investment – particularly in the deployment market. However, the risk here is that the skills needed to assess and manage these investments are usually not available within the one firm or fund (Young et al., 2020). Young et al. (2020) suggest a new form of financial intermediary is required to support clean energy innovation and adoption pathways. These new intermediaries would need to be able to align the interests and capabilities of various investors across a portfolio of different innovation, technology, and adoption stages.
E3 Opportunity Assessment: Developing the future energy workforce 27

3 Methodology
E3 Opportunity Assessment: Developing the future energy workforce28

This opportunity assessment adopted a mixed methodology research approach, using both quantitative and qualitative data to capture a holistic view of the energy sector workforce, the skills and training landscape, and innovation pathways.
The results of the interviews, workshops and surveys have been aggregated and synthesised to maintain the confidentiality of the interviewees unless they gave specific consent to attribute statements.
3.1 Literature review 3.1.1 Work Package 1The aim of the Work Package 1 literature review was to explore the approaches taken by different countries to quantify the workforce for the clean energy – renewable energy and energy efficiency – sector. The review focused on developed economies, particularly those with strong links to Australia – see Section 4.3. More than fifty reports were examined, with the focus on non-academic literature as the intention was to identify national practices and reporting (see Appendix 6 for a list of reports reviewed). For each relevant study, the following aspects were identified:
• The institution(s) overseeing and undertaking the work, and what type of organisation – e.g. governmental, academic, or industry association;
• Whether the study was part of a regular reporting process – e.g. annual or biennial – or ad hoc;
• The sectors included, categorised loosely as renewable energy, energy efficiency, transport, or the energy sector as a whole;
• Whether market size/ sector value was included; and
• The main methodological approaches, including details if indicators were used such as jobs/$ or jobs per MW, the inclusions and exclusions, and the approach taken to boundary issues such as how to define energy efficieincy.
Initial findings from the review were presented at the first IRG Work Package 1 workshop and are presented in greater detail in Section 4.1.
3.1.2 Work Package 2The Work Package 2 review of academic and grey literature focused on several questions:
• What could the energy system of 2030 look like, assuming Australia is on track towards reaching net zero by 2050?
• What are the technical skills required to deliver that energy system?
• What are the cross-cutting skills – social, soft and other non-technical skills – required to deliver that energy system?
• What else is required to enable an energy transition?
Several online databases were used to obtain information on education programs offered in Australia and on skills mapping including:
https://www.gooduniversitiesguide.com.au
https://www.nationalskillscommission.gov.au
https://training.gov.au/
https://www.ncver.edu.au/
3.1.3 Work Package 3Work Package 3 also conducted a short literature review of innovation pathways relevant for energy within the wider fields of socio-technical transitions and transformative innovation which helped develop the framing and approach for the work package and further data collection.
E3 Opportunity Assessment: Developing the future energy workforce 29
3.2 Rapid review In addition to a literature review, Work Package 2 completed a rapid review in conjunction with the Monash Sustainable Development Institute Evidence Review Service to address the question: ‘What are the skills, and skilled professionals, required by 2030 to deliver a clean energy transition to net zero by 2050?’ (see Appendix 4 for a list of references). Over the last decade, rapid reviews have frequently been used for efficiently synthesising evidence in policy development in situations where a broad overview of research evidence is required within a short timeframe. Rapid reviews can be completed in a short time frame because they are typically an ‘overview of reviews’ – that is, they focus on identifying and summarising existing systematic reviews, reports or other consolidated information on the topic. In the absence of available systematic reviews, the rapid review can instead look for high impact, highly cited studies (Khangura, 2012).
The literature search yielded a total of 1,489 citations after the removal of 19 duplicates. The first 100 results from 11 Google
Scholar searches were also screened. Following screening, seven narrative reviews were eligible for inclusion as well as an additional eight primary studies. A summary of included narrative reviews by methodological quality (n=7) and included primary studies (n=8) is provided in Appendix 4.
The methodological quality of the seven included narrative reviews was variable, with four reviews meeting more than half of the applicable quality criteria using the SANRA tool (Baethge, Goldbeck-Wood & Mertens, 2019) for evaluating the quality of narrative reviews. The remaining three reviews were of lower quality. However, two of these met half of the SANRA quality criteria. This indicates that reasonable confidence can be placed in the evidence from all included narrative reviews. The primary studies were not evaluated for methodological quality due to resource constraints. They covered a broad range of study types, and this should be considered when interpreting the information from these studies.
3.3 Stakeholder consultations A wide range of stakeholders were consulted across the three work packages. The types of organisations consulted are summarised in Table 2, with a full list given in Appendix 1. As a result of uncertainty related to COVID-19 and the national and international scope of the project, all stakeholder consultations, including interviews and workshops, were conducted online.
3.3.1 InterviewsAll work packages conducted interviews to help define the scope of work and gain a deeper understanding of the specific research areas. These interviews included local, state, national and international bodies, industry, universities and education providers, and research institutions to ensure as many relevant perspectives as possible were included in the process.
Work Package 1 conducted two broad types of stakeholder interviews:
1. The first set of interviews was with organisations that had detailed knowledge of one or several methodological approaches to market sizing and/or jobs modelling; and
2. The second set of interviews was with industry associations and professional associations to understand what they would wish to learn from measurement and/or projections of the future energy sector.
Work Package 2 conducted scoping interviews with subject matter experts representing industry associations and education providers. The aim was to gain insight into clean energy sector workforce shortages and education and training programs for the clean energy sector.
Work Package 3 conducted scoping interviews with key informants at the beginning of the research process to help establish the framing and key issues to address for the project. A second round of stakeholder interviews was held to gather further insights from the sector and to test initial findings.
E3 Opportunity Assessment: Developing the future energy workforce30

3.3.2 WorkshopsAll work packages held two online workshops with attendees from the E3 Industry Reference Group (IRG) – see Appendix 1 – as well as other interested and relevant representatives from industry, academia and government. Each work package used these sessions to:
• Create a common understanding of work package objectives, define research boundaries, and identify any gaps in the research approach for the first session; and
• Gain input on initial research outcomes, giving participants the opportunity to:
– Help with the testing, validation, and refinement of the findings;
– Comment on any outstanding concerns of scope; and
– Consider what areas should be prioritised in the development of the research roadmap.
In addition, the project team held a kick-off IRG meeting at the commencement of the project, and a final IRG meeting following the dissemination of the draft report.
3.3.3 Consultation paperWork Package 1 issued a consultation paper prior to the second workshop to gain feedback on the findings and recommendations for the research roadmap (Rutovitz et al., 2021).
Table 2. Number and types of stakeholders consulted
WORK PACKAGE 1 WORK PACKAGE 2 WORK PACKAGE 3
Stakeholder type Interviewees Workshop attendees Interviewees
Workshop attendees Interviewees
Workshop attendees
Industry and industry associations 5 6 3 10 10 4
Government/ Intergovernmental organisations
8 8 0 5 2 2
Academia, universities 1 1 3 3 3 3
Consultants 3 0 0 1 1 0
Non-governmental organisation (NGOs)
1 0 0 0 0 0
Sub-total 18 15 6 19 16 9
TOTAL 33 25 25
3.4 Questionnaire/surveyWork Packages 1 and 2 combined to develop an online survey that was initially sent out to the IRG members. Later, following the initial workshops, this survey was shared more broadly with other interested stakeholders, including the mailing lists made up of members and of the Australian Power Institute and the Energy Efficiency Council. The purpose of the survey was to gain further insight into the findings from the workshops and literature reviews.
The survey included a question on whether measurement should be of the clean energy sector or the energy sector as a whole, questions on skills, and questions on sectoral inclusion. The survey was open for three weeks, with 57 sufficiently complete responses. A copy of the survey can be found in Appendix 3.
Work Package 3 also conducted a survey for start-up enterprises which received five responses.
E3 Opportunity Assessment: Developing the future energy workforce 31

4 Work Package 1:Market size, workforce and employment – results and discussion
E3 Opportunity Assessment: Developing the future energy workforce32

4.1 Australia – indicative size and forward estimates
4 The report estimated 30% of the total of up to 46,000 reported to be renewable energy and 70% energy efficiency activities.
There has not been a survey of the entire clean energy sector in Australia since the NSW Sustainable Energy Development Agency (SEDA) survey in 2001/2003. Table 3 lists some of the estimates of the renewable energy and energy efficiency workforce, while Appendix 2 gives a fuller list and details on the methodology for each.
The estimated size and value of the Australian clean energy sector varies considerably, reflecting different approaches and, crucially, that each study has different inclusions. The most recent study from UTS (Briggs et al., 2020) estimated the current workforce in the combined solar, wind, hydro and batteries sectors is about 26,000 employees; adding the estimated 2,700 employees in bioenergy and government (from ABS 2020) gives a minimum of 30,000 workers in renewable energy. The oldest report, published in 2003, reported between 37,000 and 58,000 jobs in the renewable
and energy efficiency industries combined. ABS has provided annual information for construction jobs only in the renewable energy sector from 2015, with the latest update for 2018/19 reporting 27,000 jobs (Australian Bureau of Statistics, 2020a).
Although the workforce and job potential in the energy efficiency sector is likely to be higher than in the renewable energy sector, there is far less data available, reflecting the difficulty of collecting data in this diverse sector. Only two studies report on national energy efficiency employment figures. The SEDA survey estimated between 26,000 and 40,000 in 2001/2 and Green Energy Markets estimated up to 236,000 in 2019. A much more localised picture of the sector potential is provided by the UnionsACT for the Australian Capital Territory, estimating 760 new jobs (net) created by a retrofit program in the ACT over ten years.
Table 3. Estimates of the Australian clean energy sector
EntityCurrent jobs (year for estimate) Projection (year) Estimated value
RENEWABLE ENERGY
NSW SEDA (Ellis and Associates, 2003)
Between 11,190 and 17,370 employees4 (2001/2)
n/a Total economic contribution of RE and EE between $6.8 and $9.6 billion dollars in 2001/2
Climate Institute (2011) 21,000 (2010) 32,000 (2030) n/a
Australian Bureau of Statistics (2020a)
26,850 (2018/19) Construction only
n/a
Clean Energy Council (2021) More than 25,000 (2020) n/a $18.6 bn (2020)
UTS for Clean Energy Council (Briggs et al., 2020)
26,000 (2020) Does not include bioenergy or associated professionals
45,000 (peak) 34,000 (average to 2035)
n/a
ENERGY EFFICIENCY
NSW SEDA (Ellis and Associates, 2003)
Between 26,110 and 40,5304 n/a Total economic contribution of RE and EE between $6.8 and $9.6 billion dollars in 2001/2
Green Energy Markets (2019) 59,000–236,000 Additional 120,411 people employed in 2030
$323.2 million in annual energy savings
Unions ACT (2016) only for ACT
n/a 760 (net) new jobs 2025 $630 million in investment $1,360 savings per household
E3 Opportunity Assessment: Developing the future energy workforce 33
Many reports cite the additional jobs to be created by a particular scenario, but do not actually estimate the baseline. For example, the Climate Council’s 50 per cent renewable energy scenario estimates 28,000 new jobs by 2030 with 50 per cent more energy sector employment than a business-as-usual (BAU) scenario, but does not give the scale of the BAU workforce either now or in 2030 (Sinden and Leffler, 2016).
Studies provided by WWF (2020a and 2020b) and Beyond Zero Emissions (Murphy, 2020) project significant job growth should the sector receive COVID-19 recovery stimulus packages. Both reports estimate a potential of between 100,000 to 200,000 jobs across the entire clean energy supply chain, including energy efficiency measures like retrofit schemes for housing.
As noted, apart from some types of renewable energy, there is no reliable baseline information for the energy sector, nor a robust or consistent method of projection. Based on the studies listed, the indicative current size of the clean energy employment is somewhere between 90,000 and 266,000, with 59,000 to 236,000 of those working in energy efficiency. By 2030, the sector could increase by somewhere between 130,000 and 200,000 jobs (WWF, 2020a and 2020b; Murphy, 2020).
5 In 2018 there were 436 thousand employees and a sector value of $82.6 billion in operating revenues (from Eco Canada, 2019).
The current value of the Australian renewable sector is estimated as $18.6 billion (CEC, 2021). There are no current estimates for the value of the energy efficiency sector. If the ratio of sector value to energy efficiency employees were the same as in Canada5, and actual Australian energy employment is within the range of the estimates cited, the Australian energy efficiency sector could have a value of between $11 billion and $45 billion. This gives an indicative clean energy sector value of between $30 billion and $63 billion, although it should be emphasised that there is scant information supporting the energy efficiency element of this calculation. If the ratio of value to employee numbers were to remain the same as it is today, this could increase to somewhere between $64 billion and $110 billion by 2030.
E3 Opportunity Assessment: Developing the future energy workforce34
4.2 Methodologies for measuring and projecting the clean energy workforceSurveys are the only method to definitively measure energy sector employment or value, and survey data underpins all calculations of market size, whether by creating the inputs to be used for modelling or by verifying calculated data.
There are four main approaches to modelling energy sector employment and value (Breitschopf, Nathani and Resch, 2012; Czako, 2020; IEA, 2020), listed in order of increasing degrees of complexity:
• Employment multipliers (also called indicators or factors) – noting that these cannot be used to determine sector value;
• Input-output (I/O) modelling;
• Macro-econometric modelling; and
• Computable general equilibrium (CGE) modelling.
Determining and projecting the size of the energy sector may be done bottom-up, working from individual companies or projects, or calculated top down going from general economic activity to outputs for employment and value. The method chosen will depend on the questions asked, the scope of investigation, the available resources and data, and the specificity required. In practice, most assessments use a mix of methods.
Prior to detailing the methodologies, it is worth defining some terms used when discussing employment:
• Direct employment: is the work directly related to a particular activity, so for power generation this would include the work involved in manufacturing, constructing and maintaining the generation facility, and producing the fuel for fossil or bioenergy generation. Manufacturing technology-specific components – such as wind turbines – is generally counted as direct employment;
• Indirect employment: is the supply chain employment, such as the work required to produce steel, screws, cement, and other non-technology specific inputs; and
• Induced employment: is used to describe impacts which occur in unrelated sectors because of changes in disposable income resulting from the energy sector change. Induced effects cover things like increased consumption occurring as a result of increased disposable income from jobs growth, or reduced energy bills as a result of energy efficiency improvements. Induced effects can be negative as well as positive, for example reduced disposable income if energy prices increase.
Alternative survey approaches and the four main calculation methods are discussed below.
4.2.1 Surveys and other direct information Surveys are needed to determine the current size of the clean energy sector. There is a considerable range, from complete population surveys (the census) to highly targeted industry surveys. In general, surveys have a high level of accuracy provided the sample size is sufficient, and the information gathered can be tailored to exactly the outputs required in terms of detail and inclusion. The main drawback is that surveys are very resource intensive, and do not serve to project future employment, although they provide the input data for other calculation methods. The range of direct information collection methods includes:
• Census data and company reports: give a complete count and demographic information about employment by industry sector. However, segmentation is entirely dependent on the available occupational codes. In Australia these are the Australian and New Zealand Standard Industrial Classification (ANZSIC) codes, which are unfortunately extremely limited in terms of applicability to clean energy – see discussion in Section 4.3.3. Only traditional power generation and fuels are covered explicitly by codes, and many occupations are spread across other sectors such as construction or electrical services.
• Targeted industry surveys: are most commonly carried out by the relevant industry association, and are an excellent source of detailed information on an industry. The Clean Energy Council in Australia publishes annual reports on the clean energy industry (for example Clean Energy Council, 2020, 2021).
• Company and project reports: are rich sources of data for bottom-up approaches to measuring the size of the energy sector, and are frequently the base inputs for industry association publications. The caveat is that there is no common framework for reporting, particularly if information is for future rather than existing projects. Employment numbers may include significantly different information. For example, environmental impact statements frequently publish employment numbers, but these may be based on very different calculations. For example, the peak of employment during construction may be reported without indicating how long these jobs will persist; direct, indirect or induced jobs may be included, and the calculations may be the result of employment indicators which are out of date.
E3 Opportunity Assessment: Developing the future energy workforce 35

4.2.2 Employment multipliers – also called indicators or factorsThe employment multiplier approach is a bottom-up calculation using indicators of employment for each unit of some known variable. Employment multiplier calculations can be used to estimate current employment, and for projections of employment resulting from specific energy scenarios.
The advantages of this approach are that they are relatively simple to understand and are probably the most suitable for breakdowns by specific technologies, or by project, location or occupation. They may be used to determine specific occupational growth, provided the detailed employment multipliers are available. These indicators are not suitable for calculating sector value.
The variable (the denominator of the indicator) can be a physical measure, for example installed capacity of generation in MW, a single installation of a domestic solar water heater, or per $ of investment, which is frequently used for energy efficiency indicators. The most common indicators are employment per MW, per installation, or per $.
Employment multiplier calculations require the definition of boundaries for a particular sector, such as the renewable energy sector or the solar industry, and then calculate employment in that sector. While some authors consider that employment factors cannot be used to calculate supply chain impacts or net employment impacts (Breitschopf, Nathani and Resch, 2012), this is not strictly the case. Supply chain effects can be calculated to the extent that employment indicators are developed to include the supply chain, and net impacts can be considered within the boundaries defined. For example, net energy sector employment can be calculated provided the boundary is set appropriately to include technologies that are decreasing as well as increasing. However, employment multipliers are not appropriate for determining economy-wide impacts.
4.2.3 Input-output (I/O) modellingInput-output (I/O) modelling is based on interdependencies within the economy, with the basic input being the amount invested in any industry or commodity. The modelling is top down based on sectoral investment. At the heart of I/O modelling are input-output tables which detail the material and labour resources used per unit of spending in each industry. The model then links the monetary inputs in one sector to calculate the effects in other related sectors. Input-output modelling is the most frequently used method for projecting employment and savings from energy efficiency activities across the economy.
The modelling depends entirely on the I/O tables, which require sufficient data for the industry in question. For example, the amount invested in construction would be an input, and via the I/O table for construction the steel and cement required would link to the tables for the steel and
cement industries. The labour required would be calculated from the table in the same way, requiring an employment multiplier for that industry. Multipliers include direct and indirect effects (usually described as Type 1 multipliers) and may include induced effects (described as Type 2 multipliers).
A significant limitation is that there may not be sufficient data in the existing input-output tables except for long established industries, so additional information and modification is needed to augment the existing relationships to obtain more granular results within a sector. This approach has been used frequently, and methods have been suggested to adapt I/O tables to fit the current energy sector (for example, Ulrich, Distelkamp and Lehr, 2012; Garrett-Peltier, 2017) and transforming the energy sector by increasing efficiency and use of renewables is one of the primary strategies to reduce emissions. Policy makers need to understand both the environmental and economic impacts of fiscal and regulatory policies regarding the energy sector. Transitioning to lower-carbon energy will entail a contraction of the fossil fuel sector, along with a loss of jobs. An important question is whether clean energy will create more jobs than will be lost in fossil fuels. This article presents a method of using Input-Output (I-O. National I/O tables are published for Australia by the ABS; however, production of multipliers was discontinued in 2002 and the ABS does not currently plan to reintroduce them (Australian Bureau of Statistics, 2020b). The tables are limited to four-digit ANZSIC codes, so there is a single entry for electricity generation, for example, with no distinction between coal, gas and renewable generation, let alone between different types of renewable generation. This is a known weakness of the Australian I/O tables, and it is hoped that it will be addressed in the future.
There is a multi-university research collaboration in Australia (the IELab) which aims to continually update and develop the Australian I/O tables to enable regional economic assessments (Lenzen et al., 2017; Wiedmann, 2017). The IELab, which includes CSIRO and the ABS as collaborators, may be well suited to developing national I/O tables for making projections about the clean energy sector or particular aspects of it, such as energy efficiency, providing the base line inputs are available.
4.2.4 Macro-econometric models Macro-econometric models are large numeric models which combine economic theory with statistical, economic and time series data to mimic the effects of policies or shocks across the whole economy. These models do not assume perfect knowledge and rational behaviour, but rather create equations from time series data to represent agent behaviour. The key distinguishing feature of CGE models (below) is that they do not assume economies are in equilibrium prior to the modelling, or that they will reach equilibrium. This allows them to provide more room for policy to affect outcomes. For example, money supply is modelled as endogenous to the economy, allowing for stimulus and austerity effects. In some cases, technology diffusion is also treated
E3 Opportunity Assessment: Developing the future energy workforce36

endogenously, acknowledging that policy can impact the rate of technology uptake.
While I/O models or employment multipliers look at only the supply side of the economy (the changes in energy supply for example), macro-econometric models build in demand via historically observed relationships.
The advantage of macro-econometric modelling is that it looks at the whole economy and includes supply and demand effects and may therefore include a wide range of policy levers. The disadvantages are that their considerable complexity means the functioning of the models may be relatively opaque; they are very resource intensive; and they are not especially suited to looking at a single sector.
4.2.5 Computable general equilibrium (CGE) models Computable general equilibrium (CGE) models are also large numeric models which combine economic theory with economic data to mimic the effects of policies or shocks
across the whole economy. They aim to model the structure of the economy including behavioural responses, and they predict net impacts on variables such as household income, employment or trade. A key assumption is that prior to the event to be tested, at the start of the modelling, the economy is in equilibrium. A shock, for example a new policy, is applied and the model then reaches a new equilibrium; the new equilibrium is intended to mimic the economy post what is being tested or predicted. Dynamic CGE models trace the path to the new equilibrium, while static CGE models show the long-run changes only, i.e. the new equilibrium. While I/O models or employment multipliers look at only the supply side of the economy (the changes in energy supply for example), CGE models build in demand via price and behavioural effects.
As with macro-econometric models, CGE modelling has the advantage of considering the whole economy and including supply and demand effects. They also have the disadvantage that considerable complexity means the functioning of the model is opaque and resource intensive, and it is not especially suited to looking at a single sector.
E3 Opportunity Assessment: Developing the future energy workforce 37
4.3 International approaches – overviewThis section summarises the approach to clean energy employment data in each of the IEA member countries, or in the case of the EU, country groupings (see Table 4).. Appendix 2 gives a summary of how energy efficiency and renewable energy are monitored, and whether the monitoring is regular or ad hoc, and the main approaches.
The U.S. is leading on the publication of comprehensive, national, disaggregated clean energy employment data. The EU also provides comprehensive data on renewable energy, but not energy efficiency. Several European countries, such as the UK and Germany, provide detailed national level data. The UK achieves high survey return levels by making it mandatory. Compared to the leaders, Australia lags on clean energy employment and market value data.
Beyond these groupings however, data is patchy and other countries generally do not produce national level clean energy employment data. While Australia’s ABS surveys and the annual Clean Energy Council reports fall well short of best practice, that is, the comprehensive publications of the U.S, and the EU, it is a basis from which Australia can build. For some areas of data collection, challenges remain in most countries. For example, information on salaries in the renewables sector is fragmented (Muro, Rothwell and Saha, 2011). Appendix 5 gives case studies that provide more details on coverage and methodologies for the best practice examples identified.
4.3.1 Europe Of the thirty IEA member countries, twenty are included in the EurObserv’ER report (EurObserv’ER, 2019). The state of the renewable energy sector across EU member states is reported annually in the EurObserv’ER barometer, along with sectoral publications every two months (current issues include the UK, although this is likely to change). The report covers energy, technological and economic dimensions, including employment and the economic activity of each sector covered, assessed using input-output tables. The EU report covers only renewable energy, not energy efficiency, and covers both direct and indirect employment. The EurObserv’ER also covers eight EU member states that are not IEA members:
• Bulgaria
• Croatia
• Romania
• Cyprus
• Latvia
• Slovenia
• Lithuania
• Malta
Some individual countries, such as Germany and the UK, publish their own data on clean energy employment in addition to the EurObserv’ER. In the UK, the Low Carbon and Renewable Energy Economy (LCREE) is an annual survey of businesses undertaken by the Office of National Statistics covering the whole of the UK low carbon and renewable energy sector (Office for National Statistics, 2021). It covers market value and direct employment for 17 low-carbon sectors including renewable energy and energy efficiency. Businesses included in the survey are legally required to complete it.
Germany assesses the size and development of the energy efficiency (EE) and renewable energy (RE) sectors on an annual basis, and the federal government is responsible for both. For RE, the estimates are based on IO analysis and use input multipliers for 13 RE technologies that have been developed based upon surveys. The EE assessment includes estimates of employment and market size, based on both surveys and I/O tables. Individual surveys on employment and market development/size are conducted by research institutions under contract to the Federal Ministry of Economics and Technology. Employment and market size of the renewable energy sector are reported by two government departments: the Federal Ministry of Economics and Technology and the National Office of Statistics. A combination of I/O and surveys is used. The RE sector has been growing since the early 2000s and employment has been accelerated by the Energiewende – the phase-out of nuclear and shift towards large-scale wind and solar energy.
Switzerland, Norway and Turkey, although European countries, are not EU member states and are therefore not covered by the EurObserv’ER. IRENA data on renewable energy sector employment provides an indication of national data availability. For most sectors employment data for these countries are IRENA estimates based on employment factors and capacity or manufacturing data (IRENA Jobs Database, 2021). A scan of other potential sources confirmed that these countries do not appear to produce regular, systematic clean energy employment data.
4.3.2 North AmericaThe U.S. Energy and Employment Report (USEER), produced annually since 2016, is widely considered to be the gold standard for measuring and reporting energy sector employment and value. It is based on an annual survey returned by approximately 25,000 businesses across five sectors, which is scaled up using Department of Energy data and Census data for employment and wages (NASEO & EFI, 2020). The report and methodology are peer reviewed. The USEER provides nationwide coverage of the entire energy sector, including renewable energy and energy efficiency and it covers several employment-related indicators including total direct employment numbers. It does not cover indirect or induced employment.
E3 Opportunity Assessment: Developing the future energy workforce38

Canada does not produce annual, national disaggregated renewable energy employment data but has recently undertaken a study on energy efficiency employment using the USEER methodology (ECO Canada, 2019). We were unable to find recent national data on renewable energy employment for Mexico.
4.3.3 Asia PacificAustralia is covered in detail in the previous section, and we were unable to find national disaggregated data for employment in the renewable energy sector for Japan or New Zealand.
4.3.4 GlobalThe International Renewable Energy Agency (IRENA) produces the Renewable Energy and Jobs Annual Review (IRENA, 2020) with publications dating back to 2011. The report covers five main categories of renewables – hydropower, solar PV, bioenergy, wind energy, solar heating/cooling, plus other technologies. It includes direct and indirect jobs in renewable energy worldwide. IRENA provides data and analysis on issues such as local value creation, wages, education and training,
and gender equity in renewable energy employment. The IRENA jobs database provides a breakdown of employment data by sector for each country (IRENA Jobs Database, 2021). Employment numbers are based on a wide range of studies that use varying methodologies and the information is of variable quality. IRENA sources data from primary information provided by national entities such as ministries and statistical agencies, and secondary data sources such as regional and global studies. Where data is insufficient, IRENA uses estimates based on employment factors, capacity and manufacturing data.
The International Energy Agency (IEA) reported on the job potential in the energy efficiency sector in 2021. The IEA has tracked funding for energy efficiency-related measures announced as part of governments’ stimulus packages to the end of October 2020. They estimate jobs based on these funding announcements. The jobs are categorised by country, region and sector (industry, buildings and transport) as well as efficiency measures (building retrofits, industry energy efficiency, new electric cars, railways, charging infrastructure, new buildings, material efficiency, public transport, walkways and bike lanes, new efficient cars).
Table 4. International approaches to energy sector employment – IEA countries
SECTOR ANNUAL ORGANISATIONMARKET VALUE/ EMPLOYMENT MAIN APPROACH
BOUNDARIES (LEVEL OF DETAIL)
Australia Renewable energy Yes (limited period)
ABS (special report) (2020a)Clean Energy Council (2020, 2021)
ABS: Employment CEC: construction employment and investment
ABS: employment factors, CEC: project calculations
ABS: employment in renewable energy activities (construction only)
Energy efficiency No Ad hoc for example Energy Efficiency Council, Green Energy Markets (2019)
Variable Variable Variable
Canada Energy (petroleum, electricity)
Yes Statistics Canada Both Survey, census data, NAICS codes
Direct and indirect
Renewable energy Limited period
Statistics Canada (from 2013 – 2017)
Market value only
Energy efficiency/ Environmental sector
Yes ECO Canada (2019) Both Survey (focus changes year by year)
Direct employment, Value, Specific occupations, Hiring difficulties, demographics, Projections
United States
Energy sector including EE (fuels, renewable & fossil fuel electricity, transmission & distribution, EE, transport)
Yes NASEO & EFI (2020)U.S. Energy and Employment Report
Both Survey (25,000 businesses), census data (Bureau of Labor Statistics), NAICS codes
Direct employment, occupational details, hiring difficulties/ expertise gaps, 5-year trends, demographics, wage levels.
E3 Opportunity Assessment: Developing the future energy workforce 39
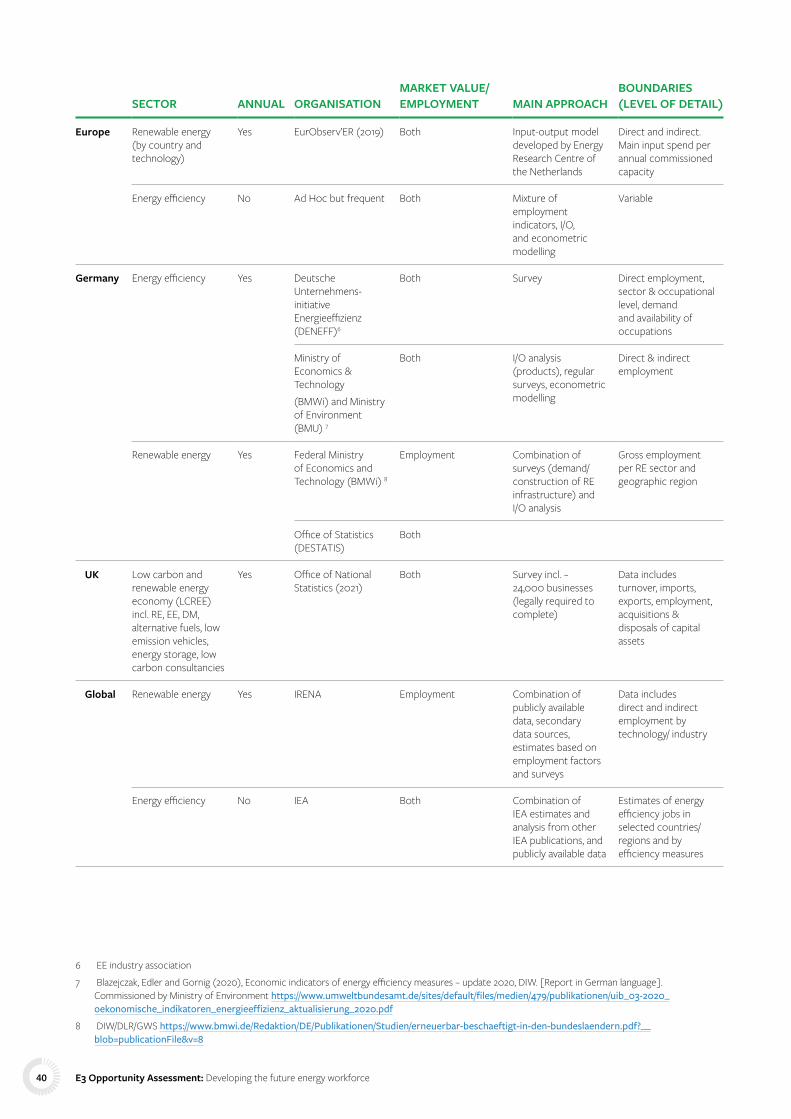
SECTOR ANNUAL ORGANISATIONMARKET VALUE/ EMPLOYMENT MAIN APPROACH
BOUNDARIES (LEVEL OF DETAIL)
Europe Renewable energy (by country and technology)
Yes EurObserv’ER (2019) Both Input-output model developed by Energy Research Centre of the Netherlands
Direct and indirect. Main input spend per annual commissioned capacity
Energy efficiency No Ad Hoc but frequent Both Mixture of employment indicators, I/O, and econometric modelling
Variable
Germany Energy efficiency Yes Deutsche Unternehmens-initiative Energieeffizienz (DENEFF)6
Both Survey Direct employment, sector & occupational level, demand and availability of occupations
Ministry of Economics & Technology(BMWi) and Ministry of Environment (BMU) 7
Both I/O analysis (products), regular surveys, econometric modelling
Direct & indirect employment
Renewable energy Yes Federal Ministry of Economics and Technology (BMWi) 8
Employment Combination of surveys (demand/construction of RE infrastructure) and I/O analysis
Gross employment per RE sector and geographic region
Office of Statistics (DESTATIS)
Both
UK Low carbon and renewable energy economy (LCREE) incl. RE, EE, DM, alternative fuels, low emission vehicles, energy storage, low carbon consultancies
Yes Office of National Statistics (2021)
Both Survey incl. ~ 24,000 businesses (legally required to complete)
Data includes turnover, imports, exports, employment, acquisitions & disposals of capital assets
Global Renewable energy Yes IRENA Employment Combination of publicly available data, secondary data sources, estimates based on employment factors and surveys
Data includes direct and indirect employment by technology/ industry
Energy efficiency No IEA Both Combination of IEA estimates and analysis from other IEA publications, and publicly available data
Estimates of energy efficiency jobs in selected countries/regions and by efficiency measures
6 EE industry association
7 Blazejczak, Edler and Gornig (2020), Economic indicators of energy efficiency measures – update 2020, DIW. [Report in German language]. Commissioned by Ministry of Environment https://www.umweltbundesamt.de/sites/default/files/medien/479/publikationen/uib_03-2020_oekonomische_indikatoren_energieeffizienz_aktualisierung_2020.pdf
8 DIW/DLR/GWS https://www.bmwi.de/Redaktion/DE/Publikationen/Studien/erneuerbar-beschaeftigt-in-den-bundeslaendern.pdf?__blob=publicationFile&v=8
E3 Opportunity Assessment: Developing the future energy workforce40

4.4 Discussion 4.4.1 Methodological approachThe choice of method to measure and project energy sector employment and value depends primarily on the questions that are to be answered, and secondarily on the data and resources that are available. If the objective is to gain knowledge of the economy-wide effects of a policy change on energy, for example, macro-econometric modelling or CGE is the obvious choice. However, these modelling techniques are less suitable if the objective is to gain a detailed skills breakdown for the new energy jobs needed by 2030, a picture of the current size or make up of the clean energy workforce, or an understanding of gender and diversity within the sector.
The primary methods of measuring and projecting the clean energy sector against the evaluation criteria are shown in Table 5.
4.4.2 Stakeholder views Our survey asked respondents to rank the importance of various survey characteristics in order to inform the choice of methodology. The characteristics included the types of information which would be gained or enabled by a survey. ranks the importance of these characteristics.
The highest-ranking characteristic was the ability to project the future energy workforce, the measurement of overall numbers of jobs by energy sub-sector, and the ability to project energy
sector value. This is closely followed by the breakdown of jobs, which came in as the most mentioned priority – with nearly 42 per cent of all mentions – in the other question which covered the importance of information to be gained from a survey.
There was strong consensus from stakeholder interviews, firstly that the scope of any survey or projection should be the entire energy sector rather than the clean energy sector alone, and that the ideal approach would be a survey followed by projections using either employment indicators or I/O analysis, or ideally both. For energy efficiency projections I/O modelling underpinned by survey data was seen as the best option.
The U.S. Energy and Employment Report was seen as the gold standard around the world, and considerable benefit was attributed to additional countries adopting a similar approach:
“ Based on IEA assessments, clean energy transitions could create 9 million new jobs in the next three years. Even with job losses in some sectors, net energy employment will grow. However, making this transition just and people-centred is critical for governments to make consistent progress on addressing climate change. Managing the transition starts with improved employment data. If countries could commit to adopting a common energy labour survey ( like the USEER), it would quickly advance global understanding of clean energy transitions’ impact on labour markets.”
Daniel Wetzel, International Energy Agency.
Table 5. Ranked importance of survey characteristics
INFORMATIONAVERAGE RANK, ALL RESPONDENTS (N=53)
(5 = vital, 1 = not important)
Ability to project future workforce from energy scenarios 3.2
Overall number of jobs by sector 2.8
Ability to project future market size (value) from energy scenarios 2.7
Breakdown of jobs by occupation 2.7
Ability to be repeated annually/ biennially 2.5
Breakdown of jobs by state/Local Government Area 2.5
Completeness of coverage 2.4
Breakdown of jobs by diversity metrics 1.9
Cost of survey 1.7
E3 Opportunity Assessment: Developing the future energy workforce 41

Another factor that came up frequently was the need to have a consistent, preferably independent, data source across the entire energy sector to allow for meaningful comparisons during the energy transition, whether these comparisons are to demonstrate the importance of particular sub-sectors, or to better manage the options to move from one sector to another. The importance of transition management came up frequently, as did the resulting requirement for detailed data on occupational and locational breakdowns of jobs across the energy sector.
Table 6 shows the time horizons identified as important by respondents, grouped by the type of organisation. An interesting outcome of the survey was the different views on time horizons between the government grouping and industry, with government plus academic respondents less focused on the long term. For all respondents – and nearly 83 per cent of the government grouping – the next five years were the most important, with only 3 per cent – and 0 per cent of the government group – focused on the horizon to 2050. Industry respondents had a longer timeframe, with 46 per cent focused on the next ten years or the horizon to 2050.
Table 6. Time horizons of most importance for energy sector projections
ALL RESPONDENTS N = 38
GOVERNMENT/ ACADEMIC/ NGO RESPONDENTS/ CONSULTANTS
N = 18
INDUSTRY RESPONDENTS
N = 13
Next 2 years 47% 61% 38%
Next 5 years 21% 22% 15%
Next 10 years 26% 17% 31%
To 2050 5% 0% 15%
Table 7 summarises the alternative methodological approaches against the criteria of importance. There seems no doubt that a survey is needed; it is the only way to gauge current status and underpins both I/O analysis and employment factor projections. A survey is also the only method to gain detailed knowledge on occupational breakdown and the skills requirements that are a high priority for most stakeholders.
Table 7. Summary of methodological approaches
SURV
EYS
CEN
SUS/
CO
MPA
NY
REPO
RTS
EMPL
OYM
ENT
IND
ICAT
ORS
INPU
T O
UTP
UT
ANAL
YSIS
MAC
RO-
ECO
NO
MET
RIC
MO
DEL
LIN
G
CGE
MO
DEL
LIN
G
Completeness ✔ X ?? ?? ✔ ✔
New & emerging ✔ ✔ X ✔ X ✔ ✔
Job numbers ✔ X ✔ ✔ ✔ ✔
Overall value ✔ ✔ X ✔ ✔ ✔
Jobs breakdown
Occupational ✔ ✔ X ✔? X ✔ X
Sectoral ✔ ✔ ✔ ✔ ✔ X
Locational ✔ ✔ ✔ X ✔ ✔
Repeatable ✔ ✔ ✔ ✔ ✔ ✔
Projections X X ✔ ✔ ✔ ✔
Accuracy ✔ ✔ ✔ n/a ?? ?? ✔? ✔?
Data needs/ resources High n/a Low Moderate High High
E3 Opportunity Assessment: Developing the future energy workforce42
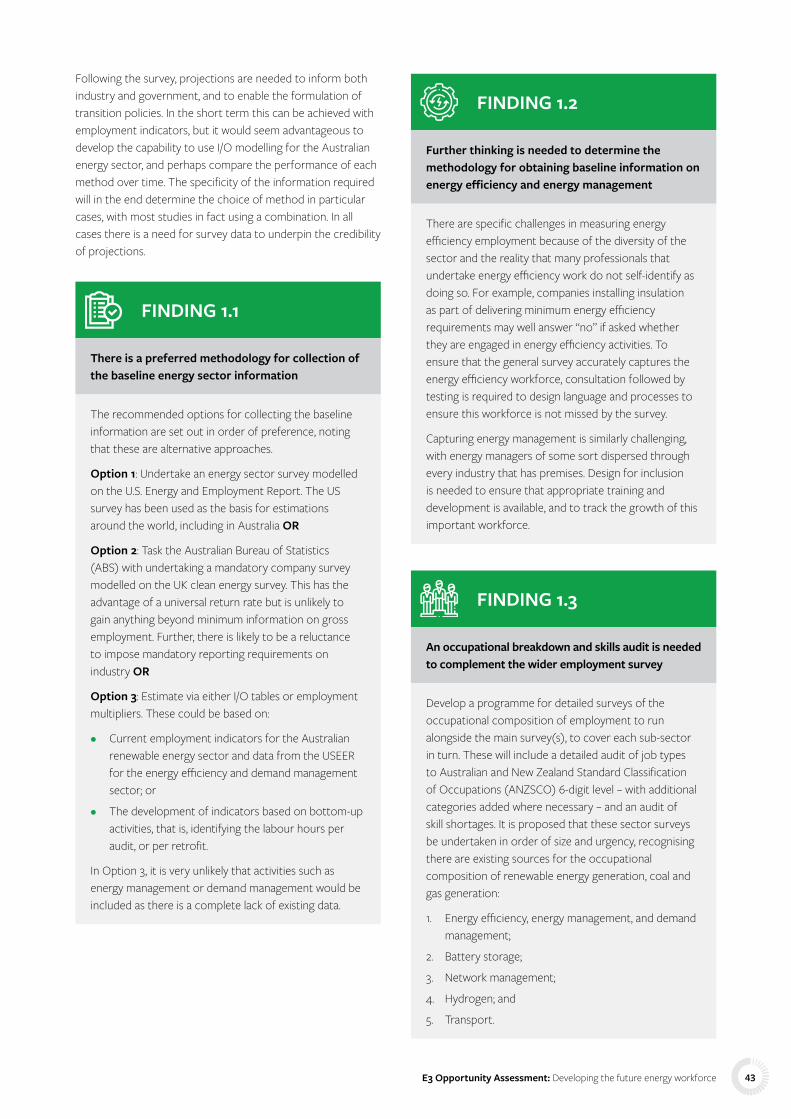
Following the survey, projections are needed to inform both industry and government, and to enable the formulation of transition policies. In the short term this can be achieved with employment indicators, but it would seem advantageous to develop the capability to use I/O modelling for the Australian energy sector, and perhaps compare the performance of each method over time. The specificity of the information required will in the end determine the choice of method in particular cases, with most studies in fact using a combination. In all cases there is a need for survey data to underpin the credibility of projections.
FINDING 1.1
There is a preferred methodology for collection of the baseline energy sector information
The recommended options for collecting the baseline information are set out in order of preference, noting that these are alternative approaches.
Option 1: Undertake an energy sector survey modelled on the U.S. Energy and Employment Report. The US survey has been used as the basis for estimations around the world, including in Australia OR
Option 2: Task the Australian Bureau of Statistics (ABS) with undertaking a mandatory company survey modelled on the UK clean energy survey. This has the advantage of a universal return rate but is unlikely to gain anything beyond minimum information on gross employment. Further, there is likely to be a reluctance to impose mandatory reporting requirements on industry OR
Option 3: Estimate via either I/O tables or employment multipliers. These could be based on:
• Current employment indicators for the Australian renewable energy sector and data from the USEER for the energy efficiency and demand management sector; or
• The development of indicators based on bottom-up activities, that is, identifying the labour hours per audit, or per retrofit.
In Option 3, it is very unlikely that activities such as energy management or demand management would be included as there is a complete lack of existing data.
FINDING 1.2
Further thinking is needed to determine the methodology for obtaining baseline information on energy efficiency and energy management
There are specific challenges in measuring energy efficiency employment because of the diversity of the sector and the reality that many professionals that undertake energy efficiency work do not self-identify as doing so. For example, companies installing insulation as part of delivering minimum energy efficiency requirements may well answer “no” if asked whether they are engaged in energy efficiency activities. To ensure that the general survey accurately captures the energy efficiency workforce, consultation followed by testing is required to design language and processes to ensure this workforce is not missed by the survey.
Capturing energy management is similarly challenging, with energy managers of some sort dispersed through every industry that has premises. Design for inclusion is needed to ensure that appropriate training and development is available, and to track the growth of this important workforce.
FINDING 1.3
An occupational breakdown and skills audit is needed to complement the wider employment survey
Develop a programme for detailed surveys of the occupational composition of employment to run alongside the main survey(s), to cover each sub-sector in turn. These will include a detailed audit of job types to Australian and New Zealand Standard Classification of Occupations (ANZSCO) 6-digit level – with additional categories added where necessary – and an audit of skill shortages. It is proposed that these sector surveys be undertaken in order of size and urgency, recognising there are existing sources for the occupational composition of renewable energy generation, coal and gas generation:
1. Energy efficiency, energy management, and demand management;
2. Battery storage;
3. Network management;
4. Hydrogen; and
5. Transport.
E3 Opportunity Assessment: Developing the future energy workforce 43

FINDING 1.4
A methodology for energy employment and market sizing projections is needed
Undertake a scoping study on what is needed to develop I/O tables for Australia to project energy efficiency employment, including examining how to link to key energy sector projections and identifying the data requirements to ensure that the baseline survey collects all the data that is needed. Investigate hybrid approaches with I/O and econometric models for energy efficiency projections.
FINDING 1.5
Energy sector projections using both employment indicators and I/O tables need to be undertaken
Undertake 5-, 10- and 20-year projections for energy sector employment by state and for Australia using both I/O modelling and employment indicators, including a comparison of the outcomes from the two methods. In the short term undertake electricity sector projections alongside the Integrated System Plan to provide some data to inform skills and training audits.
In the short term, undertake an electricity sector projection alongside the 2022 Integrated System Plan process, using the ISP scenarios and the available employment factors, and produce a whole of Australia electricity sector projection by integrating with the WA Whole of System Plan.
E3 Opportunity Assessment: Developing the future energy workforce44

4.4.3 Applying best practice in Australia – pilot survey This project has found that an energy sector survey is best practice, and that the USEER is viewed as the ‘gold standard’ around the world. The project team is therefore undertaking a pilot survey funded by the Commonwealth Department of Industry, Science, Energy and Resources (DISER) to determine whether a survey modelled on the USEER would work in Australia, and to gain an indication of cost.
The Australian context includes industry codes which have much more limited applicability within the energy sector. For example, for electricity generation, the ANZSIC contains just three industry codes – fossil fuels generation, hydro-electric generation and other generation, while the U.S. North American Industry Classification System (NAICS) codes – introduced in 1997 – include separate categories for hydro, fossil fuel, solar, wind, geothermal, and biomass power. The first intention of the pilot is to determine whether scaling up based on our much broader codes will give realistic information. The survey will:
• Cover two ANZSIC industry codes 3232 Electrical Services and 3109 Other Heavy and Civil Engineering Construction;
• Scale up according to the number of companies in the entire code (the database will supply total numbers stratified by size, total employees, and turnover); and
• Be compared with data on survey target areas from other sources, in particular information on wind and solar energy.
The two codes were chosen because we expect to find a reasonable amount of employment in wind and solar energy, and we have a second data source to verify the outcomes. We did not target codes where the maximum energy efficiency employment is expected, as we do not have any means to verify that data at present.
It should also be noted that the ANZSCO also needs updating to reflect the contemporary workforce. In another recent project examining the workforce in renewable energy generation and transmission for Infrastructure Australia and AEMO, we have found there are no obvious or applicable codes for some types of work or that the definitions of codes do not match contemporary work. Stakeholders in infrastructure and transmission that use ANZSCO to track occupational changes have expressed the same view.
FINDING 1.6
The sections of ANZSIC and ANZSCO codes that relate to energy need to be updated to make them suitable for the modern energy sector
The Australian and New Zealand Standard Industry Classification (ANZSIC) and Australian and New Zealand Standard Classification of Occupations (ANZSCO) codes have not been updated for some time and are not reflective of changes in industry and occupational structure. In particular, the codes pertaining to the energy sector are ill suited to the modern energy sector. For example, ‘electricity generation’ is only separated into hydro and coal and gas.
We recommend government initiate and fund a process for updating ANZSIC and ANZSCO codes as they relate to energy, including a consultation process to determine:
• The advantages and disadvantages of updating energy-related codes;
• The energy-related technologies and sub-sectors that could usefully be included;
• The occupations most important to track; and
• Improve comparability with other country’s measurement of energy-related industries and occupations (such as the NAICS codes).
E3 Opportunity Assessment: Developing the future energy workforce 45

4.4.4 Scope There are a range of questions in relation to the scope or boundary of the measurement or survey:
• Should the survey be of the clean energy sector or the entire energy sector?
• Which sub-sectors should be included? In particular:
– Should all electricity network activities be included or only activities related to clean energy (e.g. building transmission lines for renewable energy zones, integrating distributed energy resources)?
– Should ‘gas efficiency’ be included or is the more efficient use of fossil fuels excluded?
– Should transport be included – and if so, what types of transport (e.g. mode-shifting, rail)?
– Should ‘blue hydrogen’ produced from gas be included or only ‘green hydrogen’?
4.4.4.1 Energy sector or clean energy sector
Underlying most of these questions is a threshold question: Should the scope be the ‘clean energy workforce’ or the ‘energy workforce’? The scope of the study was expected to be clean energy, but after the first workshop we realised we needed to consult on this question. While a minority of stakeholders preferred a survey of the clean energy workforce, the overwhelming response (all interviewees and 87 per cent of survey respondents, see Figure 5) were in favour of the scope being the energy sector. The main reasons cited were:
• Greater value for facilitating energy transition: the view of many stakeholders is that the energy sector is undertaking a historic transition and drawing lines between different types of workers within the energy sector would limit its value for understanding and facilitating this transition. One of the challenges is how to retrain and redeploy workers within traditional generation, networks and retailing activities. A holistic survey will be of more value.
• Consistency of data: the need for consistent data to compare within and across the energy sector was emphasised, with data provision by an independent source particularly useful.
• Much of the clean energy workforce can be measured within an energy sector workforce survey: the survey can still capture most of the key segments of the clean energy workforce through segmentation (e.g. renewable energy technologies).
• Complexity: for some of the secondary questions listed above, the answer would be relatively straightforward if the scope were to be clean energy (exclude activities related to fossil fuels). For other areas, it would add complexity. For example, distinguishing between the electricity network workers who are ‘clean energy’ and those that are not would in practice be difficult and heavily subject to interpretation.
• Under-measurement of the energy efficiency sector: limiting the scope to clean energy would exclude energy efficiency activities that reduce the use of fossil fuels and exclude workers and market sectors which are likely to be a significant component of the energy efficiency sector (e.g. industrial process efficiency, gas boilers etc.).
Figure 5. Preference for survey and projections to be clean energy or energy sector as a whole (N=38)
Energy sector asa whole 87%
Clean energy sectoronly 13%
FINDING 1.7
The overall scope of the survey and projections should be the energy sector, broken down into sub-sectors, and should not be limited to the clean energy sector
The survey and projections should include the sectors and sub-sectors set out in Table 8 , noting all categories are further broken down into activities (manufacturing, installation, operations and maintenance, research and development) and sub-sectors (for example, residential, commercial, industrial, agricultural) where applicable.
E3 Opportunity Assessment: Developing the future energy workforce46
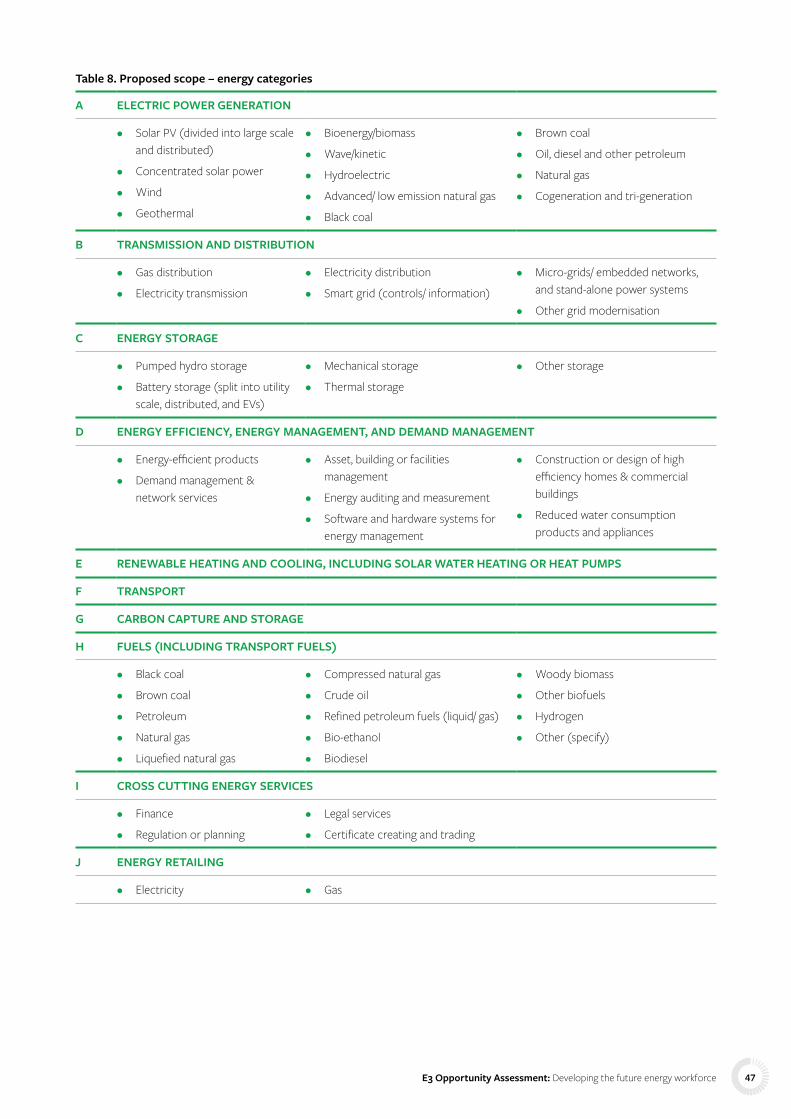
Table 8. Proposed scope – energy categories
A ELECTRIC POWER GENERATION
• Solar PV (divided into large scale and distributed)
• Concentrated solar power
• Wind
• Geothermal
• Bioenergy/biomass
• Wave/kinetic
• Hydroelectric
• Advanced/ low emission natural gas
• Black coal
• Brown coal
• Oil, diesel and other petroleum
• Natural gas
• Cogeneration and tri-generation
B TRANSMISSION AND DISTRIBUTION
• Gas distribution
• Electricity transmission
• Electricity distribution
• Smart grid (controls/ information)
• Micro-grids/ embedded networks, and stand-alone power systems
• Other grid modernisation
C ENERGY STORAGE
• Pumped hydro storage
• Battery storage (split into utility scale, distributed, and EVs)
• Mechanical storage
• Thermal storage
• Other storage
D ENERGY EFFICIENCY, ENERGY MANAGEMENT, AND DEMAND MANAGEMENT
• Energy-efficient products
• Demand management & network services
• Asset, building or facilities management
• Energy auditing and measurement
• Software and hardware systems for energy management
• Construction or design of high efficiency homes & commercial buildings
• Reduced water consumption products and appliances
E RENEWABLE HEATING AND COOLING, INCLUDING SOLAR WATER HEATING OR HEAT PUMPS
F TRANSPORT
G CARBON CAPTURE AND STORAGE
H FUELS (INCLUDING TRANSPORT FUELS)
• Black coal
• Brown coal
• Petroleum
• Natural gas
• Liquefied natural gas
• Compressed natural gas
• Crude oil
• Refined petroleum fuels (liquid/ gas)
• Bio-ethanol
• Biodiesel
• Woody biomass
• Other biofuels
• Hydrogen
• Other (specify)
I CROSS CUTTING ENERGY SERVICES
• Finance
• Regulation or planning
• Legal services
• Certificate creating and trading
J ENERGY RETAILING
• Electricity • Gas
E3 Opportunity Assessment: Developing the future energy workforce 47

4.3.4.2 Transport
For the transport sector, there are three options:
• Full inclusion: this could be seen as the logical extension of the choice to measure the energy sector workforce. If the scope of the survey is now the energy sector and not just the ‘clean’ segment, why would you select just ‘clean’ transport? However, inclusion of the entire sector could also be considered to stretch the definition of ‘energy’ beyond its rightful or meaningful boundaries. Should all services such as rail transport or truck drivers be included in the energy sector? This appears to be an overly-expansive definition of the energy sector.
• Exclusion: transport could be excluded on the basis that it is not part of the core energy sector, but that would leave out major activities and jobs that are part of the energy transition, such as the electrification of transport, electric vehicles and fuels, and major LNG production within the oil and gas sector.
• Inclusion of ‘energy-related’ segments: a third way is to include transport activities that have a direct relationship either to energy production or to the clean-energy transition. Including and excluding some transport activities adds complexity and there can always be disputes over whether this boundary has been drawn correctly. Our approach is to include the broad categories, specifically electrification, electric vehicle batteries and charging infrastructure, and the transport fuel sector (production, distribution etc.), which have the most direct relationship to energy, and to look towards potentially extending the definition to transport efficiency occupations over the medium term.
FINDING 1.8
Transport should be viewed differently to the remainder of the energy sector in the first instance
Transport accounts for a significant proportion of Australia’s energy use, and some activities, such as fuel production, are clearly within the energy sector. There has been discussion as to whether all, or none, of the transport sector should be included in an energy sector survey. We recommend:
• Including fuel and fuel production that is the direct energy element of transport – i.e. electricity production for transport, LPG production and oil processing; note that batteries are already included under energy storage;
• Including EV charging networks, as these are energy infrastructure that is both integral to the rollout of EVs and could have significant effects on electricity delivery more generally;
• In the short term (first year), exclude the rest of the transport supply chain – e.g. train drivers, truck drivers, car maintenance, from the energy sector survey;
• Undertake consultation on whether, and how, to include transport efficiency, for example, activities such as efficient vehcile operation, mode shift, car share, and information sharing that reduces energy consumption; and
• Undertake consultation on whether to include other aspects of EVs, such as component production, noting that there should be consistency across other vehicle types.
E3 Opportunity Assessment: Developing the future energy workforce48

4.3.5 Definition of energy efficiencyThe most challenging boundary definition issues arise in relation to energy efficiency and demand management. The International Energy Agency (IEA) has defined energy efficiency in the following terms:
“ In its most basic form, investments are made in energy efficiency that lead to avoided energy consumption ( for demand-side interventions such as improved vehicle efficiency) or avoided energy losses ( for supply-side interventions such as improvements to the efficiency of electricity distribution). Delivering the same level of energy service ( lighting, heating, transport etc.) while using less energy has a value related to the cost of the energy saved.”
International Energy Agency (2013), p.28.
Although there is an energy management sector, many energy efficiency activities are diffused throughout the economy and businesses, and workers may spend some of their time on energy efficiency activities and some of their time on other activities. For example, an electrician may work on energy efficiency projects and non-energy efficiency projects. Construction workers may be involved in energy efficient projects with high-star ratings and other projects which do not even meet the requirements for star ratings.
There is no universal definition of the energy efficiency market due to its complexity. In 2013, the International Energy Agency aimed ‘for the first time’ to define and measure the energy efficiency market. The IEA noted the challenge of defining an energy efficiency market:
“ The market for energy efficiency is as diffuse as energy consumption patterns themselves. It is composed of many market actors who demand more efficient provision of energy services, and those that supply the necessary goods and know-how to deliver this greater efficiency... The supply of energy efficiency cannot be considered as a distinct sector of the economy. Its magnitude is intimately linked to economic structure and the sectors in which the potential for energy savings lie.”
International Energy Agency (2013), p.17 & 36.
The IEA defined the energy efficiency market as a collection of energy-saving technologies, products and services related to end-uses within appliances and lighting, buildings and the industrial sector. Adapting and extending the IEA definition for characterising the NSW energy efficiency market, Common Capital (2014) defined the energy efficiency market as a sub-sector within energy services for a range of products within each of the three segments identified by the IEA and cross-cutting services (see Figure 6).
Figure 6. The energy efficiency market
From Common Capital, 2014
Domestic hot water
Domestic appliances and peripherals
Pool supplies
Computer equipment
Energy information
Lighting
HVACInsulation
Automation and controls
Window systems
Process heating
Motor systems
Compressed air
Refrigeration
ENER
GY
SERV
ICES
MAR
KETS
IEA
SEG
MEN
TS
ENERGY EFFICIENCY MARKET
APPLIANCESAND LIGHTING
INDUSTRIAL
CROSS-SEGMENTENERGY EFFICIENCY
SERVICES(Audits, finance,
design, maintenance,M&V, etc) BUILDINGS
RELATIVE ENERGY EFFICIENCY PERFORMANCE
E3 Opportunity Assessment: Developing the future energy workforce 49

4.3.5.1 What is the definition of energy efficiency within market segments?
The next design question is how to define energy efficiency within these market segments. How, for example, do you determine if a building construction project or a consumer product is defined as energy efficient? There are a range of options:
• Star ratings: the use of energy efficiency star ratings as a regulatory and industry benchmark is a common method to define energy efficiency. In an Australia context, star ratings exist for many classes of buildings (e.g. all new build residential buildings, commercial buildings, common areas in apartments) and a wide range of consumer goods (e.g. fridges, televisions, etc.). However, the coverage of star-ratings is not universal. For example, star-ratings do not cover all commercial buildings , and there are also significant industrial energy uses which are not covered by a star rating (e.g. boilers). A star-rating is generally the preferred method for defining energy efficiency but there are gaps in coverage that require alternative approaches.
• All-technology: in some cases, a valid approach is to simply define all economic activity and work associated with a technology as energy efficiency, where that is intrinsic to its purpose. We propose to use this approach for insulation, advanced glazing (i.e. low-e glass, double and triple glazing and associated window products) and high-efficiency lighting (e.g. LEDs).
• Regulatory standards: for some construction activities there are regulatory standards that can be used as a benchmark for defining energy efficiency. To qualify as energy efficient, a building construction would need to either be above the regulated industry standard (for new build), or to meet regulatory compliance (for retrofitting).
• Energy intensity: it could be possible to use an energy-intensity benchmark for some classes of technology. However, this would be too complex for use in a survey if that is the selected methodology.
• Survey respondent evaluation of ‘high-efficiency’: in practice, for some activities where a star-rating, technology or regulatory standard is not readily available, the survey instrument will need to ask respondents to estimate the value of an activity and the size of a workforce based on their own definition of ‘high-efficiency’.
In the pilot survey, we are using the last option (respondent evaluation of ‘high-efficiency’). Our recommended approach is to use a mix depending on the availability of benchmarks and the specific characteristics of the activity or technology, and to consult further on this topic prior to roll out of a full survey. Table 9 shows the sectors we consider need defining, and either our proposal or a note that it requires further consultation.
FINDING 1.9
Energy efficiency and demand management definitions for the survey need to be determined in consultation with industry, government and other stakeholders
The U.S. Energy and Employment Report survey uses precise definitions of what are energy efficiency activities, generally referring to a Leadership in Energy and Environmental Design (LEED) or an Energy Star standard. We have examined the options to do this within Australia and have found the boundaries less well defined. For the pilot survey we have asked respondents to use their own definition of high efficiency as an interim measure. We recommend:
• All products and services for insulation, high efficiency glazing and LED lighting should be defined as energy efficiency;
• Additional consultation on other energy efficiency products and technologies – to establish where the boundary should lie between efficient and non-efficient products – should be undertaken; and
• Consultation on which definitions, if any, should be relative to regulatory standards, that is, once a current energy efficient product becomes the regulated minimum, should it cease to be included?
E3 Opportunity Assessment: Developing the future energy workforce50
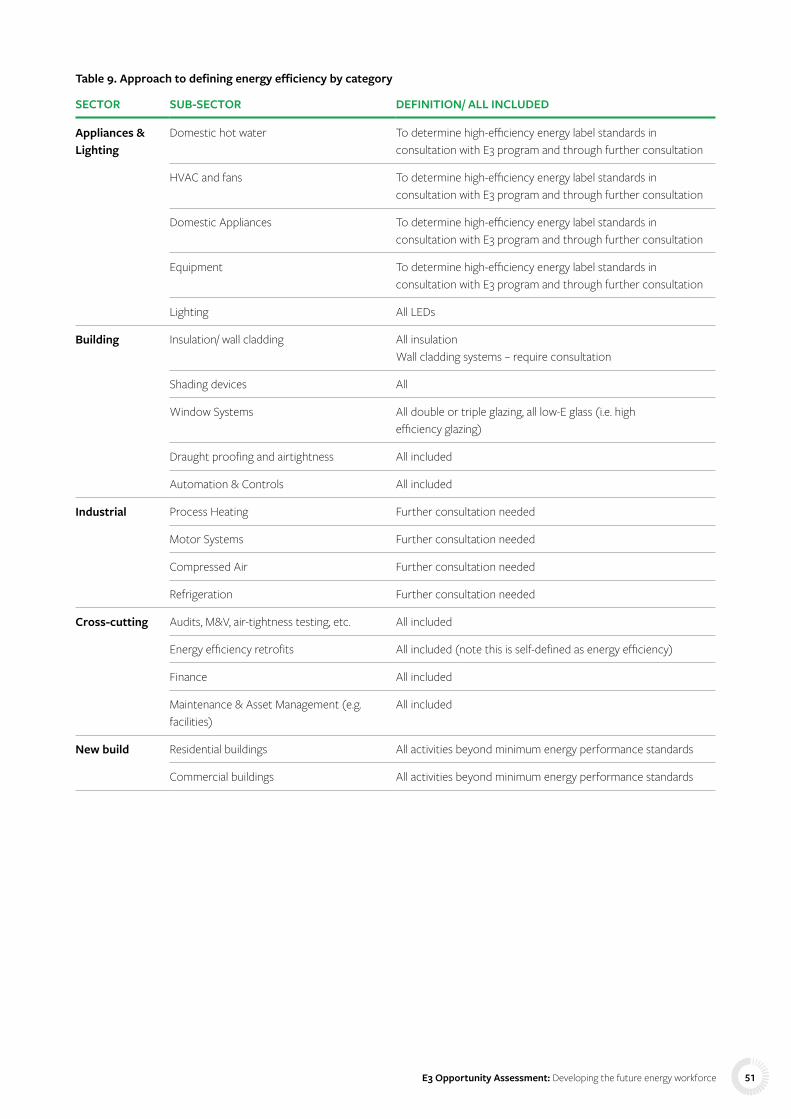
Table 9. Approach to defining energy efficiency by category
SECTOR SUB-SECTOR DEFINITION/ ALL INCLUDED
Appliances & Lighting
Domestic hot water To determine high-efficiency energy label standards in consultation with E3 program and through further consultation
HVAC and fans To determine high-efficiency energy label standards in consultation with E3 program and through further consultation
Domestic Appliances To determine high-efficiency energy label standards in consultation with E3 program and through further consultation
Equipment To determine high-efficiency energy label standards in consultation with E3 program and through further consultation
Lighting All LEDs
Building Insulation/ wall cladding All insulation Wall cladding systems – require consultation
Shading devices All
Window Systems All double or triple glazing, all low-E glass (i.e. high efficiency glazing)
Draught proofing and airtightness All included
Automation & Controls All included
Industrial Process Heating Further consultation needed
Motor Systems Further consultation needed
Compressed Air Further consultation needed
Refrigeration Further consultation needed
Cross-cutting Audits, M&V, air-tightness testing, etc. All included
Energy efficiency retrofits All included (note this is self-defined as energy efficiency)
Finance All included
Maintenance & Asset Management (e.g. facilities)
All included
New build Residential buildings All activities beyond minimum energy performance standards
Commercial buildings All activities beyond minimum energy performance standards
E3 Opportunity Assessment: Developing the future energy workforce 51

4.3.5.2 Should all work on energy efficient products be counted, or just the incremental work?
A further challenge arises in relation to determining what should be measured. Should all work on energy efficient products or buildings be counted or only the additional energy efficiency component of investment and work – what is often known as the ‘energy efficiency premium’?
“ A consumer or business that decides to invest in more energy-efficient equipment must pay the full cost of the equipment, which can be separated into two parts: the cost of a new but very standard and less efficient piece of equipment (the ‘base cost’), plus the cost of the added increments of energy efficiency. This second cost represents the ‘energy efficiency premium’. The base plus the premium equals the full technology cost, or the ‘total investment’ in efficiency.”
International Energy Agency (2014), p33.
“ Separating out the energy efficiency component of total spending on goods and services, as opposed to ongoing expansion, renovation and replacement of the stock of buildings and goods, is challenging.”
International Energy Agency (2013), p43.
In practice this question needs to be considered for different methodologies and aligned with what the purpose of the information is.
Looking at the practical questions first, in a broad survey, the default position is to collect information covering all work rather than the incremental work, as it is not reasonable to expect a company to report on how much additional time their employees spend on efficiency activities compared to a hypothetical installation of baseline, non-efficient products (for example, standard glazing rather than high efficiency). Thus, for the current workforce, it is common practice to collect information on the total workforce employed on energy efficiency activities (however energy efficiency activities are defined), and the total value of those activities or products. These could potentially be adjusted, provided additional research is done to identify the incremental proportion of work, so that both can be reported, that is, that there are X workers engaged with energy efficiency activities, with Y of those estimated as additional jobs resulting from increases in energy efficiency or energy efficiency programmes.
In projections, by contrast, the usual method would be to use incremental spend in I/O tables, which will by default produce the incremental energy efficiency employment. This could potentially identify both incremental and total work, provided the I/O tables are calibrated to do this. There are several options:
• Option 1: Measure all work for the current workforce and incremental work for the projections of the workforce, as these are the default outputs from the two main methods. The disadvantage of this approach is that the numbers will not match, so that it will always appear as if energy efficiency jobs have disappeared (or been exaggerated).
• Option 2: Measure all work, or incremental work only, for both the current workforce and the projections, by estimating the proportion of current work which is non-incremental, or by calibrating the I/O tables to produce all the work on EE products. The disadvantage of this approach is that in the first case there is likely to be considerable double counting in the projected work, while in the second case there is likely to be significant underestimation of the current workforce who are engaged on energy efficiency activities.
• Option 3: Report both all work and incremental work for energy efficiency activities for both current workforce and projections; this is perhaps closest to reporting net energy sector jobs, with the caveat that the jobs that are being ‘moved’ to energy efficiency are likely to be in construction rather than energy.
We recommend option 3 as the most transparent option, while noting that there may be an interim stage in which current measurements include all work with only very broad estimation of how much of that is an incremental gain.
FINDING 1.10
Both ‘all energy efficiency work’ and ‘incremental energy efficiency work’ should be measured
Measure and report both metrics as far as possible, that is, ‘all work’ and ‘incremental work’ for energy efficiency activities for both current workforce and projections, as this is perhaps closest to reporting net energy sector jobs. This will require developing indicators to adjust baseline measurements of energy efficiency activities for the incremental proportion.
E3 Opportunity Assessment: Developing the future energy workforce52

E3 Opportunity Assessment: Developing the future energy workforce 53

5 Work Package 2:Skills for the energy transition – results and discussion
E3 Opportunity Assessment: Developing the future energy workforce54

5.1 Identifying the skills and skilled workers required for a successful energy transitionThe energy systems of 2030 and 2050 will look very different to today’s system. The transition to a clean and more decentralised system will lead to significant changes, such as a growing diversity of energy generation, the increased prominence of demand-side measures, and the need for grids to be smarter to connect the various elements. All of this will require significant shifts in employment and skills, with the clean energy labour force in 2030, as previously noted in this report, predicted to be larger (Briggs et al., 2020; Sinden and Leffler 2016; IRENA, 2020), and have a significantly different composition. In the transition to clean energy, technical (occupation-specific) skills are required as well as other sector-spanning competencies, such as environmental awareness and a profound understanding of sustainability concepts (Lucas et al., 2018).
5.1.1 Technical / occupation specific skills required for the energy transitionUp to 80 per cent of renewable energy jobs are currently in design, manufacturing, and installation, but by 2030 almost 50 per cent of those jobs could be in operation and maintenance (Briggs et al., 2020). When considering the technical skills required for the clean economy, it is therefore necessary to think about skills across the entire value chain. A simplified typology of the value chain – adapted from IRENA (2018) – indicates five phases, as shown in Figure 7.
Taking a sectoral approach provides an additional lens for considering the required skills and jobs. The Decarbonisation Futures study (ClimateWorks Australia, 2020) highlights electricity, buildings, transport, industry – including manufacturing, mining and resources – and agriculture and land as the key sectors that need to fully decarbonise by 2050. Agriculture and land are less relevant from an energy transition perspective as the possible interventions in that sector are
largely non-energy related. Overlaying the value chain with this sectoral approach provides a detailed framework for analysing the required skills. One can then investigate, for example, what skills are required to design net zero buildings, or maintain battery storage systems, or procure more energy efficient equipment, or connect renewable energy systems to the grid.
A further useful typology when considering the required skills to enable the energy transition is based on different occupations. A good example is introduced by Briggs et al. (2020) specifically for renewable energy but is applicable more generally. They point out that the energy labour force can be broken down into: labourers, machine operators and drivers, trades, professional services and managers. These occupational groups would require different types of training and qualifications, although further detail is needed on the specific occupations.
One factor cuts across the value chain and different sectors and occupations: the growing importance of digital skills in the energy sector. An earlier study into the skills required for electricity networks (Energy Skills Queensland, 2016) referred to the emergence of a ‘digitally-enabled workforce’ alongside the traditional energy workforce. Critical occupations within a ‘digitally enabled workforce’ include:
• Data specialists – analytics and visualisation;
• Cyber security specialists; and
• Software and application programmers.
These occupations are in high demand across the economy and attracting people who have specialist digital skills and knowledge of the energy sector could be particularly challenging (Hong et al., 2018). Most workers in the energy system of the future will need some level of digital skills, and studies in the water sector have highlighted how challenging it can be to develop or attract these skills (WSAA, 2017).
Figure 7. Value chain of different clean energy technologies
Adapted from IRENA (2018)
DecomissioningOperation andmaintenance
Installationand connection
Project planning/design
Procurement/manufacturing
E3 Opportunity Assessment: Developing the future energy workforce 55

5.1.1.1 Current shortages in technical skills in Australia
Meeting the future skills needs of the energy sector is critically important as there will be a growing demand for skilled tradespeople and energy professionals. The consultation process for this report, and for several previously published studies (Briggs et al., 2020; IRENA, 2020), revealed that the clean energy industry in Australia is already experiencing significant skills shortages. The Reserve Bank of Australia (RBA) defines skills shortages as occurring “when demand exceeds supply of appropriately skilled workers available at a prevailing market wage” (Leal, 2019). It is clear from this definition that meeting the energy sector’s workforce needs will have both qualitative (appropriate skills) and quantitative (enough people) components.
Some of the current technical skills shortages highlighted in the literature, survey responses and stakeholder engagement are:
• Battery manufacturers;
• Construction managers for wind and large-scale solar projects;
• Cybersecurity / Internet of Things engineers / software engineers;
• Electricians certified to install solar PV (particularly in rural areas);
• Energy auditors / energy management system consultants;
• Energy data analysts / energy data scientists;
• Energy managers / facilities managers with an adequate understanding of energy;
• EV infrastructure engineers;
• EV ‘mechanics’ for EV repair and service;
• Grid engineers;
• Power system engineers / control engineers / renewable energy engineers;
• Specialist truck drivers; and
• Wind turbine blade and turbine technicians.
Survey respondents retained anonymity, as set out in the ethics processes for the survey. One respondent remarked:
“ [There are] so many shortages! The Australian workforce is behind in most areas related to the energy transition.”
More than 45 per cent of survey respondents indicated they expected the situation to worsen during the next five years and less than 20 per cent expected the situation to improve (see Figure 8).
9 See Appendix 4 for a list of the reports reviewed
Two survey participants stated:
“ We have shortages now; however I don’t understand what the whole industry is doing to train for these skill sets.”
“ The market is doing it for us, but very slowly, because the government is incapable of bold action.”
Figure 8. How participants foresee shortages in skills/ roles will change in the next five years (N=35)
Improve 17%Unsure 26%
Stay the same 11%Worsen 46%
Ultimately, a chronic shortage of skilled workers could become a significant barrier to successfully introducing clean energy solutions by potentially causing project delays and/or cost increases that would make such solutions less economically attractive (Oke et al., 2018). Alternatively, if work is undertaken by inadequately skilled workers it could result in poorer performances and a negative perception of these clean energy technologies, a concern highlighted in the Royal Commission into the Australian Government’s Home Insulation Program (Commonwealth of Australia, 2014).
5.1.2 The importance of cross-cutting skills to the energy transitionA rapid review was commissioned as part of this research to address the question: What are the skills and skilled professionals required by 2030, to deliver a clean energy transition by 2050?9
The review found that the social or cross cutting skills of process and project management, along with a strong need for retail and marketing, were more frequently reported as being needed to achieve clean energy transitions. Of the specific skills identified as being required for clean energy transitions, most related to the complexities of raising awareness, communicating and convening dialogue across a range of sectors and disciplines; and fostering the shared vision and commitment between these diverse actors that is critical
E3 Opportunity Assessment: Developing the future energy workforce56
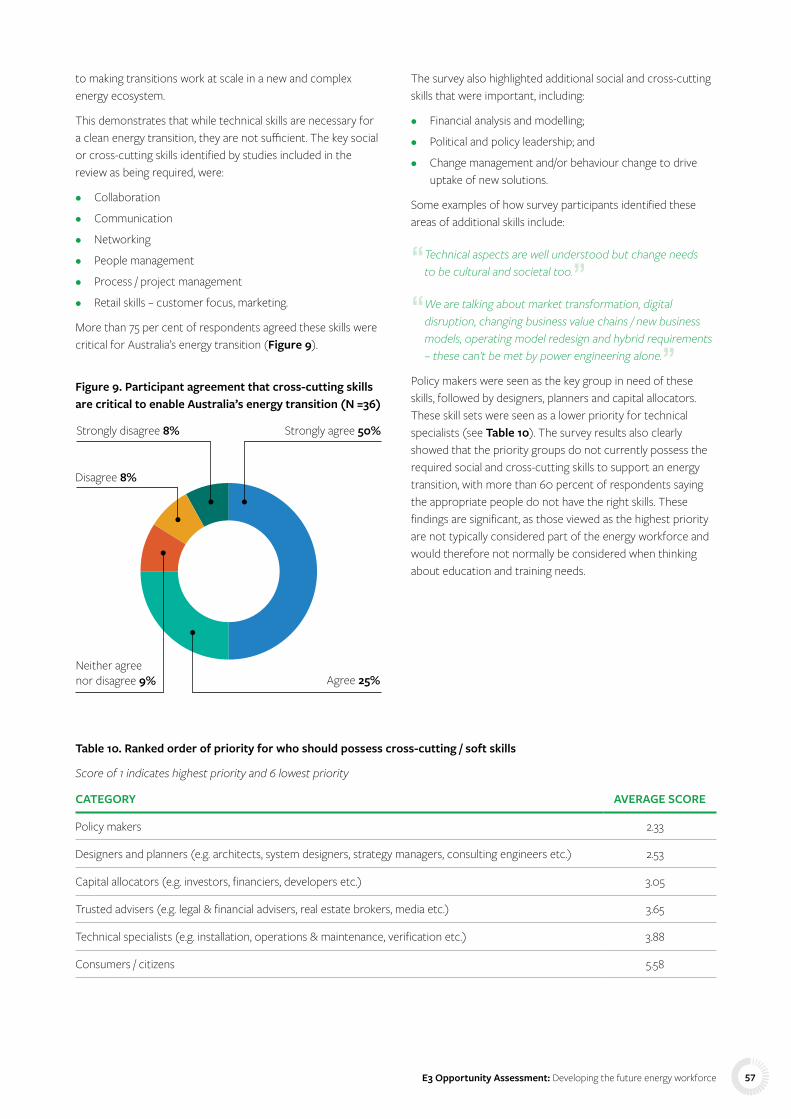
to making transitions work at scale in a new and complex energy ecosystem.
This demonstrates that while technical skills are necessary for a clean energy transition, they are not sufficient. The key social or cross-cutting skills identified by studies included in the review as being required, were:
• Collaboration
• Communication
• Networking
• People management
• Process / project management
• Retail skills – customer focus, marketing.
More than 75 per cent of respondents agreed these skills were critical for Australia’s energy transition (Figure 9).
Figure 9. Participant agreement that cross-cutting skills are critical to enable Australia’s energy transition (N =36)
Strongly agree 50%Strongly disagree 8%
Agree 25%Neither agreenor disagree 9%
Disagree 8%
The survey also highlighted additional social and cross-cutting skills that were important, including:
• Financial analysis and modelling;
• Political and policy leadership; and
• Change management and/or behaviour change to drive uptake of new solutions.
Some examples of how survey participants identified these areas of additional skills include:
“ Technical aspects are well understood but change needs to be cultural and societal too.”
“ We are talking about market transformation, digital disruption, changing business value chains / new business models, operating model redesign and hybrid requirements – these can’t be met by power engineering alone.”
Policy makers were seen as the key group in need of these skills, followed by designers, planners and capital allocators. These skill sets were seen as a lower priority for technical specialists (see Table 10). The survey results also clearly showed that the priority groups do not currently possess the required social and cross-cutting skills to support an energy transition, with more than 60 percent of respondents saying the appropriate people do not have the right skills. These findings are significant, as those viewed as the highest priority are not typically considered part of the energy workforce and would therefore not normally be considered when thinking about education and training needs.
Table 10. Ranked order of priority for who should possess cross-cutting / soft skills
Score of 1 indicates highest priority and 6 lowest priority
CATEGORY AVERAGE SCORE
Policy makers 2.33
Designers and planners (e.g. architects, system designers, strategy managers, consulting engineers etc.) 2.53
Capital allocators (e.g. investors, financiers, developers etc.) 3.05
Trusted advisers (e.g. legal & financial advisers, real estate brokers, media etc.) 3.65
Technical specialists (e.g. installation, operations & maintenance, verification etc.) 3.88
Consumers / citizens 5.58
E3 Opportunity Assessment: Developing the future energy workforce 57

5.1.3 Technical or socio-technical transition On face value, there appears to be a discrepancy between Australia experiencing a significant shortage of workers with the appropriate technical skills, and social and cross-cutting skills being considered more important in the literature review. This tension was expressed through the workshops and by some survey respondents, with one noting:
“ The core skills required are technical and practical, to ensure that systems are well designed, operate effectively and safely. The soft skills are very important but are much easier to obtain through short courses etc. (unlike engineering skills).”
This tension is likely to have derived from the framing of Australia’s energy transition as one of a technical nature. Prime Minister Scott Morrison recently argued Australia would achieve a target of net zero emissions through “pioneering entrepreneurialism and innovation of Australia’s industrial workhorses, farmers and scientists’’ and the “commercialisation of low emissions technology” (Prime Minister of Australia, 2021).
In contrast, sustainability literature describing energy transitions across the world uses a socio-technical frame (Li et al., 2015) which acknowledges that change is an “irredeemably social process” and that it is unhelpful to draw boundaries between the social and technical domains (Eyre et al., 2018). This literature outlines the utility of defining four interrelated categories where change is needed for an energy transition:
1. Physical infrastructure – for example, generation assets, grids and network infrastructure, building envelopes, electrical equipment;
2. Consumer behaviour and preferences;
3. Institutional and governance arrangements – that is, the legal and regulatory framework in which energy systems operate; and
4. Energy business models.
A similar socio-technical framing is also used in other sectors undergoing a transition. A study by the Water Services Association of Australia (WSAA, 2017) into workforce skills for the future of the water sector, for example, highlighted four key drivers of change that need to be considered: technology; customers; regulation and government; and climate change. To focus only on the skills to deal with technological changes would be inadequate.
E3 Opportunity Assessment: Developing the future energy workforce58

Patwardhan et al. (2012) contrasts Australia’s initial slow adoption of on-grid (i.e. large-scale) renewable energy with the experiences in Germany and Japan. The regulations, government incentives and strong industrial environments in these countries assisted these technologies to become mainstream. The authors emphasise that such studies highlight the importance of integrated energy, industrial and technology policies to achieve a rapid transition. The need to focus on more than just technical skills is also corroborated by a survey of more than 300 executives on moving organisational energy use to 100 per cent renewables (Deloitte, 2019). It found that while a workforce with the required technical skills was seen
as very important, other ecosystem factors such as policy or regulatory changes, availability of new or additional finance sources and structures, and simpler contracts or markets were seen as even more important.
The rapid review undertaken for this project highlighted a range of clean energy transition barriers and facilitators. Skills and training are one area of focus, but there are other areas that need to be addressed, including the business, technology, community and cross-sectoral areas. A summary of the findings on barriers and facilitators is presented in Table 11.
Table 11. Summary of barriers and facilitators of a clean energy transition
CATEGORY BARRIERS FACILITATORS
Business-related • Lack of business models
• Difficult to quantify financials
• Limited financial resources
• Perceptions of being beneficial/ good investments
Technology / infrastructure
• Emerging technologies
• Infrastructure changes
• Operational changes
• Government support, especially at the municipal level
Skills and training • Skill/ workforce deficiencies
• University training does not reflect skill/ workforce needs
• Poor consensus & coordination between tertiary institutions
• Courses with high industry interface, practical and problem-solving content
• Continuing professional development (CPD) opportunities from industry
Community & cross-sectoral
• Low citizen involvement
• Low trust between parties
• Lack of ambition
• Lack of knowledge
• Power imbalances
• Perceptions of being beneficial
• High awareness
• Shared commitment
• Good stakeholder cooperation
A focus on technical skills requirements and shortages alone is thus not sufficient to enable a successful clean energy transition. Skills to enable changes in governance, business model and consumer behaviour alongside the implementation of new technologies are crucial. Social or cross-cutting skills are particularly important to make the case for change, and to foster collaboration between various trades, industries and
other stakeholder groups that might not have conventionally worked together.
The importance of a socio-technical approach is also explored in the context of innovation pathways in Work Package 3 – see Section 6.5.2. Training and professional development programs to ensure adequate skills
E3 Opportunity Assessment: Developing the future energy workforce 59

5.2 Training and professional development programs required to ensure adequate skills
10 https://training.gov.au/
11 https://www.gooduniversitiesguide.com.au/
5.2.1 Current vocational and tertiary education and trainingGiven current skills shortages, a growing demand for skilled workers and the need for people to have social or cross-cutting skills, education and training has an important role to play in enabling a clean energy transition. In analysing the current education and training programs in the market, it is necessary to consider both the qualitative aspects (Are they effectively teaching the right things?) and quantitative aspects (Are enough people being trained?) of current training supply. Post-secondary education considered in this report includes vocational education and training (VET), university courses, industry accreditations and continuing professional development (CPD).
There have been various studies (Allen Consulting Group, 2012; GHD, 2010; Lucas et al., 2018; Pears, 2020) that have raised concerns about the quality or appropriateness of formal education and training programs as well as the sector’s ability to meet the scale of future needs. GHD (2010), for example, concluded that:
“ Both the higher education and VET sectors are interested in developing training that will address the sectors’ skills development needs, but supply is likely to lag behind demand until external funding sources are identified and/or there is a stronger business case made to support the investment of time and resources in program development.”
The Lucas et al. (2018) study on education and training gaps in the renewable energy sector found a mismatch between offerings by the education system and industry demand, particularly when considering the quantity of higher education courses offered against the high industry demand for hands-on training.
To understand the extent of training available in the Australian education sector, a basic word search was conducted on two databases that contain listings of university and VET courses respectively. Table 12 highlights the number of VET, undergraduate and postgraduate courses that contain a reference to specific keywords in their course descriptions.
Table 12. Current nationally recognised training and accredited qualifications
(Results of web-based database search)
KEYWORDSVET QUALIFICATIONS AND ACCREDITED COURSES 10
UNDERGRADUATE DEGREES CONTAINING KEYWORDS11
POSTGRADUATE DEGREES CONTAINING KEYWORDS
Renewable energy 9 (15 units of competency) 82 52
Energy efficiency 5 (6 units of competency) 117 76
Sustainable energy 1 (5 units of competency) 194 129
Electrical 41 (213 units of competency) 64 26
Solar 1 (3 units of competency) 2 8
The high number of university degrees is a result of universities having a high degree of freedom to develop and offer new courses. The listed courses are available at many universities, implying, at a basic level, a strong supply across the country. Course approval in the VET sector, on the other hand, is highly centralised, but approved courses can be offered by multiple registered training organisations (RTOs). All the listed VET qualifications and accredited courses are available at many providers.
In the VET sector, training packages play a key role in informing the design of curricula and training programs. They are a key
resource for RTOs as they specify the skills and knowledge required for job roles and tasks within an industry, as well as the framework for measuring a worker’s competence. Each training package has three components (Australian Skills Quality Authority, 2021):
• Units of competency define the skills and knowledge needed, and how to apply them in a workplace context;
• A qualifications framework that contains groups of units of competency used to develop learning outcomes – these groupings range from Certificate I to Graduate Diploma level; and
E3 Opportunity Assessment: Developing the future energy workforce60
• Assessment guidelines that cover the qualifications required by assessors, the design of assessment processes and guidelines for assessment management. The guidelines explain the industry’s preferred approach to assessment.
More than 85 per cent of VET program enrolments are in training package qualifications.12 Multiple training packages have been identified as potentially relevant for the skills required for a clean energy transition, including:
• Construction, plumbing and services;
• Electricity supply;
• Electrotechnology;
• Information and communication technology;
• Manufacturing and engineering;
• Metal and engineering;
• Resources and infrastructure;
• Sustainability; and
• Transmission and distribution.
Of these, electrotechnology, metal and engineering, and transmission and distribution contain the most qualifications that map to traditional roles in the energy sector.
Industry Reference Committees (IRCs) were established, as recommended in Allen Consulting Group (2012), to act as a formal channel for considering industry skills requirements in the development and review of training packages. The Australian Industry and Skills Committee (AISC) appoints IRCs to develop and review training packages, qualifications, units and skill sets through consultation with subject matter experts and stakeholders. Each IRC is made up of people with close links to industry and they gather information on challenges and industry needs to advise on training packages. The IRC structure is intended to ensure training packages are relevant for industry and updated when appropriate.
Universities can self-accredit courses, and while they do not typically have formal structures to inform the development of new courses, they do actively engage with industry to guide program development as this is often a requirement for approval. Commenting on the development of new programs at universities, a professor in renewable energy at a Spanish university remarked: “there’s always a moment of vacuum whenever a new technology comes in, but we’re able to put together new programs in just a few months” (Lombrana et al., 2021). Further analysis is required to assess whether the development and approval process for new courses in universities in Australia reflects this experience, but given the similarities between tertiary institutions across the globe, this implies that Australian universities, like Spanish ones, can be responsive to industry needs.
The VET and university sector in Australia offer a great number of programs that should address the knowledge and skills needs of the clean energy sector. There are also, in principle,
12 https://www.ncver.edu.au/
processes to ensure courses can be adjusted or new courses developed to meet industry needs. However, this opportunity assessment was limited to undertaking an initial stocktake of the current training programs offered at the tertiary and vocational levels in Australia, and a deeper investigation could provide more granular insights.
5.2.2 Accredited and CPD training offered by industry organisationsVarious industry organisations and peak bodies offer training programs that meet industry-specific accreditation requirements; however, it is important to note these are not equivalent to formal qualifications offered by universities and the VET sector. Rather, their value lies in the market’s acceptance of their credibility. Three prominent industry training providers in Australia are:
• The Clean Energy Council (CEC);
• The Energy Efficiency Council (EEC); and
• The Green Building Council of Australia (GBCA).
The CEC accreditations, which include certifications for the design and installation of solar, small-scale wind, micro-hydro and battery storage, are required by legislation for installers to qualify for government rebates on solar. It is currently unclear what will happen to demand for this training once the state subsidy scheme ends and the regulatory push for this training falls away.
The EEC offers the internationally recognised Certified Energy Manager (CEM) and Certified Measurement and Verification Professional (CMVP) certifications, as well as the locally developed Energy Efficiency Certification Scheme (EECS) for integrated building energy retrofits (IBERs). These programs help educate and qualify individuals involved in optimising the use of energy in buildings and industrial systems, or in retrofitting buildings in the case of EECS.
The GBCA offers training to become a Green Star Associate or Green Star Certified Professional. These certifications aim to equip professionals with the knowledge and expertise to become confident leaders in guiding projects through Green Star certification, which enables the design and construction of energy-efficient buildings with low or no carbon footprints.
All these organisations offer CPD training opportunities to maintain the relevant industry certifications. Various other professional governing bodies, including Engineers Australia, also offer CPD programs and require their members to complete a certain amount of professional training every year. On a state level, there are some requirements for licenced tradespeople to meet annual CPD requirements, and the relevant licencing authorities are typically involved in approving CPD training. As demonstrated by the CEC’s and EEC’s accreditation, integration of industry training with government programs is one way to encourage more rapid uptake, and the CPD of existing energy professionals.
E3 Opportunity Assessment: Developing the future energy workforce 61

5.2.3 Skills shortages persist despite technical skills training programs
5.2.3.1 Insufficient student pipeline
Despite the supply of post-secondary education related to clean energy, and industry engagement in the development of these programs, skills shortages exist and the situation is expected to worsen. This raises questions about whether the sector is teaching the appropriate skills and knowledge, and whether the vocational and tertiary education sectors are training enough people to meet market needs.
Attracting enough people to be trained is a major workforce challenge in Australia and other countries. Specifically, attracting enough people into engineering studies is an issue for the energy sector. A report by Engineering UK (2018) concluded that there will be a shortfall of between 37,000 to 59,000 people needed to meet the annual demand for core engineering roles, based on current numbers of engineers coming through apprenticeships and higher education. Within this, the expected graduate-level shortfall is at least 22,000 per year.
In Australia, the number of people working as electrical engineers (ANZSCO 2333) fell from 19,300 in 2014 to 16,600 in 2019 (ABS, 2019). And 2018 enrolments for domestic students in engineering were down to 2010 levels, with graduation numbers at an all-time high, but still less than 12,000 per year. Of these, electrical and electronic engineering had only 703 completions in 2018, comprising 644 men and 59 women (Engineering Australia, 2020). From 2006 to 2011, the employment of migrant engineers in Australia grew by nine per cent per year to meet demand for jobs in the engineering sector. The period 2011 to 2016 saw a slowdown in the growth of engineering jobs, but “Australian sources were still insufficient to meet demand” (Engineering Australia, 2019, p.79). The entry of a large number of graduates was offset by retirements from the sector as well as qualified engineers taking up positions outside the engineering sector. Skilled migration was therefore still needed to meet demand, and this segment grew at double the market rate.
VET program completions for ‘Certificate III in Electrotechnology Electrician’, the basic requirement for a licenced electrician, declined from 6,735 in 2015 to 5,400 in 2019. Across four other diplomas or advanced diplomas related to electrical engineering,13 completions declined from 425 in 2015 to 255 in 2019. Even general accreditations such as the Certificate IV in Engineering saw a drop from 1,515 in 2015 to 655 in 2019. One related qualification that has seen an increase is the ‘Diploma of ESI – Power Systems’, which saw completions increase from 415 in 2015 to 590 in 2019.14 For context, just over 140,000 workers classified as ‘electricians’ (ANZSCO 3411), a number that dropped from 152,500 in 2015 (ABS, 2019). The pipeline for new
13 Diploma of Electrical Engineering; Advanced Diploma of Engineering Technology – Renewable Energy; Advanced Diploma of Engineering Technology – Electrical; and Advanced Diploma of Electrical – Engineering
14 https://www.ncver.edu.au/
electricians qualified to enter the market is therefore less than five per cent of the current electrician labour force.
The experience of the UK and Australia is echoed in the US, where there is also an acknowledgement of a lack of young talent entering the clean jobs economy (Muro et al., 2019), and in Europe where the CEO of clean-energy firm EDP Renovaveis SA remarked in June 2021 that “the renewable sector, given the massive amount of growth that is expected, doesn’t have enough people” (Lombrana et al., 2021).
It is therefore clear that, despite numerous courses on offer, the vocational and tertiary education sectors are not able to attract and graduate enough students to meet the growing industry demand. The other pertinent question then is: Are the programs that are being offered developing knowledge and skills that industry wants and needs?
5.2.3.2 Challenges in education programs
Holtorf et al. (2018) highlight the challenges of evaluating the success of renewable energy education programs. Traditionally, evaluations of academic success are defined with respect to the student’s performance, achievement and development during their university studies. Ideally, different stakeholder views, including those of lecturers and employers, should also be considered to determine the success of renewable energy higher education programs. However, few formal processes or standardised frameworks exist to enable such multi-stakeholder evaluation.
One indicator of the appropriateness of current educational programs is the employment outcomes of graduates. Outcomes for students studying engineering and related technologies in Australia are strong, with 83.5 per cent in full-time employment four months after graduation, compared with 72.9 per cent of all graduates (Department of Employment, Skills, Small and Family Business, 2019). VET graduates in architecture, building, engineering, and related technologies also have above average employment indicators following completion of their studies (National Skills Commission, 2020). More specifically, 87.5 per cent of students completing a qualification in the Electrotechnology training package indicated that they achieved their main reason for doing the training, higher than the overall student satisfaction rate of 83.9 per cent (NCVER 2020). Further, 90.3 per cent of those graduates were employed after training (93.8 per cent employed or in further training), compared with an average for all VET qualifications of 76.2 per cent (86.5 per cent employed or in further training) (NCVER, 2020).
There is evidence that existing training programs do not fully meet skill or workforce needs, particularly when it comes to social or cross-cutting skills. The rapid review for this project found that tertiary training requirements emphasised “practically-
E3 Opportunity Assessment: Developing the future energy workforce62
oriented, industry-focused training that combines technical skills with competencies required to foster both cross-sector alignment of vision and the long-term cooperation that needs to flow from this.” This appears to be a major challenge for the education sector. In an earlier study, Allen Consulting Group (2012) found that there is a gap in the “provision of education that is specifically directed at encouraging cross-disciplinary approaches.” This is a challenge as formal education and training is often discipline specific, but there is a growing need for qualified individuals to work in a cross-disciplinary manner. The dilemma of over-specialisation was also raised by several stakeholders in the engagement process, with one calling for “better skilled generalists and tradespeople (i.e. from TAFE) who have medium practical skills and can be further trained.” Pears (2020) highlighted limited preparation time for academics and an “overcrowded curriculum” as additional barriers to updating curricula with new content, particularly on energy efficiency.
There are also challenges particular to the VET sector. While the IRC structures are meant to ensure programs are updated to meet industry needs, there is often a significant lag between the identification of industry needs and updates to training packages. It typically takes time for information to flow from individual employers (who identify the need for certain skills) to industry representatives, and then through the formal approval process and quality control before updates are rolled out to RTOs. In the VET sector, training is heavily based on compliance, and fairly small changes in content can often involve significant changes in programs. Although RTOs put a lot of effort into complying with training packages, funding is not provided to develop additional units and approaches, or different procedures.
Stakeholder consultations also highlighted that many jobs, particularly in large-scale renewable energy installation, are in regional areas, but training packages are often unavailable in these areas. A contributing factor to this is the general shortage of technical trainers in the VET sector as the
appropriately skilled and experienced workers seek out more financially lucrative work “on the tools.”
Summarising the findings of this initial stocktake on education and training programs to enable a successful energy transition, it is clear that many programs are available across VET providers and universities, with additional coverage provided by industry bodies. While there are some delays in updating content, there are generally ongoing efforts to make the necessary changes to course content. A major challenge is that not enough people are taking up studies in the relevant technical fields. Those who do complete their studies in this field are generally satisfied with their training and find employment. There are, however, some weaknesses in the training programs, particularly in incorporating cross-cutting or social skills alongside technical training.
FINDING 2.1
Detailed stocktake and mapping of existing post-secondary education and training is required to understand the exact aims, outcomes and content of such courses, as well as to identify and then rectify the gaps
The content of current educational programs should be reviewed in terms of the technical skills they focus on and the social or cross-cutting skills they teach. This understanding will highlight gaps in current offerings and inform future design.
It is also important to develop a clearer picture of enrolment and graduation trends from these courses to understand the future supply of skilled workers.
E3 Opportunity Assessment: Developing the future energy workforce 63

5.3 Pathways for closing the skills gap5.3.1 Considering skills development over different time horizons, aligned to net zero emissions, and for each sub-sectorWhen considering the education and training pathways needed to develop the skilled workforce required in 2030, it is useful to understand what the energy sector could look like. For the purposes of this report, we highlight the Decarbonisation Futures work by ClimateWorks Australia and CSIRO (ClimateWorks Australia, 2020) as a useful guide. This study distinguishes between demonstrated and mature technologies, and emerging solutions across five key sectors: electricity, buildings, transport, industry (covering manufacturing, mining, and resources), and agriculture and land. It then models a least-cost pathway to achieve the greatest emissions reductions (see Figure 10).
By 2030, the greatest emissions reduction is possible in the electricity sector, followed by the buildings sector. For the electricity sector, that would mean reaching the following targets between 2020 and 2030:
• 24–29GW of additional renewable capacity added; and
• 44–64GWh of additional storage capacity added.
Achieving this will require the installation of diverse renewable energy sources, the extension of transmission networks and microgrids, the expansion of battery and pumped hydro storage as well as sophisticated behind-the-meter energy management planning and integration capabilities.
For example, for buildings, some of the 2030 targets, relative to 2020, are:
• 85–116 per cent increase in rooftop solar generation;
• 44–49 per cent decrease in residential energy intensity;
• 16–28 per cent decrease in commercial building energy intensity; and
• 75–78 per cent share of electricity in residential buildings, compared with 49 per cent in 2020.
Figure 10. Ranking of sectors by emission reduction potential to 2030
From ClimateWorks Australia, 2020
SECTOR RANK(potential emission reductions 2020-30)
DEMONSTRATED ANDMATURE SOLUTIONS EMERGING SOLUTIONS
ELECTRICITY1 100% renewables, storage (includingbatteries), demand management
Biofuels, synfuels, electrification, ammonia or hydrogen for other transportTRANSPORT3 Electric and fuel-cell vehicles
for light road transport
Lab food, enteric fermentation treatments(such as livestock vaccines)
AGRICULTUREAND LAND5 Sustainable agriculture practices,
plant-basedsubstitutes, fertiliser management, carbon forestry
Material substitution, high grade heatelectrifications, solar thermal, hydrogenINDUSTRY4 Energy efficiency, circular economy,
proven electrification, bioenergy andbio-feedstocks, industrial CCS
BUILDINGS2 Deep energy efficiency, electrification
There are sufficient demonstratedand mature solutions to decarbonisethese sectors. However, emergingsolutions could decrease costsand aid deployment at scale.
ACCELERATE DEPLOYMENT ACCELERATE DEPLOYMENTINVEST IN R&D
E3 Opportunity Assessment: Developing the future energy workforce64

A key insight that can be drawn from this analysis is an indication of the types of technical skills required to implement the relevant actions and technological solutions over different periods. The analysis also helps us to prioritise between different technological solutions, as the skills to enable ‘emerging solutions’ will not be of equal importance in the next decade. For example, recent focus has been placed on growing the hydrogen sector, but green hydrogen falls in the ‘emerging solutions’ category as significant advancements are still required before it becomes cost effective. On this basis, this could be an area in which to focus on identifying the required skills and ensuring relevant training and education programs are in place when these solutions are mature enough for large-scale deployment.
In addition to identifying what technical skills are needed to implement different technologies, a sizing of the different occupations to meet the net zero by 2050 ambition implied in the ClimateWorks Australia analysis or AEMO’s Integrated System Plan (ISP) and Whole of System Plan (WSP) for the electricity sector is needed.
The Australian Skills Classification (the Classification) sets out the key core competencies, specialist tasks and technology tools required for 600 occupations, based on the Australian and New Zealand Standard Classification of Occupations (ANZSCO) (National Skills Commission, 2020). The Classification also provides a more detailed framework to identify critical skills and potential labour market skills gaps. Combined with other information, this resource can help stakeholders – including training sectors, industry, and governments – to research and develop new training options.
There is, however, a discrepancy between official occupation profiles (i.e. ANZSCO) and the roles required by industry. Current classifications are too generic for the required energy transition and only list occupations generally with terms such as electrician, electrical engineer, or electrical technician. With this approach, it would be difficult to detect a shortage of qualified solar installers through the general classification of ‘electrician’ as there is no industry code for solar.
The National Skills Commissions highlights 25 “emerging occupations” that include some relevant to the clean energy sector, however these are not yet formally tracked, nor reported on, and do not feed into decisions on skills shortages for the purposes of immigration.
FINDING 2.2
Detailed future occupation and skills mapping is needed, and should be aligned with pathways to net zero by 2050
A better understanding of the actions needed to deliver net zero by energy sub-sector and energy intensive sectors – buildings, transport, industry (covering manufacturing, mining, and resources) and agriculture – is required to identify future skills needs. Framing this analysis on existing net zero by 2050 pathways, e.g. Decarbonisation Futures by ClimateWorks Australia and AEMO’s Integrated System Plan and the Western Australia Whole of System Plan will guide the prioritisation of education and training programs to 2030 to meet the changing workforce needs over time. These actions can then be used to inform analysis of the skilled tradespeople and professionals required to deliver the transition.
Following this, the existing ANZSCO codes, which align with these skilled tradespeople and professionals can be identified, and any gaps and poor alignments can be highlighted to support a future reclassification of ANZSCO codes.
5.3.2 Short-term focus on upskilling the existing energy workforceAnother implication of considering different time horizons, as implied by a technology roadmap, is that it indicates what training approaches are most suited for different needs. University and VET programs can deliver skilled and qualified workers over the medium to long term (>5 years), but they are not necessarily best placed to alleviate existing or short-term shortages of skilled workers. Industry training programs, short courses or other skills development pathways should be considered, with a focus on upskilling the existing workforce to address skill gaps more rapidly.
CPD aligns with the concept of ‘life-long learning’, which emerged out of recognition that professionals and skilled tradespeople need to update their knowledge and skills to keep pace with advances in thinking, technology and practice (Breakey & Sampford, 2017). EnergySafe Victoria (2021) describes the aims of CPD as being to address ‘currency’, ‘competency fade’ and ‘complacency’. In the context of a rapidly changing energy system, ensuring ‘currency’ of knowledge about new technologies and systems can play an important role in reducing skills shortages.
E3 Opportunity Assessment: Developing the future energy workforce 65
To support this, models such as micro-credentials and short courses need to move to the centre of the training system rather than being a supplement to traditional vocational and tertiary training (Macklin, 2020).
Detailed mapping of technical and other skills and training opportunities are needed for the energy workforce to inform professional development pathways for already vocationally and tertiary trained professionals and skilled tradespeople.
FINDING 2.3
Existing energy professionals and skilled tradespeople need professional development pathways for delivering net zero by 2050 in target industries
Training programs exist, but existing – and future – energy professionals need professional development pathways with CPD opportunities mapped for working across the electricity, buildings, transport, industry (manufacturing and mining and resources) and agricultural sectors.
Professional development pathways should build upon and complement the training received at the vocational and tertiary levels. This work can build off the analysis undertaken to identify the skilled trades and professionals required – see Finding 2.2 – and for each sub-sector, it can map out the various pathways for energy service professionals and skilled trades.
5.3.3 Improving coordination and collaboration between training providers and industryThe need for greater coordination and collaboration between various training providers and industry came out prominently in this research, reflecting a key recommendation from the Macklin (2020) review on the skills to support Victoria’s growing economy.
The Macklin Review (2020) contains many suggestions on collaboration, but a core principle is that competition between education providers should be reduced. Commenting on the VET sector specifically, it states: “[the] competitive market model too often pits training providers against each other to deliver courses that generate short-term profits without the long-term benefit for learners or the economy” (p. 8). Each of the offerings from the post-secondary education sector, the VET sector, universities and industry training providers, has unique strengths and characteristics, which suggests the system can be reformed to ensure they are complementary.
Facilitating greater collaboration between the training sector and industry as a public-private partnership has great value (IRENA 2020). Increasing engagement with industry is crucial for meeting sectoral labour requirements, promoting national skill standards, providing on-the-job training, and improving the overall quality of training. Engagement with stakeholders revealed that the private sector could contribute to skill delivery in three important ways:
1. Course delivery – industry could help develop a secondment model or partnership model to help deliver training and address shortages of technical trainers;
2. Transfers of knowledge – industry players are usually first in acquiring new equipment or tools and the skills to use them. Making them available to training providers early can reduce the time it takes for more people to acquire the requisite skills. As a practical example, instead of the VET sector having to purpose-build a wind turbine for training purposes in one location (ABC, 2021), operational or pre-operational turbines could be used for training; and
3. Offering more work-based learning and apprenticeship opportunities – ultimately, the VET sector can only train people if industries offer apprenticeships.
A key recommendation from the Macklin Review (2020, p.7) was the establishment of FutureSkills Labs which would:
“ Bring together leading education and training providers, industry, unions and communities to co-design new approaches to skills development, informed by leading industry practices and technologies, and aligned with industry policy.”
The proposed FutureSkills Labs would comprise a coalition of leading TAFEs along with other education and training providers, industry, unions, and community organisations. They would engage with a range of frontier employers, including start-ups and small and medium-sized enterprises with high growth potential to align innovation in skills development with industry growth and renewal.
Applying this thinking, a proposed action would be for RACE for 2030 to establish a dedicated workforce development lab, where all the relevant stakeholders could collaborate to address workforce challenges. At a minimum, this forum could share insights and avoid duplication, which is a concern given the many industry bodies and government departments which acknowledged during this research that they were working on similar research and plans without being aware of each other’s work. The lab would also ensure that the VET sector is better incorporated into ongoing research programs, an area that TAFEs have typically had limited engagement with. Ideally, the workforce development lab would become a real research-practice nexus to address workforce challenges.
E3 Opportunity Assessment: Developing the future energy workforce66

FINDING 2.4
Improved coordination between different educational providers and industry is essential to fill the talent pipeline
An energy workforce development lab, facilitated by RACE, would enable different education providers and industry to coordinate activities and collaborate, leading to better outcomes for all.
An initial task would be a review to identify the appropriate mechanisms to support coordination and collaboration, and to identify the key stakeholders who should be involved. This review would aim to identify other initiatives underway to avoid duplication, and to ensure that the forum focused its efforts on initiatives that have the best chance of being implemented.
5.3.4 Making the industry more attractive and easier to join
5.3.4.1 Becoming an employer of choice
Findings from this research have shown that not enough people are taking up training or joining the energy industry. Numerous studies (CEC, 2020; Energy Skills Queensland, 2016; WSAA, 2017) have referred to the importance of making an industry an attractive career prospect if skills shortages are to be addressed.
A barrier for people joining the industry is uncertainty in policy and in the corresponding market conditions. The boom-bust nature of current renewable developments makes it a less attractive field to enter and may make retraining workers challenging. The regulatory uncertainty in Australia has historically contributed to these fluctuations, and now the renewable energy sector is contending with problems of grid connection, transmission infrastructure and a lack of continued federal government policy support (IRENA, 2020). The project-based nature of many construction and installation jobs has also led to limited job security. Projections of workforce numbers for renewable industries indicate this will continue, highlighting the need to incorporate active workforce planning into energy sector planning (Briggs et al., 2020).
Another barrier to joining the industry is salary competition with other industries. Electricians, for example, are the most employed among all “technicians and trades workers” with demand for their services in construction, mining, electricity, gas, water and waste services industries (National Skills Commission, 2020). Also, competition for digital and data analytics skills are particularly intense, with the energy sector
often losing out to other sectors that typically offer more lucrative career opportunities (Hong et al., 2018).
There is a need for better defined career pipeline opportunities to effectively introduce and market the clean energy economy to all prospective workers. An interesting proposal (Muro et al., 2019) is to offer more energy-related ‘minors’ and supplemental programs for business and humanities students to allow more people to become engaged in clean energy careers. Further, skilled tradespeople and professionals from adjacent sectors could be attracted to the sector by offering them opportunities to reskill or upskill through a short-course or micro-credential, rather than a full qualification. Fast-track certificate programs can also allow students from other disciplines to quickly learn the basics of energy science, technology and adoption. The National Skills Commission’s website contains a searchable database that shows relationships between certain skills and occupations which could be used to identify specific occupations in other industries to target with such upskilling opportunities.
FINDING 2.5
The energy industry can be made more attractive for graduates and entrants from other sectors
An energy workforce development lab, facilitated by RACE for 2030, would provide a forum to identify key measures which could help make the industry more attractive.
An initial task would see a review undertaken to identify the appropriate mechanisms to make the industry more attractive, and to identify the key stakeholders to be involved. This would aim to identify other initiatives underway to avoid duplication and ensure that outcomes from the forum will have the greatest chance of being successfully implemented.
5.3.4.2 Attracting greater diversity of skilled people
A key to addressing skills shortages in the sector and unlocking additional gains is to make the industry more accessible and appealing for diverse groups. In Australia, the ‘construction’ and ‘electricity, gas, water and waste services’ sectors are two of the most male-dominated, with men aged between 20 and 74 making up 87.3 per cent and 76.2 per cent of these workforces respectively (ABS, 2020). Similarly, in the US, women make up only 13 per cent of the clean energy production workforce, and 18 per cent of the energy efficiency workforce, compared with 46 per cent of the total workforce (Muro et al., 2019). A survey respondent summarised the challenge:
E3 Opportunity Assessment: Developing the future energy workforce 67

“ Gender equity is a big one. For example, in many large economies around 90 per cent of building and construction sector employees are male. With large-scale renovation wave programs planned to move towards net zero buildings, this could reinforce big gender disparities.”
IRENA (2019) highlights that strategies to increase the representation of women in the sector often focus on workplace accommodations, mentorship and professional development. The problem is that these approaches only reach women who have already made the decision to join the industry. To increase the number of women undertaking post-secondary education that could lead to jobs in the energy sector, the pathway needs to be made attractive to women whilst they are still in secondary education. This would also involve growing interest in science, technology, and engineering fields more broadly.
Beyond this, looking into gender equality in the Australian construction industry, Baker et al. (2021) concluded that leaders need to focus on the cultures of their organisations to promote behaviours that would address challenges with complacency and systemic inequity. Trying to address the gender gap through compliance alone is inadequate; organisations need to develop a strategic approach that addresses diversity issues at all levels. This will facilitate meaningful changes to the clean energy sector that make it more accessible. This will also have the overall benefit of making the sector more attractive and prosperous for everyone involved.
FINDING 2.6
Women are greatly under-represented in the energy industry, but opportunity abounds
Attracting more women into the energy sector could potentially go a long way to alleviate workforce shortages. This will require explicit strategies, as many of the barriers are structural. It is also important to track diversity in the sector over time.
An energy workforce development forum, supported by RACE for 2030, would provide a setting in which to identify key measures to promote diversity in the sector’s workforce.
An initial task would be a review undertaken to identify the appropriate mechanisms to promote diversity (including diversity metrics), and the key stakeholders to be involved. This would aim to identify other initiatives underway to avoid duplication and ensure that outcomes from the forum will have the greatest chance of being implemented.
5.3.4.3 Offer reskilling opportunities for fossil fuel workers
The importance of establishing transition pathways for current fossil fuel workers was highlighted through the stakeholder engagement process. Research into the UK oil and gas workforce found that more than 90 per cent of the workforce have medium-to-high skills transferability and are well positioned to work in adjacent energy sectors, whilst acknowledging that some transition training and upskilling will be required (Robert Gordon University, 2021). According to IRENA (2018) an analysis of the occupational requirements of renewable energy technologies revealed that the managerial and technical skills and competencies of the oil and gas workforce are similarly valued in the renewable energy sector.
Developing transition pathways for fossil fuel workers would therefore not only support a ‘just transition’ but can play a role in addressing skills shortages. It is necessary that skill and competency mapping be undertaken for fossil fuel workers to enable the development of these transition strategies.
FINDING 2.7
Mapping of occupations and skills needs for fossil fuel workers is necessary
Detailed mapping of the occupational breakdown within fossil fuel industries, including identification of roles which cannot easily transition because of a lack of comparable opportunities, is essential to enable a just transition for workers. This should include the identification of commonalities that could enable fossil fuel workers to transition to other parts of the energy sector and/ or industries enabled by the energy transition – e.g. green steel production and green ammonia production. Identification and consideration of the geographic location of jobs impacted in the workforce transition is also required for a just transition.
5.3.5 Developing cross-cutting skillsThe need for social/ cross-cutting skills to enable an energy transition is clear. The rapid review undertaken for this project found an emphasis on soft skills across the literature, illustrating that business transition, interpersonal and negotiation skills are critical to delivering net zero by 2050. This is exemplified in the primary study of Zakharova et al. (2020) that found: “problems associated with people and processes can impede the success of BIM [building information modelling] even more than the technology itself.”
E3 Opportunity Assessment: Developing the future energy workforce68

What is less clear is how these skills should be developed, especially since the people who most need these skills are often outside traditional energy roles and functions.
A promising area of investigation to address social or cross-cutting skills is Education for Sustainable Development (ESD). Brundiers et al. (2021) highlights certain competencies that are common in ESD and could be relevant. These are:
• Systems thinking;
• Futures thinking;
• Values thinking;
• Strategic thinking;
• Integrated problem solving;
• Implementation; and
• Intra-personal skills.
There is a rich and growing literature on integrating ESD into post-tertiary education (SDSN, 2020; UNESCO, 2017). It acknowledges the range of knowledge, skills and mindsets required, as well as the wide range of potential learners, and avenues through which they can learn. While training providers should aim to mainstream ESD, there is no one strategy to do this and providers will need to look at a combination of approaches. More research is required into how ESD principles are currently incorporated into, and could be deepened within, courses for the energy workforce and supporting industries.
Some valuable lessons can be drawn from the experience of the water sector and its success in bringing about a
transition in the way it operates. The conscious adoption of a social-technical transitions approach, in which the role of governance and community was prominently considered, was key to this success. The CRC for Water Sensitive Cities played an important role in highlighting the value of social or cross-cutting skills. They developed frameworks for social skills, starting with governance, and through engagement with diverse stakeholders demonstrated the value of these skills (Brown, Farrelly & Loorbach, 2013). They also created tools such as the ‘Water Sensitive Cities Index’, which is a practical tool designed to support the transition to a more sustainable water future. The use of these tools has created a demand for social skills.
Organisations, established especially to build capacity for new practice, played a valuable role in building cross-sectoral and cross-disciplinary skills. Within the water sector, such organisations were established in each of the major Australian cities. For example, Clearwater was developed in Victoria. Initially created by Melbourne Water and DELWP to build skills for new approaches to stormwater management, their training became increasingly focused on the socio-technical skills needed for integrated water management. Over time, local government officials became as engaged in their training as engineering professionals. Clearwater was what is called ‘a bridging organisation’ – it provided capacity building through education and training to local government and industry professionals (end-users) regarding sustainable urban water management, and it fostered partnerships across organisations and disciplines (Brown, Farrelly & Loorbach, 2013).
E3 Opportunity Assessment: Developing the future energy workforce 69
5.3.5.1 Developing cross-cutting skills alongside technical skills
Within the energy industry itself, in 2018 and 2019 the EEC undertook research on behalf of the NSW Government to determine how best to support businesses with lowering their energy use and emissions. Supporting businesses with implementing energy management systems (EnMS) was deemed an appropriate pathway forward, as energy accounts for 70 per cent of Australia’s emissions. EnMS are frameworks which enable organisations to establish processes to achieve control and improvement of energy performance. They use a systematic approach to energy management that includes energy strategy development, executive leadership, staff engagement, detailed energy management planning, implementation of plans, and ongoing monitoring and continuous improvement. These skills are both technical and social/ cross-cutting in nature, and a gap in both the technical and social/ cross-cutting skills within the industry was identified by the NSW Government and the EEC.
To facilitate development or refinement of these competencies within the energy services industry, and to ensure that there are enough quality advisors available to support businesses with establishing EnMS – thereby supporting the transition to net zero – the EEC developed a professional development course for external energy advisors. Feedback on the EnMS advisor training program has demonstrated that the course plays a useful role in developing
both technical and social/ cross-cutting skills. Consequently, industry and government are now actively exploring a professional certification pathway for EnMS advisors. The creation of such opportunities should be explored in more detail as part of the proposed professional development pathways highlighted in Finding 2.3, and offers another way in which competencies in cross-cutting skills can be improved.
To develop these skills, RACE for 2030 could work with providers to develop and deliver short courses focused on social or cross-cutting skills that explicitly target an interdisciplinary audience.
FINDING 2.8
Pathways for developing cross-cutting skills for both traditional and non-traditional energy professionals are needed
Bridging organisations, such as RACE for 2030, can play an important role in highlighting the need for social or cross-cutting skills. Dedicated short courses and training programs to develop these skills can then be commissioned.
E3 Opportunity Assessment: Developing the future energy workforce70

5.3.6 Improving energy data literacy15
With the transition toward a smarter digital energy sector, the need for energy data literacy skills, in particular, is increasing. Energy is essential for all our basic needs, yet it is mostly invisible and fully understanding the energy system – and consumers’ roles within it – is not simple. Most consumers are limited in their energy literacy and only focus on events when there is a shortage of supply, or if prices increase to unaffordable levels. There is also confusion over the different units of measurement (e.g. kW, kWh, joules, litres) as well as the complexities of the energy market, the different tariffs, suppliers and options. This can be termed ‘energy literacy’ – or illiteracy – and research in this area is increasing (Office of Energy Efficiency and Renewable Energy, 2021; Reis et al., 2021; Wolff et al., 2021).
From the consumer side, there is a large amount of academic work on how energy feedback can increase awareness of energy, where it is used, and how much it costs (Darby, 2006; Darby, 2010; Hargreaves et al., 2013; Bonino et al., 2012; Lee et al., 2008). This has proved to not only increase awareness but also to change energy behaviour, for example shifting demand to cheaper times of the day. But providing detailed energy feedback to all residents and businesses is not mandatory worldwide, and the feedback that does exist is not always clear or understandable. Many residents, for example, would like a quick and clear guide to their energy use to allow them to interpret the data relevant to their home and appliances. Understanding the data and being able to make the right decisions for our homes and businesses is essential if we are to encourage investment into behind-the-meter solar generation and demand response enabled devices (DRED), and electric vehicle ownership. Exploration of new emerging technologies in the sector has also been shown to be useful to engage residential consumers in their energy use (Dahlgren et al., 2020). Where residents share buildings or employees share office space there is less affiliation with their power use as they may not see the energy bills. Engagement at the tenancy level is particularly challenging but energy feedback has been shown to be effective (Lee et al., 2008; Zhang et al., 2020; Spence. et al., 2018).
15 Credit for this section: Dr Sarah Goodwin, Monash University
With the transition to a smarter grid, there is a growing amount of digital data across the energy sector. At the supplier, distribution, and transmission network levels, this is beneficial for improved decision-making and enhanced situational awareness (Giri et al., 2012; Liu et al., 2016). Human-in-the-loop analytical understanding of the data and algorithms is essential for helping to inform data-driven decision-making and is particularly beneficial where data is forecast or predicted through algorithms and models (Zeitz Self et al., 2016; Endert et al., 2014). Energy network control centre operators must also deal with a growing amount of data that can cause increased stress and overheads during critical events. Recent work by Goodwin et al. (pending publication, 2021) explores the ‘cognitive load’ or the limitations on mental capacity within the Australian Energy Market Operator, making recommendations for control room improvements. At the supplier level, previous work in more effectively visualising smart consumer data was important to help demonstrate to the business that there was a gap in their workforce (Goodwin et al., 2013).
In general, across the energy sector, investment in a newly trained workforce with skills in energy data science, AI, optimisation, information communication and data visualisation at all levels could help to ensure the sector transitions to the digital era with ease, and with support from consumers.
FINDING 2.9
More research is required to understand the digital skill uplift needed in the energy sector
Digital literacy is a key cross cutting skill in energy. This study recommends that a deep dive be undertaken into the digital skills required of professionals and qualified tradespeople involved in the energy sector, as well as other professionals who work in enabling and supporting sectors.
E3 Opportunity Assessment: Developing the future energy workforce 71

6 Work Package 3:Energy innovation pathways – results and discussion
E3 Opportunity Assessment: Developing the future energy workforce72

6.1 Mapping opportunities across Australia’s energy innovation systemAustralia has strong opportunities for clean energy innovation and entrepreneurship. It has significant renewable resources, the highest per capita rate of residential rooftop solar installations and a deregulated electricity market. These market conditions provide opportunities for distributed energy, energy management in industrial settings, energy efficiency and demand management. However recent analysis by ClimateWorks (2020) suggests that we will need to double our current emission reduction trajectories to achieve Australia’s Paris Agreement target, as emissions reduction progress has stalled in most sectors and reversed overall. This demonstrates of the scale and immediacy of the energy innovation challenge in Australia.
Clean energy innovation pathways, especially those involving new technology, can have long commercialisation time horizons. They require sustained and relatively large capital inputs, and they need to meet higher standards of performance (including regulated standards) compared to other opportunities for new technologies and business models. All these characteristics make energy innovation
pathways long and complex, and this means that a well-functioning innovation system is critical.
Innovation systems literature broadly highlights seven critical functions of an innovation system which are outlined in Table 13 below. These seven functions are:
1. Knowledge development;
2. Knowledge diffusion;
3. Guidance of search;
4. Entrepreneurial activities;
5. Market formation;
6. Resource mobilisation; and
7. Creation of legitimacy.
We have structured the mapping of the energy innovation system in Australia using these seven functional areas based on the literature review, relevant energy and industry studies, and stakeholder consultation.
Table 13. Functions of innovation systems
FUNCTION DESCRIPTION
Knowledge development How knowledge is developed in the innovation system.
Knowledge diffusion Transfer of knowledge between actors across the system.
Guidance of search Activities, incentives, and mechanisms influence direction of search that impacts new entrants into the innovation system and the exploration of specific activities.
Entrepreneurial activities Innovative activities and business strategies required for testing new technologies and business models.
Market formation Activities contributing to the emergence of new markets, including all stages of the adoption curve
Resource mobilisation Activities relating to the allocation of resources as inputs into innovation processes which may include financial capital, human capital and complementary assets, and technologies.
Creation of legitimacy Process of securing social acceptance of technologies, business models and the actors, including counter-acting resistance and improving acceptance.
Sources: Miremadi et al. (2018); Hekkert et al. (2007); Bergek et al. (2008)
E3 Opportunity Assessment: Developing the future energy workforce 73

6.1.1 Knowledge development There are several ways to consider how new knowledge is developed in an innovation system, and indeed the types of knowledge involved. Types of knowledge include technological, organisational, financial and business, behavioural and social, among others. R&D expenditure and patent counts are widely used as a form of output to measure levels of technological innovation. It is well acknowledged that these are imperfect measures, but they are often used due to the lack of alternative data sources. Developing more relevant, timely and rich innovation metrics is an ongoing focus, as identified recently by the Australian Department of Industry, Innovation and Science (DIIS, 2019) and more than a decade ago in the Productivity Commission’s Inquiry into public support for science and innovation (2007).
According to these two measures, Australia has varied performance. Figure 11 shows the energy-related R&D expenditure16 as a proportion of GDP for Australia and several comparable OECD countries. Australia has always had less expenditure on overall and energy-related R&D; this expenditure increased throughout the first decade of the 2000s before declining from 2013 and stabilising at a lower rate. Of the five countries shown in Figure 11 below, Australia is the only one where energy-related public R&D declined as a percentage of GDP over this period.
16 Energy-related R&D includes all forms of energy research and development activities including for fossil fuel related energy. OECD statistics average this to be ~30.2% of total public energy-related R7D over the same period (OECD, 2019).
Australia performs well when it comes to patents. It is ranked 7th in the G20 and 8th globally for its share of successful green patents filed between 2000 and 2016. Twenty-one per cent of these patents were in energy, followed by 20% in processes (including adoption of energy efficiency in manufacturing), 11% in transport (including electric vehicles, smart cars and hybrids), 6% in waste and 5% in buildings (ClimateWorks and CPD, 2020).
In terms of technological knowledge development, the literature review shows Australia performed well and this is supported by the stakeholder interviews and workshops. Where gaps exist, it is in knowledge development for translation of technological innovation into transformational change.
“ The main emphasis needs to be on the adoption of technology and the development of skills around those technologies. And indeed, the development and implementation of non-R&D innovation in the form of new business models, systems integration, design, work and management practices, all of these things that are less tangible, not easy to measure, but nevertheless are a key element of an innovation ecosystem and which require both entrepreneurial skills and the ability to collaborate with both complementary firms in a value chain and with research and education institutions.”
Interview participant.
Figure 11. Energy-related public R&D as a percentage of GDP
0
0.01
0.02
0.03
0.04
0.05
0.06
0.07
0.08
1995 1997 1999 2001 2003 2004 2005 2006 2007 2008 2009 2010 2011 2012 2013 2014 2015 2016 2017 2018
Australia Canada France Germany UK
From OECD (2019)
E3 Opportunity Assessment: Developing the future energy workforce74
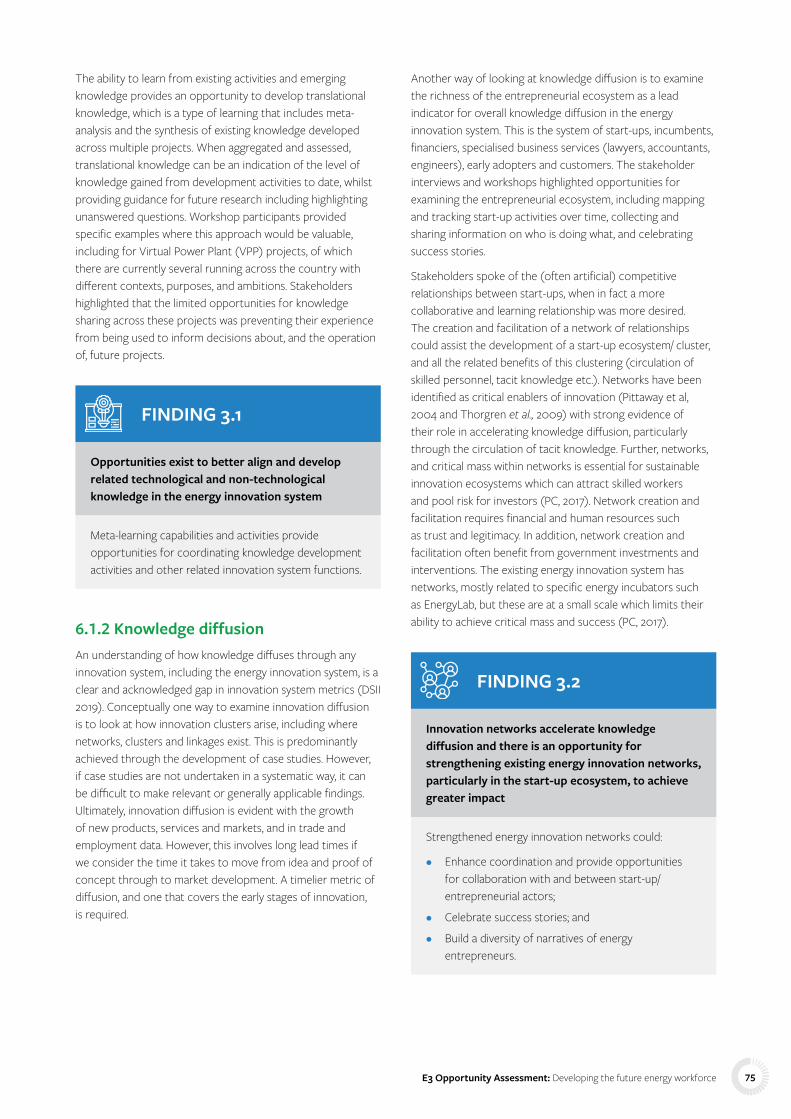
The ability to learn from existing activities and emerging knowledge provides an opportunity to develop translational knowledge, which is a type of learning that includes meta-analysis and the synthesis of existing knowledge developed across multiple projects. When aggregated and assessed, translational knowledge can be an indication of the level of knowledge gained from development activities to date, whilst providing guidance for future research including highlighting unanswered questions. Workshop participants provided specific examples where this approach would be valuable, including for Virtual Power Plant (VPP) projects, of which there are currently several running across the country with different contexts, purposes, and ambitions. Stakeholders highlighted that the limited opportunities for knowledge sharing across these projects was preventing their experience from being used to inform decisions about, and the operation of, future projects.
FINDING 3.1
Opportunities exist to better align and develop related technological and non-technological knowledge in the energy innovation system
Meta-learning capabilities and activities provide opportunities for coordinating knowledge development activities and other related innovation system functions.
6.1.2 Knowledge diffusionAn understanding of how knowledge diffuses through any innovation system, including the energy innovation system, is a clear and acknowledged gap in innovation system metrics (DSII 2019). Conceptually one way to examine innovation diffusion is to look at how innovation clusters arise, including where networks, clusters and linkages exist. This is predominantly achieved through the development of case studies. However, if case studies are not undertaken in a systematic way, it can be difficult to make relevant or generally applicable findings. Ultimately, innovation diffusion is evident with the growth of new products, services and markets, and in trade and employment data. However, this involves long lead times if we consider the time it takes to move from idea and proof of concept through to market development. A timelier metric of diffusion, and one that covers the early stages of innovation, is required.
Another way of looking at knowledge diffusion is to examine the richness of the entrepreneurial ecosystem as a lead indicator for overall knowledge diffusion in the energy innovation system. This is the system of start-ups, incumbents, financiers, specialised business services (lawyers, accountants, engineers), early adopters and customers. The stakeholder interviews and workshops highlighted opportunities for examining the entrepreneurial ecosystem, including mapping and tracking start-up activities over time, collecting and sharing information on who is doing what, and celebrating success stories.
Stakeholders spoke of the (often artificial) competitive relationships between start-ups, when in fact a more collaborative and learning relationship was more desired. The creation and facilitation of a network of relationships could assist the development of a start-up ecosystem/ cluster, and all the related benefits of this clustering (circulation of skilled personnel, tacit knowledge etc.). Networks have been identified as critical enablers of innovation (Pittaway et al, 2004 and Thorgren et al., 2009) with strong evidence of their role in accelerating knowledge diffusion, particularly through the circulation of tacit knowledge. Further, networks, and critical mass within networks is essential for sustainable innovation ecosystems which can attract skilled workers and pool risk for investors (PC, 2017). Network creation and facilitation requires financial and human resources such as trust and legitimacy. In addition, network creation and facilitation often benefit from government investments and interventions. The existing energy innovation system has networks, mostly related to specific energy incubators such as EnergyLab, but these are at a small scale which limits their ability to achieve critical mass and success (PC, 2017).
FINDING 3.2
Innovation networks accelerate knowledge diffusion and there is an opportunity for strengthening existing energy innovation networks, particularly in the start-up ecosystem, to achieve greater impact
Strengthened energy innovation networks could:
• Enhance coordination and provide opportunities for collaboration with and between start-up/ entrepreneurial actors;
• Celebrate success stories; and
• Build a diversity of narratives of energy entrepreneurs.
E3 Opportunity Assessment: Developing the future energy workforce 75

6.1.3 Guidance of search Guidance of search refers to those activities within the innovation system that can provide visibility and clarity about specific wants or needs of stakeholders (Hekkert et al, 2007). For example, renewable energy or emissions reduction goals highlight that innovation aimed at achieving these goals is valued and legitimate. The ability of the energy innovation system to provide a range of options is as important as being able to support options through to the full development, deployment and scaling of stages.
There are various mechanisms available to support diversity in the guidance of search, including the investment mandates of key institutions such as ARENA, as well as having a variety of major publicly funded R&D programs (including RACE for 2030). Guidance of search rarely comes from just one stakeholder or institution; rather, it arises from the cumulative effect of multiple relationships between actors in the innovation system.
Stakeholders noted the strong power dynamics that can shape search activities. They said that publicly funded activities need to allow a diversity of search and innovation pathways from a range of actors to emerge, and that these activities should not just rely on incumbents or powerful actors. When it is only these actors and/or institutions that guide the search activities, this can lead to incremental innovation, as innovation only emerges from expected sources. This stymies the transformational potential of energy innovation.
Increasing the diversity of the actors that participate in selecting search activities highlights the importance of diversity in innovation networks, and the corresponding need for capacity building and resourcing to ensure a diverse range of actors can be part of the energy innovation system. This also extends to customers, users and communities impacted by the changing energy system.
FINDING 3.3
Ensuring that a diverse range of actors is involved in the guidance of search function ensures that a range of perspectives will inform innovation
This diversity may facilitate the emergence of innovation from unexpected sources and has implications for the agility and flexibility of required support mechanisms.
6.1.4 Entrepreneurial activities Entrepreneurs take new knowledge and ideas as opportunities to generate new business. Entrepreneurs can either initiate new business ventures or they can work through existing companies that diversify their business strategies to take advantage of new developments (Hekkert et al., 2007). Australia’s clean energy entrepreneurial ecosystem is perceived by stakeholders to be strong in parts but with the potential to develop and scale further. The ecosystem was initially built around support for the commercialisation of new technology through state and federal government renewable energy feed-in tariffs, renewable energy targets and support for research, development and deployment activities at universities and other research institutions. In recent years, business commitments to decarbonisation have played a leading role in driving energy innovation and adoption.
Bumpus and Comello (2016) characterise the entrepreneurial ecosystem in Australia as having a deep but siloed focus on technology development (wind, rooftop solar and energy materials commercialisation) and a ‘shallow, but wide lake’ of clean energy ideas that lack ‘investable substance’. Investable substance or investment readiness is the degree to which an entrepreneurial concept is ready for external investment – either by an investor or a first customer. The definition of investment readiness varies across investor types but generally refers to the capacity of a business or start-up to understand and meet the needs of external funders. This capacity is assessed by looking at the entrepreneur, management team, business plan and marketing strategies, as well as financial considerations and projections (Mason and Kwok, 2010).
“ There has been this real focus on technology and thinking that technology solves everything. Actually, it is understanding how a technology fits into someone’s life and how it happens to make something easier, cheaper, more efficient that is the real question.”
Interview participant.
In Australia, specific entrepreneurial support has focused on two areas. The first area is the development of energy-specific incubators and accelerator programmes (for example EnergyLab and Startupbootcamp) as well as energy-specific cohorts in general incubators and accelerators.
The second area is the creation of support institutions for early-stage entrepreneurship and experimentation such as ARENA and CEFC, as well as living lab projects and net-zero experiments. The Latrobe Valley Authority managing the phasing out of coal-based electricity generation in the region is an example of this.
Incubators and accelerators play critical roles in building investment readiness and increasing the non-technological skills of entrepreneurial teams. They also contribute to the sophistication of the entrepreneurial ecosystem through the increased availability of specialised business services or
E3 Opportunity Assessment: Developing the future energy workforce76

financing sources, and the creation of specialised labour markets. As a result, accelerators and incubators play an ‘intermediary role’ by coordinating, validating and synthesising knowledge about the energy innovation system for other actors. One of the stakeholder interviews highlighted this impact of accelerators:
“ Start-ups are utilising accelerator programs that can help them access market domain information quickly and efficiently; with this expertise and network they can go along this learning curve much, much quicker.”
Interview participant.
However, there has only been anecdotal evidence of the impact of accelerator programs globally, including in the Australian market where energy-specific incubators are relatively new and small scale. The systematic collection of evidence demonstrating the impact of these intermediaries in building investment readiness in new start-up firms and increasing the sophistication of the entrepreneurial ecosystem, will help facilitate their growth in the Australian energy innovation system.
FINDING 3.4
Energy-specific incubators and accelerators play critical roles in supporting entrepreneurial innovation pathways
Increasing investment in energy specific accelerator and incubator programs requires the ongoing and systematic collection of evidence that demonstrates the catalytic role these programs play in energy innovation systems. There is also opportunity to draw on aspects of best practices from overseas, particularly in enhancing network formation and coordination, to further develop the role and impact of accelerator programs (related to Finding 3.2).
6.1.5 Market formationNew business models and technologies often have difficulties in competing with existing business models, products and services, even if they offer superior performance or features. The early adopter feedback loop is critical in refining and developing new innovations, but to survive, these innovations need some form of protection. In socio-technical transitions literature, this is referred to as a “niche” whereby the innovation is supported in a protected space that allows the new technology or business model to be incubated to a point where it can disrupt the landscape. This is particularly critical with radical or transformative innovations.
The market formation function of an innovation system includes the activities that contribute to the creation of these
protected spaces and is closely linked to the guidance of search. Activities contributing to market formation could include: grants, subsidies, favourable taxation treatment, assistance in intellectual property protection and public procurement of early-stage products or services. They can also include more comprehensive activities that contribute to creating protective spaces for new business models, products and services.
Stakeholders in both the workshops and interviews identified significant opportunities for increasing the capacity and coordination of new market formation and highlighted the important role of public policy in co-creating the overall vision and ambition for clean energy transformation in Australia. Their comments included:
“ The role of government right now should be to develop a vision for where we want to be, and then get out of the way and allow the market to actually drive change because I think the market is more ready than the government.”
“ Around the world we see other countries have very sophisticated industry policies. We did have an industry policy that was appropriate to the structural adjustment that needed to occur with tariff reforms in the 1990s. And it did facilitate a growth of elaborately transformed manufactures as part of the transition away from large scale, vertically integrated mass production industry to smaller scale units of production and value chains. That was all happening. And then, of course, we got hit by the commodity boom and everything changed. And we never developed a new generation of industry policies that were adapted to the new environment.”
“ There are times for pilots and there are times for moving on to just doing it at scale, because you can have death by pilot, too.”
FINDING 3.5
Finding 3.5: The creation and support of a clear, united vision and ambition for clean energy transformation in Australia is critical for clean energy market formation
A clear, united vision and ambition for clean energy transformation in Australia should consider:
• The need to increase capacity and coordination across the energy innovation system;
• The role of public policy in co-creating the overall vision; and
• The need for the creation or coordination of a collective voice.
E3 Opportunity Assessment: Developing the future energy workforce 77

6.1.6 Resource mobilisation Australia has several institutions that play critical roles in financing new energy innovations. These institutions include ARENA, CEFC, CSIRO and various dedicated innovation funds for clean energy. Some of them are supported by government and private capital investment funds such as the Clean Energy Innovation Fund which play critical roles in financing new energy innovations and their deployment at later stages.
Research, development, and deployment can be funded by multiple sources, and often a combination of sources is utilised. For new technology and business model commercialisation, the most common source of capital is from within an existing business or business unit. This type of internal incubation or intrapreneurship allows for longer timelines, less external oversight, closer relationships between the technology and the ultimate end user or customer. This approach is of course limited by the business resources available. In the case of large, multinational companies this is not an issue, but for small and medium-sized firms this can quickly become a constraint.
Large, multinational companies are also an important source of external finance for small start-up and growth firms, as they can act as first customers, equity investors, joint venture partners, and in some cases acquirers, when they purchase small start-up firms to acquire new technology and know-how.
Corporate venture capital (CVC) is relatively low in Australia, although some private sector capital flows through accelerator programs, for example EnergyLab and Startupbootcamp have partnerships with energy providers. Some energy utilities are starting to undertake CVC equity investments in energy start-ups, for instance Energy Australia has made an equity investment in energy technology company RedBack Technologies, and Origin Energy has invested in Tempus Energy, although this type of activity is low by international standards (Bumpus 2019).
Australia also has a relatively small pool of publicly backed venture capital. There are such VC funds in Australia, the first being Southern Cross Venture Partners who manage the Southern Cross Renewable Energy Venture Fund which has capital of $120m with 50% investment from ARENA and 50% from Softbank China. The fund’s investment mandate includes investing in early-stage renewable energy and enabling technology companies.
The second fund is the Clean Energy Seed Fund managed by Artesian Partners, which has capital of $26m and includes core investment from the CEFC. This Fund invests in clean energy start-ups that are pre-selected by partner accelerator programs, incubators, university programs and angel investor groups. The Fund can invest at the seed stage as well as provide follow-on funding.
Despite the existence of these vehicles for supporting and investing in energy entrepreneurship, success remains elusive for most start-ups seeking to gain a foothold in a new industry with high uncertainty while overcoming technological, scale, commercial, economic and policy barriers. There is less private finance focus on early-stage clean energy technologies and different business models, and there is also a key gap in clean energy finance at the deployment stage, with capital-intensive investment requirements that are too high for VC investment but too risky for banks/ debt finance. When we consider the pathways needed to catalyse innovation to achieve clean energy futures, especially in the context of RACE for 2030, these are significant gaps at both the early technology stage and the deployment stage.
Stakeholders also confirmed the existence of these funding gaps, which are ultimately constraints on the financing and funding of energy innovation that have arisen from a lack of diversity in funding sources and types. Further, the findings highlighted limitations to the non-sequential availability of financing from the seed or early stage and then follow-on funding, as well as a shortage of deployment capital at viable cost and in a suitable form. Stakeholders highlighted the clear need to harmonise the aims and objectives of different investors, and the role of using co-investment, especially public co-investment, strategically in areas that are critical to quickly reduce uncertainty. The literature review shows the critical role of intermediaries, especially financial intermediaries in providing this coordination and harmonisation, and stakeholders discussed the lack of these intermediaries and their development in the Australian context.
These gaps could be addressed by developing more diversity but by also enhancing coordination between funding and financing sources and investors. The NSW government’s recent Accelerating R&D in NSW Action Plan recommends the development of a US-style Small Business Innovation Research (SBIR) program to provide competitive grants for small and medium-sized enterprises to finance and commercialise innovative solutions to well-defined problems for NSW government agencies (NSW Government, 2021). Such funding mechanisms could be used to better coordinate resource mobilisation, knowledge diffusion, and the guidance of search and market formation functions in critical areas of the energy innovation system.
E3 Opportunity Assessment: Developing the future energy workforce78
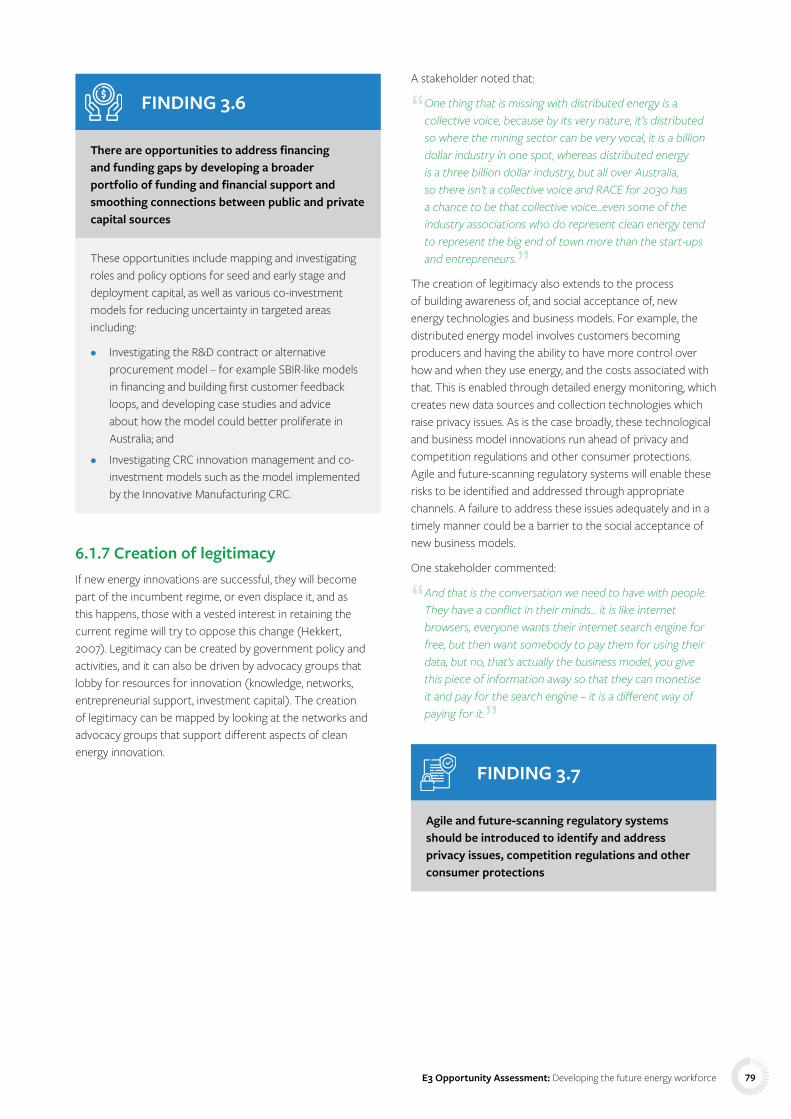
FINDING 3.6
There are opportunities to address financing and funding gaps by developing a broader portfolio of funding and financial support and smoothing connections between public and private capital sources
These opportunities include mapping and investigating roles and policy options for seed and early stage and deployment capital, as well as various co-investment models for reducing uncertainty in targeted areas including:
• Investigating the R&D contract or alternative procurement model – for example SBIR-like models in financing and building first customer feedback loops, and developing case studies and advice about how the model could better proliferate in Australia; and
• Investigating CRC innovation management and co-investment models such as the model implemented by the Innovative Manufacturing CRC.
6.1.7 Creation of legitimacyIf new energy innovations are successful, they will become part of the incumbent regime, or even displace it, and as this happens, those with a vested interest in retaining the current regime will try to oppose this change (Hekkert, 2007). Legitimacy can be created by government policy and activities, and it can also be driven by advocacy groups that lobby for resources for innovation (knowledge, networks, entrepreneurial support, investment capital). The creation of legitimacy can be mapped by looking at the networks and advocacy groups that support different aspects of clean energy innovation.
A stakeholder noted that:
“ One thing that is missing with distributed energy is a collective voice, because by its very nature, it’s distributed so where the mining sector can be very vocal, it is a billion dollar industry in one spot, whereas distributed energy is a three billion dollar industry, but all over Australia, so there isn’t a collective voice and RACE for 2030 has a chance to be that collective voice...even some of the industry associations who do represent clean energy tend to represent the big end of town more than the start-ups and entrepreneurs.”
The creation of legitimacy also extends to the process of building awareness of, and social acceptance of, new energy technologies and business models. For example, the distributed energy model involves customers becoming producers and having the ability to have more control over how and when they use energy, and the costs associated with that. This is enabled through detailed energy monitoring, which creates new data sources and collection technologies which raise privacy issues. As is the case broadly, these technological and business model innovations run ahead of privacy and competition regulations and other consumer protections. Agile and future-scanning regulatory systems will enable these risks to be identified and addressed through appropriate channels. A failure to address these issues adequately and in a timely manner could be a barrier to the social acceptance of new business models.
One stakeholder commented:
“ And that is the conversation we need to have with people. They have a conflict in their minds… it is like internet browsers, everyone wants their internet search engine for free, but then want somebody to pay them for using their data, but no, that’s actually the business model, you give this piece of information away so that they can monetise it and pay for the search engine – it is a different way of paying for it.”
FINDING 3.7
Agile and future-scanning regulatory systems should be introduced to identify and address privacy issues, competition regulations and other consumer protections
E3 Opportunity Assessment: Developing the future energy workforce 79

6.2 Barriers to transformative innovationInnovation pathways are transformative processes that lead to new social, technological and economic systems. With multiple possibilities, innovation pathways are forged through learning by doing, taking a portfolio approach and taking advantage of strategic leverage points that can accelerate transformative change towards an improved state.
A critical step in our model for systems innovation involved mapping the barriers that stifle and block innovation. In this section we describe the barriers that were identified in the interviews and workshops. Table 14 provides a high-level summary of our barrier analysis from the workshops and interviews.
Table 14. Barriers to transformative clean energy innovation
CATEGORY BARRIERS TO A CLEAN ENERGY TRANSITION
Business-related • Lack of capacity/ leadership/ motivation for innovation
• Decision-maker motivation for energy efficiency and decarbonisation
• Tertiary nature of energy innovation investments – energy investment not related to direct improvements in business output.
• Established supply chains reluctant to adopt new practices and products, offer new services, or upgrade their skills, etc. or discouraged from doing these things.
Policy and Regulatory
• Fragmented innovation support
• Lack of national energy and industry policy
• Complexity and inflexibility of rule change processes
• Different state-based rules
• High demonstration threshold for energy innovations
• Distribution networks suffer from too many rules, policies and processes along with different views on technology thresholds
• Lack of compliance checks whereby standards are not enforced
Technology / infrastructure
• Overcoming knowledge gaps and encouraging behavioural change to enable implementation of innovation in established sectors such as buildings, construction and manufacturing
• Slow implementation of EVs and battery storage
• Lack of demonstrations or prototypes of new products/services
• Lack of data – metering, awareness, potential benefits
Skills and training • Technical integration improvements are needed in terms of skills and software to interface with energy retailers
• Lack of knowledge of energy innovation opportunities
Cross-cutting • Accessing sufficient resources (financial, human, technological, social, regulatory) to scale innovation from seed to deployment
• Lack of adequate financing scale and timelines
• Lack of ambition, clear vision
• Lack of knowledge coordination and sharing
• Limited market confidence – both in terms of confidence in Australian generated innovation, but also broader lack of confidence and adoption of energy innovations.
E3 Opportunity Assessment: Developing the future energy workforce80

6.2.1 Fragmented innovation system supportWhile there are numerous examples of positive systems support for clean energy innovations in Australia, it is fragmented, and this is a major hurdle to achieving a transformative innovation system. It becomes a challenge for any individual or organisation to form a view of the current state of innovation, and therefore understand what mix of tangible and intangible innovation support is needed or available.
Subsystems of innovation support may exist at:
• An intra-organisational level, for example different start-up support systems within a university;
• An interdisciplinary level, for example academic based innovation systems versus those from industry;
• An intra-organisational level, for example different start-up accelerators within a state;
• A cross-jurisdictional level, for example different programs at the state and federal government levels;
• A geographical level, for example different innovation programs in metropolitan and rural areas; and
• International collaboration, for example cross border joint ventures or research collaborations.
These subsystems are rarely connected in a systematic way through an overall strategy or vision. This makes it more difficult for different organisations to self-organise and align themselves in the innovation landscape.
A workshop participant commented:
“ Our fragmented innovation support system is the major barrier. Different states are doing different things. The federal government has different programs. There is no one set program from the government.”
An interviewee commented:
“ The one thing that I observe that hinders innovation in Australia is a lack of different stakeholders coming together to work on solutions. This is particularly important in the Australian energy system as you have the market operator AEMO, the regulator AER, the AEMC and the federal and state governments, which have some say in the energy system as well by way of infrastructure investments and in some cases ownership of generation infrastructure. Then there’s all the various key players in the energy supply chain: generators, transmission and distribution network operators. So, in order for new technology adoption to happen, almost every single one of these stakeholders need to first be aware of things and also be receptive to new technologies. And there really isn’t a very good forum for these players to come together and discuss, firstly what their needs are, and secondly the solutions to address these needs.”
6.2.2 Lack of coordination and shared knowledgeA lack of coordination and shared knowledge was identified as a major barrier to innovation. Different types of organisations (e.g., research institutions, industry, government, start-ups, or accelerators) may seek transformative innovation, however the way they operate and communicate, and their motivations, vary widely. These differences may also be reflected in their varying capacities to develop, implement, and diffuse innovations. These differences (and the fragmented nature of the systems as detailed in the previous barrier description) can make coordination and the sharing of knowledge challenging, slow and inefficient.
6.2.3 Limited market confidenceLimited market confidence – there is belief that market actors in Australia (as a whole) lack sufficient ability to adopt and scale the innovations required for a clean energy transformation. Stakeholders cited countries such as China and Germany as examples where governments and other actors work together to de-risk the development of clean energy technologies domestically by helping create a local market that will have the potential to later lead to international expansion. Some good local government programs for clean energy do exist and state programs are emerging, but these are not being utilised to help Australian innovators.
“ If I look at where we have seen success at least in the energy space it’s in Germany, in China and in California, and what happens is there is policy and the State backs the sector. So the Germans bought German, they’ve created a market for the local technology. The same thing is happening in California and they’re really quite progressive in their energy investments and transition, California on its own is the fifth largest market in the world, I think, so they will learn by doing, build around the technology, build a technology capability, that we could do too if we if we invested locally.”
Interview participant.
One stakeholder commented that an unclear regulatory environment also creates uncertainty for clean energy innovation:
“ It’s just lack of confidence in our own capacity to deliver ... Instead of backing ourselves, we look to somebody else because that’s what we’ve been doing for the last 20 years. But the reality is we’re leading the world in this space. So what we’ve developed here is potentially going to be what happens everywhere else in the world rather than wait for the rest of the world to bring it to us.”
E3 Opportunity Assessment: Developing the future energy workforce 81

6.2.4 Lack of stated vision and direction for energy innovation in AustraliaThe lack of an explicit and shared vision for energy innovation in Australia was highlighted as a barrier by almost all stakeholders. This issue was perceived to be a contributor to Australia’s fragmented innovation system and limited market confidence.
Two participants commented:
“ I think there is this fundamental dislocation between where the world sees the future of energy and climate change and the resources and the innovation that we need to get there, with Australia’s vision of where the future is going, especially with the technologies and where they want to invest.”
“ For the moment we do not really have an ambitious future policy and [we have] a very cautious investment landscape due to that, because no one’s really wanting to invest hundreds of billions of dollars into carbon mitigation, that’s not going to happen because there is no strategic direction for the industry.”
6.2.5 Complexity and rigidity of regulatory system This barrier refers to the complexity, number, and rigidity of existing regulatory and legal frameworks. Rule changes,
different state-based rules, and different DNSP requirements were cited as particular barriers to innovation and the introduction of new clean energy product and service offerings. It was highlighted that this landscape of stakeholders and processes is essentially ‘impossible’ to navigate by an established business, let alone a start-up business.
FINDING 3.8
There are multiple barriers to energy innovation pathways
Barriers fall across multiple categories – business-related, policy and regulatory, technology and infrastructure and skills and training. There are also cross-cutting barriers. Specific barriers discussed are:
• Fragmented innovation support;
• Lack of coordination and knowledge sharing amongst organisations in the innovation systems; and
• Limited market confidence – both in terms of confidence in Australian generated innovation, but also broader confidence in the adoption of energy innovations.
6.3 Strengthening innovation pathways 6.3.1 How can innovation pathways be strengthened for greater impact?Innovation is a critical enabler for the clean energy transition. Given the scale and disruption needed to rapidly decarbonise the energy system, transformative innovation will be required in technologies, business models, behaviours, practices, and the ways we use and pay for (new) products and services.
Energy innovation systems that can provide the transformation in our energy systems are underpinned by four connected concepts:
• A portfolio approach that supports many different but connected initiatives to create combinatory effects and synergies or explore alternatives, to learn what works in unlocking change;
• Becoming demand-led by connecting the supply of innovation with demand-side actors;
• Identifying leverage points that can simultaneously intervene across multiple levers of change including technologies, business models, infrastructure, skills and capabilities, networks, consumer demand, financing
models, policy and regulatory frameworks, perceptions and social norms, community participation and production systems; and
• Learning by doing and connecting experience, exploration and sense-making across multiple, connected experiments to create options, momentum and learning about achieving and accelerating transformation at scale.
In this report we have used both the framing of transformational innovation and the seven functions of innovation systems to interpret the identified opportunities and barriers. By bringing together these two approaches we have identified a range of opportunities for strengthening the energy innovation system in Australia. These opportunities are listed in Table 15. They have in turn informed the three key areas of opportunity identified for RACE for 2030 which are:
• Developing and implementing a RACE for 2030 innovation strategy;
• Assessing and designing a program for capacity building in transformation innovation policy; and
• Assessing options and developing a broader portfolio of funding and financial support for energy innovation.
E3 Opportunity Assessment: Developing the future energy workforce82

Table 15. Opportunities to strengthen Australia’s energy innovation system
INNOVATION SYSTEM FUNCTION LEARNING-BY-DOING PORTFOLIO APPROACH DEMAND LED LEVERAGE POINTS
Knowledge development
Encourage meta-learning and coordination of existing knowledge development activities including identifying the cumulative learning of all the pilots, trials, demonstration projects for the energy system.
Build non-technological capabilities alongside technological capabilities into the knowledge development phase so questions of market and business model are considered early.
Encourage ambition in the setting of targets and stretch goals e.g. multiple universities pledge net zero campus with an open innovation model. Encourage other system actors to create similar stretch goals.
Build data transparency and democratisation (as opposed to regulations) into knowledge development projects so these issues are flagged and can be addressed early.
Knowledge diffusion
Creation and development of intermediaries to connect actors across the clean energy sector
RACE for 2030 to establish coordination to work across each of the levers of change and how RACE for 2030 projects enhance each other’s value.
Adopt challenge-led approach similar to Germany and the US, linked with market formation and Guidance of Search activities.
Target policy to aggregate and stimulate early demand, e.g. government procurement and investment in buyer-side capacity building
Guidance of search (GoS)
Develop reflexivity in our approach to GoS
Ensure (through procedures and collaborative methods) that GoS delivers diversity of energy innovation options.
Include multiple stakeholders in the GoS process, not just usual or easily accessible stakeholders. This will involve building the capacity for participation of some of those less experienced.
Link GoS to knowledge creation and diffusion, and coordinate with market formation, resource mobilisation and entrepreneurial activities.
Entrepreneurial activities
Map start-ups/entrepreneurs and provide additional support to develop collaborative networks and ecosystems
Ensure start-up cohort matches diversity of energy options expected to form the energy innovation systems, this includes ensuring diversity of entrepreneurs and new venture types.
Strengthen the governance and existing accelerator programs. Map closer connections between corporates (including CVC) and start-ups.
Change government policy on risk to unlock opportunities for innovation, and for start-ups to be part of government programs
Market formation
Public sector capabilities for learning to form and support new markets
Experimental and portfolio approach to market formation
Build transformational leadership capacity in key government, industry and finance stakeholders.
Adopt a challenge-led approach, similar to Germany and the US.
Establish a shared vision and linked missions across state and federal government departments and local governments
E3 Opportunity Assessment: Developing the future energy workforce 83
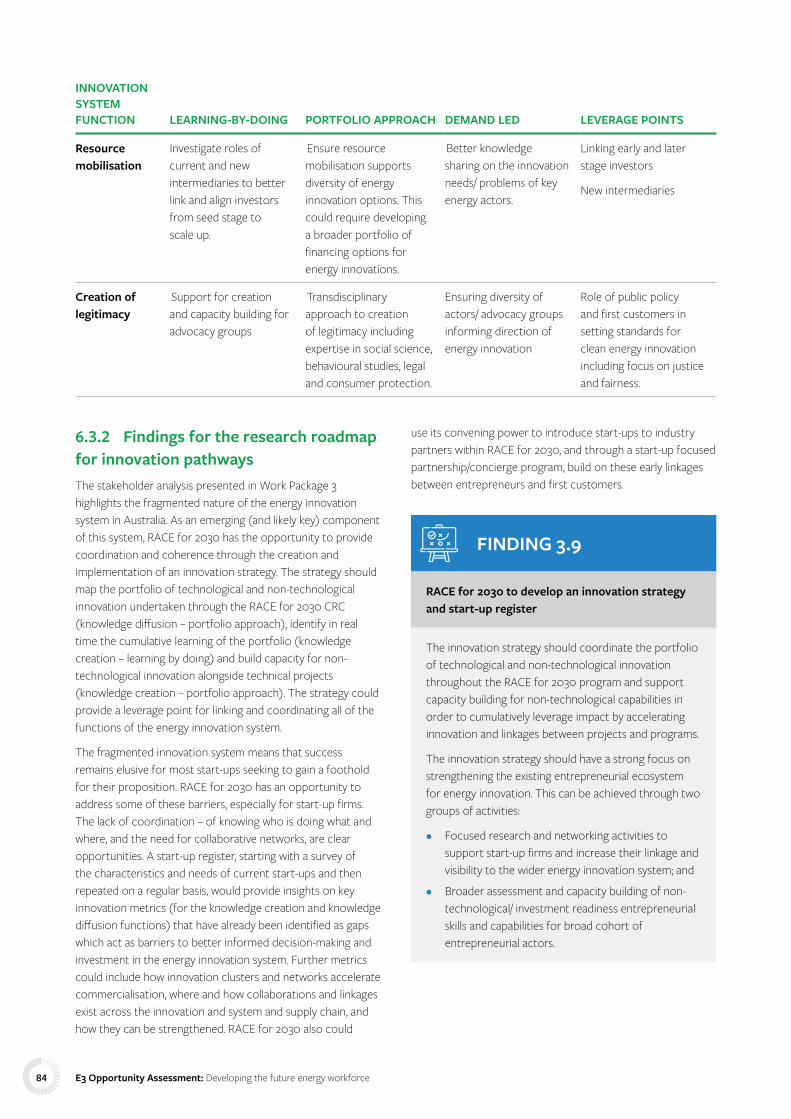
INNOVATION SYSTEM FUNCTION LEARNING-BY-DOING PORTFOLIO APPROACH DEMAND LED LEVERAGE POINTS
Resource mobilisation
Investigate roles of current and new intermediaries to better link and align investors from seed stage to scale up.
Ensure resource mobilisation supports diversity of energy innovation options. This could require developing a broader portfolio of financing options for energy innovations.
Better knowledge sharing on the innovation needs/ problems of key energy actors.
Linking early and later stage investors
New intermediaries
Creation of legitimacy
Support for creation and capacity building for advocacy groups
Transdisciplinary approach to creation of legitimacy including expertise in social science, behavioural studies, legal and consumer protection.
Ensuring diversity of actors/ advocacy groups informing direction of energy innovation
Role of public policy and first customers in setting standards for clean energy innovation including focus on justice and fairness.
6.3.2 Findings for the research roadmap for innovation pathwaysThe stakeholder analysis presented in Work Package 3 highlights the fragmented nature of the energy innovation system in Australia. As an emerging (and likely key) component of this system, RACE for 2030 has the opportunity to provide coordination and coherence through the creation and implementation of an innovation strategy. The strategy should map the portfolio of technological and non-technological innovation undertaken through the RACE for 2030 CRC (knowledge diffusion – portfolio approach), identify in real time the cumulative learning of the portfolio (knowledge creation – learning by doing) and build capacity for non-technological innovation alongside technical projects (knowledge creation – portfolio approach). The strategy could provide a leverage point for linking and coordinating all of the functions of the energy innovation system.
The fragmented innovation system means that success remains elusive for most start-ups seeking to gain a foothold for their proposition. RACE for 2030 has an opportunity to address some of these barriers, especially for start-up firms. The lack of coordination – of knowing who is doing what and where, and the need for collaborative networks, are clear opportunities. A start-up register, starting with a survey of the characteristics and needs of current start-ups and then repeated on a regular basis, would provide insights on key innovation metrics (for the knowledge creation and knowledge diffusion functions) that have already been identified as gaps which act as barriers to better informed decision-making and investment in the energy innovation system. Further metrics could include how innovation clusters and networks accelerate commercialisation, where and how collaborations and linkages exist across the innovation and system and supply chain, and how they can be strengthened. RACE for 2030 also could
use its convening power to introduce start-ups to industry partners within RACE for 2030, and through a start-up focused partnership/concierge program, build on these early linkages between entrepreneurs and first customers.
FINDING 3.9
RACE for 2030 to develop an innovation strategy and start-up register
The innovation strategy should coordinate the portfolio of technological and non-technological innovation throughout the RACE for 2030 program and support capacity building for non-technological capabilities in order to cumulatively leverage impact by accelerating innovation and linkages between projects and programs.
The innovation strategy should have a strong focus on strengthening the existing entrepreneurial ecosystem for energy innovation. This can be achieved through two groups of activities:
• Focused research and networking activities to support start-up firms and increase their linkage and visibility to the wider energy innovation system; and
• Broader assessment and capacity building of non-technological/ investment readiness entrepreneurial skills and capabilities for broad cohort of entrepreneurial actors.
E3 Opportunity Assessment: Developing the future energy workforce84
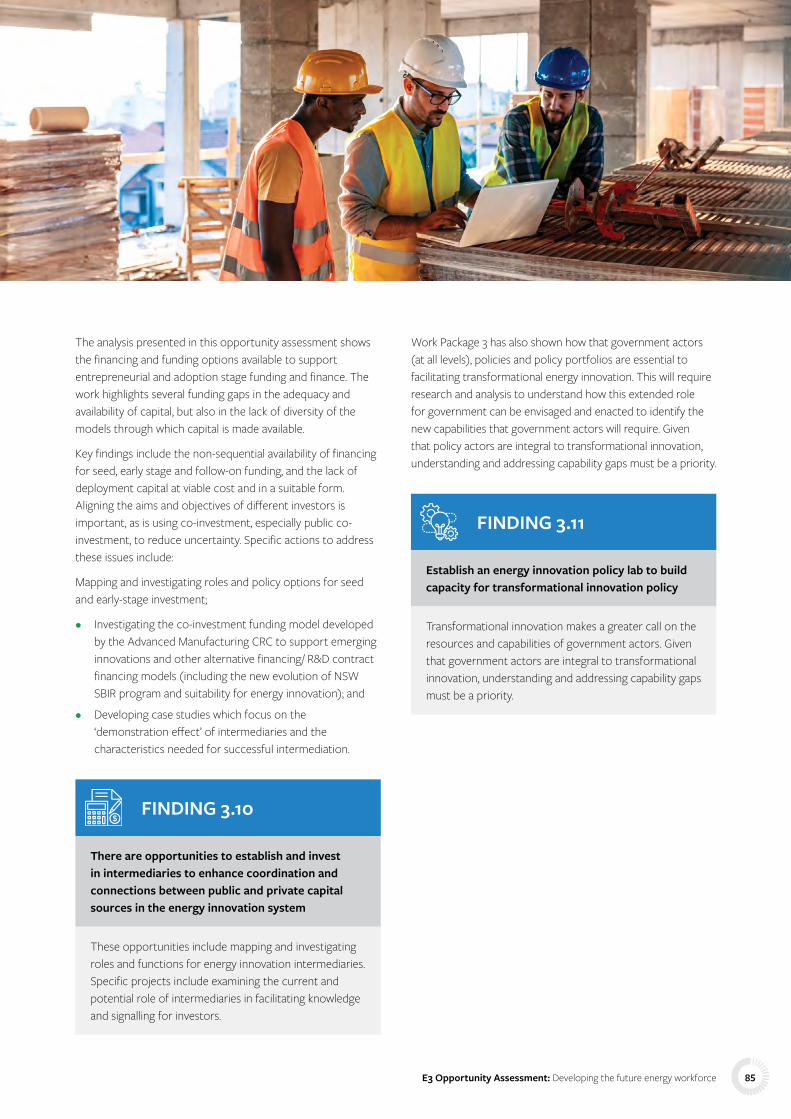
The analysis presented in this opportunity assessment shows the financing and funding options available to support entrepreneurial and adoption stage funding and finance. The work highlights several funding gaps in the adequacy and availability of capital, but also in the lack of diversity of the models through which capital is made available.
Key findings include the non-sequential availability of financing for seed, early stage and follow-on funding, and the lack of deployment capital at viable cost and in a suitable form. Aligning the aims and objectives of different investors is important, as is using co-investment, especially public co-investment, to reduce uncertainty. Specific actions to address these issues include:
Mapping and investigating roles and policy options for seed and early-stage investment;
• Investigating the co-investment funding model developed by the Advanced Manufacturing CRC to support emerging innovations and other alternative financing/ R&D contract financing models (including the new evolution of NSW SBIR program and suitability for energy innovation); and
• Developing case studies which focus on the ‘demonstration effect’ of intermediaries and the characteristics needed for successful intermediation.
FINDING 3.10
There are opportunities to establish and invest in intermediaries to enhance coordination and connections between public and private capital sources in the energy innovation system
These opportunities include mapping and investigating roles and functions for energy innovation intermediaries. Specific projects include examining the current and potential role of intermediaries in facilitating knowledge and signalling for investors.
Work Package 3 has also shown how that government actors (at all levels), policies and policy portfolios are essential to facilitating transformational energy innovation. This will require research and analysis to understand how this extended role for government can be envisaged and enacted to identify the new capabilities that government actors will require. Given that policy actors are integral to transformational innovation, understanding and addressing capability gaps must be a priority.
FINDING 3.11
Establish an energy innovation policy lab to build capacity for transformational innovation policy
Transformational innovation makes a greater call on the resources and capabilities of government actors. Given that government actors are integral to transformational innovation, understanding and addressing capability gaps must be a priority.
E3 Opportunity Assessment: Developing the future energy workforce 85
7 Conclusion
E3 Opportunity Assessment: Developing the future energy workforce86

This project has provided an assessment of the current state of play across Australia’s energy workforce, training and innovation landscape. In analysing these components as key enablers of the clean energy transition, the three work packages have developed a roadmap with defined pathways to support the future energy sector envisioned by RACE for 2030.
Work Package 1 found a general consensus amongst stakeholders that a key driver for measuring the clean energy sector is to project and manage the workforce changes needed to deliver a smooth transition. To achieve this, baseline information is needed on the size and makeup of the current energy sector. There was almost universal support for measuring and projecting the energy sector in its entirety, broken down by sub-sector, detailed occupation and location, rather than just focusing on the clean energy sector. The only method for collecting good quality baseline information is through direct surveys. As a result, the project team recommends that a survey in line with international best practice be developed to collect baseline information which can be used to project the future energy sector. To ensure that the energy efficiency and energy management workforce is accurately captured, the project team recommends that further scoping work be undertaken in advance of completing the first Australian Energy Employment Report.
Work Package 2 demonstrated that detailed mapping of current tertiary and vocational energy training is required to build on the stocktake undertaken in this project. This mapping is needed in order to build new pathways for the energy workforce, and to strengthen existing pathways. Work Package 2 identified the need for greater collaboration between industry and educational providers to ensure both sectors are aligned when it comes to identification of the future skills required, and the associated school-leaver training and professional development pathways that need to be developed. There will be a wide range of career opportunities for new entrants from diverse backgrounds. However, there is a need for greater concentration on raising this awareness and establishing appropriate pathways. This includes attracting school leavers, graduates, entrants from other sectors (including fossil fuels) and individuals who have traditionally been excluded from the industry.
Work Package 3 outlined the need for transformational innovation as an enabler for the clean energy transition, given the scale of the change that will be required to decarbonise the energy system, and the disruption that will accompany this transformation. In consulting with a wide range of stakeholders, the research demonstrated that there are opportunities to strengthen Australia’s energy innovation pathways. This can be done through the development of a specific innovation strategy to coordinate, shape and leverage innovation activities in the CRC, and through building capacity where needed, including in non-technological capabilities, investment readiness and cumulative, real-time learning. Additionally, further work can be undertaken with policy actors to identify and build the new capabilities required for transformational innovation policy. This could be complemented by enhancing the entrepreneurial ecosystem through the provision of coordination and collaborative architecture to help start-ups to interact with RACE for 2030 industry partners.
Overall, this project has established a clear pathway to understanding:
• The expected and potential workforce growth needed for a clean energy transition;
• The specific occupations and skills that will be required;
• How to deliver the training needed to support the development of those skills; and
• How innovation pathways can be strengthened to support Australia’s energy transition.
In particular, the findings from the research – which are summarised in Section 7.1 – pave the way for a research roadmap for developing the future energy workforce that aligns with the broader milestones and ambitions of RACE for 2030.
E3 Opportunity Assessment: Developing the future energy workforce 87

7.1 Summary of findingsThe findings below contribute directly to the research roadmap outlined in Appendix 7.
7.1.1 Work Package 1 findings
FINDING 1.1
There is a preferred methodology for collection of the baseline energy sector information
The recommended options for collecting the baseline information are set out in order of preference, noting that these are alternative approaches.
Option 1: Undertake an energy sector survey modelled on the U.S. Energy and Employment Report. The US survey has been used as the basis for estimations around the world, including in Australia OR
Option 2: Task the Australian Bureau of Statistics (ABS) with undertaking a mandatory company survey modelled on the UK clean energy survey. This has the advantage of a universal return rate but is unlikely to gain anything beyond minimum information on gross employment. Further, there is likely to be a reluctance to impose mandatory reporting requirements on industry OR
Option 3: Estimate via either I/O tables or employment multipliers. These could be based on:
• Current employment indicators for the Australian renewable energy sector and data from the USEER for the energy efficiency and demand management sector; or
• The development of indicators based on bottom-up activities, that is, identifying the labour per audit, or per retrofit.
In option 3, it is very unlikely that activities such as energy management or demand management would be included as there is a complete lack of existing data.
FINDING 1.2
Further thinking is needed to determine the methodology for obtaining baseline information on energy efficiency and energy management
There are specific challenges in measuring energy efficiency employment because of the diversity of the sector and the reality that many professionals that undertake energy efficiency work do not self-identify as doing so. For example, companies installing insulation as part of delivering minimum energy efficiency requirements may well answer “no” if asked whether they are engaged in energy efficiency activities. To ensure that the general survey accurately captures the energy efficiency workforce, consultation followed by testing is required to design language and processes to ensure this workforce is not missed by the survey.
Capturing energy management is similarly challenging, with energy managers of some sort dispersed through every industry that has premises. Design for inclusion is needed to ensure that appropriate training and development is available, and to track the growth of this important workforce.
E3 Opportunity Assessment: Developing the future energy workforce88

FINDING 1.3
An occupational breakdown and skills audit is needed to complement the wider employment survey
Develop a programme for detailed surveys of the occupational composition of employment to run alongside the main survey(s), to cover each sub-sector in turn. These will include a detailed audit of job types to Australian and New Zealand Standard Classification of Occupations (ANZSCO) 6-digit level – with additional categories added where necessary – and an audit of skill shortages. It is proposed that these sector surveys be undertaken in order of size and urgency, recognising there are existing sources for the occupational composition of renewable energy generation, coal and gas generation:
1. Energy efficiency, energy management, and demand management;
2. Battery storage;
3. Network management;
4. Hydrogen; and
5. Transport.
FINDING 1.4
A methodology for energy employment and market sizing projections is needed
Undertake a scoping study on what is needed to develop I/O tables for Australia to project energy efficiency employment, including examining how to link to key energy sector projections and identifying the data requirements to ensure that the baseline survey collects all the data that is needed. Investigate hybrid approaches with I/O and econometric models for energy efficiency projections.
FINDING 1.5
Energy sector projections using both employment indicators and I/O tables need to be undertaken
Undertake 5-, 10- and 20-year projections for energy sector employment by state and for Australia using both I/O modelling and employment indicators, including a comparison of the outcomes from the two methods. In the short term undertake electricity sector projections alongside the Integrated System Plan to provide some data to inform skills and training audits.
In the short term, undertake an electricity sector projection alongside the 2022 Integrated System Plan process, using the ISP scenarios and the available employment factors, and produce a whole of Australia electricity sector projection by integrating with the WA Whole of System Plan.
FINDING 1.6
The sections of ANZSIC and ANZSCO codes that relate to energy need to be updated to make them suitable for the modern energy sector
The Australian and New Zealand Standard Industry Classification (ANZSIC) and Australian and New Zealand Standard Classification of Occupations (ANZSCO) codes have not been updated for some time and are not reflective of changes in industry and occupational structure. In particular, the codes pertaining to the energy sector are ill suited to the modern energy sector. For example, ‘electricity generation’ is only separated into hydro and coal and gas.
We recommend government initiate and fund a process for updating ANZSIC and ANZSCO codes as they relate to energy, including a consultation process to determine:
• The advantages and disadvantages of updating energy-related codes;
• The energy-related technologies and sub-sectors that could usefully be included;
• The occupations most important to track; and
• Improve comparability with other country’s measurement of energy-related industries and occupations (such as the NAICS codes).
E3 Opportunity Assessment: Developing the future energy workforce 89

FINDING 1.7
The overall scope of the survey and projections should be the energy sector, broken down into sub-sectors, and should not be limited to the clean energy sector
The survey and projections should include the sectors and sub-sectors set out in Table 8 , noting all categories are further broken down into activities (manufacturing, installation, operations and maintenance, research and development) and sub-sectors (for example, residential, commercial, industrial, agricultural) where applicable.
FINDING 1.8
Transport should be viewed differently to the remainder of the energy sector in the first instance
Transport accounts for a significant proportion of Australia’s energy use, and some activities, such as fuel production, are clearly within the energy sector. There has been discussion as to whether all, or none, of the transport sector should be included in an energy sector survey. We recommend:
• Including fuel and fuel production that is the direct energy element of transport – i.e. electricity production for transport, LPG production and oil processing; note that batteries are already included under energy storage;
• Including EV charging networks, as these are energy infrastructure that is both integral to the rollout of EVs and could have significant effects on electricity delivery more generally;
• In the short term (first year), exclude the rest of the transport supply chain – e.g. train drivers, truck drivers, car maintenance, from the energy sector survey;
• Undertake consultation on whether, and how, to include transport efficiency, for example, activities such as efficient vehcile operation, mode shift, car share, and information sharing that reduces energy consumption; and
• Undertake consultation on whether to include other aspects of EVs, such as component production, noting that there should be consistency across other vehicle types.
FINDING 1.9
Energy efficiency and demand management definitions for the survey need to be determined in consultation with industry, government and other stakeholders
The U.S. Energy and Employment Report survey uses precise definitions of what are energy efficiency activities, generally referring to a Leadership in Energy and Environmental Design (LEED) or an Energy Star standard. We have examined the options to do this within Australia and have found the boundaries less well defined. For the pilot survey we have asked respondents to use their own definition of high efficiency as an interim measure. We recommend:
• All products and services for insulation, high efficiency glazing and LED lighting should be defined as energy efficiency;
• Additional consultation on other energy efficiency products and technologies – to establish where the boundary should lie between efficient and non-efficient products – should be undertaken; and
• Consultation on which definitions, if any, should be relative to regulatory standards, that is, once a current energy efficient product becomes the regulated minimum, should it cease to be included?
FINDING 1.10
Both ‘all energy efficiency work’ and ‘incremental energy efficiency work’ should be measured
Measure and report both metrics as far as possible, that is, ‘all work’ and ‘incremental work’ for energy efficiency activities for both current workforce and projections, as this is perhaps closest to reporting net energy sector jobs. This will require developing indicators to adjust baseline measurements of energy efficiency activities for the incremental proportion.
E3 Opportunity Assessment: Developing the future energy workforce90

7.1.2 Work Package 2 findings
FINDING 2.1
Detailed stocktake and mapping of existing post-secondary education and training is required to understand the exact aims, outcomes and content of such courses, as well as to identify and then rectify the gaps
The content of current educational programs should be reviewed in terms of the technical skills they focus on and the social or cross-cutting skills they teach. This understanding will highlight gaps in current offerings and inform future design.
It is also important to develop a clearer picture of enrolment and graduation trends from these courses to understand the future supply of skilled workers.
FINDING 2.2
Detailed future occupation and skills mapping is needed, and should be aligned with pathways to net zero by 2050
A better understanding of the actions needed to deliver net zero by energy sub-sector and energy intensive sectors – buildings, transport, industry (covering manufacturing, mining, and resources) and agriculture – is required to identify future skills needs. Framing this analysis on existing net zero by 2050 pathways, e.g. Decarbonisation Futures by ClimateWorks Australia and AEMO’s Integrated System Plan and the Western Australia Whole of System Plan will guide the prioritisation of education and training programs to 2030 to meet the changing workforce needs over time. These actions can then be used to inform analysis of the skilled tradespeople and professionals required to deliver the transition.
Following this, the existing ANZSCO codes, which align with these skilled tradespeople and professionals can be identified, and any gaps and poor alignments can be highlighted to support a future reclassification of ANZSCO codes.
FINDING 2.3
Existing energy professionals and skilled tradespeople need professional development pathways for delivering net zero by 2050 in target industries
Training programs exist, but existing – and future – energy professionals need professional development pathways with CPD opportunities mapped for working across the electricity, buildings, transport, industry (manufacturing and mining and resources) and agricultural sectors.
Professional development pathways should build upon and complement the training received at the vocational and tertiary levels. This work can build off the analysis undertaken to identify the skilled trades and professionals required – see Finding 2.2 – and for each sub-sector, it can map out the various pathways for energy service professionals and skilled trades.
FINDING 2.4
Improved coordination between different educational providers and industry is essential to fill the talent pipeline
An energy workforce development lab, facilitated by RACE, would enable different education providers and industry to coordinate activities and collaborate, leading to better outcomes for all.
An initial task would be a review to identify the appropriate mechanisms to support coordination and collaboration, and to identify the key stakeholders who should be involved. This review would aim to identify other initiatives underway to avoid duplication, and to ensure that the forum focused its efforts on initiatives that have the best chance of being implemented.
E3 Opportunity Assessment: Developing the future energy workforce 91

FINDING 2.5
The energy industry can be made more attractive for graduates and entrants from other sectors
An energy workforce development lab, facilitated by RACE for 2030, would provide a forum to identify key measures which could help make the industry more attractive.
An initial task would see a review undertaken to identify the appropriate mechanisms to make the industry more attractive, and to identify the key stakeholders to be involved. This would aim to identify other initiatives underway to avoid duplication and ensure that outcomes from the forum will have the greatest chance of being successfully implemented.
FINDING 2.6
Women are greatly under-represented in the energy industry, but opportunity abounds
Attracting more women into the energy sector could potentially go a long way to alleviate workforce shortages. This will require explicit strategies, as many of the barriers are structural. It is also important to track diversity in the sector over time.
An energy workforce development forum, supported by RACE for 2030, would provide a setting in which to identify key measures to promote diversity in the sector’s workforce.
An initial task would be a review undertaken to identify the appropriate mechanisms to promote diversity (including diversity metrics), and the key stakeholders to be involved. This would aim to identify other initiatives underway to avoid duplication and ensure that outcomes from the forum will have the greatest chance of being implemented.
FINDING 2.7
Mapping of occupations and skills needs for fossil fuel workers is necessary
Detailed mapping of the occupational breakdown within fossil fuel industries, including identification of roles which cannot easily transition because of a lack of comparable opportunities, is essential to enable a just transition for workers. This should include the identification of commonalities that could enable fossil fuel workers to transition to other parts of the energy sector and/ or industries enabled by the energy transition – e.g. green steel production and green ammonia production. Identification and consideration of the geographic location of jobs impacted in the workforce transition is also required for a just transition.
FINDING 2.8
Pathways for developing cross-cutting skills for both traditional and non-traditional energy professionals are needed
Bridging organisations, such as RACE for 2030, can play an important role in highlighting the need for social or cross-cutting skills. Dedicated short courses and training programs to develop these skills can then be commissioned.
FINDING 2.9
More research is required to understand the digital skill uplift needed in the energy sector
Digital literacy is a key cross cutting skill in energy. This study recommends that a deep dive be undertaken into the digital skills required of professionals and qualified tradespeople involved in the energy sector, as well as other professionals who work in enabling and supporting sectors.
E3 Opportunity Assessment: Developing the future energy workforce92

7.1.3 Work Package 3 findings
FINDING 3.1
Opportunities exist to better align and develop related technological and non-technological knowledge in the energy innovation system
Meta-learning capabilities and activities provide opportunities for coordinating knowledge development activities and other related innovation system functions.
FINDING 3.2
Innovation networks accelerate knowledge diffusion and there is an opportunity for strengthening existing energy innovation networks, particularly in the start-up ecosystem, to achieve greater impact
Strengthened energy innovation networks could:
• Enhance coordination and provide opportunities for collaboration with and between start-up/ entrepreneurial actors;
• Celebrate success stories; and
• Build a diversity of narratives of energy entrepreneurs.
FINDING 3.3
Ensuring that a diverse range of actors is involved in the guidance of search function ensures that a range of perspectives will inform innovation
This diversity may facilitate the emergence of innovation from unexpected sources and has implications for the agility and flexibility of required support mechanisms.
FINDING 3.4
Energy-specific incubators and accelerators play critical roles in supporting entrepreneurial innovation pathways
Increasing investment in energy specific accelerator and incubator programs requires the ongoing and systematic collection of evidence that demonstrates the catalytic role these programs play in energy innovation systems. There is also opportunity to draw on aspects of best practices from overseas, particularly in enhancing network formation and coordination, to further develop the role and impact of accelerator programs (related to Finding 3.2).
FINDING 3.5
Finding 3.5: The creation and support of a clear, united vision and ambition for clean energy transformation in Australia is critical for clean energy market formation
A clear, united vision and ambition for clean energy transformation in Australia should consider:
• The need to increase capacity and coordination across the energy innovation system;
• The role of public policy in co-creating the overall vision; and
• The need for the creation or coordination of a collective voice.
E3 Opportunity Assessment: Developing the future energy workforce 93

FINDING 3.6
There are opportunities to address financing and funding gaps by developing a broader portfolio of funding and financial support and smoothing connections between public and private capital sources
These opportunities include mapping and investigating roles and policy options for seed and early stage and deployment capital, as well as various co-investment models for reducing uncertainty in targeted areas including:
• Investigating the R&D contract or alternative procurement model – for example SBIR-like models in financing and building first customer feedback loops, and developing case studies and advice about how the model could better proliferate in Australia; and
• Investigating CRC innovation management and co-investment models such as the model implemented by the Innovative Manufacturing CRC.
FINDING 3.7
Agile and future-scanning regulatory systems should be introduced to identify and address privacy issues, competition regulations and other consumer protections
FINDING 3.8
There are multiple barriers to energy innovation pathways
Barriers fall across multiple categories – business-related, policy and regulatory, technology and infrastructure and skills and training. There are also cross-cutting barriers. Specific barriers discussed are:
• Fragmented innovation support;
• Lack of coordination and knowledge sharing amongst organisations in the innovation systems; and
• Limited market confidence – both in terms of confidence in Australian generated innovation, but also broader confidence in the adoption of energy innovations.
FINDING 3.9
RACE for 2030 to develop an innovation strategy and start-up register
The innovation strategy should coordinate the portfolio of technological and non-technological innovation throughout the RACE for 2030 program and support capacity building for non-technological capabilities in order to cumulatively leverage impact by accelerating innovation and linkages between projects and programs.
The innovation strategy should have a strong focus on strengthening the existing entrepreneurial ecosystem for energy innovation. This can be achieved through two groups of activities:
• Focused research and networking activities to support start-up firms and increase their linkage and visibility to the wider energy innovation system; and
• Broader assessment and capacity building of non-technological/ investment readiness entrepreneurial skills and capabilities for broad cohort of entrepreneurial actors.
E3 Opportunity Assessment: Developing the future energy workforce94
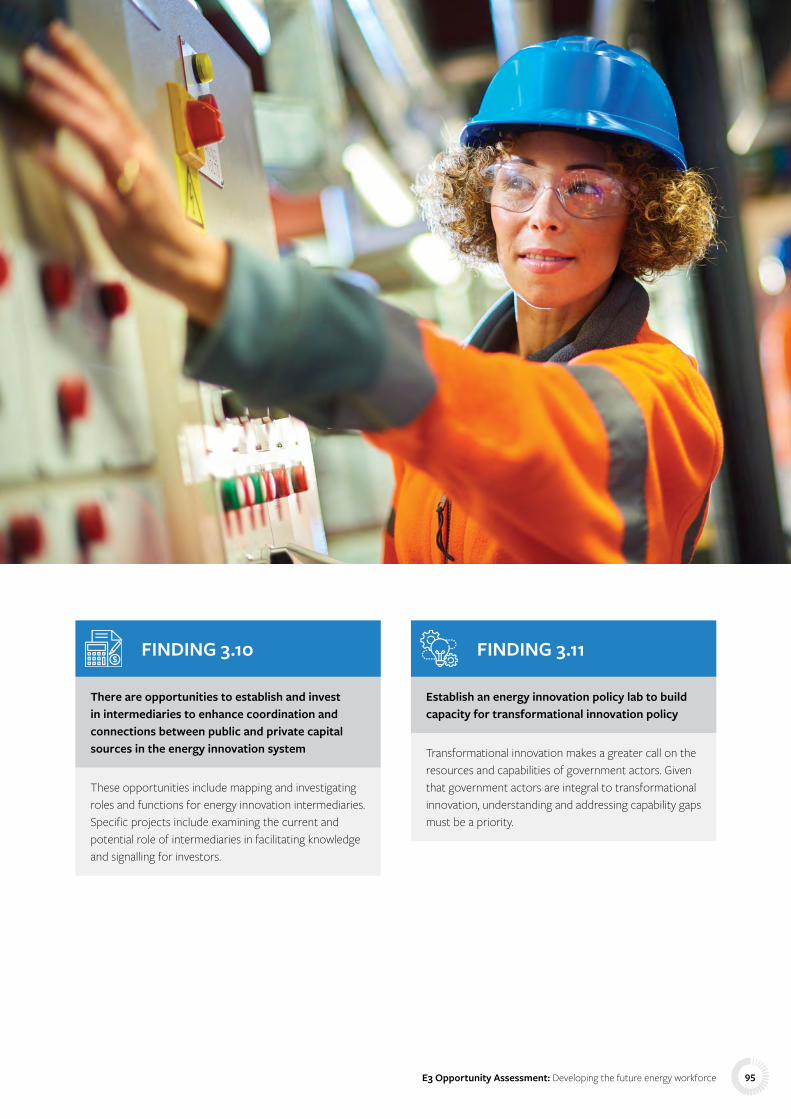
FINDING 3.10
There are opportunities to establish and invest in intermediaries to enhance coordination and connections between public and private capital sources in the energy innovation system
These opportunities include mapping and investigating roles and functions for energy innovation intermediaries. Specific projects include examining the current and potential role of intermediaries in facilitating knowledge and signalling for investors.
FINDING 3.11
Establish an energy innovation policy lab to build capacity for transformational innovation policy
Transformational innovation makes a greater call on the resources and capabilities of government actors. Given that government actors are integral to transformational innovation, understanding and addressing capability gaps must be a priority.
E3 Opportunity Assessment: Developing the future energy workforce 95

7.2 Next steps for RACE for 2030The findings from this opportunity assessment paved the way for a research roadmap for developing the future energy workforce that aligns with the broader milestones and ambitions of RACE for 2030. In particular, the following milestones will be partially or fully achieved through the projects identified in Table 16:
• Milestone E2.2c: 1st annual survey of energy productivity, demand management and decentralised energy market – Projects 1, 2, 3, 4 and 9;
• Milestone E2.3b: 2nd annual survey of energy productivity, demand management and decentralised energy market – Projects 1, 2, 3, 4, and 9;
• Milestone E3.1a: Stocktake of skills requirement and training for clean energy / decentralised energy transition – Project 10;
• Milestone E3.2b: Scoping report on priority course content – Projects 5, 6, 11, 12, 13, and 18;
• Milestone E3.3a: Initiate energy start-up engagement and commercialisation – Projects 19, 24 and 25;
• Milestone E3.3b: Survey of DER skills and employment – Projects 1,2,3, 4 and 9; and
• Milestone E3.4b: Scale up start up industry engagement and commercialisation – Projects 19, 24 and 25.
The research roadmap is contained in Appendix 7. Whilst all the findings and projects identified in the research roadmap are viewed as having equal value by the project team, the projects in Table 16 are deemed to be particularly pertinent given their links to the achievement of RACE for 2030 milestones.
Noting the timelines associated with the RACE for 2030 milestones, the projects identified above are priorities for the project team and IRG, and detailed proposals are anticipated be submitted to RACE for 2030 in Q1 of FY22.
The project team welcomes continued engagement with RACE for 2030 and its partners and wider stakeholders, especially those that supported the IRG or took part in the consultation – see Appendix 1. In particular, the project team is committed to ensuring not only that RACE for 2030 achieves its milestones, but also that RACE for 2030 is able to support the development of a future energy workforce that will facilitate the realisation of the RACE for 2030 vision of a customer-centred clean energy transition.
Table 16. Research roadmap projects linked directly to delivering RACE for 2030 milestones
RECOMMENDED RESEARCH: PROJECT NUMBER, TITLE, DESCRIPTION
PROJECT FINDING
RACE MILESTONE
EXPECTED COMPLETION
1 + 2
Australian Energy Employment Report (AEER): develop and conduct the first and second surveys of the Australian energy sector workforce and value, modelled on the U.S. Energy and Employment Report and Australian pilot survey.
1.1 E2.2c, E2.3b, E3.3b
Dec 2022 (1)
Dec 2024 (2) Standard track
3 Tracking the energy management workforce: design for inclusion: design the process to ensure coverage of the energy management workforce in the AEER by extending the survey in a streamlined version to non-energy sectors such as manufacturing, agriculture, health, and education.
1.2 Enabler: E2.2c, E2.3b, E3.3b
Feb 2022 Fast track
4 Energy workforce occupational breakdowns: identify breakdowns for energy efficiency, energy management, storage and other sectors as needed to allow occupational projections alongside gross employment projections from the AEER:• Part A: Energy efficiency and energy management;• Part B: Storage; and• Part C: Transport.
1.3 E2.2c, E2.3b, E3.3b
Dec 2023 (4A)
June 2024 (4B)
Dec 2024 (4C) Standard track
5 Developing Australian I/O tables for energy workforce analysis: undertake initial development and identify data requirements to utilise Australian I/O tables, and potentially macro-econometric modelling, for energy workforce and in particular EE jobs projections.
1.4 Enabler: E3.2b Mar 2022 Fast track
E3 Opportunity Assessment: Developing the future energy workforce96

RECOMMENDED RESEARCH: PROJECT NUMBER, TITLE, DESCRIPTION
PROJECT FINDING
RACE MILESTONE
EXPECTED COMPLETION
6 Energy sector workforce projections: develop 5-, 10-, and 20-year projections by energy sub-sector, occupation and location, using employment indicators, I/O and macro-econometric modelling:• Part A: Electricity sector workforce projection to accompany 2022
Integrated System Plan and the 2020 Whole of System Plan;• Part B: Whole of energy sector workforce projections following the
first AEER, including detailed occupational projections for EE and EM; • Part C: Whole of energy sector workforce projections following the
second AEER, including detailed occupational breakdowns for storage.
1.5 Enabler E3.2b Dec 2022 (6A) Fast track
June 2024 (6B) Standard track
Dec 2025 (6C) Standard track
9 Energy efficiency definitions: undertake targeted consultation by sub-sector to determine the boundaries to be used when measuring the energy efficiency workforce by activity and sub-sector.
1.9 Enabler: E2.2c, 2.3b, 3.3b
Dec 2022 Fast track
10 Detailed stocktake and mapping of existing tertiary and vocational education and training courses: review all current training and programs.
2.1 E3.1a Dec 2021 Fast track
11 Identifying priority course content for tertiary and vocational offerings: undertake gap analysis of training course offerings in tertiary and vocational education.
2.1 E3.2b Dec 2022 Standard track
12 The energy workforce: identifying skills of the future: undertake mapping of occupations and identify the generic technical and other skills for those specific occupations.
2.2, 2.8, 2.9
Enabler: E3.2b June 2022 Standard track
13 Professional development pathways for energy professionals: undertake review of continuing professional development (CPD) pathways for:• Part A: Energy services professionals, including energy efficiency and
energy management;• Part B: Renewable energy professionals;• Part C: Network professionals; and• Part D: Transport professionals.
2.3 E3.2b Dec 2022 Fast track
18 Developing energy literacy, digital and cross-cutting skills for non-traditional energy professionals: identify pathways to improving energy literacy, digital and cross-cutting skills in non-traditional energy professionals like bankers, real estate agents, etc.
2.8 Enabler: E3.2b June 2023 Standard track.
19 RACE for 2030 innovation strategy: develop an innovation strategy that assesses and then builds required innovation capabilities across innovative projects and actors involved in RACE for 2030.
3.1, 3.2, 3.3, 3.4, 3.5, 3.8, 3.9
Enabler: E3.3a, E3.4b
June 2022 Standard track.
24 Energy innovation policy lab: capacity building for transformational innovation: assess capacities within the Australian public sector to create a targeted program for building agile and future-scanning abilities.
3.7, 3.11 Enabler: E3.3a, E3.4b
June 2023 Standard track
25 Start-up register: develop and implement a survey of start-ups, including detailed metrics for innovation system.
3.9 E3.3a, E3.4b June 2023 Standard track
E3 Opportunity Assessment: Developing the future energy workforce 97

8 References
E3 Opportunity Assessment: Developing the future energy workforce98

ABS see Australian Bureau of Statistics
Allen Consulting Group. (2012). Review of energy efficiency skills demands and training provision across the trades and professions report. for the Department of Industry, Innovation, Science, Research and Tertiary Education, Melbourne. Available at: https://www.energy.gov.au/sites/default/files/energy-productivity-skills-training-report-2017_1.4mb.pdf.
Australian Skills Quality Authority. (2021). Training packages. Australian Skills Quality Authority. Available online: https://www.asqa.gov.au/about/vet-sector/training-packages. Accessed: 21 May 2021.
Australian Broadcasting Corporation (ABC). (2021). Australia’s first renewable energy training tower to be built in Ballarat. Available at: https://www.abc.net.au/news/2021-04-28/australias-first-renewable-energy-training-tower-ballarat/100101290. Accessed: 12 August 2021.
Australian Bureau of Statistics (2020a). Employment in renewable energy activities, Cat. No. 4631.0. Available at: www.abs.gov.au/statistics/labour/employment-and-unemployment/employment-renewable-energy-activities-australia/latest-release. Accessed: June 2021.
Australian Bureau of Statistics (2020b). Australian national accounts: input-output tables. pp. 68–70. Available at: www.abs.gov.au/statistics/economy/national-accounts/australian-national-accounts-input-output-tables/latest-release#input-output-multipliers. Accessed 12 August 2021
Australian Bureau of Statistics (2020c). Gender indicators, Australia: Reference period 2020. Available at: https://www.abs.gov.au/statistics/people/people-and-communities/gender-indicators-australia/latest-release. Accessed 27 May 2020
Baethge, C., Goldbeck-Wood, S. & Mertens, S. (2019). SANRA—a scale for the quality assessment of narrative review articles. Research Integrity and Peer Review 4 (1): 5. https://doi.org/10.1186/s41073-019-0064-8
Baker, M., French, E. & Ali, M. (2021). Insights into ineffectiveness of gender equality and diversity initiatives in project-based organizations. Journal of Management in Engineering. 37(3)
Bergek, A., Hekkert, M., & Jacobsson, S. (2008). Functions in innovation systems: A framework for analysing energy system dynamics and identifying goals for system-building activities by entrepreneurs and policy makers. In: Foxon, T., Köhler, J. and Oughton, C. (eds) Innovations for a low carbon economy: economic, institutional and management approaches, Edward Elgar, Cheltenham.
Bonino, D., Corno, F., De Russis, L. (2012). Home energy consumption feedback: A user survey, Energy Build. 47, 383–393, doi: 10.1016/j.enbuild.2011.12.017.
Blazejczak, J., Edler, D. and Gornig, M. (2020). Economic indicators of energy efficiency measures – update 2020. Berlin. Available at: https://www.umweltbundesamt.de/sites/default/files/medien/479/publikationen/uib_03-2020_oekonomische_indikatoren_energieeffizienz_aktualisierung_2020.pdf. Accessed: June 2021.
Breakey, H. & Sampford, C. (2017). National exams as a tool for improving standards: Can Australian financial advisers take a leaf from the professionals’ book? UNSW Law Journal, 40 (1), pp 385–401
Breitschopf, B., Nathani, C. and Resch, G. (2012). ‘Economic and industrial development’ EID-EMPLOY Methodological guidelines for estimating the employment impacts of using renewable energies for electricity generation. Karlsruhe. Available at: http://publica.fraunhofer.de/documents/N-236318.html. Accessed: 22 January 2021.
Briggs, C., Rutovitz, J., Dominish, E., Nagrath, K. 2020. Renewable energy jobs in Australia – Stage 1. Prepared for the Clean Energy Council by the Institute for Sustainable Futures, University of Technology Sydney.
Brown, R., Farrelly, M. & Loorbach, D. (2013). Actors working the institutions in sustainability transitions: The case of Melbourne’s stormwater management. Global Environmental Change, 23, pp. 701-718
Brundiers, K., Barth, M., Cebrián, G., Cohen, M. Diaz, L., Doucette-Remington, S., Dripps, W., Habron. G., Harré, N., Jarchow, M., Losch. K., Michel, J., Mochizuki, Y., Rieckmann, M., Parnell, R., Walker, P. & Zint, M. (2021). Key competencies in sustainability in higher education—toward an agreed-upon reference framework. Sustainability Science, 16:13–29.
Bumpus, A. (2019). Enabling digital energy entrepreneurship: comparative analysis of German and Australian digital energy opportunities, Report for the Energy Transition Hub, May 2019.
Bumpus, A., & Comello, S. (2017). Emerging clean energy technology investment trends. Nature Climate Change, 7(6), 382-385.
Clean Energy Council. (2020). Clean energy at work. Available at: https://assets.cleanenergycouncil.org.au/documents/resources/reports/Clean-Energy-at-Work/Clean-Energy-at-Work-The-Clean-Energy-Council.pdf. Accessed: June 2021.
E3 Opportunity Assessment: Developing the future energy workforce 99

Clean Energy Council (2020) Clean Energy Australia Report 2020. Available at: assets.cleanenergycouncil.org.au/documents/resources/reports/clean-energy-australia/clean-energy-australia-report-2020.pdf. Accessed: June 2021.
Clean Energy Council (2021) Clean Energy Australia Report 2021. Available at: http://www.cleanenergycouncil.org.au/policy-advocacy/reports.html. Accessed: June 2021.
ClimateWorks Australia. (2020). Decarbonisation futures: Solutions, actions and benchmarks for a net zero emissions Australia. ClimateWorks Australia. Available at: https://www.climateworksaustralia.org/resource/decarbonisation-futures-solutions-actions-and-benchmarks-for-a-net-zero-emissions-australia/. Accessed: June 2021.
Climate Institute (2011). Clean energy jobs in regional Australia methodology. Available at: https://australiainstitute.org.au/wp-content/uploads/2020/12/P648-Renewable-job-estimate-Web.pdf.
ClimateWorks Australia and CPD (2020). Measuring green innovation in Australia: A patent-based analysis. Prepared for the Climate & Recovery Initiative.
Commonwealth of Australia. (2014). Report of the Royal Commission into the Home Insulation Program. Available at: https://apo.org.au/sites/default/files/resource-files/2014-08/apo-nid41087.pdf Accessed: June 2021.
Czako, V. (2020) Employment in the energy sector, Status report, Publications Office of the European Union, Luxembourg, 2020, ISBN 978-92-76-18206-1, doi:10.2760/95180,
Dahlgren, K., Strengers, Y., Pink, S., Nicholls, L., and Sadowski, J. (2020). ‘Digital energy futures: review of industry trends, visions and scenarios for the home’, Monash Emerging Technologies Research Lab, Monash University, Available at: https://www.monash.edu/__data/assets/pdf_file/0008/2242754/Digital-Energy-Futures-Report.pdf. Accessed: June 2021.
Darby, S. (2006). ‘The effectiveness of feedback on energy consumption. A review for DEFRA of the literature on metering, billing and direct displays’, Environmental Change Institute. University of Oxford.
Darby, S. (2010). Smart metering: what potential for householder engagement, Building Research and Information 38 (5), 442–457.
Department of Employment, Skills, Small and Family Business. (2019). Engineering professions. National occupational cluster reports. Available at: https://www.dese.gov.au/collections/national-occupational-cluster-reports. Accessed: June 2021.
Deutsche Unternehmensinitative Energieeffizienz (2019) Branchenmonitor Energieeffizienz 2019, Online Survey. Available at: www.surveymonkey.de/r/BranchenmonitorEnergieeffizienz2019 .
Doblinger, C., Surana, K., & Anadon, L. D. (2019). Governments as partners: The role of alliances in US cleantech startup innovation. Research Policy, 48(6), 1458-1475.
DIIS (2019) Innovation metrics review: Workshop proceedings 13-14 March 2019 Department of Industry, Innovation and Science, Canberra. Available at: https://www.industry.gov.au/sites/default/files/2019-05/innovation-metrics-review-workshop-proceedings.pdf Accessed 12 August 2021
ECO Canada (2019) Energy efficiency employment in Canada. In collaboration with BW Research. Available at: www.eco.ca/blog/energy-efficiency-employment/. Accessed: June 2021.
Ellis, M. and Associates (2003) Economic performance and contribution of the sustainable energy industry 2002. Report for SEDA, Wagstaffe. Available at: https://www.parliament.vic.gov.au/images/stories/committees/Energy_Services/Final20Report20on20the20Inquiry20into20the20Energy20Services20Industry1.pdf.
Emmons Allison, J., McCrory, K., Oxnevad, I. (2019). Closing the renewable energy gender gap in the United States and Canada: The role of women’s professional networking, Energy Research & Social Science, 55, 35-45. https://doi.org/10.1016/j.erss.2019.03.011.
Endert, A., Hossain, M. S., Ramakrishnan, N., North, C., Fiaux, P., Andrews, C. (2014). The human is the loop: new directions for visual analytics Journal of Intelligent Information Systems. 43(3), 411–435. http://dx.doi.org.ezproxy.lib.monash.edu.au/10.1007/s10844-014-0304-9.
EnergySafe Victoria. (2021). Continuing professional development. Available at: https://esv.vic.gov.au/licensing-coes/licence-training-assessments/cpd/#what-is-cpd. Accessed: 13 June 2021.
Energy Skills Queensland. (2016). Changing industry, a changing workforce: Electricity network transformation roadmap workforce skilling impacts. Voced Plus. Available at: https://www.voced.edu.au/content/ngv%3A77859. Accessed: June 2021.
Engineers Australia. (2019). The engineering profession: a statistical overview, (14th edn.) Available at: https://www.engineersaustralia.org.au/sites/default/files/resources/Public%20Affairs/2019/The%20Engineering%20Profession%2C%20A%20Statistical%20Overview%2C%2014th%20edition%20-%2020190613b.pdf. Accessed: June 2021.
E3 Opportunity Assessment: Developing the future energy workforce100

Engineers Australia. (2020). Australia’s next generation of engineers: University statistics for engineering. Available at: https://www.engineersaustralia.org.au/sites/default/files/Higher_education_statistics_2020.pdf. Accessed: June 2021.
EurObserv’ER (2019) The state of renewable energies in Europe, 19th EurObserv’ER Report. Available at: https://www.isi.fraunhofer.de/content/dam/isi/dokumente/ccx/2020/The-state-of-renewable-energies-in-Europe-2019.pdf. Accessed: June 2021.
Eyre, N., Darby, S. J., Grünewald, P., McKenna, E., & Ford, R. (2018). Reaching a 1.5 degrees C target: socio-technical challenges for a rapid transition to low-carbon electricity systems. Philosophical Transactions of the Royal Society a-Mathematical Physical and Engineering Sciences, 376(2016), 0462. https://doi.org/10.1098/rsta.2016.0462
Fien J., Guevara J.R. (2013) Skills for a green economy: practice, possibilities, and prospects. In: Maclean R., Jagannathan S., Sarvi J. (eds) Skills development for inclusive and sustainable growth in developing Asia-Pacific. Technical and Vocational Education and Training: Issues, Concerns and Prospects, vol 19. Springer, Dordrecht. https://doi.org/10.1007/978-94-007-5937-4_14
Garrett-Peltier, H. (2017) Green versus brown: Comparing the employment impacts of energy efficiency, renewable energy, and fossil fuels using an input-output model. Economic Modelling 61, 439-447. http://dx.doi.org/10.1016/j.econmod.2016.11.012
Geels, Frank W and Schot, Johan (2010) The dynamics of transitions: a socio-technical perspective. In: Grin, John, Rotmans, Jan and Schot, Johan (eds.) Transitions to sustainable development: new directions in the study of long term transformative change. Routledge, pp. 11-104.
GHD. (2010). Report for long term training strategy on energy efficiency assessment skills reports. Available at: https://www.energy.gov.au/sites/default/files/long_term_training_strategy_for_the_devleopment_of_energy_efficiency_assessment_skills_-_final_report.pdf. Accessed: June 2021.
Giri, J., Parashar, M., Trehern, J., and Madani, V. (2012). The situation room: Control center analytics for enhanced situational awareness, IEEE Power Energy Mag., 10 (5), 24–39. doi: 10.1109/MPE.2012.2205316.
Goodwin et al. (2013), Creative user-centered visualization design for energy analysts and modelers, IEEE Transactions on Visualization and Computer Graphics, 19 (12) 2516–2525.
Green Energy Markets (2019) Energy efficiency employment in Australia. Prepared for the Energy Efficiency Council and the Energy Savings Industry Association. Available at: https://assets.eecca.org.au/library/ESIA-Reports/EEC-Jobs-Report-FINAL-2019-02-01.pdf.Accessed: 22 January 2021.
Hargreaves, T., Nye, M., Burgess, J. (2013). Keeping energy visible? Exploring how householders interact with feedback from smart energy monitors in the longer term, Energy Policy, 52, 126–134, doi:10.1016/j.enpol.2012.03.027.
Hekkert, M. P., Suurs, R. A., Negro, S. O., Kuhlmann, S., & Smits, R. E. (2007). Functions of innovation systems: A new approach for analysing technological change. Technological Forecasting and Social Change, 74(4), 413-432.
Hekkert, M. P., Janssen, M. J., Wesseling, J. H., & Negro, S. O. (2020). Mission-oriented innovation systems. Environmental Innovation and Societal Transitions, 34, 76-79.
Holtorf, H, Brudler, E. & Torío, H. (2018). Development of a holistic method for assessing success of renewable energy study programs. Solar Energy, 173, 209-214.
Hong, T., Gao, D., Laing, T. Kruchten, D. & Calzada, J. (2018). Training energy data scientist. IEEE Power & Energy Magazine. May-June, pp. 66-72
ILO. (2019). Skills for a greener future. International Labour Organization. Available at: https://www.ilo.org/wcmsp5/groups/public/---ed_emp/---ifp_skills/documents/publication/wcms_709121.pdf. Accessed: June 2021.
International Energy Agency (2013) Energy Efficiency Market Report 2013: Market Trends and Medium-Term Prospects Market Report, International Energy Agency. OECD/ IEA. Paris, France. Available at: https://www.iea.org/reports/energy-efficiency-market-report-2013.
International Energy Agency (2014) Capturing the Multiple Benefits of Energy Efficiency. Paris, France.
International Energy Agency (2020) Measuring and tracking employment related to building efficiency in the EU. Paris, France.
International Energy Agency (2020a) Net zero by 2050: A roadmap for the global energy sector, Paris, France
International Energy Agency (2020b), Gender diversity in energy: what we know and what we don’t know, IEA, Paris Available at: https://www.iea.org/commentaries/gender-diversity-in-energy-what-we-know-and-what-we-dont-know.
IRENA. (2018). Global energy transformation – a roadmap to 2050. International Renewable Energy Agency. Available at: https://www.irena.org/-/media/Files/IRENA/Agency/Publication/2018/Apr/IRENA_Report_GET_2018.pdf. Accessed: June 2021.
E3 Opportunity Assessment: Developing the future energy workforce 101

IRENA (2020a) Measuring the socio-economics of transition: Focus on jobs, International Renewable Energy Agency, Abu Dhabi.
IRENA. (2020b). Renewable energy and jobs annual review. International Renewable Energy Agency. Available at: https://www.irena.org/publications/2020/Sep/Renewable-Energy-and-Jobs-Annual-Review. Accessed: June 2021.
IRENA Jobs Database (2021) Renewable energy employment by country, /Statistics/View-Data-by-Topic/Benefits/Renewable-Energy-Employment-by-Country. Available at: www.irena.org/Statistics/View-Data-by-Topic/Benefits/Renewable-Energy-Employment-by-Country. Accessed: 4 May 2021.
Kattel, R. & Mazzucato, M. (2018). Mission-orientated innovation policy and dynamic capabilities in the public sector. Industrial and Corporate Change, 27(5), 787-801.
Kemp, R., & van Lente, H. (2011). The dual challenge of sustainability transitions. Environmental Innovation and Societal Transitions, 1(1), 121-124.
Khangura, S. (2012). Evidence summaries: the evolution of a rapid review approach. Systematic Reviews 1, 10(1), 1–9. https://doi.org/10.1186/2046-4053-1-10
Leal, H. (2019). Firm-level Insights into skills shortages and wages growth. Reserve Bank of Australia. Bulletin, March. Available at: https://www.rba.gov.au/publications/bulletin/2019/mar/firm-level-insights-into-skills-shortages-and-wages-growth.html#fn0. Accessed: June 2021.
Lee, E.-J., Pae, M.-H., Kim, D.-H., Kim, J.-M. and Kim, J.-Y. (2008). Literature review of technologies and energy feedback measures impacting on the reduction of building energy consumption, EKC2008 Proceedings of the EU-Korea Conference on Science and Technology, 2008, 223–228.
Lenzen, M. et al. (2017). ‘New multi-regional input–output databases for Australia – enabling timely and flexible regional analysis’, Economic Systems Research, 29(2) pp. 275–295.
Li, F., Trutnevyte, E. & Strachan, N. (2015). A review of socio-technical transition (STET) models. Technological Forecasting and Social Change, 100, pp. 290-305.
Liedtke, C., Welfens, M. J., Rohn, H., & Nordmann, J. (2012). Living Lab: User-driven innovation for sustainability. International Journal of Sustainability in Higher Education, 13(2) pp. 106-118
Liu, Y., Liu, J., Taylor, G., Liu, T., Gou, J., Zhang, X. (2016). Situational awareness architecture for smart grids developed in accordance with dispatcher’s thought process: a review, Frontiers of Information Technology & Electronic Engineering 17(11) 1107–1121, doi:10.1631/FITEE.1601516.
Lombrana L. M., Mathis V. & Lima J. (2021). Renewable energy boom unleashes a war over talent for green jobs. Bloomberg. Available at: https://www.bloomberg.com/news/articles/2021-06-08/renewable-energy-boom-unleashes-a-war-over-talent-for-green-jobs. Accessed: June 2021.
Lucas, H., Pinnington, S., Cabeza, L. (2018). Education and training gaps in the renewable energy sector. Solar Energy, 173, 449-455.
Macklin, J. (2020). Future skills for Victoria, Driving collaboration and innovation in post-secondary education and training. Available at: Department of Education and Training-Victorian Government: https://www.education.vic.gov.au/Documents/about/department/macklinreview-finalreport.pdf Accessed: May 2021.
Markard, J., Raven, R., & Truffer, B. (2012). Sustainability transitions: An emerging field of research and its prospects. Research Policy, 41(6), 955-967.
Mason, C., and Kwok, J. (2010) Investment readiness programmes and access to finance: a critical review of design issues. Local Economy 25, no. 4 (2010): 269-292.
Mazzucato, M., & Semieniuk, G. (2018). Financing renewable energy: Who is financing what and why it matters. Technological Forecasting and Social Change, 127, 8-22.
Miremadi, I., Saboohi, Y., & Jacobsson, S. (2018). Assessing the performance of energy innovation systems: Towards an established set of indicators. Energy Research & Social Science, 40, 159-176.
Murphy, C. (2020). National economic impacts of the million jobs plan. Sydney. Available at: bze.org.au/wp-content/uploads/2020/11/Million-Jobs-Plan-Economics-Summary.pdf. Accessed: 4 May 2021.
Muro, M., Rothwell, J. and Saha, D. (2011). Sizing the clean economy: a national and regional green jobs assessment. Brookings. Available at: www.brookings.edu/research/sizing-the-clean-economy-a-national-and-regional-green-jobs-assessment/. Accessed: 3 February 2021.
E3 Opportunity Assessment: Developing the future energy workforce102
Muro, M., Tomer, A., Shivaram, R. & Kane, J. (2019). Advancing inclusion through clean energy jobs. Brookings, April.
NASEO & EFI. (2020). U.S. Energy and Employment Report. Prepared by National Association of State Energy Officials and Energy Futures Initiative.
National Institute of Economic and Industry Research, Australian Conservation Foundation & Australian Council of Trade Unions (2016), Jobs in a clean energy future, ACF and ACTU, Melbourne, Available at: https://d3n8a8pro7vhmx.cloudfront.net/auscon/pages/1435/attachments/original/1477355385/ACF_Jobs_in_a_clean_energy_future.Web.pdf. Accessed: 12 Aug 2021,
National Skills Commission (2020). Australian jobs 2020. Australian Government, Canberra. Available at: https://www.nationalskillscommission.gov.au/sites/default/files/2020-11/Australian%20Jobs%20Report%202020.pdf. Accessed: 15 June 2021.
Natural Resources Canada, 2021. Energy Fact Book 2020-2021. Canadian Centre for Energy Information Available at: https://www.nrcan.gc.ca/sites/nrcan/files/energy/energy_fact/energy-factbook-2020-2021-English.pdf Accessed 12 August 2021.
Newton, C. & Rogers, B. (2020). Transforming built environments: towards carbon neutral and blue-green cities. Sustainability, 12(11), 4745, https://doi.org/10.3390/su12114745
NCVER (2020). Satisfaction with training remains high, 12 December 2019. Available at: https://www.ncver.edu.au/news-and-events/media-releases/satisfaction-with-training-remains-high.
NSW Government, Office of the Chief Scientist. (2020). Opportunities for prosperity in a decarbonised and resilient NSW: decarbonisation Innovation Study. NSW Government. Sydney.
NSW Government (2021). Turning ideas into jobs: Accelerating research and development in NSW, Action Plan). Available at: https://www.dpc.nsw.gov.au/assets/dpc-nsw-gov-au/publications/Accelerating-research-and-development-in-NSW-listing-1690/Accelerating-RD-in-NSW-Turning-ideas-into-jobs-web.pdf. Accessed: 15 June 2021.
OECD (2019) Green growth indicators 2018, OECD. Paris.
Office for National Statics (ONS) UK. (2021). Available at: www.ons.gov.uk/economy/environmentalaccounts/methodologies/lowcarbonandrenewableenergyeconomylcreesurveyqmi. Accessed: 4 May 2021.
Office of Energy Efficiency and Renewable Energy (2021). Energy literacy: essential principles for energy education, Office of Energy Efficiency and Renewable Energy US Department of Energy Available at: https://www.energy.gov/eere/education/energy-literacy-essential-principles-energy-education Accessed 12 August 2021.
Oke A., Aigbavboa C., Khangale T. (2018). Effect of skills shortage on sustainable construction. In: Charytonowicz J. (eds) Advances in human factors, sustainable urban planning and infrastructure. AHFE 2017. Advances in Intelligent Systems and Computing, vol 600. Springer, Cham. https://doi.org/10.1007/978-3-319-60450-3_29
Patwardhan, A., Azevedo, I., Foran, T., Patankar, M., Rao, A., Raven, R., . . . Weyant, J. (2012). Transitions in energy systems. In Global Energy Assessment Writing Team (Author), Global Energy Assessment: Toward a Sustainable Future (pp. 1173-1202). Cambridge: Cambridge University Press. doi:10.1017/CBO9780511793677.022
Pears, A. (2020). Energy efficiency education and training: Australian lessons on what employers want — or need. Energies, 9(13), 2386. https://doi.org/10.3390/en13092386
Prime Minister of Australia. (2021). Transcript of address to Business Council of Australia annual dinner, Sydney, 19 April. Available at: https://www.pm.gov.au/media/address-business-council-australia-annual-dinner-sydney-nsw. Accessed: June 2021.
Productivity Commission (2007) Public Support for Science and Innovation, Research Report. PC, Canberra.
Productivity Commission (2017) An overview of innovation policy, Shifting the dial: 5-year productivity review, Supporting Paper No. 12, Canberra.
Puerari, E., De Koning, J. I., von Wirth, T., Karré, P. M., Mulder, I. J., & Loorbach, D. A. (2018). Co-creation dynamics in urban living labs. Sustainability, 10(6), 1893.
Reis, I. F. G., Lopes, M. A. R. and Antunes, C. H. (2021). Energy literacy: an overlooked concept to end users’ adoption of time-differentiated tariffs’, Energy Efficiency, 14(4), 39, doi: 10.1007/s12053-021-09952-1.
Robert Gordon University. (2021). UK offshore energy workforce transferability review. May. Available at: http://www.rgueti.com/wp-content/uploads/2021/05/workforce-transferability-report.pdf. Accessed: June 2021.
Rogers, E. M. (2010). Diffusion of innovations. Simon and Schuster, Australia.
E3 Opportunity Assessment: Developing the future energy workforce 103
Rotmans, J., Kemp, R., & Asselt, M. (2001). More evolution than revolution: transition management in public policy, The Journal of Futures Studies, Strategic Thinking and Policy, 3(1):15-32.
Rutovitz, J., Briggs, C., Niklas, S., Atherton, A., Mey. F. (2021). Consultation paper: Measuring the clean energy workforce – methodological options and recommendations. Prepared for the RACE for 2030 CRC.
Sengers, F., Wieczorek, A. J., & Raven, R. (2019). Experimenting for sustainability transitions: A systematic literature review. Technological Forecasting and Social Change, 145(aug 2019), 153-164.
Sharp, D., & Raven, R. (2021). Urban planning by experiment at precinct scale: Embracing complexity, ambiguity, and multiplicity. Urban Planning, 6(1), 195-207.
Sinden, G., and Leffler, Z. (2016). Renewable energy jobs: future growth in Australia. Ernst & Young and the Climate Council of Australia
Schot, J., & Steinmueller, W. E. (2018). Three frames for innovation policy: R&D, systems of innovation and transformative change. Research Policy, 47(9), 1554-1567.
SDSN. (2020). Accelerating education for the SDGs in universities: A guide for universities, colleges, and tertiary and higher education institutions. New York: Sustainable Development Solutions Network (SDSN).
Sharpe, S., Cosh, A., Connell, D., & Parnell, H. (2009). Start-up finance: The role of micro funds in the financing of new technology-based firms. NESTA
Sharpe, S., Cosh, A., & Connell, D. (2013). Funding breakthrough technology. Cambridge Integrated Knowledge Centre report, Cambridge.
Smith, A., & Raven, R. (2012). What is protective space? Reconsidering niches in transitions to sustainability. Research Policy, 41(6), 1025-1036.
Spence, A., Goulden, M., Leygue, C., Bank, N., Bedwell, B., Jewell, M., Yang, R., Ferguson, E. (2018). Digital energy visualizations in the workplace: the e-Genie tool, Building Research and Information 46 (3), 272–283, doi: 10.1080/09613218.2018.1409569.
Statistics Canada (multiple years). Table 36-10-0366-01. Environmental and Clean Technology Products Economic Account
Stern, N. (2015). Why are we waiting?: The logic, urgency, and promise of tackling climate change. MIT Press.
Turnheim, B., & Sovacool, B. K. (2020). Forever stuck in old ways? Pluralising incumbencies in sustainability transitions. Environmental Innovation and Societal Transitions, 35, 180-184.
Ulrich, P., Distelkamp, M. and Lehr, U. (2012). Employment effects of renewable energy expansion on a regional level-first results of a model-based approach for Germany, Sustainability, 4(2), pp. 227–243. doi: 10.3390/su4020227.
UN Environment (2019). Global environment outlook – GEO-6: Healthy Planet, Healthy People. Available at: https://www.unep.org/resources/global-environment-outlook-6 Accessed 12 August 2021.
UNESCO. (2017). Greening technical and vocational education and training: A practical guide for institutions. United Nations Educational, Scientific and Cultural Organisation. Available at: https://unevoc.unesco.org/up/gtg.pdf .Accessed 12 August 2021.
UnionsACT. (2016). A Comprehensive residential energy and water efficiency retrofit program for the ACT. Available at: www.unionsact.org.au. Accessed: 4 May 2021.
Wainstein, M. E., & Bumpus, A. G. (2016). Business models as drivers of the low carbon power system transition: a multi-level perspective. Journal of Cleaner Production, 126, 572-585.
Watson, A. (2021). Designing low carbon innovation organisations: the Energy Technologies Institute experience. Environmental Innovation and Societal Transitions, 39, 173-190.
Wiedmann, T. (2017) ‘An input–output virtual laboratory in practice–survey of uptake, usage and applications of the first operational IELab’, Economic Systems Research, 29(2), pp. 296–312.
Wolff, A., Kortuem, G. (2021). Visualising energy: teaching data literacy in schools’, Sen city 2, Osaka, Sep. 2015. Available at: http://oro.open.ac.uk/43857/. Accessed: June 2021
WSAA. (2017). Workforce skills of the future. Water Services Association of Australia. Available at: https://www.wsaa.asn.au/sites/default/files/publication/download/WSAA%20Workforce%20Skills%20of%20the%20Future_0.pdf. Accessed: June 2021
E3 Opportunity Assessment: Developing the future energy workforce104

WWF Australia. (2020a). Delivering economic stimulus through renewables. Sydney. Available at: www.wwf.org.au/ArticleDocuments/843/Renewable_stimulus_programsJune2_-_Public_Policy_Paper.pdf.aspx?OverrideExpiry=Y . Accessed: 4 May 2021.
WWF Australia. (2020b). Australian renewable export COVID-19 recovery package. Sydney. Available at: www.wwf.org.au/what-we-do/climate/renewables/renewable-export-covid-19-recovery-package#gs.0nou2l. Accessed: 4 May 2021)
Young, In, S. Y., Monk, A. H., & Knox-Hayes, J. (2020). Financing energy innovation: The need for new intermediaries in clean energy. Sustainability, 12(24), 10440.
Zakharova, G. B., Krivonogov, A. I. I., Kruglikov, S. V., & Petunin, A. A. (2020). Energy-efficient technologies in the educational programs of the architectural higher education schools. Acta Polytechnica Hungarica, 17(8), 121–36. https://doi.org/10.12700/APH.17.8.2020.8.9
Zeitz Self, J., Vinayagam, R. K., Fry, J. T., North, C. (2016). Bridging the gap between user intention and model parameters for human-in-the-loop data analytics, Proceedings of the Workshop on Human-In-the-Loop Data Analytics (HILDA ’16)., New York, NY, USA, 3, 1–6. doi: https://doi-org.ezproxy.lib.monash.edu.au/10.1145/2939502.2939505.
Zhang, Y., Prouzeau, A., Khalajzadeh, H., and Goodwin, S. (2020). Toward improving building user energy awareness, in Proceedings of the Eleventh ACM International Conference on Future Energy Systems, New York, NY, USA, 539–543. doi: 10.1145/3396851.3402647.
E3 Opportunity Assessment: Developing the future energy workforce 105
9 AppendicesAppendix 1 – Stakeholders consulted 108
Appendix 2 – Selected Australian studies reporting on the clean energy sector 110
Appendix 3 – Work Package 1 and 2 survey 112
Appendix 4 – Studies included in the Work Package 2 rapid review 115
Appendix 5 – Case studies in clean energy employment monitoring and reporting 116
Appendix 6 – Literature reviewed for Work Package 1 120
Appendix 7 – Research roadmap 124
E3 Opportunity Assessment: Developing the future energy workforce106

E3 Opportunity Assessment: Developing the future energy workforce 107

Appendix 1 – Stakeholders consulted
STAKEHOLDER ROLE
AGL Energy
Arvensis
Australian Alliance for Energy Productivity (A2EP) IRG member
Australian Bureau of Statistics (ABS) IRG member
American Council for an Energy-Efficient Economy (ACEEE)
Australian Industry Group IRG member
Australian Institute of Refrigeration, Air conditioning and Heating (AIRAH) IRG member
Australian Power Institute (API) Project team
Australian Sustainable Built Environment Council (ASBEC)
Business NSW
BW Research
Cambridge Econometrics
Clean Energy Council (CEC) IRG member
Climate Council of Australia (CCA)
Climate-KIC Project team
ClimateWorks Australia
Energetics
Energy Efficiency Council (EEC) Project team
Energy Queensland
EnergyLab Project team
Facility Management Association of Australia (FMA)
Federal Government – Department of Industry, Science, Energy and Resources (DISER)
Gesellschaft für Wirtschaftliche Strukturforschung (GWS)
Green Building Council of Australia (GBCA)
Innovative Manufacturing CRC (IMCRC)
Insulation Australasia
International Energy Agency (IEA) IRG member
International Renewable Energy Agency (IRENA) IRG member
E3 Opportunity Assessment: Developing the future energy workforce108
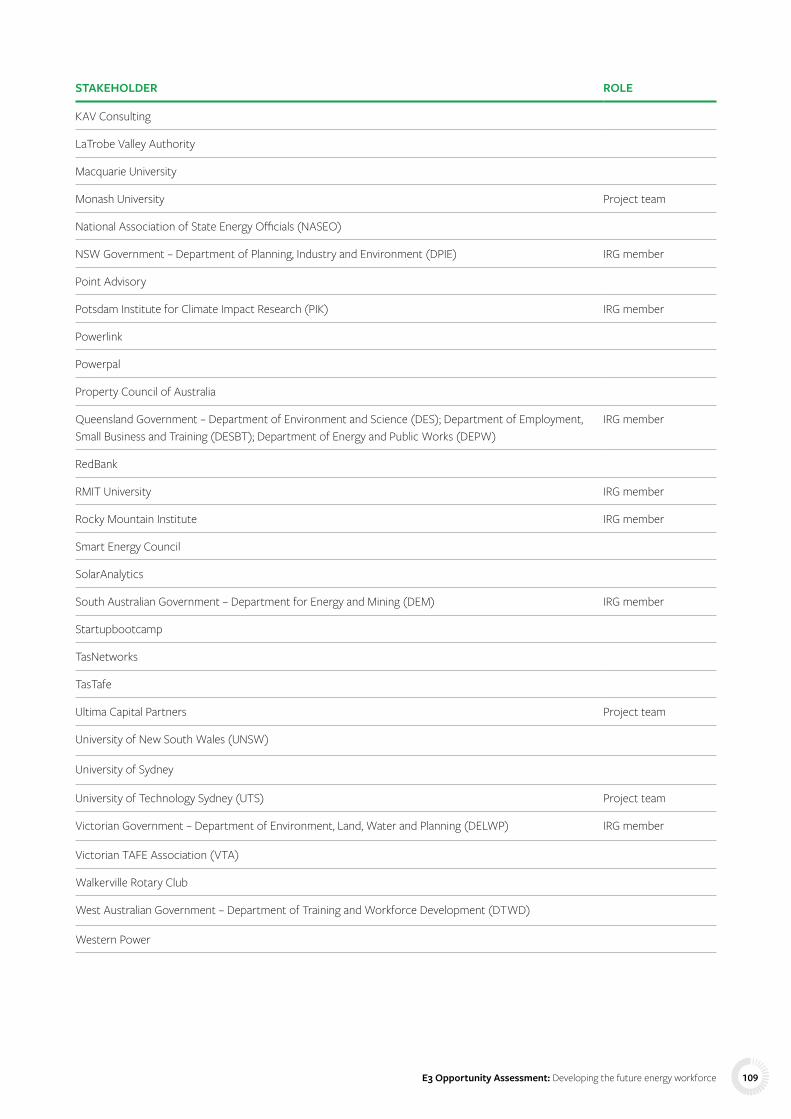
STAKEHOLDER ROLE
KAV Consulting
LaTrobe Valley Authority
Macquarie University
Monash University Project team
National Association of State Energy Officials (NASEO)
NSW Government – Department of Planning, Industry and Environment (DPIE) IRG member
Point Advisory
Potsdam Institute for Climate Impact Research (PIK) IRG member
Powerlink
Powerpal
Property Council of Australia
Queensland Government – Department of Environment and Science (DES); Department of Employment, Small Business and Training (DESBT); Department of Energy and Public Works (DEPW)
IRG member
RedBank
RMIT University IRG member
Rocky Mountain Institute IRG member
Smart Energy Council
SolarAnalytics
South Australian Government – Department for Energy and Mining (DEM) IRG member
Startupbootcamp
TasNetworks
TasTafe
Ultima Capital Partners Project team
University of New South Wales (UNSW)
University of Sydney
University of Technology Sydney (UTS) Project team
Victorian Government – Department of Environment, Land, Water and Planning (DELWP) IRG member
Victorian TAFE Association (VTA)
Walkerville Rotary Club
West Australian Government – Department of Training and Workforce Development (DTWD)
Western Power
E3 Opportunity Assessment: Developing the future energy workforce 109
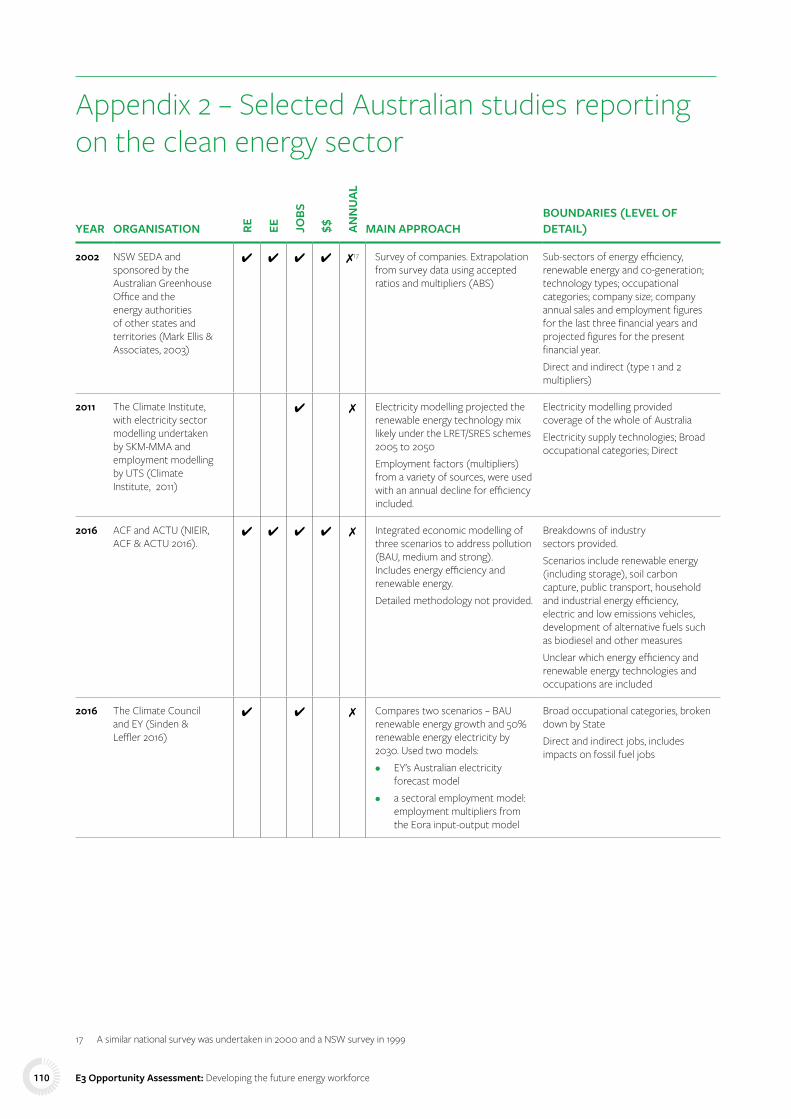
Appendix 2 – Selected Australian studies reporting on the clean energy sector
YEAR ORGANISATION RE EE JOBS
$$ ANN
UAL
MAIN APPROACHBOUNDARIES (LEVEL OF DETAIL)
2002 NSW SEDA and sponsored by the Australian Greenhouse Office and the energy authorities of other states and territories (Mark Ellis & Associates, 2003)
✔ ✔ ✔ ✔ ✗17 Survey of companies. Extrapolation from survey data using accepted ratios and multipliers (ABS)
Sub-sectors of energy efficiency, renewable energy and co-generation; technology types; occupational categories; company size; company annual sales and employment figures for the last three financial years and projected figures for the present financial year.Direct and indirect (type 1 and 2 multipliers)
2011 The Climate Institute, with electricity sector modelling undertaken by SKM-MMA and employment modelling by UTS (Climate Institute, 2011)
✔ ✗ Electricity modelling projected the renewable energy technology mix likely under the LRET/SRES schemes 2005 to 2050Employment factors (multipliers) from a variety of sources, were used with an annual decline for efficiency included.
Electricity modelling provided coverage of the whole of AustraliaElectricity supply technologies; Broad occupational categories; Direct
2016 ACF and ACTU (NIEIR, ACF & ACTU 2016).
✔ ✔ ✔ ✔ ✗ Integrated economic modelling of three scenarios to address pollution (BAU, medium and strong). Includes energy efficiency and renewable energy.Detailed methodology not provided.
Breakdowns of industry sectors provided.Scenarios include renewable energy (including storage), soil carbon capture, public transport, household and industrial energy efficiency, electric and low emissions vehicles, development of alternative fuels such as biodiesel and other measuresUnclear which energy efficiency and renewable energy technologies and occupations are included
2016 The Climate Council and EY (Sinden & Leffler 2016)
✔ ✔ ✗ Compares two scenarios – BAU renewable energy growth and 50% renewable energy electricity by 2030. Used two models:• EY’s Australian electricity
forecast model• a sectoral employment model:
employment multipliers from the Eora input-output model
Broad occupational categories, broken down by StateDirect and indirect jobs, includes impacts on fossil fuel jobs
17 A similar national survey was undertaken in 2000 and a NSW survey in 1999
E3 Opportunity Assessment: Developing the future energy workforce110

YEAR ORGANISATION RE EE JOBS
$$ ANN
UAL
MAIN APPROACHBOUNDARIES (LEVEL OF DETAIL)
2019 Green Energy Markets (2019) for the Energy Efficiency Council and the Energy Savings Industry Association
✔ ✔ ✗ Estimated current employment and potential employment if EE upgrades were undertaken.For current Australian employment:• Extrapolation of EE
employment results from the 2017 U.S. Energy and Employment Report
• Estimates using 2016 ABS Census data on employment in energy using equipment
• For upgrades two employment indicator methods:
• time per upgrade type multiplied by estimated number of upgrades
• upgrade costs and proportion of labour expenditure converted to job years
Energy efficiency within different industries and professions and sub-sectors likely to be engaged in energy efficiency activities.
2020 Australian Bureau of Statistics (ABS) (2020a)
✔ ✔ ✔18 Employment factors (FTE job-years/physical unit) multiplied by capacityEmployment numbers provided directly by the institutional unit.Publicly available capacity information
Whole of AustraliaBroad occupational categories; Direct FTE employment; 8 categories of renewable technology plus government agencies and non-profit Institutions2009–10 to 2018–19
2013 –2021
Clean Energy Council ✔ ✗ ✔ ✔ ✔ Employment numbers are calculated based on Clean Energy Council accredited installers, approved solar retailers and their project trackerIn addition, estimates are also drawn from publicly available information such as the Clean Energy Regulator In 2021 the study Briggs et al. (2020) was commissioned which provides a more detailed overview of the employment situation
Breakdown of employment in renewables by construction, operation and maintenance and solar installers
2020 Institute for Sustainable Futures, University of Technology Sydney study for Clean Energy Council (Briggs et al., 2020)
✔ ✔ X Surveys distributed to industry association members. Respondent coverage ranged from 13% to 80% for sub-sectors.Employment factors (full-time equivalent job-years/megawatt of installed capacity) derived primarily from survey data and applied to the level of installed capacity (MW) Three AEMO market scenarios used to project employment from 2020 to 2035Surveys collected data on: Workforce numbers; Typical project data; Business characteristics; Skill shortages and recruitment issues; Other skill information.
Wind, utility solar, distributed solar, batteries, hydro generation and pumped hydro. FTE employment projected from 2020 – 2035, split into manufacturing, construction, and operations and maintenance jobs. Jobs broken down by State, as well as regions vs citiesDetailed occupational breakdowns for all employment. Direct and indirect, not induced
18 2013-14 to 2018-19. This summary is for the 2018-19 publication
E3 Opportunity Assessment: Developing the future energy workforce 111

Appendix 3 – Work Package 1 and 2 survey The survey was preceded by an ethics statement, including an assurance of anonymity for respondents and contact details for the UTS ethics department and the research directors responsible for the survey.
Q1 What is the most important information you would like to be collected from a survey of
the clean energy workforce?
E.g. energy efficiency jobs versus renewable energy jobs, clean energy jobs numbers versus fossil fuel jobs numbers, diversity metrics, jurisdictional breakdown, breakdown of job types, skills and training of the clean energy workforce, etc.
Q2 Would you prefer to see a survey/ projection for the Clean Energy Sector only, or for the
Energy Sector as a whole? (Please give reasons below)
• Clean energy sector only
• Energy sector as a whole
Q3 We will be assessing alternative methodologies to measure the clean energy
workforce. There may be trade-offs in the survey’s outcomes based on the choice of methodology.
Please rate the importance of the following potential survey characteristics as: not important, somewhat important, important, very important, or vital.
• Completeness of coverage (e.g. all energy sectors, all parts of supply chain)
• Overall number of jobs by sector
• Breakdown of jobs by occupation
• Breakdown of jobs by state/Local Government Area
• Breakdown of jobs by diversity metrics
• Ability to be repeated annually/ biennially
• Cost of survey
• Ability to project future workforce from energy scenarios
• Ability to project future market size (value) from energy scenarios
Q4 Thinking about projecting the size and makeup of the workforce, what
time horizon are you interested in (pick the most important)?
• Next twelve months
• Next 2 years
• Next 5 years
• Next 10 years
• To 2050
Q5 Sectors to include: Please rate the importance of including the following
sectors in the survey, calculations, and projections, as not at all important, slightly important, moderately important, very important, or extremely important.
• Energy management & demand management including asset, building or facilities management, software and systems, & paid and unpaid demand response
• Energy efficiency Including auditing and measurement, automation, energy upgrades/ retrofits, and low energy building construction
• Cross-cutting services Including finance, consultancy, regulation, planning, advocacy, research
• Renewable power generation and renewable heat
• Electricity transmission and distribution
• Fuels/ fuel switching Including biofuels, and Hydrogen
• Transport Including electric and hybrid vehicles, electrification of buses/ rail, mode shifting (e.g. buses, trains, car share etc.)
Q6 Please identify anything additional we should include, and anything which you
think should not be included. Any other areas that you would like to see included? Are there things we’ve included that you think should be excluded?
Q7 Studies into energy jobs and skills have found shortages of particular technical skills
that could delay Australia’s energy transition. Some of these shortages are for:
• grid engineers
• construction managers for wind and large-scale solar projects
• blade and turbine technicians
• energy data analysts / energy data scientists
• electricians certified to install solar (particularly in rural areas)
Considering the Australian market, are there other technical skills / skilled jobs currently, or anticipated to be, in short supply, that could slow down the energy transition (you can name more than one)?
E3 Opportunity Assessment: Developing the future energy workforce112

Q8 In the next five (5) years do you foresee the shortages in these technical skills / roles to:
• Improve
• Stay the same
• Worsen
• Unsure
Please explain your answer (optional)
Q9 We have completed a comprehensive literature review to answer the question:
‘What are the skills, and skilled professionals, required by 2030 to deliver a clean energy transition to net zero by 2050?’ We found:
“Of the skills identified as being required for clean energy transitions, most related to the complexities of raising awareness, communicating and convening dialogue across a range of sectors and disciplines, and fostering the shared vision and commitment between these diverse actors”. These cross-cutting / soft skills were more frequently reported as being needed to achieve clean energy transitions than technical and practical skills.”
Examples of some of the key cross-cutting / soft skills identified in the literature review are:
• process management
• networking
• collaboration
• retail skills – customer focus, marketing
• communication
• project management
• people management
Rate your level of agreement that cross-cutting / soft skills such as these are critical to enable Australia’s energy transition:
1. Strongly disagree2. Disagree3. Neither agree nor disagree4. Agree5. Strongly agree
Please explain your answer (optional)
Q10 Rank in order of priority who should possess these cross-cutting / soft skills:
• Policy makers
• Capital allocators (e.g. investors, financiers, developers etc.)
• Designers and planners (e.g. architects, system designers, strategy managers, consulting engineers etc.)
• Technical specialists (e.g. installation, operations & maintenance, verification etc.)
• Trusted advisers (e.g. legal & financial advisers, real estate brokers, media etc.)
• Consumers / citizens
Q11 Rate your level of agreement that the appropriate people currently have
these required skills:
1. Strongly disagree2. Disagree3. Neither agree nor disagree4. Agree5. Strongly agree
Please explain your answer (optional)
Q12 Rate what are the best ways to teach or develop these cross-cutting / soft skills:
Integrate them into vocational and technical training programs (e.g. TAFE courses)
1. Strongly disagree2. Disagree3. Neither agree nor disagree4. Agree5. Strongly agree
Integrate them into architecture, construction and engineering (ACE) degrees at universities
1. Strongly disagree2. Disagree3. Neither agree nor disagree4. Agree5. Strongly agree
Integrate them into existing industry certifications offered by industries bodies (e.g. Australian Power Institute, Clean Energy Council, Energy Efficiency Council, Green Building Council, etc.)
1. Strongly disagree2. Disagree3. Neither agree nor disagree4. Agree5. Strongly agree
Develop stand-alone open or in-company short courses that support continuing professional development (CPD)
1. Strongly disagree2. Disagree3. Neither agree nor disagree4. Agree5. Strongly agree
Please explain your answer (optional)
E3 Opportunity Assessment: Developing the future energy workforce 113
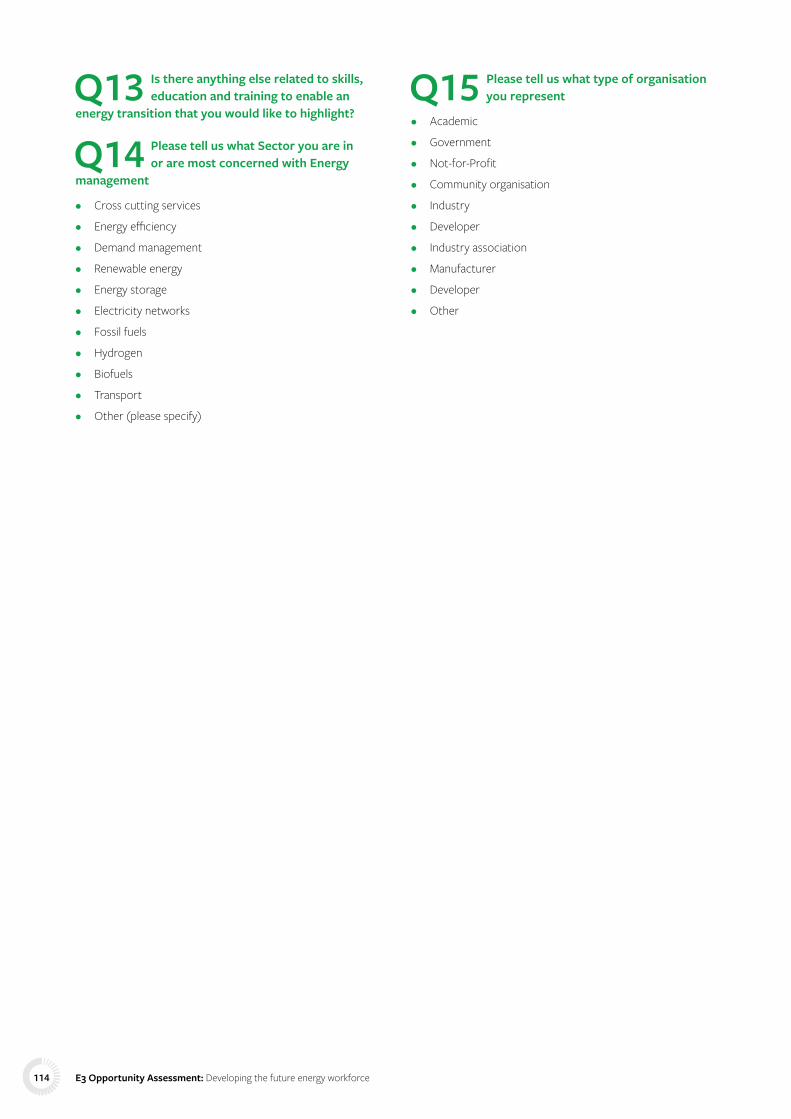
Q13 Is there anything else related to skills, education and training to enable an
energy transition that you would like to highlight?
Q14 Please tell us what Sector you are in or are most concerned with Energy
management
• Cross cutting services
• Energy efficiency
• Demand management
• Renewable energy
• Energy storage
• Electricity networks
• Fossil fuels
• Hydrogen
• Biofuels
• Transport
• Other (please specify)
Q15 Please tell us what type of organisation you represent
• Academic
• Government
• Not-for-Profit
• Community organisation
• Industry
• Developer
• Industry association
• Manufacturer
• Developer
• Other
E3 Opportunity Assessment: Developing the future energy workforce114
Appendix 4 – Studies included in the Work Package 2 rapid reviewThe rapid review was undertaken in conjunction with the Monash Sustainable Development Institute Evidence Review Service by Peter Bragge, Loyal Pattuwage, Farsaneh Mahmoudi and Dirk Visser in April 2021, and addressed the question: What are the skills required by 2030 to deliver a clean energy transition to net zero by 2050?
Reviewsdo Prado, J. C., et al. (2019). “The Next-Generation Retail Electricity Market in the Context of Distributed Energy Resources: Vision and Integrating Framework.” Energies 12(3): 24.
Häkkinen, T., et al. (2019). “Drivers and benefits for district-scale energy refurbishment.” Cities 94: 80-95.
Lazoroska, D. and J. Palm (2019). “Dialogue with property owners and property developers as a tool for sustainable transformation: A literature review.” Journal of Cleaner Production 233: 328-339.
Meijer, L. L. J., et al. (2019). “Barriers and drivers for technology commercialization by SMEs in the Dutch sustainable energy sector.” Renewable & Sustainable Energy Reviews 112: 114-126.
Ram, M., et al. (2020). “Job creation during the global energy transition towards 100% renewable power system by 2050.” Technological Forecasting and Social Change 151: 119682.
Rokicki, T., et al. (2020). “The Importance of Higher Education in the EU Countries in Achieving the Objectives of the Circular Economy in the Energy Sector.” Energies 13(17): 17.
Ruiz-Rivas, U., et al. (2020). “Energy engineering curricula for sustainable development, considering underserved areas.” Journal of Cleaner Production 258: 12.
Primary studiesBevan, W., et al. (2020). “Skills required to deliver energy efficient school retrofit buildings.” Engineering Construction and Architectural Management 27(10): 3051-3073.
Comodi, G., et al. (2019). “Analysis of labour market needs for engineers with enhanced knowledge in renewable energy in some European and Latin-American Countries.” Energy Procedia 158: 1135-1140.
Eltom, A., et al. (2018). “Smart Distribution Course for 21st Century Power Sector Workforce.” Ieee Transactions on Power Systems 33(5): 5639-5647.
Garcia, D. A., et al. (2021). “Developing and testing a new tool to foster wind energy sector industrial skills.” Journal of Cleaner Production 282: 13.
Neto, M. R. B., et al. (2019). “Implementation and Evaluation of the First Renewable Energy Systems Technical Course in Brazil.” Ieee Access 7: 46538-46549.
Sullivan, M., et al. (2020). “An overview of the Department of Energy’s CarbonSAFE Initiative: Moving CCUS toward commercialization.” Aiche Journal 66(4): 9.
Umar, T., et al. (2020). “Challenges towards renewable energy: an exploratory study from the Arabian Gulf region.” Proceedings of the Institution of Civil Engineers-Energy 173(2): 68-80.
Zakharova, G. B., et al. (2020). “Energy-Efficient Technologies in the Educational Programs of the Architectural Higher Education Schools.” Acta Polytechnica Hungarica 17(8): 121-136.
E3 Opportunity Assessment: Developing the future energy workforce 115
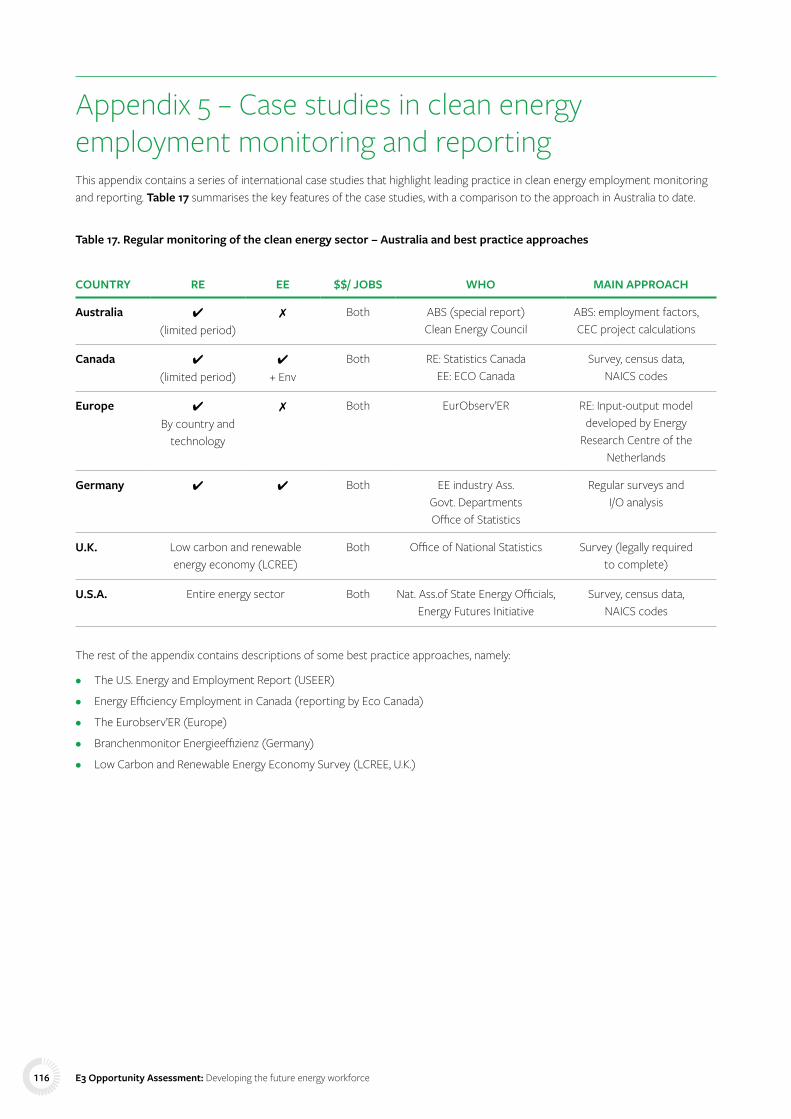
Appendix 5 – Case studies in clean energy employment monitoring and reportingThis appendix contains a series of international case studies that highlight leading practice in clean energy employment monitoring and reporting. Table 17 summarises the key features of the case studies, with a comparison to the approach in Australia to date.
Table 17. Regular monitoring of the clean energy sector – Australia and best practice approaches
COUNTRY RE EE $$/ JOBS WHO MAIN APPROACH
Australia ✔ (limited period)
✗ Both ABS (special report) Clean Energy Council
ABS: employment factors, CEC project calculations
Canada ✔ (limited period)
✔ + Env
Both RE: Statistics Canada EE: ECO Canada
Survey, census data, NAICS codes
Europe ✔ By country and
technology
✗ Both EurObserv’ER RE: Input-output model developed by Energy
Research Centre of the Netherlands
Germany ✔ ✔ Both EE industry Ass. Govt. Departments Office of Statistics
Regular surveys and I/O analysis
U.K. Low carbon and renewable energy economy (LCREE)
Both Office of National Statistics Survey (legally required to complete)
U.S.A. Entire energy sector Both Nat. Ass.of State Energy Officials, Energy Futures Initiative
Survey, census data, NAICS codes
The rest of the appendix contains descriptions of some best practice approaches, namely:
• The U.S. Energy and Employment Report (USEER)
• Energy Efficiency Employment in Canada (reporting by Eco Canada)
• The Eurobserv’ER (Europe)
• Branchenmonitor Energieeffizienz (Germany)
• Low Carbon and Renewable Energy Economy Survey (LCREE, U.K.)
E3 Opportunity Assessment: Developing the future energy workforce116
CASE STUDY: The U.S. Energy and Employment Report The U.S. Energy and Employment Report (USEER) has been produced annually since 2016. It is prepared by the National Association of State Energy Officials and Energy Futures Initiative in a research partnership with BW Research Partnership and it is supported by 22 states, organisations and foundations.
Coverage
The report (NASEO & EFI, 2020) provides nationwide coverage of the entire energy sector broken down into five sectors (fuels, electric power, transmission, distribution and storage, energy efficiency and motor vehicles and component parts). These sectors are further broken down into 53 separate technologies, with up to seven industrial classifications within these technologies.
The USEER database can provide detailed data on multiple aspects of the sectors at a granular level as well as detailed year-to-year comparisons. The USEER covers:
• Employment numbers in total, by the five sectors, and broken down by activity and type within each sector
• Hiring expectations for the next 12 months
• Hiring difficulty by technology and industrial classification
• High demand jobs and skills gaps
• Workforce demographics
• Geographic location of each technology including state by state breakdowns.
The USEER includes direct employment only, not indirect or induced employment.
Purpose
The report is used by decision-makers including states, trade associations, labour unions and other stakeholders to track changes in the sector and inform planning and policy-making. It is regarded as the gold standard for energy sector employment reporting.
Methodological approach
The USEER is based on an annual survey returned by approximately 25,000 companies, which is scaled up using Department of Energy data, and census data for employment and wages. The report and methodology are peer reviewed. The 2019 USEER survey was administered by phone (140,000 calls), email (47,000) and letter (49,000).
Outputs
A comprehensive report including detailed breakdowns and analysis, summary infographics and case studies. The report is supported by the USEER database which can provide more detailed breakdowns.
CASE STUDY: Energy Efficiency Employment In Canada A 2020 report by the Environmental Careers Organisation of Canada (ECO Canada) funded by Natural Resources Canada and the Government of Canada’s Sectoral Initiatives Program, in partnership with BW Research Partnership, is the first study of its kind in Canada to provide a statistical analysis of direct and permanent energy efficiency employment within six key industries (ECO Canada, 2019).
Coverage
National coverage of direct employment in: Construction, Manufacturing, Wholesale, Trade, Professional and Business Services, Utilities, Other Services. Energy efficiency is defined as “the production or installation of energy-saving products and/or provision of services that reduce end-use energy consumption.”
The study does not include indirect or induced employment. The study also covers employment income and industry revenues.
Purpose
The study target audience is policy makers in government, industry, education and other relevant fields. It aims to raise the profile of energy efficiency jobs and help create a future talent pool.
Methodological approach
This study uses the same methodology as the USEER. It is based on national databases on employment (Statistics Canada, 2017 data) and a survey of a representative sample of 1,853 business establishments across Canada, of which 628 were directly involved in the supply of energy efficiency goods and services.
Outputs
A report providing summary infographics, data tables, summary findings and findings by industry sector.
E3 Opportunity Assessment: Developing the future energy workforce 117
CASE STUDY: Eurobserv’er Report – The State Of Renewable Energies In EuropeThe EurObserv’ER barometer has been measuring the state of the renewable energy sector in each member State of the European Union since 1998. EurObserv’ER produces indicators covering energy, technology and economic dimensions. It publishes a barometer on a specific renewable energy sector every two months in addition to an annual overview covering all renewables. The 2019 edition is the 19th edition of the Annual Overview Barometer (EurObserv’ER, 2019). Funded by the European Commission, it is produced by a consortium of Observ’ER (FR) (the coordinator), TNO Energy Transition (NL), RENAC (DE), Frankfurt School of Finance and Management (DE), Fraunhofer ISI (DE) and Statistics Netherlands (NL).
Coverage
The annual report covers twelve renewable energy sectors developed at an industrial scale within the European Union: wind energy, solar photovoltaic, solar thermal, CSP, biofuel, ocean energies, solid biomass, hydropower, geothermal energy, heat pumps, biogas and renewable municipal waste.
It covers a range of indicators for each sector: energy (capacity, generation); socio-economic (employment, turnover); investment (investment in renewable energy capacity, investment in renewable energy technology); renewable energy costs; reference prices and cost competitiveness; avoided fossil fuel use and resulting avoided costs; innovation and competitiveness (R&D investments, patent filings); international trade; and flexibility of the electricity system.
Employment data includes both direct and indirect jobs, but not induced employment. Direct employment includes: renewable equipment manufacturing, renewable plant construction, engineering and management, operation and maintenance, biomass supply and exploitation, while indirect employment includes secondary activities such as transport
and other services. Upstream activities in the bioenergy sector are included. It also includes direct employment impacts on the fossil fuel sector. Energy efficiency, electric mobility and energy storage are not included. Jobs are expressed in full-time equivalents (FTE) and employment refers to gross employment.
Purpose
The barometers: provide monitoring and analysis of renewable energy in the EU; compare progress to EU Commission objectives; share results in journals and with energy sector stakeholders; provide an open-source resource.
Methodological approach
For the socio-economic indicators, the report uses a model developed by the Energy Research Centre of the Netherlands (ECN) (currently TNO Energy Transition), to assess employment and turnover based on evaluation of the economic activity of each sector covered. The analysis covers monetary flows from four activities: new installations, operation and maintenance, production and trade of RE equipment, production and trade of biomass feedstock.
I/O tables are used for each EU member state with underlying data from Eurostat, JRC and EurObserv’ER. The EurObserv’ER data has been reconciled with the Eurostat online database and the specific Renewable Energy Directive indicator data supplied by the Eurostat SHARES tool (Short Assessment of Renewable Energy Sources)
Outputs
The annual report is a comprehensive analysis of the state of the renewable energy sector in the EU – a 153-page report with breakdowns by sector and indicator with commentary, analysis and methodological notes.
CASE STUDY: Low Carbon and Renewable Energy Economy (LCREE) Survey The Low Carbon and Renewable Energy Economy Survey (LCREE) is an annual survey undertaken by the U.K. Office of National Statistics covering the whole of the U.K. low carbon and renewable energy sector (ONS U.K. 2021). It was first produced in 2015. Between 2010 and 2013 the BEIS Low Carbon Report provided data on low carbon activity in the U.K. but it is not directly comparable to the LCREE survey. The BEIS report used a combination of a small survey and existing data and it included the supply chain, which the LCREE Survey excludes. Businesses included in the survey are legally required to complete it.
Coverage
The LCREE covers 17 sectors including: low carbon electricity (onshore and offshore wind, solar PV, hydropower, other renewable electricity, nuclear power and CCS), low carbon heat (renewable heat and CHP ), energy from waste and biomass (bioenergy, alternative fuels), energy efficient products (lighting, products, energy monitoring saving or control systems), low carbon services (low carbon financial and advisory services), low emission vehicles and infrastructure (low emission vehicles and infrastructure, fuel cells and energy storage). It covers all sector activity, including design, installation and maintenance in addition to the production of electricity. The survey captures direct activity only, not indirect.
E3 Opportunity Assessment: Developing the future energy workforce118

Data includes estimates at the U.K. and U.K. country level of turnover, number of businesses, imports, exports, employment (in FTE) and capital investment. It covers the calendar year and is published approximately 12 months after the reference period.
The survey targets a population of 44 two-digit Standard Industrial Classifications (SICs)
Purpose
LCREE is the primary source of official information on LCREE activity in the U.K. and is used within and beyond the U.K. to inform policy at multiple levels, including at the devolved government level in Scotland and Wales. It informs policies on job creation, trade and investment within the LCREE economy.
Methodological approach
A paper questionnaire is sent to a sample of approximately 24,000 U.K. businesses, selected using the Inter-Departmental Business Register (IDBR) as the sampling frame. It is a random sample stratified by industry, employment size and U.K. country. The response rate is consistently above 80%. Data is then estimated based on survey returns. Estimates are given for the accuracy of data provided and at the disaggregated level of country and sector, accuracy levels can be low.
Outputs
The main output is the annual Low carbon and renewable energy economy, U.K. statistical bulletin. It provides summary, grouped and detailed data by U.K. devolved nation, as well as by sector, industry, businesses with 250 or more employees, and comparisons over time.
CASE STUDY 5: GermanyBranchenmonitor Energieeffizienz is an annual study that covers developments in the German energy efficiency sector. The study is conducted by Deutsche Unternehmensinitative Energieeffizienz e.V. (DENEFF), which is the sector’s largest member-based organisation. The first report was produced in 2013 and the most recent report available online is from 2017. Reports for 2018 and 2019 are not available. Since 2017 DENEFF has published bi-annual magazines focusing on Energiewende and the impacts of COVID-19. The reports provide a state of the EE sector and are based on regular surveys of energy efficiency companies. Deutsche Unternehmensinitative Energieeffizienz report on market trends, products and commercialisation, energy demand and supply, market size/revenue, political frameworks and the EE workforce and availabilities of skilled labour.
Coverage
The reports cover energy management and consulting, products/ services in construction/ building sector, energy services, controlling devices and services, manufacturing, financial services, building management and electronic devices.
Purpose
Reports provide a qualitative and quantitative overview of the market for energy efficiency services and products in Germany,
and analyse market trends, success factors and challenges. Reports are aimed at energy efficiency companies, policy makers and the media. More recent reports have increased the focus on EE policies and the impact federal policies have on the sector, including regulatory and economic barriers (Deutsche Unternehmensinitative Energieeffizienz, 2017).
Methodological approach
For the annual report, DENEFF disseminated a large-scale questionnaire among of EE companies. In 2017. 159 large businesses participated in the 20-minute survey. The focus of the survey is modified from year to year to ensure emerging developments in the energy policy and the economy are covered, e.g. the 2019 report contained questions related to Brexit (Deutsche Unternehmensinitative Energieeffizienz, 2019). The survey is analysed by a third party, the consultancy company PricewaterhouseCoopers (PwC).
Outputs
The main output is the Branchenmonitor Energieeffizienz annual report. The 2017 report incorporated 40 pages, and provides a timely synthesis of the EE sector and its developments at the domestic, European and international level.
E3 Opportunity Assessment: Developing the future energy workforce 119
Appendix 6 – Literature reviewed for Work Package 1AlphaBeta Australia (2020) ‘Clean Jobs Plan’, pp. 1–68. Available at: https://www.climatecouncil.org.au/wp-content/uploads/2020/07/Climate-Council_AlphaBeta-Clean-Jobs-Plan-200720.pdf.
American Council for an Energy-Efficient Economy (ACEEE) (2011) ‘How Does Energy Efficiency Create Jobs? Fact Sheet’, pp. 1–2. Available at: http://aceee.org/files/pdf/fact-sheet/ee-job-creation.pdf.
American Council for an Energy-Efficient Economy (ACEEE) (2019) ‘ACEEE State Policy Toolkit : Guidance on Measuring the Economic Development Benefits of Energy Efficiency Introduction’, pp. 1–20. Available at: https://www.aceee.org/topic-brief/economic-development-state-ee-toolkit.
American Council for an Energy-Efficient Economy (ACEEE) (no date) ‘Fact Sheet: A Brief Methodology of the DEEPER Modeling System’. Available at: www.aceee.org.
Australian Bureau of Statistics (2020) Australian National Accounts: Input-Output Tables. Canberra. Available at: https://www.abs.gov.au/statistics/economy/national-accounts/australian-national-accounts-input-output-tables/latest-release#input-output-multipliers.
Australian Bureau of Statistics (2020) Employment in Renewable Energy Activities, Australia. Available at: https://www.abs.gov.au/statistics/labour/employment-and-unemployment/employment-renewable-energy-activities-australia/latest-release.
Australian Conservation Foundation and Australian Council of Trade Unions (2016) Jobs in a clean energy future.
Blazejczak, J. et al. (2019) Ökonomische Indikatoren von Maßnahmen zur Steigerung der Energieeffizienz Investitionen, Umsätze und Beschäftigung in ausgewählten Bereichen. Berlin.
Blazejczak, J., Edler, D. and Gornig, M. (2020) Economic indicators of energy efficiency measures – update 2020. Berlin. Available at: https://www.umweltbundesamt.de/sites/default/files/medien/479/publikationen/uib_03-2020_oekonomische_indikatoren_energieeffizienz_aktualisierung_2020.pdf.
Branchenmonitor Energieeffizienz 2017.ECO Canada (2019) Energy Efficiency Employment in Canada. In collaboration with BW Research. Available at: https://www.eco.ca/blog/energy-efficiency-employment/.
Breitschopf, B., Nathani, C. and Resch, G. (2012) ‘Economic and Industrial Development’ EID-EMPLOY Methodological guidelines for estimating the employment impacts of using renewable energies for electricity generation. Karlsruhe. Available at: http://publica.fraunhofer.de/documents/N-236318.html (Accessed: 22 January 2021).
Çetin, M. and Eĝrican, N. (2011) ‘Employment impacts of solar energy in Turkey’, Energy Policy, 39(11), pp. 7184–7190..
Clean Energy Council (2020) Clean Energy Australia Report 2020. Available at: https://assets.cleanenergycouncil.org.au/documents/resources/reports/clean-energy-australia/clean-energy-australia-report-2020.pdf.
Clean Energy Council (2021) Clean Energy Australia Report 2021. Available at: http://www.cleanenergycouncil.org.au/policy-advocacy/reports.html.
Climate Institute (2011) ‘Clean energy jobs in regional Australia. Methodology’.
Climate Institute (2011) Clean Energy Jobs Snapshot.
Costantini, V., Crespi, F. and Paglialunga, E. (2018) ‘The employment impact of private and public actions for energy efficiency: Evidence from European industries’, Energy Policy. Elsevier Ltd, 119, pp. 250–267
Czako, V. (2020) Employment in the Energy Sector Status Report 2020. European Commission.
DENEFF & PWC (2017) Branchenmonitor Energieeffizienz.
Eco Canada (2019) Energy Efficiency Employment in Canada.
Ehrhardt-martinez, K. and Laitner, J.A. (2008) The Size of the U.S. Energy Efficiency Market: Generating a More Complete Picture. American Council for an Energy-Efficient Economy.
Ellis, M. and Associates, & (2003) Economic Performance and Contribution of the Sustainable Energy Industry 2002.
Energy UK (2020) Energy in the UK 2020.
E3 Opportunity Assessment: Developing the future energy workforce120
Esser, A. et al. (2019) Comprehensive study of building energy renovation activities and the uptake of nearly zero-energy buildings in the EU Final report. Available at: https://ec.europa.eu/energy/sites/ener/files/documents/1.final_report.pdf.
EurObserv’ER (2019) The State of Renewable Energies in Europe, 19th EurObserv’ER Report. Available at: https://www.isi.fraunhofer.de/content/dam/isi/dokumente/ccx/2020/The-state-of-renewable-energies-in-Europe-2019.pdf.
Garrett-Peltier, H. (2017) ‘Green versus brown: Comparing the employment impacts of energy efficiency, renewable energy, and fossil fuels using an input-output model’, Economic Modelling, 61(March 2016), pp. 439–447.
Gomez, M. et al. (2019) Future skills and job creation with renewable energy in Turkey. Assessing the co-benefits of decarbonising the power sector.
Grafakos, S. et al. (2020) ‘Employment Assessment of Renewable Energy: Power Sector Pathways Compatible with NDCs and National Energy Plans’, (May), pp. 1–100.
Green Energy Markets (2019) Energy efficiency employment in Australia – an analysis of the current and potential jobs created by saving energy in Australia. Available at: https://assets.eecca.org.au/library/ESIA-Reports/EEC-Jobs-Report-FINAL-2019-02-01.pdf
Greenpeace New Zealand. (2013) The Future is Here New Jobs, New Prosperity and a New Clean Economy.
Henner, N. (2020) ‘Energy Efficiency Program Financing: Size of the Markets’, ACEEE Topic Brief, (November).
Hondo, H. and Moriizumi, Y. (2017) ‘Employment creation potential of renewable power generation technologies: A life cycle approach’, Renewable and Sustainable Energy Reviews. Elsevier Ltd, 79(May), pp. 128–136.
International Energy Agency (2014) Capturing the Multiple Benefits of Energy Efficiency. Paris, France.
International Energy Agency (2020) ‘Employment analysis methodology’, in World Energy Outlook 2020, pp. 129–136.
International Energy Agency (2020) Energy Efficiency 2020. Paris, France.
International Energy Agency (2020) Measuring and tracking employment related to building efficiency in the EU. Paris, France.
International Energy Agency (2020) Sustainable Recovery: World Energy Outlook Special Report., World Energy Outlook. Paris, France.
IRENA (2019) Renewable Energy Market Analysis: Southeast Asia, Irena. Available at: https://www.irena.org/publications/2019/Jan/Renewable-Energy-Market-Analysis-GCC-2019.
IRENA (2020) Measuring the socio-economics of transition: Focus on jobs, International Renewable Energy Agency, Abu Dhabi.
Jung, Y. M. (2015) ‘Is South Korea’s green job policy sustainable?’, Sustainability (Switzerland), 7(7), pp. 8748–8767.
Kholodilin, K., Mense, A. and Michelsen, C. (2016) ‘Marktwert der Energieeffizienz: Deutliche Unterschiede zwischen Miet- und Eigentumswohnungen’, DIW-Wochenbericht, 83(28), pp. 605–613.
Kuriyama, A. and Abe, N. (2021) ‘Decarbonisation of the power sector to engender a “Just transition” in Japan: Quantifying local employment impacts’, Renewable and Sustainable Energy Reviews. Elsevier Ltd, 137(November 2020), p. 110610.
Lenzen, M. et al. (2017) ‘New multi-regional input–output databases for Australia – enabling timely and flexible regional analysis’, Economic Systems Research, 29(2), pp. 275–295.
Matsubara, H. (2018) ‘Renewable Energy Policies and the Energy Transition in Japan’, (September), p. 48. Available at: https://library.fes.de/pdf-files/id/14694.pdf.
Mirasgedis, S. et al. (2014) ‘A methodological framework for assessing the employment effects associated with energy efficiency interventions in buildings’, Energy and Buildings. Elsevier Ltd, 82, pp. 275–286.
Moriizumi, Y., Hondo, H. and Nakano, S. (2017) ‘Renewable Energy and Employment Potential: A Comparative Analysis Based on an Input-Output Model’, Journal of the Japan Institute of Energy, 96(1), pp. 16–27.
Muro, M., Rothwell, J. and Saha, D. (2011) Sizing the Clean Economy: a national and regional green jobs assessment. Brookings. Available at: https://www.brookings.edu/research/sizing-the-clean-economy-a-national-and-regional-green-jobs-assessment/ (Accessed: 3 February 2021).
Nagatomo, Y. et al. (2021) ‘Impacts of employment in power generation on renewable-based energy systems in Japan— Analysis using an energy system model’, Energy. Elsevier Ltd, 226, p. 120350.
NASEO & EFI (2019) U.S. Energy and Employment Report.
NASEO & EFI (2020) U.S. Energy and Employment Report.
E3 Opportunity Assessment: Developing the future energy workforce 121
Natural Resources Canada (2021) Energy Fact Book 2020-2021. Available at: https://www.nrcan.gc.ca/sites/nrcan/files/energy/energy_fact/energy-factbook-2020-2021-English.pdf.
Office for National Statistics (2021) Low Carbon and Renewable Energy Economy ( LCREE ) Survey QMI Quality and Methodology Information for the Low Carbon and Renewable Energy. London, U.K.. Available at: https://www.ons.gov.uk/economy/environmentalaccounts/methodologies/lowcarbonandrenewableenergyeconomylcreesurveyqmi.
Pollitt, H. et al. (2015) ‘Macroeconomic analysis of the employment impacts of future EU climate policies’, Climate Policy. Taylor & Francis, 15(5), pp. 604–625.
Quitzow, R., Libo, W. and Jacob, K. (2013) Green Jobs in Asia: Achievements, Strategies and Potentials.
Ram, M., Aghahosseini, A. and Breyer, C. (2020) ‘Job creation during the global energy transition towards 100% renewable power system by 2050’, Technological Forecasting and Social Change. Elsevier, 151(July 2019), p. 119682.
Raupach-Sumiya, J. et al. (2015) ‘Regional economic effects of renewable energies – comparing Germany and Japan’, Energy, Sustainability and Society, 5(1), pp. 1–17.
Rothwell, J. et al. (2011) ‘Methodological Appendix for Sizing the Clean Economy: a national and regional green jobs assessment.’, (July), p. 68. Available at: http://scholar.google.com/scholar?hl=en&btnG=Search&q=intitle:SIZING+THE+CLEAN+ECONOMY#2%5Cnhttp://scholar.google.com/scholar?hl=en&btnG=Search&q=intitle:Sizing+the+Clean+Economy%232.
Sinden, G. and Leffler, Z. (2016) Renewable Energy Jobs: Future Growth in Australia. Available at: https://www.climatecouncil.org.au/uploads/7b40d7bbefbdd94979ce4de2fad52414.pdf.
Statistics Canada (no date) Table 36-10-0366-01, Environmental and Clean Technology Products Economic Account. Available at: https://doi.org/10.25318/3610036601-eng.
UK Energy Research Centre (2014) Low carbon jobs: the evidence for net job creation from policy support for energy efficiency and renewable energy.
Ulrich, P. and Lehr, U. (2020) ‘Economic effects of an E-mobility scenario–input structure and energy consumption’, Economic Systems Research. Routledge, 32(1), pp. 84–97. doi: 10.1080/09535314.2019.1619522.
Ulrich, P., Distelkamp, M. and Lehr, U. (2012) ‘Employment effects of renewable energy expansion on a regional level-first results of a model-based approach for Germany’, Sustainability, 4(2), pp. 227–243.
Wiedmann, T. (2017) ‘An input–output virtual laboratory in practice – survey of uptake, usage and applications of the first operational IELab’, Economic Systems Research, 29(2), pp. 296–312.
E3 Opportunity Assessment: Developing the future energy workforce122

E3 Opportunity Assessment: Developing the future energy workforce 123

Appendix 7 – Research roadmapImpact statement Given the interconnected nature of this research roadmap, many of these projects feed into each other to deliver impact across the Australian economy. The research roadmap project outputs and outcomes feed into each other and can be leveraged to create meaningful change to support the nation’s transition to a clean energy system. The projects described will contribute to a changing landscape and help create new jobs and businesses whilst also reducing energy bills and emissions. Broadly, this suite of projects is key to enabling:
• Enhanced energy sector productivity by helping to create an appropriately skilled and informed workforce, both within and outside of the energy sector;
• Detailed energy sector and sub-sector workforce and market-size modelling that can be used to demonstrate the impacts of government policies and programs;
• Granular data and information that will support energy workforce planning that will:
– Ensure that the energy transition can proceed in a smooth and efficient manner, without delays caused by skill shortages; and
– Enable Australia, states and territories to maximise onshore, regional, and local employment and value from the energy transition;
• Development and improvement of priority course content for tertiary and vocational offerings, addressing the generic technical and specialist skills for the future occupations in the energy industry and more broadly;
• Enhanced continuing professional development (CPD) pathways for existing energy professionals;
• Improved ability to leverage innovation to support the overall transformational change required to transition the energy sector; and
• Development of targeted policies and programs that leverage energy management as a tool for lowering energy costs and emissions.
E3 Opportunity Assessment: Developing the future energy workforce124

FIN
DIN
G
PROPOSED PROJECT TITLE PR
OJE
CT ID
POTENTIAL INDUSTRY PARTNERS
PROJECT ACTIVITIES THEME & PROJECT LEVEL (3, 5 & 10 YEAR)
OUTPUTS: THEME & PROJECT LEVEL (3, 5, & 10 YEAR)
INPUTS/ BUDGET (3, 5, 10 YEAR)
OUTCOMES: THEME & PROJECT LEVEL (3–14 YEAR)
1.1 Australian Energy Employment Report (AEER)
1 UTS ISF, government, industry associations (AEC, API, CEC, EEC, ENA, EVC)
Develop and conduct the first energy sector survey, based on US EER and Australian pilot. October 2021–March 2022: develop and test sectoral elementsMarch 2022–December 2022: deliver first survey
December 2022: survey results will help to establish baseline information on size of energy sector.
Standard trackApprox. budget $3–3.5m
Ability to plan policy and programs to support and manage Australia’s energy transition.Delivers RACE milestones E2.2c, E2.3b, E3.3b
1.1 Australian Energy Employment Report (AEER)
2 UTS ISF, government, industry associations (AEC, API, CEC, EEC, ENA, EVC)
Develop and conduct the second energy sector survey, with coverage expanded to transport sector (depending on outcome of consultation). October 2023 – March 2024: develop and test transport elements March 2024 – December 2024: deliver second survey
December 2024: Second survey results will help to consolidate baseline information on size of clean energy sector.Inclusion of second sub-sector for detailed questions alongside the survey.
Standard trackApprox. budget $3–3.5m
Ability to plan policy and programs to support and manage Australia’s energy transition.Delivers RACE for 2030 milestones E2.2c, E2.3b, E3.3b
1.2 Tracking the energy management workforce: design for inclusion
3 UTS, government, industry associations (A2EP, AIRAH, EEC, EUAA, FMA, GBCA, PCA)
Targeted consultation (approx. 30 interviews plus various sector workshops) to determine:• which industries should be surveyed and how
they could be grouped • Indicative FTE of time spent on energy
management and energy procurement per employee per sector
• Design process for inclusion of energy management by non-energy industry in the AEER:
• limited pilot and company follow-up to test questions and estimates of time spent on management
• test of value-add questions on assistance or information needs for better energy management
February 2022A process for inclusion of energy management activities in building management, manufacturing, agriculture, and other sectors not commonly associated with the “energy sector” as it would pertain to an Australian Energy Employment Survey.
Fast trackApprox. budget $150k
Including the ‘indirect’ energy sector – the energy managers located in non-energy industries – in the AEER will enable tracking of this important group over time.If Australia is to achieve energy productivity targets, this workforce needs to steadily increase, as does their expertise and access to information. This cannot be tracked without going to industry regularly to collect the data. Inclusion in the survey will also allow further targeted questions to monitor the skill and training needs of this group. Enables RACE for 2030 milestones E2.2c, E2.3b, E3.3b
E3 Opportunity Assessment: Developing the future energy workforce 125

FIN
DIN
G
PROPOSED PROJECT TITLE PR
OJE
CT ID
POTENTIAL INDUSTRY PARTNERS
PROJECT ACTIVITIES THEME & PROJECT LEVEL (3, 5 & 10 YEAR)
OUTPUTS: THEME & PROJECT LEVEL (3, 5, & 10 YEAR)
INPUTS/ BUDGET (3, 5, 10 YEAR)
OUTCOMES: THEME & PROJECT LEVEL (3–14 YEAR)
1.3 Energy workforce occupational breakdowns
4 UTS, government, industry associations (EEC, AIRAH, ASBEC, GBCA, ABS, DISER)
Identify occupational breakdowns for energy efficiency, energy management, storage, and other sectors as needed to allow occupational projections alongside gross employment projections
December 2023: Energy efficiency and energy management occupational breakdown June 2024: Storage – occupational breakdownDecember 2024 – transport occupational breakdown
Standard trackApprox. budget EE – $250kStorage – $150k
Enables detailed projections by occupation to allow planning for workforce development, and in particular the provision of training places. Delivers RACE for 2030 milestones E2.2c, E2.3b, E3.3b
1.4 Developing Australian I/O tables for Australian energy workforce analysis
5 UNSW, UTS, ABS, government, industry associations (EEC, AIRAH, ASBEC, GBCA, ABS, DISER)
• Consultation with government and industry to determine required granularity of IO tables with respect to geography, industry, and occupation
• Interrogation of suite of energy sector projection methods to determine how these could interact with IO tables
• Identification of data requirements to enable energy sector IO tables at require granularity
• Preparation of data feed coding to enable IO table disaggregation and augmentation
• The project will also interrogate other model linkages to enable the subsequent workforce projections.
March 2022:The project would be undertaken using the Australian Industrial Ecology Virtual Laboratory (IELab, www.ielab.info), to ensure maximum impact from the detailed I/O tables to be developed.IO tables augmented with clean energy workforce data will provide detail on intermediate demands of clean energy technology and the supply of clean energy services to other sectors. This enables analysis of supply chain and economic linkages, including for employment.
Fast trackApprox. budget $120–150k
The project will ensure that sufficient baseline data is collected in the Australian Energy Employment Report and do the preparatory work so that I/O tables can be used for employment projections.Enables RACE for 2030 milestone E3.2b
1.5 Energy sector workforce projections – Part A: Electricity
6A UTS, AEMO, government, industry associations (CEC, API)
Projections to 2040 for the electricity sector, to be developed for the 2022 ISP and the 2020 WSP. This will include transmission construction, and indicative numbers for distribution, transmission, and electricity retailing.
December 2022:Detailed electricity sector workforce projections for Australia and by state, for the ISP and the WSP scenarios.Report for Australia to include the NEM and WA, with indicative results for off grid industry.
Fast trackApprox. budget $150k
Allows national, state and territory governments to plan for workforce development for the electricity sector, to undertake transition planning, and to maximise local employment and value creation. Enables RACE for 2030 milestone E3.2b
E3 Opportunity Assessment: Developing the future energy workforce126

FIN
DIN
G
PROPOSED PROJECT TITLE PR
OJE
CT ID
POTENTIAL INDUSTRY PARTNERS
PROJECT ACTIVITIES THEME & PROJECT LEVEL (3, 5 & 10 YEAR)
OUTPUTS: THEME & PROJECT LEVEL (3, 5, & 10 YEAR)
INPUTS/ BUDGET (3, 5, 10 YEAR)
OUTCOMES: THEME & PROJECT LEVEL (3–14 YEAR)
1.5 Energy sector workforce projections – Part B
6B UTS, UNSW, Monash, government, industry associations (EEC, AIRAH, ASBEC, GBCA)
Projections for the whole energy sector following the first AEER, broken down by sector, including detailed occupational breakdowns for energy efficiency and energy management workforce to 2040. Results broken down by sub-sector, location, and occupation to the extent possible.
Delivery by June 2024Employment projections using employment factors and I/O tables (and potentially econometric modelling) for the entire the energy efficiency and energy management, using Decarbonisation Futures and ISP/ WSP.
Standard trackApprox. budget $300k
Allows national, state and territory governments to plan for workforce development for the energy sector and undertake transition planning to maximise onshore, regional, and local employment and value creation. Enables RACE for 2030 milestone E3.2b
1.5 Energy sector workforce projections – Part C
6C UTS, UNSW, Monash, government, industry associations (CEC)
Projections for the whole energy sector to 2040 following the second AEER, broken down by sector, including detailed occupational breakdowns for energy storage workforce to 2040 broken down by sub-sector, location, and occupation to the extent possible.
Delivery by December. 2024Employment projections using employment factors and I/O tables (and potentially econometric modelling) for the energy storage sector, using Decarbonisation Futures and ISP/ WSP.
Standard trackApprox. budget $200k
Allows state and territory governments to plan for workforce development for the energy sector and undertake transition planning. Enables RACE for 2030 milestone E3.2b
1.6 + 2.2
Energy sector consultation on ANZSCO codes
7 UTS, EEC, DISER, ABS, Industry associations
Need to consult with ABS on activities, scope, budget etc.
Delivery possible after July 2022 Fast trackApprox. budget $150k
1.8 The future transport workforce – where does it overlap with the energy sector workforce?
8 DISER, ABS, Industry associations
Undertake review and consultation to determine whether and which elements of transport should be included in the energy workforce survey – for potential inclusion in the second or third survey
Delivery by December 2022 Fast track Approx. budget $100k–$150k
1.9 Energy efficiency definitions
9 Government, industry associations (EEC, AIRAH, ASBEC, GBCA)
Targeted consultation by sub-sector to determine the boundaries of measuring energy efficiency by activity (i.e. what star rating, what standard, and identify any standards barriers)
Delivery by December 2021Definitions need to be determined in time to feed into the energy workforce survey
Fast trackApprox. budget $75k–$100k
Enable better inclusion of energy efficiency in the AEEREnables RACE for 2030 milestones E2.2c, E2.3b, E3.3b
E3 Opportunity Assessment: Developing the future energy workforce 127

FIN
DIN
G
PROPOSED PROJECT TITLE PR
OJE
CT ID
POTENTIAL INDUSTRY PARTNERS
PROJECT ACTIVITIES THEME & PROJECT LEVEL (3, 5 & 10 YEAR)
OUTPUTS: THEME & PROJECT LEVEL (3, 5, & 10 YEAR)
INPUTS/ BUDGET (3, 5, 10 YEAR)
OUTCOMES: THEME & PROJECT LEVEL (3–14 YEAR)
2.1 Detailed stocktake and mapping of existing tertiary and vocational education and training courses
10 Monash, industry bodies, government
Review all training and programs based on: • Content• Delivery model• technical skills• social / cross-cutting skills • enrolment and graduation trendsInterviews with course coordinators and Industry Reference Committees.Undertake analysis of official databases
Delivery by December 2021Identification of tertiary and vocational existing offerings. This will feed into scoping report (2.3) on priority course content
Fast trackApprox. budget $100k
Allows for identification of any gaps based on skills requirements in 2.2 and informs scoping report under 2.3Co-delivers RACE for 2030 milestone E3.1a (this opportunity assessment also co-delivers E3.1a)
2.1 Scoping report: identifying priority course content for tertiary and vocational offerings
11 Monash, Industry bodies, government
Literature review, consultation, report Delivery by December 2022Detailed list of course content for tertiary and vocational offerings
Standard trackApprox. budget $150k–200k
Ability for policy support and training providers to develop and deliver required trainingDelivers RACE for 2030 milestone E3.2b
2.2 The energy workforce: identifying skills of the future
12 ClimateWorks Australia (Monash), UTS, government, industry associations (EEC, API, CEC)
• Review of actions needed for decarbonisation of, and enhanced energy management in, the electricity, buildings, transport, industry (manufacturing and mining), and agriculture sectors (ClimateWorks, EEC, other industry associations).
• Mapping of skills and skilled tradespeople and professionals needed to implement these actions (EEC, API, CEC)
• Identification of critical digital and social or cross-cutting skills to enable system transformation
• Identification of ANZSCO codes that align with those identified skilled tradespeople and professionals and identifying where alignment is poor to support redefinition of ANZSCO codes (UTS).
Delivery by June 2022:Identification of various scenarios for technologies and solutions to be implemented to 2030 to inform skills requirements and timing for development of training and education programs.
Identification of the generic technical and other skills for occupations needed to deliver energy transition.
Standard trackApprox. budget $175k–200k
Ensures highest priority and impact skills and training requirements can be developedEfficient targeting of training to deliver required skills by industry bodies, vocational and tertiary sectorsEnables RACE for 2030 milestone E3.2b
E3 Opportunity Assessment: Developing the future energy workforce128

FIN
DIN
G
PROPOSED PROJECT TITLE PR
OJE
CT ID
POTENTIAL INDUSTRY PARTNERS
PROJECT ACTIVITIES THEME & PROJECT LEVEL (3, 5 & 10 YEAR)
OUTPUTS: THEME & PROJECT LEVEL (3, 5, & 10 YEAR)
INPUTS/ BUDGET (3, 5, 10 YEAR)
OUTCOMES: THEME & PROJECT LEVEL (3–14 YEAR)
2.3 Professional development pathways for energy professionals – Part A: Energy services professionals
13A EEC Literature review, consultation, report Delivery by December 2022Detailed list of training required for energy service professionals
Fast trackApprox. budget $75k–$100k
Ability for policy support and training providers to develop and deliver required trainingDelivers RACE for 2030 milestone E3.2b
2.3 Professional development pathways Part B: Renewable energy professionals
13B CEC Literature review, consultation, report Delivery by December 2022Detailed list of training required for renewable energy professionals
Fast trackApprox. budget $75k–$100k
Ability for policy support and training providers to develop and deliver required trainingDelivers RACE for 2030 milestone E3.2b
2.3 Professional development pathways Part C: Network professionals
13C API Literature review, consultation, report Delivery by December 2022Detailed list of training required for network professionals
Fast trackApprox. budget $75k–$100k
Ability for policy support and training providers to develop and deliver required trainingDelivers RACE for 2030 milestone E3.2b
2.3 Professional development pathways Part D: Transport professionals
13D Industry Literature review, consultation, report Delivery by December 2022Detailed list of training required for electric vehicle professionals
Fast trackApprox. budget $75k–$100k
Ability for policy support and training providers to develop and deliver required trainingDelivers RACE for 2030 milestone E3.2b
2.4 RACE for 2030 workforce development lab 1: Improving coordination and collaboration between training sector and industry
14 RACE for 2030, government, industry bodies, education providers, employers with work-integrated-learning programs
• Review and identification of appropriate mechanisms to support coordination and collaboration
• Establish an ongoing forum to identify tasks, responsibilities and track implementation
Provide support for implementation (TBC out of lab)
Delivery by December 2021: Review completeQ3 2021: First forumOngoing to end 2022: Quarterly forumsEnd 2022: Final report and recommendations for ongoing collaboration
Fast trackApprox. budget $150k
Improve efficiency in training program development and delivery
E3 Opportunity Assessment: Developing the future energy workforce 129

FIN
DIN
G
PROPOSED PROJECT TITLE PR
OJE
CT ID
POTENTIAL INDUSTRY PARTNERS
PROJECT ACTIVITIES THEME & PROJECT LEVEL (3, 5 & 10 YEAR)
OUTPUTS: THEME & PROJECT LEVEL (3, 5, & 10 YEAR)
INPUTS/ BUDGET (3, 5, 10 YEAR)
OUTCOMES: THEME & PROJECT LEVEL (3–14 YEAR)
2.5 RACE for 2030 workforce development lab 2: Increasing energy sector employment attractiveness
15 RACE for 2030, industry bodies, government, large employers
• Review and identification of appropriate mechanisms to support coordination and collaboration
• Establish an ongoing forum to identify tasks, responsibilities and track implementation
• Provide support for implementation
Delivery by December 2021: Review completeQ3 2021: First forumOngoing to end 2022: Quarterly forumsEnd 2022: Final report and recommendations for ongoing collaboration
Fast trackApprox. budget $150k (dependent on implementation support required)
Improved capacity of industry to attract talent and address skills gap
2.6 RACE for 2030 workforce development lab 3: Promoting diversity in the energy sector
16 Industry bodies, government, groups representing women and minorities
• Review and identification of appropriate actions to increase diversity, including developing diversity metrics that would complement the data in the AEER survey, and that industry associations could collect from their own members
• Establish an ongoing forum to identify tasks, responsibilities and track implementation
• Provide support for implementation
Delivery by December 2021: Review completeQ3 2021: First forumOngoing to end 2022: Quarterly forumsEnd 2022: Final report and recommendations for ongoing collaboration
Fast trackApprox. budget $150k
Increased diversity in energy industry. Improved attractiveness of industry to attract talent and address skills gap
2.7 Ensuring a just transition for fossil fuel workforce
17 Research partner, unions, industry bodies, government
• Undertake literature review Consult (unions, government)
• Identify suitable industries• Undertake additional occupational
breakdowns where necessary • Use projections for increase/ decrease to
identify opportunities
Delivery by December 2023Identification of opportunities for skills transfer and upskilling opportunities
Fast trackApprox. budget $75k–$100k
Address skills gap in energy industry by providing transition pathways for fossil fuel workers
2.8 Developing energy literacy, digital and cross-cutting skills for non-traditional energy professionals
18 Monash, industry bodies, government
Literature review, consultation, report Delivery by June 2023 Detailed list of cross-cutting skills training required for non-traditional energy professionals
Standard trackApprox. budget $150k–200k
Ability for policy support and training providers to develop and deliver required trainingEnables RACE for 2030 milestone E3.2b
3.1 – 3.5 + 3.8 + 3.9
RACE for 2030 innovation strategy
19 RACE for 2030 partners Co-create RACE for 2030 innovation strategy including aims and objectives, capacity building program, monitoring and evaluation, and impact tracking
Delivery by June 2022Clear aims and objectives for innovation, ability to direct limited resources, build specific capabilities
Standard trackApprox. budget $2.5–$3m/ 10 years
Enables RACE for 2030 milestones E3.3a, E3.4b
E3 Opportunity Assessment: Developing the future energy workforce130

FIN
DIN
G
PROPOSED PROJECT TITLE PR
OJE
CT ID
POTENTIAL INDUSTRY PARTNERS
PROJECT ACTIVITIES THEME & PROJECT LEVEL (3, 5 & 10 YEAR)
OUTPUTS: THEME & PROJECT LEVEL (3, 5, & 10 YEAR)
INPUTS/ BUDGET (3, 5, 10 YEAR)
OUTCOMES: THEME & PROJECT LEVEL (3–14 YEAR)
3.6 + 3.10
Addressing capital gaps: mapping financing and policy options for coordinated early stage and deployment stage funding
20 Energylab, SUBC, Climate KIC, ISF-UTS, Monash
Investigating global options for financing models and policy options, identify coordination mechanisms, recommendations for pathway forward
Delivery by December 2022Report and options analysisUnderstanding of financing options, landscape, and recommendations
Fast trackApprox. budget $150k
3.6 + 3.10
Co-investment models for RACE for 2030: investigating the IMCRC model/ catapult model
21 Energylab, SUBC, Climate KIC, ISF-UTS, Monash, UCP
Investigate and develop options for co-investment mechanisms for RACE for 2030
Delivery by June 2023Report and options analysis
Fast trackApprox. budget $150k
Assessment of viability of the IMCRC model for RACE for 2030
3.6 + 3.10
Case studies: alternative procurement/ R&D contracting commercialisation model
22 Energylab, SUBC, Climate KIC, ISF-UTS, Monash, UCP
Case studies of alternative procurement/ R&D contract funding of start-ups
Delivery by December 2023Case studies, report on enablers of this model
Fast trackApprox. budget $100–$150k Depending on how many case studies
Wider adoption of this financing model
3.6 + 3.10
Comparative study of the effectiveness of intermediaries and gap analysis for Australia
23 Climate KIC, state governments, DISER
Assessment of the role of intermediaries in reducing uncertainty and increasing adoption
Delivery by June 2024Enhanced intermediaries established for energy innovation
Fast trackApprox. budget $150k
3.7 + 3.11
Energy innovation policy lab: capacity building for transformational innovation
24 DISER, state governments, Climate KIC, ISF-UTS
Assessment of current capabilities and gaps, program of capacity building to develop capabilities
Delivery by June 2023Enhanced capabilities for transformational energy innovation policy
Standard trackApprox. budget $250k depending on scope and activities
Enables RACE for 2030 milestones E3.3a, E3.4b
3.9 Start-up register 25 Energylab, SUBC, Climate KIC, ISF-UTS, state governments, DISER
Development and implementation of survey of start-ups, including detailed metrics for innovation system
Delivery by June 2024Report covering survey results, recommendations for networksBetter characterisation of start-ups, ability to better target support programs
Standard trackApprox. budget $250k for initial surveyCapacity building and network coordination linked to the Innovation Strategy
Delivers RACE for 2030 milestones E3.3a, E3.4b
E3 Opportunity Assessment: Developing the future energy workforce 131

www.racefor2030.com.au
© 2021: RACE FOR 2030


