Race to the Top – Early Learning Challenge JULY 2016 Each RTT-ELC State committed to building or enhancing comprehensive State early learning systems and increasing access for children with high needs to high-quality, accountable early learning and development programs through a statewide Tiered Quality Rating and Improvement System (TQRIS). In the 2015 Annual Performance Reports (APR) submitted by RTT-ELC grantees, we learn that: Figure 1. Access to High-Quality Early Learning and Development Programs in 20 RTT-ELC Grantee States. In Figures 1 and 4: Yellow bar is the baseline States reported before their grant. Blue bar is the number reported in States’ 2015 APRs. 20 States used Race to the Top Early Learning Challenge (RTT-ELC) funds to improve the quality of early learning and development programs. All reported progress towards their goals in 2015, and the number of children in the highest quality programs has more than tripled since the start of their grants.
Transcript
Race to the Top – Early Learning Challenge JULY 2016
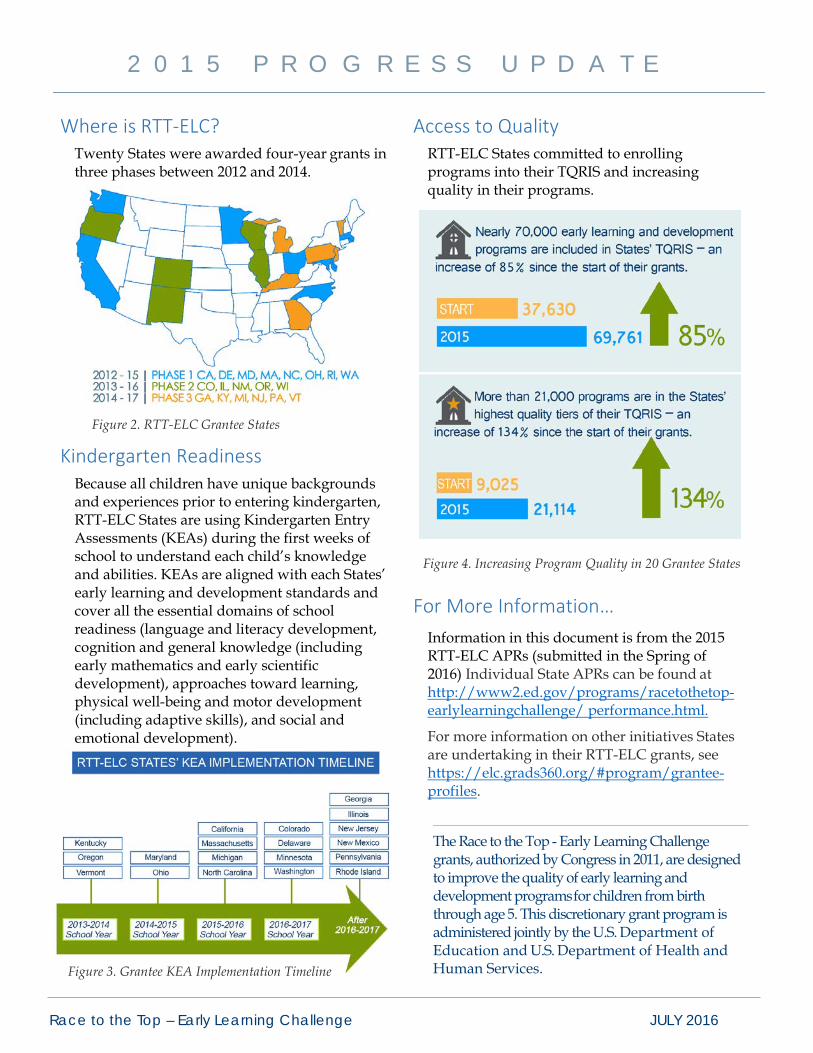
Each RTT-ELC State committed to building or enhancing comprehensive State early learning systems and increasing access for children with high needs to high-quality, accountable early learning and development programs through a statewide Tiered Quality Rating and Improvement System (TQRIS). In the 2015 Annual Performance Reports (APR) submitted by RTT-ELC grantees, we learn that:
Figure 1. Access to High-Quality Early Learning and Development Programs in 20 RTT-ELC Grantee States. In Figures 1 and 4: Yellow bar is the baseline States reported before their grant. Blue bar is the number reported in States’ 2015 APRs.
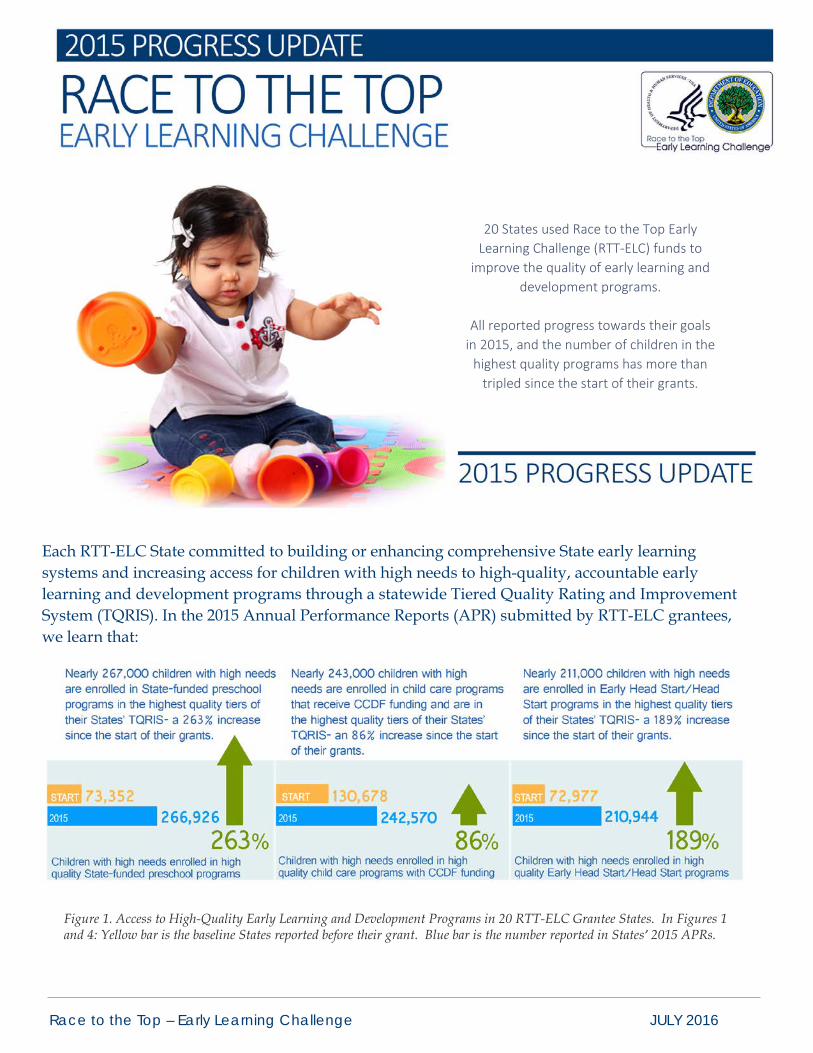
20 States used Race to the Top Early Learning Challenge (RTT-ELC) funds to
improve the quality of early learning and development programs.
All reported progress towards their goals
in 2015, and the number of children in the highest quality programs has more than
tripled since the start of their grants.
Race to the Top – Early Learning Challenge JULY 2016
2 0 1 5 P R O G R E S S U P D A T E
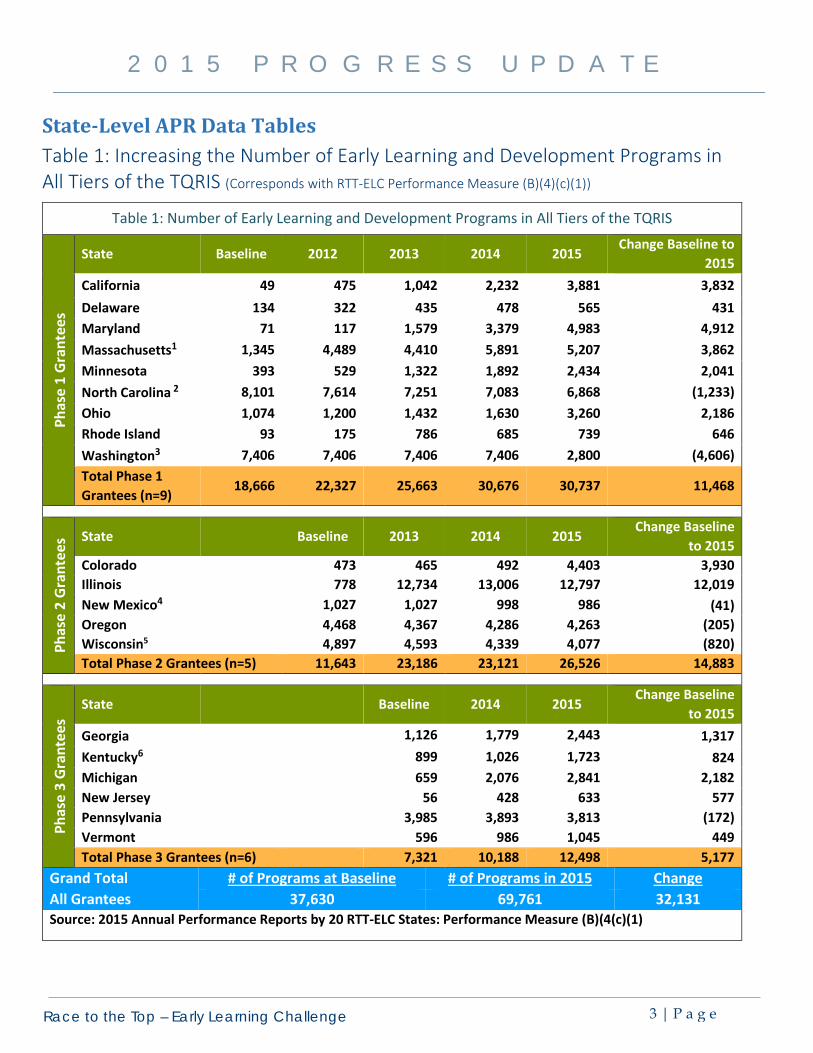
Where is RTT-ELC? Twenty States were awarded four-year grants in three phases between 2012 and 2014.
Kindergarten Readiness Because all children have unique backgrounds and experiences prior to entering kindergarten, RTT-ELC States are using Kindergarten Entry Assessments (KEAs) during the first weeks of school to understand each child’s knowledge and abilities. KEAs are aligned with each States’ early learning and development standards and cover all the essential domains of school readiness (language and literacy development, cognition and general knowledge (including early mathematics and early scientific development), approaches toward learning, physical well-being and motor development (including adaptive skills), and social and emotional development).
Access to Quality RTT-ELC States committed to enrolling programs into their TQRIS and increasing quality in their programs.
For More Information… Information in this document is from the 2015 RTT-ELC APRs (submitted in the Spring of 2016) Individual State APRs can be found at http://www2.ed.gov/programs/racetothetop-earlylearningchallenge/ performance.html.
For more information on other initiatives States are undertaking in their RTT-ELC grants, see https://elc.grads360.org/#program/grantee-profiles.
Figure 2. RTT-ELC Grantee States
Figure 4. Increasing Program Quality in 20 Grantee States
The Race to the Top - Early Learning Challenge grants, authorized by Congress in 2011, are designed to improve the quality of early learning and development programs for children from birth through age 5. This discretionary grant program is administered jointly by the U.S. Department of Education and U.S. Department of Health and Human Services. Figure 3. Grantee KEA Implementation Timeline
Race to the Top – Early Learning Challenge 3 | P a g e
2 0 1 5 P R O G R E S S U P D A T E
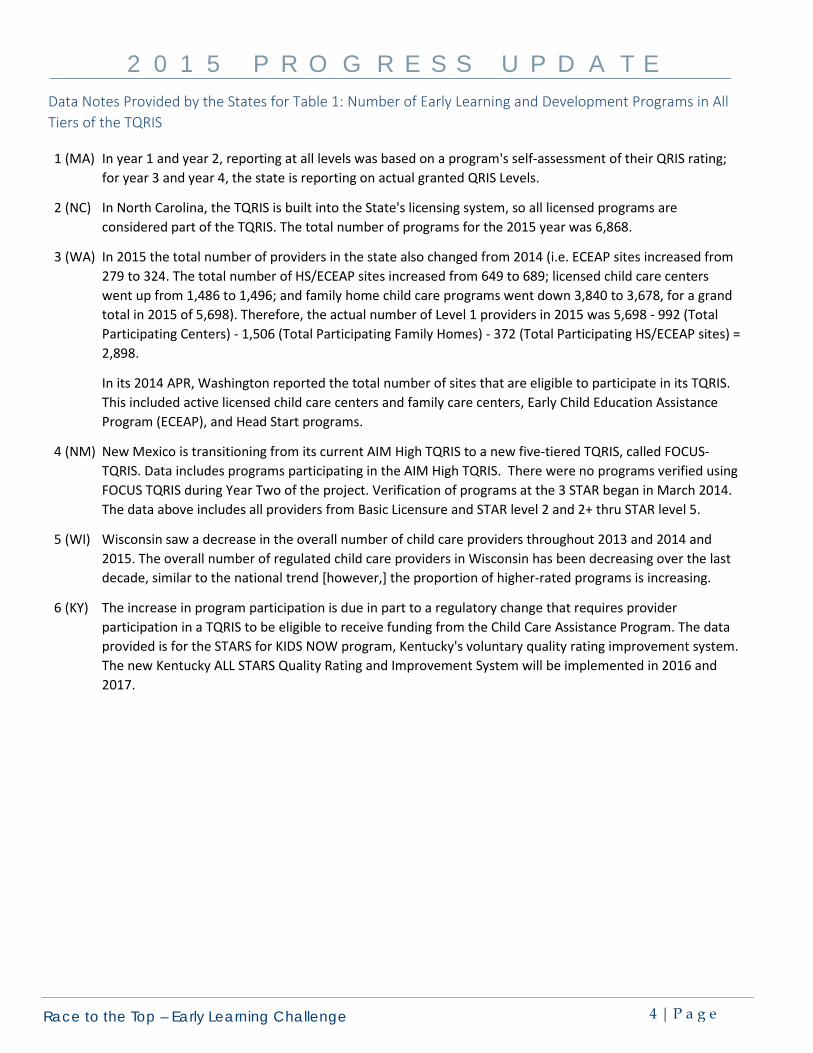
State-Level APR Data Tables Table 1: Increasing the Number of Early Learning and Development Programs in All Tiers of the TQRIS (Corresponds with RTT-ELC Performance Measure (B)(4)(c)(1))
Table 1: Number of Early Learning and Development Programs in All Tiers of the TQRIS
Phas
e 1
Gra
ntee
s
State Baseline 2012 2013 2014 2015 Change Baseline to
Race to the Top – Early Learning Challenge 4 | P a g e
2 0 1 5 P R O G R E S S U P D A T E
Data Notes Provided by the States for Table 1: Number of Early Learning and Development Programs in All Tiers of the TQRIS
1 (MA) In year 1 and year 2, reporting at all levels was based on a program's self-assessment of their QRIS rating; for year 3 and year 4, the state is reporting on actual granted QRIS Levels.
2 (NC) In North Carolina, the TQRIS is built into the State's licensing system, so all licensed programs are considered part of the TQRIS. The total number of programs for the 2015 year was 6,868.
3 (WA) In 2015 the total number of providers in the state also changed from 2014 (i.e. ECEAP sites increased from 279 to 324. The total number of HS/ECEAP sites increased from 649 to 689; licensed child care centers went up from 1,486 to 1,496; and family home child care programs went down 3,840 to 3,678, for a grand total in 2015 of 5,698). Therefore, the actual number of Level 1 providers in 2015 was 5,698 - 992 (Total Participating Centers) - 1,506 (Total Participating Family Homes) - 372 (Total Participating HS/ECEAP sites) = 2,898.
In its 2014 APR, Washington reported the total number of sites that are eligible to participate in its TQRIS. This included active licensed child care centers and family care centers, Early Child Education Assistance Program (ECEAP), and Head Start programs.
4 (NM) New Mexico is transitioning from its current AIM High TQRIS to a new five-tiered TQRIS, called FOCUS-TQRIS. Data includes programs participating in the AIM High TQRIS. There were no programs verified using FOCUS TQRIS during Year Two of the project. Verification of programs at the 3 STAR began in March 2014. The data above includes all providers from Basic Licensure and STAR level 2 and 2+ thru STAR level 5.
5 (WI) Wisconsin saw a decrease in the overall number of child care providers throughout 2013 and 2014 and 2015. The overall number of regulated child care providers in Wisconsin has been decreasing over the last decade, similar to the national trend [however,] the proportion of higher-rated programs is increasing.
6 (KY) The increase in program participation is due in part to a regulatory change that requires provider participation in a TQRIS to be eligible to receive funding from the Child Care Assistance Program. The data provided is for the STARS for KIDS NOW program, Kentucky's voluntary quality rating improvement system. The new Kentucky ALL STARS Quality Rating and Improvement System will be implemented in 2016 and 2017.
Race to the Top – Early Learning Challenge 5 | P a g e
2 0 1 5 P R O G R E S S U P D A T E
Table 2: Increasing the Number of Programs in the Top Tiers7 of the TQRIS (Corresponds with Performance Measure (B)(4)(c)(1))
Table 2: Number of Early Learning and Development Programs in the Top Tiers of the TQRIS
Phas
e 1
Gra
ntee
s
State Baseline 2012 2013 2014 2015 Change Baseline
Grand Total # of Programs at Baseline # of Programs in 2015 Change All Grantees 9,025 21,114 12,089 Source: 2015 Annual Performance Reports by 20 RTT-ELC States: Performance Measure (B)(4)(c)(1)
Race to the Top – Early Learning Challenge 6 | P a g e
2 0 1 5 P R O G R E S S U P D A T E
Data Notes Provided by the States for Table 2: Number of Early Learning and Development Programs in the Top Tiers of the TQRIS
7 (Tiers) Table 2 uses the grantee’s definitions of their highest tiers and data from the 2015 APRs.
Sixteen States have 5 tiers in their TQRIS: Six States (CA, IL, MD, NC, RI, and WI) define their top tiers as tiers 4 and 5. Ten States (CO, DE, KY, MI, NJ, NM, OH, OR, VT, and WA) define their highest tiers as tiers 3, 4, and 5,
Three States have 4 tiers in their TQIRS: Two States (MN and PA) define top tiers as tiers 3 and 4. One State (MA) defines its top tiers as tiers 2, 3, and 4.
One State (GA) use 3 tiers and defines the top tiers as tiers 2 and 3.
8 (MA) For year 3 and year 4, the actual numbers in Performance Measure (B)(4)(c)(1) are based on a program's granted QRIS level, not self-assessment. The state will continue to verify the quality of program's that have applied for a QRIS rating moving forward.
9 (MI) A large majority of the licensed programs in the higher tiers of GSQ (3-5 Stars) reflect the mandatory GSQ participation for state-funded preschool (Great Start Readiness Program) providers and their community-based partners.
10 (NJ) New Jersey has not identified programs in “top tiers” as ratings have not yet been conducted. Although New Jersey has not conducted any ratings of program using Grow NJ Kids in the first 2 years of implementing RTT-ELC, William Paterson University has spent much of the second year working on the process and educating providers on the process and requirements. New Jersey anticipates the rating process commencing in early 2016 and continuing throughout the life of the grant.
Race to the Top – Early Learning Challenge 7 | P a g e
2 0 1 5 P R O G R E S S U P D A T E
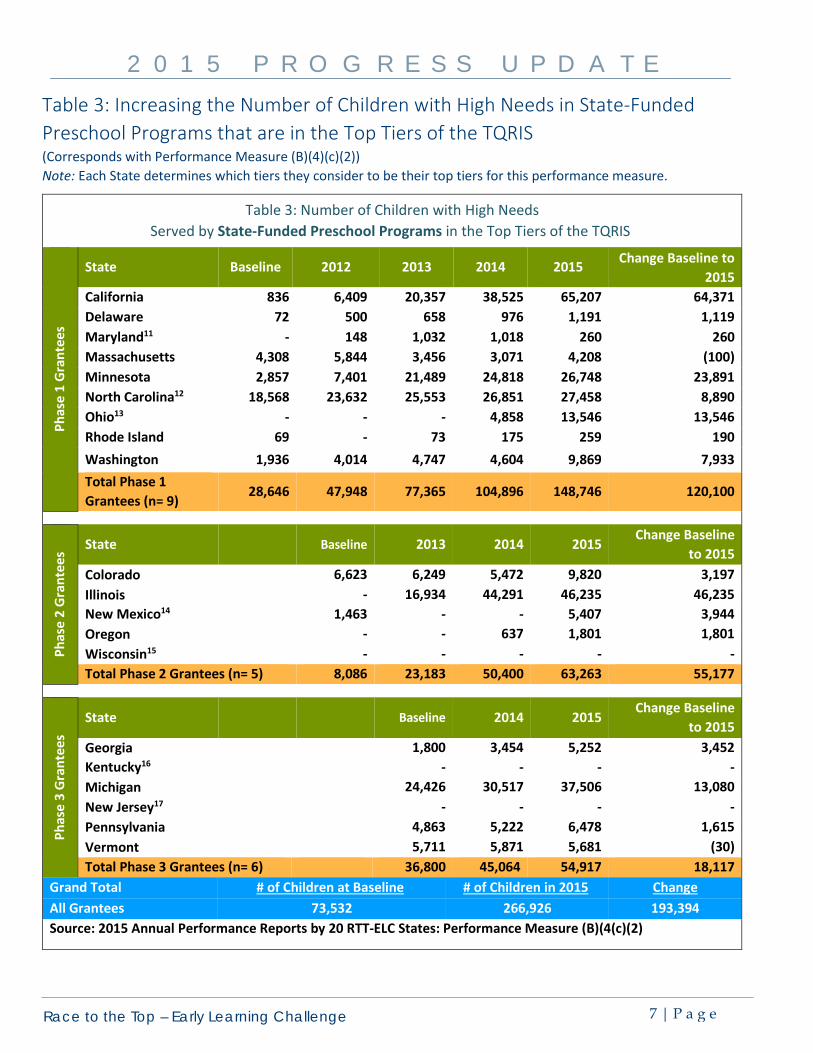
Table 3: Increasing the Number of Children with High Needs in State-Funded Preschool Programs that are in the Top Tiers of the TQRIS (Corresponds with Performance Measure (B)(4)(c)(2)) Note: Each State determines which tiers they consider to be their top tiers for this performance measure.
Table 3: Number of Children with High Needs Served by State-Funded Preschool Programs in the Top Tiers of the TQRIS
Phas
e 1
Gra
ntee
s
State Baseline 2012 2013 2014 2015 Change Baseline to 2015
Grand Total # of Children at Baseline # of Children in 2015 Change All Grantees 73,532 266,926 193,394 Source: 2015 Annual Performance Reports by 20 RTT-ELC States: Performance Measure (B)(4(c)(2)
Race to the Top – Early Learning Challenge 8 | P a g e
2 0 1 5 P R O G R E S S U P D A T E
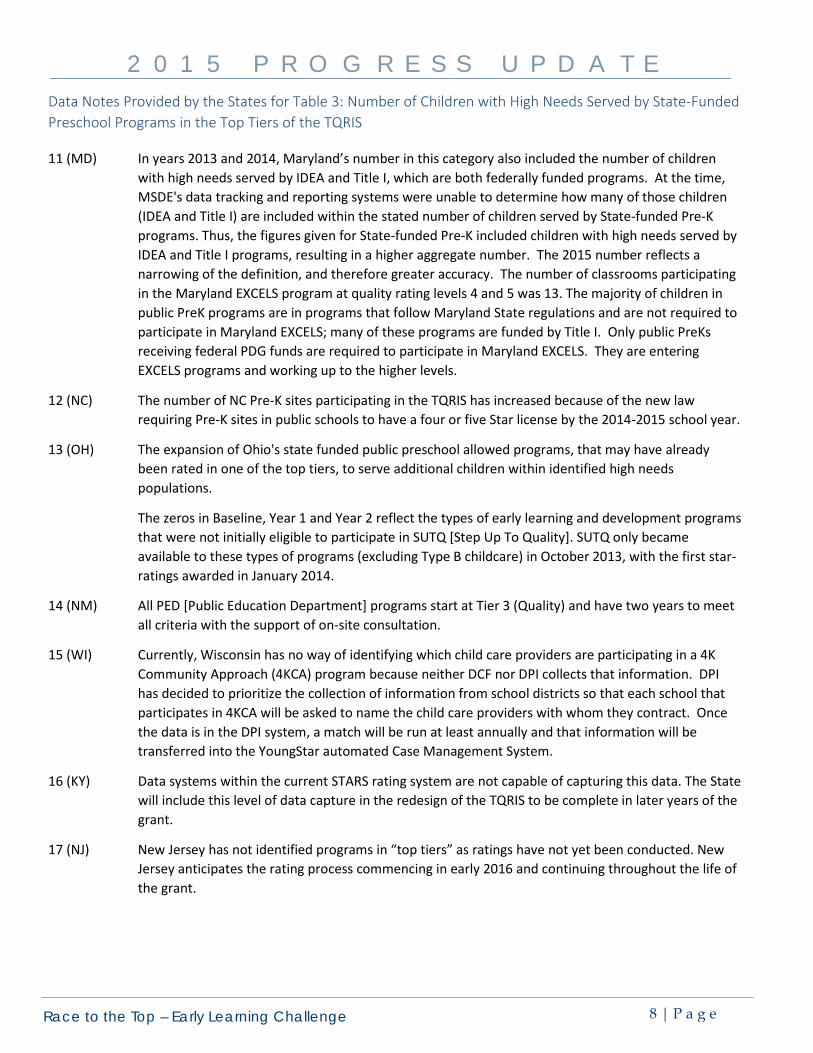
Data Notes Provided by the States for Table 3: Number of Children with High Needs Served by State-Funded Preschool Programs in the Top Tiers of the TQRIS
11 (MD) In years 2013 and 2014, Maryland’s number in this category also included the number of children with high needs served by IDEA and Title I, which are both federally funded programs. At the time, MSDE's data tracking and reporting systems were unable to determine how many of those children (IDEA and Title I) are included within the stated number of children served by State-funded Pre-K programs. Thus, the figures given for State-funded Pre-K included children with high needs served by IDEA and Title I programs, resulting in a higher aggregate number. The 2015 number reflects a narrowing of the definition, and therefore greater accuracy. The number of classrooms participating in the Maryland EXCELS program at quality rating levels 4 and 5 was 13. The majority of children in public PreK programs are in programs that follow Maryland State regulations and are not required to participate in Maryland EXCELS; many of these programs are funded by Title I. Only public PreKs receiving federal PDG funds are required to participate in Maryland EXCELS. They are entering EXCELS programs and working up to the higher levels.
12 (NC) The number of NC Pre-K sites participating in the TQRIS has increased because of the new law requiring Pre-K sites in public schools to have a four or five Star license by the 2014-2015 school year.
13 (OH) The expansion of Ohio's state funded public preschool allowed programs, that may have already been rated in one of the top tiers, to serve additional children within identified high needs populations.
The zeros in Baseline, Year 1 and Year 2 reflect the types of early learning and development programs that were not initially eligible to participate in SUTQ [Step Up To Quality]. SUTQ only became available to these types of programs (excluding Type B childcare) in October 2013, with the first star-ratings awarded in January 2014.
14 (NM) All PED [Public Education Department] programs start at Tier 3 (Quality) and have two years to meet all criteria with the support of on-site consultation.
15 (WI) Currently, Wisconsin has no way of identifying which child care providers are participating in a 4K Community Approach (4KCA) program because neither DCF nor DPI collects that information. DPI has decided to prioritize the collection of information from school districts so that each school that participates in 4KCA will be asked to name the child care providers with whom they contract. Once the data is in the DPI system, a match will be run at least annually and that information will be transferred into the YoungStar automated Case Management System.
16 (KY) Data systems within the current STARS rating system are not capable of capturing this data. The State will include this level of data capture in the redesign of the TQRIS to be complete in later years of the grant.
17 (NJ) New Jersey has not identified programs in “top tiers” as ratings have not yet been conducted. New Jersey anticipates the rating process commencing in early 2016 and continuing throughout the life of the grant.
Race to the Top – Early Learning Challenge 9 | P a g e
2 0 1 5 P R O G R E S S U P D A T E
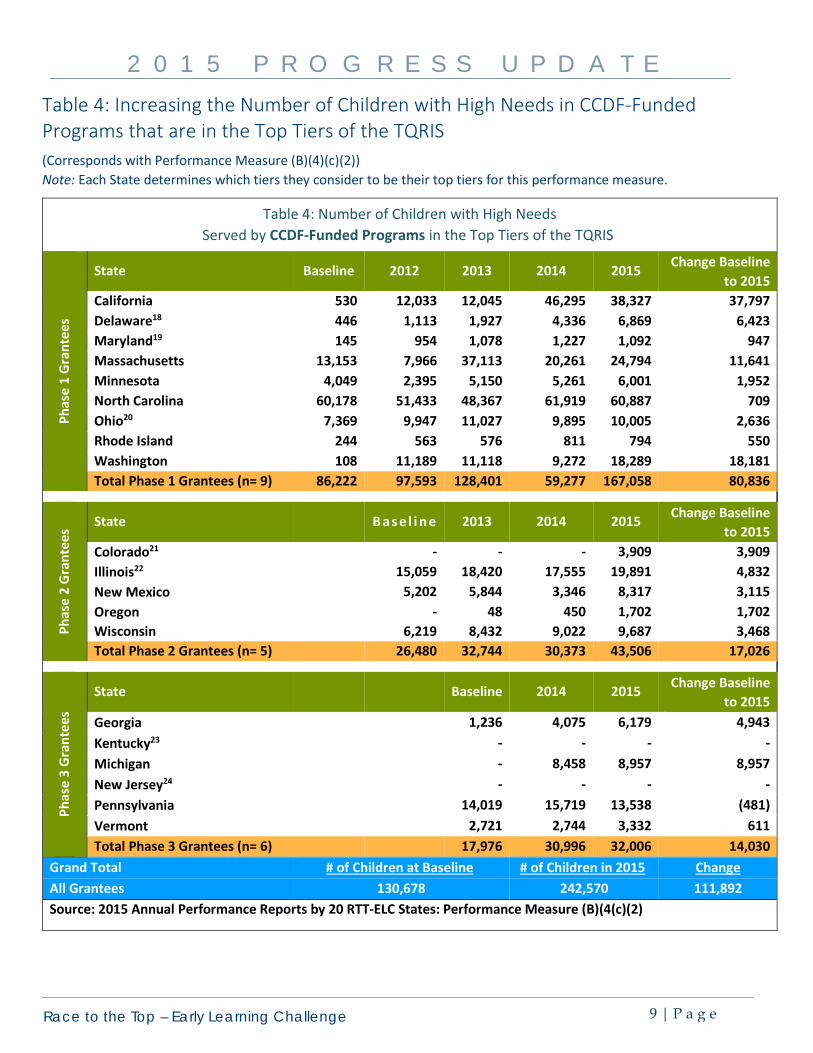
Table 4: Increasing the Number of Children with High Needs in CCDF-Funded Programs that are in the Top Tiers of the TQRIS (Corresponds with Performance Measure (B)(4)(c)(2)) Note: Each State determines which tiers they consider to be their top tiers for this performance measure.
Table 4: Number of Children with High Needs Served by CCDF-Funded Programs in the Top Tiers of the TQRIS
Phas
e 1
Gra
ntee
s
State Baseline 2012 2013 2014 2015 Change Baseline to 2015
Grand Total # of Children at Baseline # of Children in 2015 Change All Grantees 130,678 242,570 111,892 Source: 2015 Annual Performance Reports by 20 RTT-ELC States: Performance Measure (B)(4(c)(2)
Race to the Top – Early Learning Challenge 10 | P a g e
2 0 1 5 P R O G R E S S U P D A T E
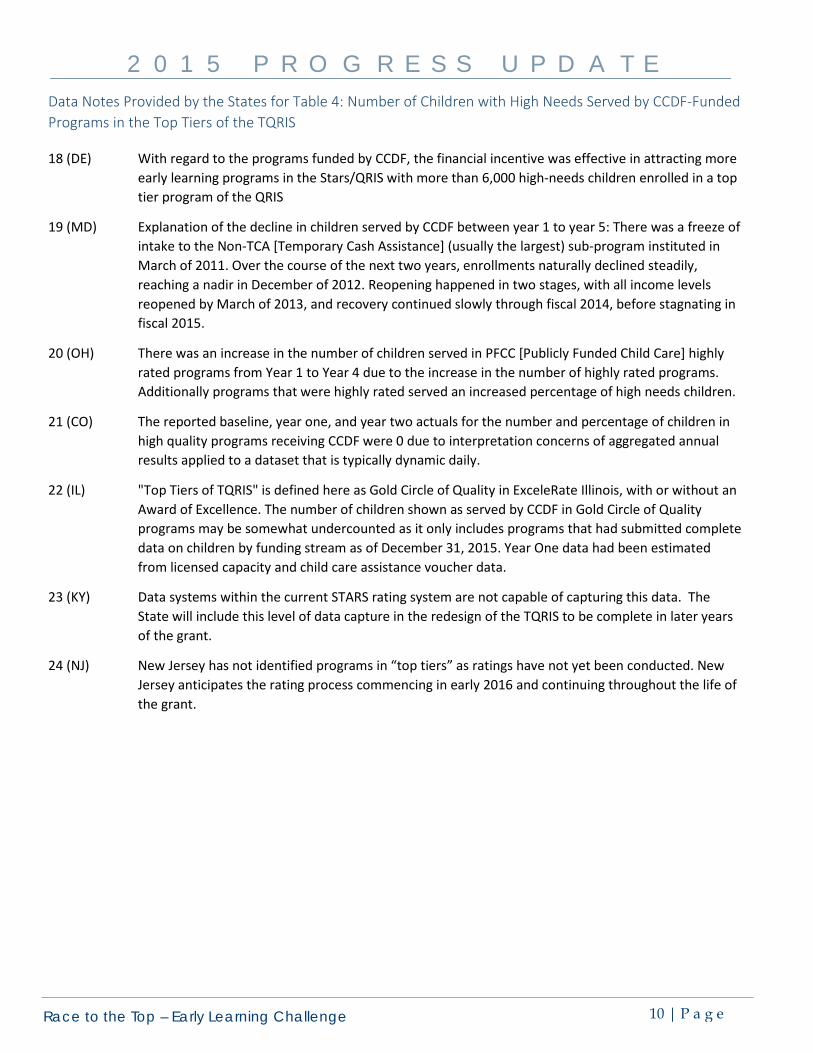
Data Notes Provided by the States for Table 4: Number of Children with High Needs Served by CCDF-Funded Programs in the Top Tiers of the TQRIS
18 (DE) With regard to the programs funded by CCDF, the financial incentive was effective in attracting more early learning programs in the Stars/QRIS with more than 6,000 high-needs children enrolled in a top tier program of the QRIS
19 (MD) Explanation of the decline in children served by CCDF between year 1 to year 5: There was a freeze of intake to the Non-TCA [Temporary Cash Assistance] (usually the largest) sub-program instituted in March of 2011. Over the course of the next two years, enrollments naturally declined steadily, reaching a nadir in December of 2012. Reopening happened in two stages, with all income levels reopened by March of 2013, and recovery continued slowly through fiscal 2014, before stagnating in fiscal 2015.
20 (OH) There was an increase in the number of children served in PFCC [Publicly Funded Child Care] highly rated programs from Year 1 to Year 4 due to the increase in the number of highly rated programs. Additionally programs that were highly rated served an increased percentage of high needs children.
21 (CO) The reported baseline, year one, and year two actuals for the number and percentage of children in high quality programs receiving CCDF were 0 due to interpretation concerns of aggregated annual results applied to a dataset that is typically dynamic daily.
22 (IL) "Top Tiers of TQRIS" is defined here as Gold Circle of Quality in ExceleRate Illinois, with or without an Award of Excellence. The number of children shown as served by CCDF in Gold Circle of Quality programs may be somewhat undercounted as it only includes programs that had submitted complete data on children by funding stream as of December 31, 2015. Year One data had been estimated from licensed capacity and child care assistance voucher data.
23 (KY) Data systems within the current STARS rating system are not capable of capturing this data. The State will include this level of data capture in the redesign of the TQRIS to be complete in later years of the grant.
24 (NJ) New Jersey has not identified programs in “top tiers” as ratings have not yet been conducted. New Jersey anticipates the rating process commencing in early 2016 and continuing throughout the life of the grant.
Race to the Top – Early Learning Challenge 11 | P a g e
2 0 1 5 P R O G R E S S U P D A T E
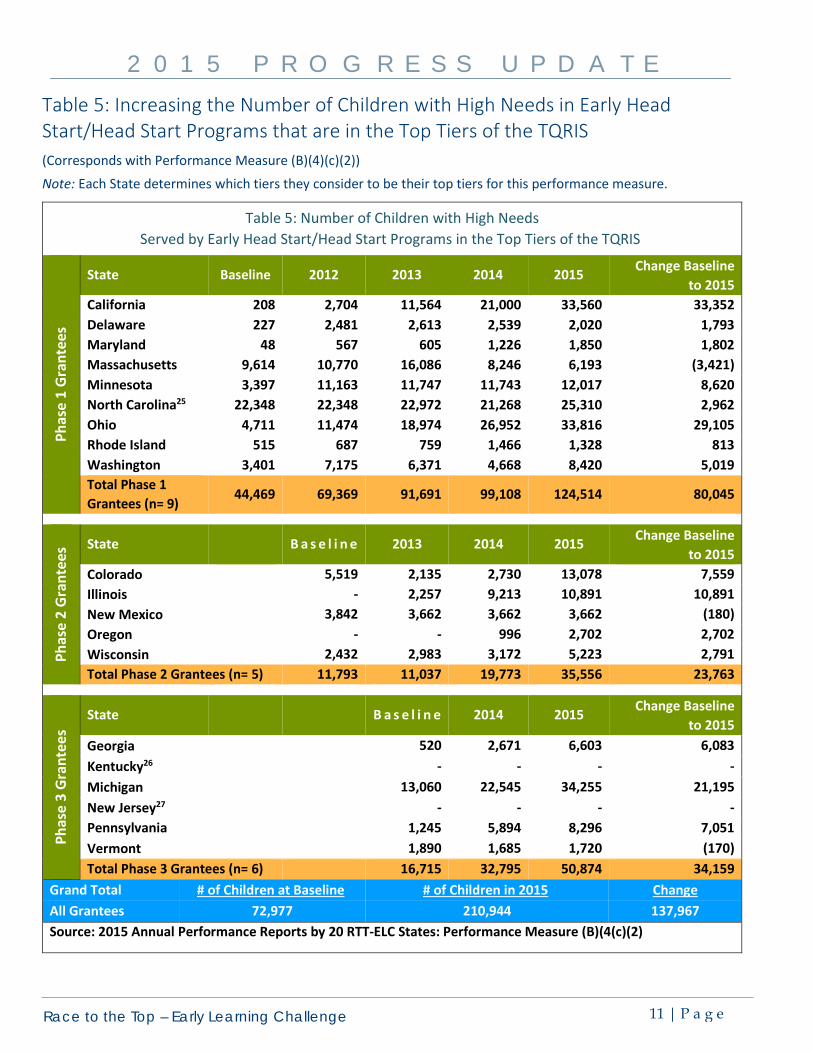
Table 5: Increasing the Number of Children with High Needs in Early Head Start/Head Start Programs that are in the Top Tiers of the TQRIS (Corresponds with Performance Measure (B)(4)(c)(2))
Note: Each State determines which tiers they consider to be their top tiers for this performance measure.
Table 5: Number of Children with High Needs Served by Early Head Start/Head Start Programs in the Top Tiers of the TQRIS
Phas
e 1
Gra
ntee
s
State Baseline 2012 2013 2014 2015 Change Baseline to 2015
Grand Total # of Children at Baseline # of Children in 2015 Change All Grantees 72,977 210,944 137,967 Source: 2015 Annual Performance Reports by 20 RTT-ELC States: Performance Measure (B)(4(c)(2)
Race to the Top – Early Learning Challenge 12 | P a g e
2 0 1 5 P R O G R E S S U P D A T E
Data Notes Provided by the States for Table 5: Number of Children with High Needs Served by Early Head Start/Head Start Programs in the Top Tiers of the TQRIS
25 (NC) For Early Head Start and Head Start: All Early Head Start and Head Start programs in the state are licensed and participate in the TQRIS, with the exception of two school districts. School districts are not required to be licensed, but all except two voluntarily participate in the TQRIS. It is estimated that 95% of Early Head Start and Head Start children in the state are in the top tiers of the TQRIS; actual data are not available. An estimate of 95% was calculated by adding up the number of programs in the two school districts that do not currently participate in the TQRIS and subtracting them out of the total.
26 (KY) Data systems within the current STARS rating system are not capable of capturing this data. The State will include this level of data capture in the redesign of the TQRIS to be complete in later years of the grant.
27 (NJ) New Jersey has not identified programs in “top tiers” as ratings have not yet been conducted. New Jersey anticipates the rating process commencing in early 2016 and continuing throughout the life of the grant.
Race to the Top – Early Learning Challenge 13 | P a g e
2 0 1 5 P R O G R E S S U P D A T E
Table 6: Leveraging Existing Resources to Increase the Number of Children with High Needs who are Screened Using Developmental and Behavioral Screening Measures (Corresponds with Performance Measure (C)(3)(d))
For Table 6, only eight States (California, Delaware, Maryland, Michigan, New Jersey, North Carolina, Oregon, and Vermont) selected health promotion as a focused investment area. These states are depicted in black type below.
Table 6: Number of Children with High Needs who are Screened using Screening Measures
Phas
e 1
Gra
ntee
s
State Baseline 2012 2013 2014 2015 Change: Baseline to 2015
Total Phase 3 Grantees 102,459 156,432 169,601 67,142 Grand Total # of Children at Baseline # of Children in 2015 Change All Grantees 587,409 786,655 199,246 Source: 2015 Annual Performance Reports by 20 RTT-ELC States: Performance Measure C(3)(d)
Race to the Top – Early Learning Challenge 14 | P a g e
2 0 1 5 P R O G R E S S U P D A T E
Data Notes Provided by the States for Table 6: Leveraging Existing Resources to Increase the Number of Children with High Needs Who Are Screened Using Screening Measures
28 (CA) While 2015 demonstrates an 8 percent increase from 2014, the data included for "Number of Children with High Needs screened" continues to be significantly under-reported due to California's varied screening delivery systems and lack of a centralized data system. For these reasons, California is unable to report a true count of screenings that accurately reflects the wide array of delivery methods. To support screening data practices, California continues work with the Early Childhood Comprehensive Systems grant, focused on creating a system for consistent collection of common screening data indicators across various provider types.
29 (OR) Developmental screening is an incentive metric for which CCOs [Coordinated Care Organizations] receive financial incentives when demonstrating improved rates of developmental screening in medical clinics. An additional positive influence on developmental screening with the communities is the creation of 16 Early Learning Hubs (ELHs) covering the entire state. These ELHs are community-based organizations charged with addressing health disparities among their respective populations of children birth to five years old. A focus of their work is promoting developmental screening in collaboration with their local health clinics.