39
EADS Roadshow presentation September 2010 Louis GALLOIS CEO

EADSRoadshow presentation
September 2010
Louis GALLOISCEO

2
Safe Harbour Statement
•Disclaimer•This presentation includes forward-looking statements. Words such as “anticipates”, “believes”, “estimates”, “expects”, “intends”, “plans”, “projects”, “may” and similar expressions are used to identify these forward-looking statements. Examples of forward-looking statements include statements made about strategy, ramp-up and delivery schedules, introduction of new products and services and market expectations, as well as statements regarding future performance and outlook. By their nature, forward-looking statements involve risk and uncertainty because they relate to future events and circumstances and there are many factors that could cause actual results and developments to differ materially from those expressed or implied by these forward-looking statements.•These factors include but are not limited to:•• Changes in general economic, political or market conditions, including the cyclical nature of some of EADS’ businesses;•• Significant disruptions in air travel (including as a result of terrorist attacks);•• Currency exchange rate fluctuations, in particular between the Euro and the U.S. dollar;•• The successful execution of internal performance plans, including cost reduction and productivity efforts; •• Product performance risks, as well as programme development and management risks;•• Customer, supplier and subcontractor performance or contract negotiations, including financing issues;•• Competition and consolidation in the aerospace and defence industry;•• Significant collective bargaining labour disputes;•• The outcome of political and legal processes, including the availability of government financing for certain programmes and the size of defence and space
procurement budgets; •• Research and development costs in connection with new products;•• Legal, financial and governmental risks related to international transactions;•• Legal and investigatory proceedings and other economic, political and technological risks and uncertainties.•As a result, EADS’ actual results may differ materially from the plans, goals and expectations set forth in such forward-looking statements. For a discussion of factors that could cause future results to differ from such forward-looking statements, see EADS’ “Registration Document” dated 22nd April 2009.•Any forward-looking statement contained in this presentation speaks as of the date of this presentation. EADS undertakes no obligation to publicly revise or update any forward-looking statements in light of new information, future events or otherwise.

H1 Financials
Profitability drivers
Guidance 2010

4
Business & Financial Highlights: H1 2010
* Pre-goodwill impairment and exceptionals
• Business Highlights• Signs of improvement in commercial aircraft environment; orders and commitments for 255 aircraft at
Farnborough; Single Aisle rate increase to 38 aircraft per month in Q3 2011 and 40 in Q1 2012;• Deliveries: 250 commercial aircraft, 249 helicopters; 37th consecutive success for Ariane 5;• Order book: € 454 bn at H1 2010 of which Defence € 56.6 bn;• A400M:
– Working towards a contract amendment; management assumptions for the provision remain valid;– Flight test programme results better than expected; Flight Management System on the critical path.
• EADS North America: bid submitted for US Air Force Tanker.
• Financial Highlights• Revenues € 20.3 bn, of which € 13.9 bn for Airbus; • EBIT* before one-off: € 0.6 bn for EADS, € 0.3 bn for Airbus; • Net cash: € 8.9 bn after pension contributions of € 0.3 bn;
– Free Cash Flow consumption of € 0.7 bn; customer financing cash outflow € 0.3 bn;– Receipts from governments for development programs compensate payment delays.
• Net income € 0.2 bn.
5
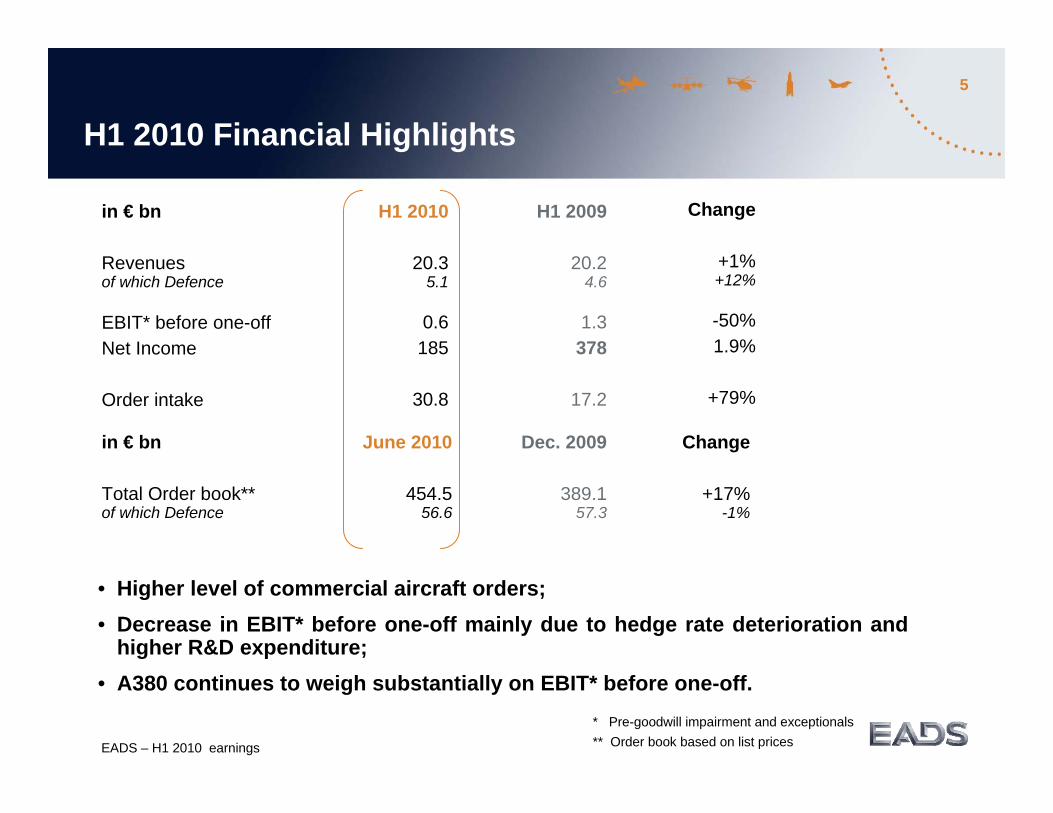
H1 2010 Financial Highlights
EADS – H1 2010 earnings
* Pre-goodwill impairment and exceptionals** Order book based on list prices
in € bn
Revenuesof which Defence
EBIT* before one-offNet Income
Order intake
H1 2009
20.24.6
1.3378
17.2
in € bn
Total Order book**of which Defence
June 2010
454.556.6
Dec. 2009
389.157.3
Change
+17%-1%
• Higher level of commercial aircraft orders; • Decrease in EBIT* before one-off mainly due to hedge rate deterioration and
higher R&D expenditure;• A380 continues to weigh substantially on EBIT* before one-off.
H1 2010
20.3 5.1
0.6185
30.8
Change
+1% +12%
-50%1.9%
+79%

6
Currency Hedge Policy
Mark-to-market value = € - 6.2 bn
€ vs $*** 1,37 1,38 1,37 1,39 1,40 1,41£ vs $ 1,73 1,75 1,63 1,58 1,59 1,63
EADS hedge portfolio, 30th June 2010($ 70.1 bn*), average rates of € 1 = $ 1.38*** and £ 1 = $ 1.67
• Approximately 50% of EADS’ US$ revenues naturally hedged by US$ procurement;• In H1 2010, hedges of $ 9.4 bn* matured at an average hedge rate of € 1 = $ 1.34; • In H1 2010, new hedge contracts of $ 20.6 bn** were added at an average rate of € 1= $ 1.34***.
Average hedge rates
Remaining6 months
7,3
0,80,4
9,0
19,2 18,0
11,9
4,7
0
5
10
15
20
2010 2011 2012 2013 2014 2015+
US$ bn Collars
Forward contracts
* Total hedge amount also contains $/ £ hedges** Includes $ 1.9 bn of options restructuring*** includes Collars at their least favourable rates

H1 Financials
Profitability drivers
Guidance 2010

8
Air traffic is recovering strongly
Source: ICAO, IATA, ATA, AEA, Airbus (March 2010)
• High correlation between air traffic growth and GDP growth• August 2010: Traffic above pre-crisis level; approx. 2 years of growth lost• Strong ramp-up of premium traffic
World Real GDP and passenger traffic(year-over-year)
Premium traffic growth

9
Deliveries have been stable, even during Down Turn
Stability achieved mainly due to:
High backlog level (3,355 units, 454.5 bn€ as of H1 2010)Proactive backlog management
Active Monitoring of Airbus & Eurocopter customers and suppliersActive Delivery Planning:
- Strict process of aircraft delivery allocations- Active management of delivery deferrals- Flexibility of production rate to match market needs

10Development of Air Traffic Growth driven by Expanding Regions (85% of Growth Impact)…
* Asia without Japan, China und India
Source: Airbus market reasearch
projection (RPK‘s)

11
Data end December 2009 *Includes Indian sub-Continent **includes Private, Military and other aircraft
Backlog development:• 3,488 aircraft at end of Dec 2009 versus 1,628 aircraft at end of December 2000• Significant improvement in geographical backlog distribution since previous cycles
……Corresponds with the Improved Airbus Backlog Balance, especially in the Growth Regions
North America274 (8%)426 (26%)
Europe637 (19%)317 (19%)
Middle East477 (14%)
31 (2%)
China345 (10%)
26 (2%)
Asia* / Pacific742 (21%)
58 (4%)
Africa89 (2%)17 (1%)Latin America
219 (6%)101 (6%)
Lessors564 (17%)650 (40%)
Other**141 (4%)
End December 2009End December 2000
12
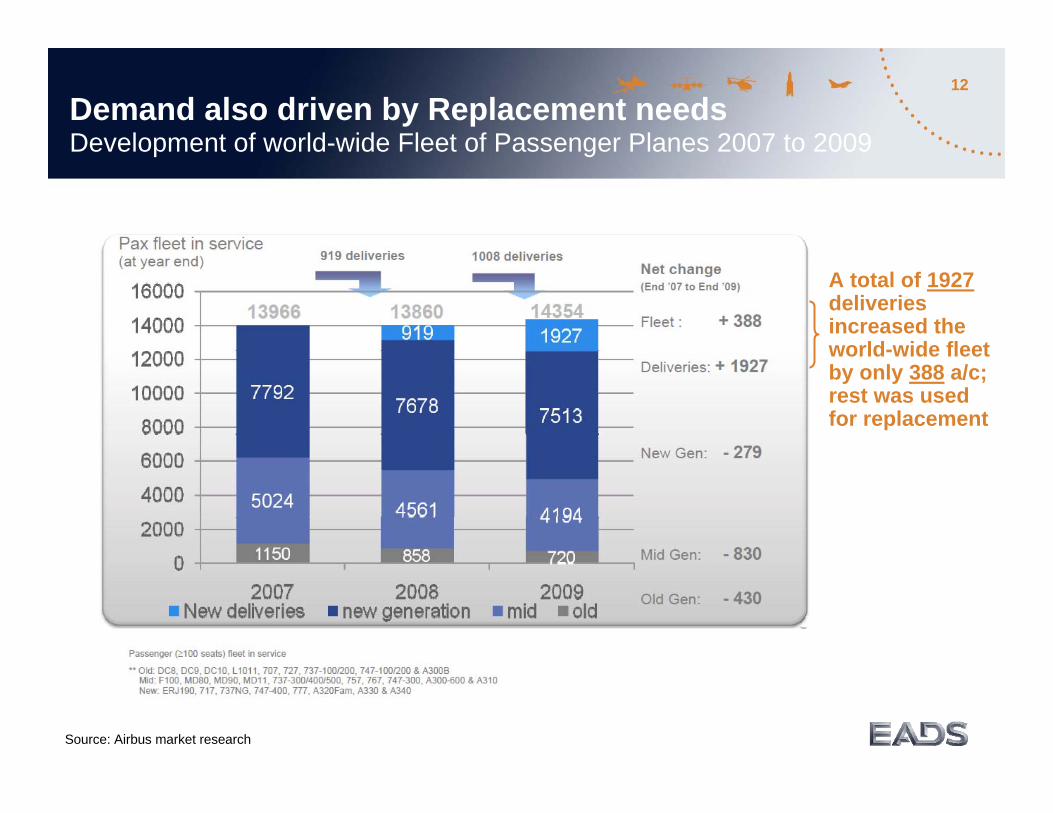
Demand also driven by Replacement needs Development of world-wide Fleet of Passenger Planes 2007 to 2009
Source: Airbus market research
A total of 1927deliveries increased the world-wide fleet by only 388 a/c; rest was used for replacement
13
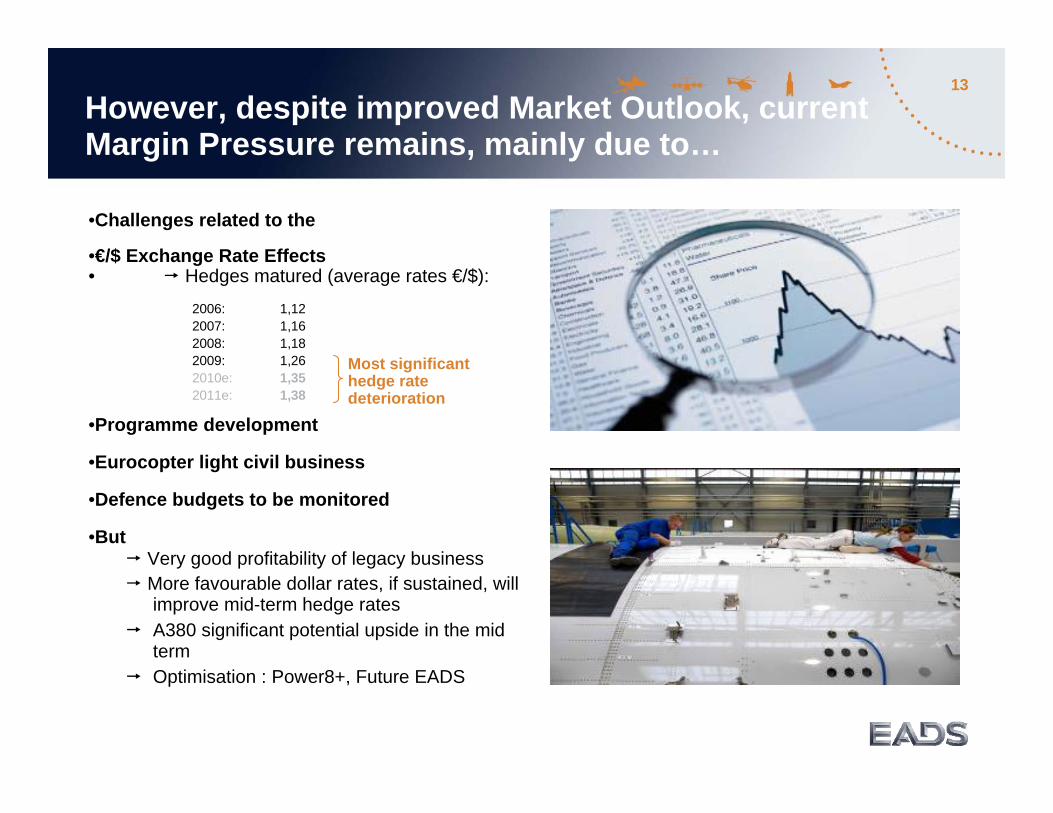
•Challenges related to the
•€/$ Exchange Rate Effects• Hedges matured (average rates €/$):
2006: 1,122007: 1,162008: 1,182009: 1,262010e: 1,352011e: 1,38
•Programme development
•Eurocopter light civil business
•Defence budgets to be monitored
•But Very good profitability of legacy business More favourable dollar rates, if sustained, will
improve mid-term hedge rates A380 significant potential upside in the mid
term Optimisation : Power8+, Future EADS
Most significant hedge rate deterioration
However, despite improved Market Outlook, current Margin Pressure remains, mainly due to…

14
•A400M• Working towards a contract amendment; management assumptions for the provision
remain valid• Maiden flight Dec. 11th, 2009; the A400M flight test program is progressing with the third
aircraft now added to the campaign.• Flight test program results better than expected; Flight Management System on the
critical path, more difficult than expected
•A380• In service with 5 customers; 30 aircraft delivered (as of H1 2010)• 32 new orders from Emirates• 20 deliveries planned for 2010; 7 delivered in H1 2010 (13 delivered YtD)• The program is stabilizing, and the learning curve is progressing
•A350• 530 firm orders; 33 customers (as of H1 2010)• „Detailed Design-Freeze“ end of 2008; production for the
1st test aircraft started• Entry into service 2013 • Challenging but lessons learnt from A380 and A400M implemented (e.g. value
management, modular interior design, etc.)
Major Program Updates AirbusA400M, A380, A350

H1 Financials
Profitability drivers
Guidance 2010

16
Guidance 2010
Commercial Cycle• Airbus gross orders above 400 at the end of 2010;• Eurocopter civil market and related order stream sluggish;• Airbus deliveries around 500; Eurocopter slightly below the 2009 level.
At €1: $1.35
Revenues• EADS revenues more than € 44 bn.
EBIT* before one off• Thanks to a higher number of expected deliveries and an upside to our underlying profitability, EADS EBIT* before one-off
should reach around 1.2 billion in 2010. • At Airbus, H2 EBIT* before one-off will be lower than in H1. Compared to H1, the positive impact of higher volumes and
better pricing will be more than offset by higher R&D and the deterioration of hedge rates compared to the first half of the year.
EBIT*• Going forward, the EBIT* performance of EADS will be dependent on the Group’s ability to execute on the A400M, A380
and A350 programs, in line with the commitments made to its customers. • At €1 / $1.35, EADS maintains its EBIT* guidance of around € 1 billion despite the negative exceptional impacts from
foreign exchange accrued in H1.
Free Cash Flow• Provided a sustainable year end cash inflow of institutional and government business and subject to pre delivery payment
advances for the A400M programme, the Free Cash Flow before customer financing should be break even. Free cash-flow after customer financing should be negative due to customer financing cash-outflows of around 600 million euros.
* Pre-goodwill impairment and exceptionals
Appendix

18
H1 2010 EBIT* Before One-off
* Pre-goodwill impairment and exceptionals
in € bn
EBIT* before one-off 2010% Revenues
One-off impacts:
• Eurocopter one time effects include a charge and margin adjustment for NH90, restructuring and KUH technical milestone recognition
• Currency effect from revaluation of Loss Making Contract provisions A380, A350 (€ +0.04 bn), A400M (€ -0.15 bn)
• $ PDP mismatch and balance sheet revaluation
• Other one-off
EBIT* Reported
AirbusDivision
0.261.9 %
(0.11)
(0.10)
0.05
0.10
EADSGroup
0.643.2 %
(0.07)
(0.11)
(0.10)
0.05
0.41

19
in € bn
EBIT* before one-off 2009% Revenues (excl. A400M recoverable part of the costs: € 295 m)
One-off impacts:
• Impact of A400M Early Stage Accounting**
• Revaluation of all LMCs ($ and £)***
• $ PDP reversal and balance sheet revaluation
EBIT* Reported
H1 2009 EBIT* Before One-off
* Pre-goodwill impairment and exceptionals** After currency impact: € - 191 m*** Including negative one-off impact € - 26 m from change in revaluation at compounded rate
AirbusDivision
0.916.6%
(0.08)
(0.06)
(0.25)
0.52
EADSGroup
1.286.4%
(0.08)
(0.06)
(0.25)
0.89
20
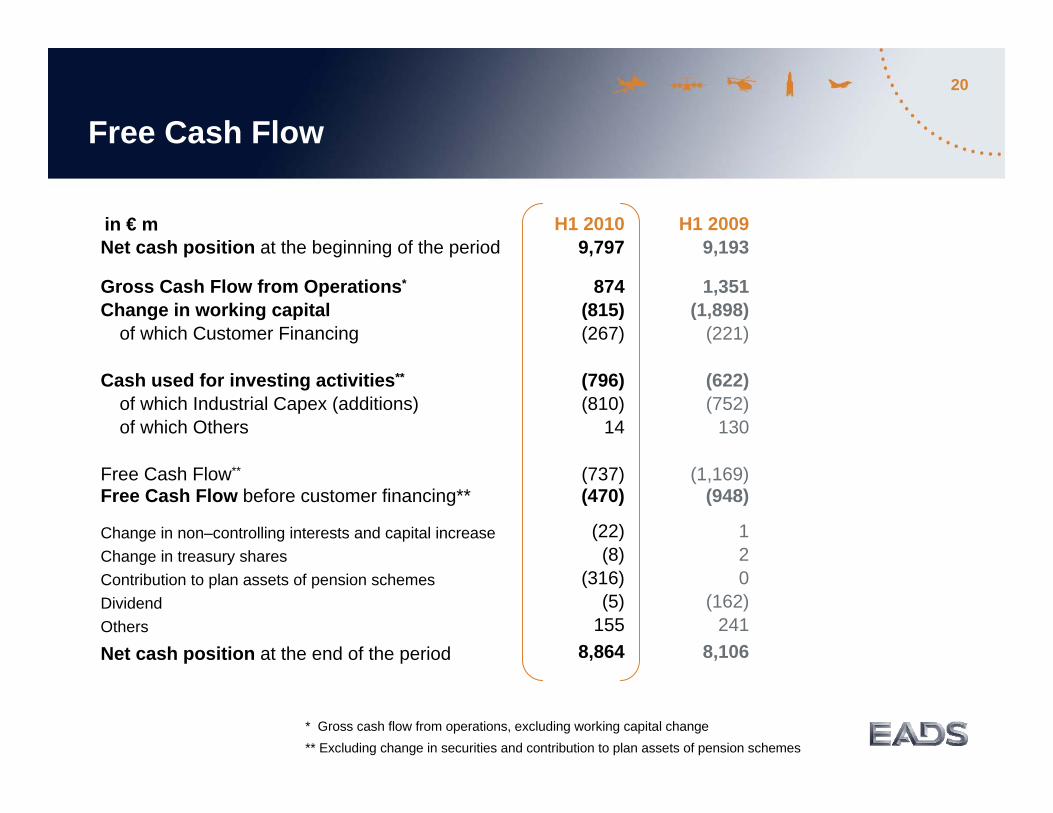
* Gross cash flow from operations, excluding working capital change** Excluding change in securities and contribution to plan assets of pension schemes
Free Cash Flow
874(815)(267)
(796)(810)
14
(737)
in € mNet cash position at the beginning of the period
Net cash position at the end of the period
Change in non–controlling interests and capital increaseChange in treasury sharesContribution to plan assets of pension schemesDividendOthers
8,864
Free Cash Flow before customer financing** (948)(470)
8,106
H1 20099,193
H1 20109,797
1,351(1,898)
(221)
(622)(752)
130
(1,169)
Gross Cash Flow from Operations*
Change in working capitalof which Customer Financing
Cash used for investing activities**
of which Industrial Capex (additions)of which Others
Free Cash Flow**
120
(162)241
(22)(8)
(316)(5)
155

21
42% LR
32% SA
0% Europe
23% Asia Pacific
0% Leasing
* Pre-goodwill impairment and exceptionals** Capitalized R&D: € 24 m in H1 2010 and € 29 m in H1 2009 *** Commercial a/c valued at list prices, excl. freighter conversions
Airbus Division
€ m
DeliveriesRevenuesR&D self-financed**
in % of revenuesEBIT*in % of revenuesOrder book***
in units***
Net orders***
H1 2010
259 a/c13,951
9376.7% 519
3.7%343,584
Gross Orders by Programme
Gross Ordersby Region
Segment
H1 2010
254 a/c13,204
9307.0%737
5.6%323,497
3,529
250 a/c12,965
1,0217.9%241
1.9%385,677
3,355
117 a/c
H1 2009restated
H1 2010
5 a/c855
70.8%
(218)
21,680256
9 a/c1,007
30.3%
(161)
20,773243
2 a/c
Airbus Division (after interco elimination)
Airbus Commercial(excl. A400M)
Airbus Military(Former MTAD, incl. A400M)
258 a/c13,8531,024
7.4%104
0.8%405,027
32% Middle East
14% RoWx% Tanker
H1 2009restated
H1 2009
20% North America
b)
a) Green aircraft delivered to Airbus Militaryb) 245 aircraft with revenue recognition
8% Europe
3% Leasing
24% LA
2% M&L
a)

22
Airbus Division
Airbus Commercial (excl. A400M)
Revenues stable• 5 SA aircraft delivered under operating lease;• Favorable mix effect;• Impact from fx (€ - 0.8 bn).
EBIT* -67% • Small positive pricing impact net of escalation; • Impact from fx effects (€ - 0.5 bn) see slide 23;• Higher R&D driven by the A350 program;• A380 continues to weigh on underlying performance.
Airbus Military (incl. A400M)
Revenues +18%• A400M Revenue recognition stable with H1 09 (€ 0.3 bn); • Higher Tanker activity and Medium and Light deliveries.
Key Achievements• Farnborough: 133 firm orders, 122 MoU; ILA: 32 firm orders, 35 MoU;
• Decision to ramp up Single Aisle production;• Progress on A400M, A350 and A330 MRTT developments.
* Pre-goodwill impairment and exceptionals
EBIT* • Positive impact from volume and mix;• 2010 A400M related costs:
– Currency effect on A400M (€ - 0.15 bn);– Under recovery of fixed costs (€ - 0.03 bn).

23
Eurocopter
Market • Commercial market remains uncertain: 140 net orders, stable with
H1 09. Cancellation trend slowing;• 249 h/c deliveries, including 13 NH90 and Tiger, +10
compared to H1 09;• 2010 deliveries now expected to be only slightly below 2009;
decline shifted to 2011 due to low number of orders.
Revenues +11%• Higher deliveries; • Favourable phasing of support revenues, progress on Korean
Utility Helicopter (KUH).
EBIT* -28%Favourable volume and mix offset by:• NH90 charge and margin adjustment € - 50 m;• Restructuring charge € - 40 m; • One off KUH technical milestone € + 24 m;• Higher R&D investment.
Key achievements• NH90 progressing:
– 1st NFH Step A deliveries: 1 to France, 1 to the Netherlands;– Oman received its first 2 TTH deliveries.
• Tiger: 1,000 flight hours in Afghanistan, with high operational reliability.
€ m
RevenuesR&D self-financed**in % of revenuesEBIT*in % of revenuesOrder bookin units
H1 2009H1 2010
1,90878
4.1%99
5.2%14,167
1,420
2,10994
4.5%71
3.4%14,7401,194
* Pre-goodwill impairment and exceptionals** Capitalised R&D: € 12 m in H1 2010 and € 13 m in H1 2009
38% Product SupportCustomer Services
11% Dev. & other
51% Serial Helicopters
55% Civil
Revenue split45% Defence
based on H1 2010 EADS external revenues

24
Astrium
€ m
RevenuesR&D self-financedin % of revenuesEBIT*in % of revenuesOrder book
H1 2009H1 2010
2,19432
1.5%99
4.5%15,597
2,11031
1.5%106
5.0%15,524
* Pre-goodwill impairment and exceptionals
47% Civil
53% Defence
Revenue split
Revenues -4%• Positive contribution from defence and telecom services;• H1 09 included one-time catch up effect for in-orbit incentive
schemes (€ + 0.2 bn).
EBIT* +7%• Productivity and ramp up in defence activities;• Higher volume in military telecommunication services;• Lower volume in earth observation services.
Order Intake € 2.7 bn• Momentum in commercial and institutional satellites:
– 2 Eurostar E3000 orders for Eutelsat & SES World Skies;
– 2 earth observation satellites for KGS Kazakhstan.
Key Achievements• Strong program execution:
– 37th consecutive launch success for Ariane 5;– 6 satellite launches in 5 weeks: 3 telecom and 3 earth
observation.based on H1 2010 EADS external revenues
55% Satellites
thereof 44% Services
45% Space transportation
25
90% Defence
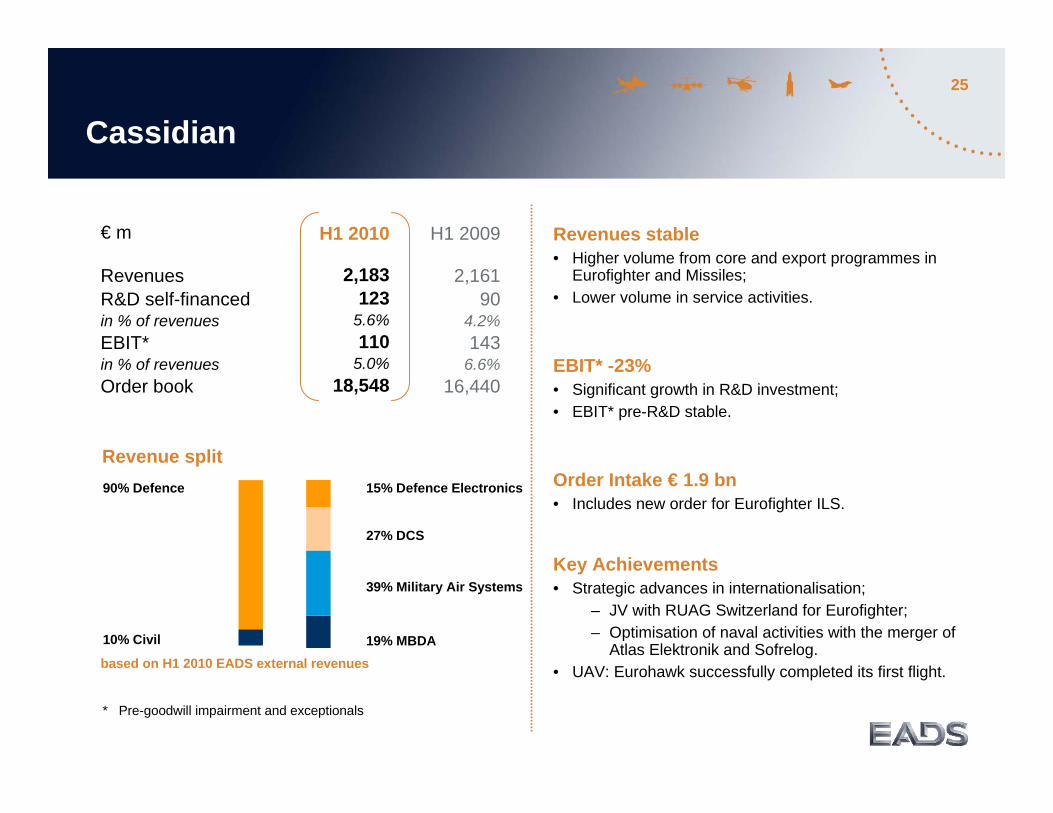
Cassidian
€ m
RevenuesR&D self-financedin % of revenuesEBIT*in % of revenuesOrder book
H1 2009H1 2010
2,16190
4.2%143
6.6%16,440
2,183123
5.6%110
5.0%18,548
* Pre-goodwill impairment and exceptionals
based on H1 2010 EADS external revenues
15% Defence Electronics
Revenue split
19% MBDA
39% Military Air Systems
27% DCS
10% Civil
Revenues stable• Higher volume from core and export programmes in
Eurofighter and Missiles;• Lower volume in service activities.
EBIT* -23%• Significant growth in R&D investment;• EBIT* pre-R&D stable.
Order Intake € 1.9 bn• Includes new order for Eurofighter ILS.
Key Achievements• Strategic advances in internationalisation;
– JV with RUAG Switzerland for Eurofighter;– Optimisation of naval activities with the merger of
Atlas Elektronik and Sofrelog.• UAV: Eurohawk successfully completed its first flight.

26
Other Businesses
€ m
RevenuesR&D self-financedin % of revenuesEBIT*in % of revenuesOrder book
H1 2009H1 2010
4802
0.4%2
0.4%2,139
5542
0.4%0
2,007
* Pre-goodwill impairment and exceptionals
74% Civil
Revenue split
28% EADS NA
21% Sogerma26% Defence
51% ATR
Revenues +15%• Higher deliveries and asset management activity at ATR;• Lower aerostructures revenues at Sogerma;• LUH ramp-up with 22 deliveries in H1 10.
EBIT* breakeven• Positive contribution from Sogerma offset by a negative
foreign exchange impact at ATR.
ATR • Market improving, 31 firm orders and 30 options
recorded at Farnborough, but the financing environment remains difficult;
• 27 deliveries in H1 10 vs. 21 in H1 09; • H1 10: 11 ATR-72 net orders, ATR total backlog 117 a/c.
North America• Bid submitted for US Air Force Tanker;• 3 Armed Aerial Scout (AAS) demonstration aircraft to be
built with American Eurocopter and Lockheed Martin.
based on H1 2010 EADS external revenues

27
Refinement of natural hedging strategy Trade Liabilities
•Natural hedging strategy further refined in line with IFRS, impacting reported EBIT* and other financial result but with no impact on EBIT* before one-off and net income.
•A natural hedge relationship is identified since April 1, 2010 between the USD denominated trade payables and USD treasury swaps.
•Under the natural hedge relationship established in the second quarter 2010 both the revaluation gains and losses on the hedged trade liabilities and credit notes on one side and the offsetting changes of the foreign exchange rate swaps involved in the hedge on the other side are recorded in reported EBIT*.
•The foreign currency revaluation of USD treasury swaps therefore recorded in reported EBIT* instead of other financial result is a net gain of € +186 M as of June 30, 2010.
* Pre-goodwill impairment and exceptionals

28
• Significant part of A400M USD costs:
• EADS separates derivatives with a nominal amount of 1.4 billion USD, embedded in supplier host contracts which relate to the A400M programme.
• Changes in the fair value of these embedded derivatives in the amount of € -178 M are recognisedin other financial result of the first half-year 2010.
• Refinement of natural hedging strategy:
• In this respect, a natural hedge relationship between 0.9 billion USD of forward purchase of USD and A400M USD costs is taken into account since January 1, 2010.
• Under this natural hedge relationship, both the revaluation gains and losses on the USD costs in the A400M contract on one side and the offsetting changes of the USD forward instruments involved in the natural hedge on the other side are presented in reported EBIT*.
* Pre-goodwill impairment and exceptionals
Revaluation of A400M provision with USD costs

29
• Revaluation of Airbus Commercial LMC provisions • Revaluation of Airbus Military A400M provision• Deterioration of hedge rates (€ : $ 1.22 to 1.34)
out of which Airbus
• Other one-off forex effect including PDP reversal
Compared to H1 2009out of which Airbus
(0.55)(0.52)
BRIDGE
(0.01)(0.04)(0.65)~(0.62)
0.15
Forex impact on EBIT* ( in € bn )
H1 2010 Forex EBIT* Impact Bridge

30
H1 2010 Financial Highlights
H1 2009 in % of
Revenues€ m€ m
H1 2010 in % of
Revenues
Revenuesself-financed R&D**EBITDA*EBIT* EBIT* before R&D
20,3081,3011,148
4061,707
6.4%5.7%2.0%8.4%
20,1951,1721,663
8882,060
5.8%8.2%4.4%
10.2%
Net incomeEPS***
185€ 0.23
0.9% 378€ 0.47
1.9%
8,864 8,106Net Cash positionat the end of the periodFree Cash Flow
* Pre-goodwill impairment and exceptionals** IAS 38: € 42 m capitalized during H1 2010; € 44 m capitalized during H1 2009*** Average number of shares outstanding: 810,848,870 in H1 2010; 810,058,069 in H1 2009
(737) (1,169)
31
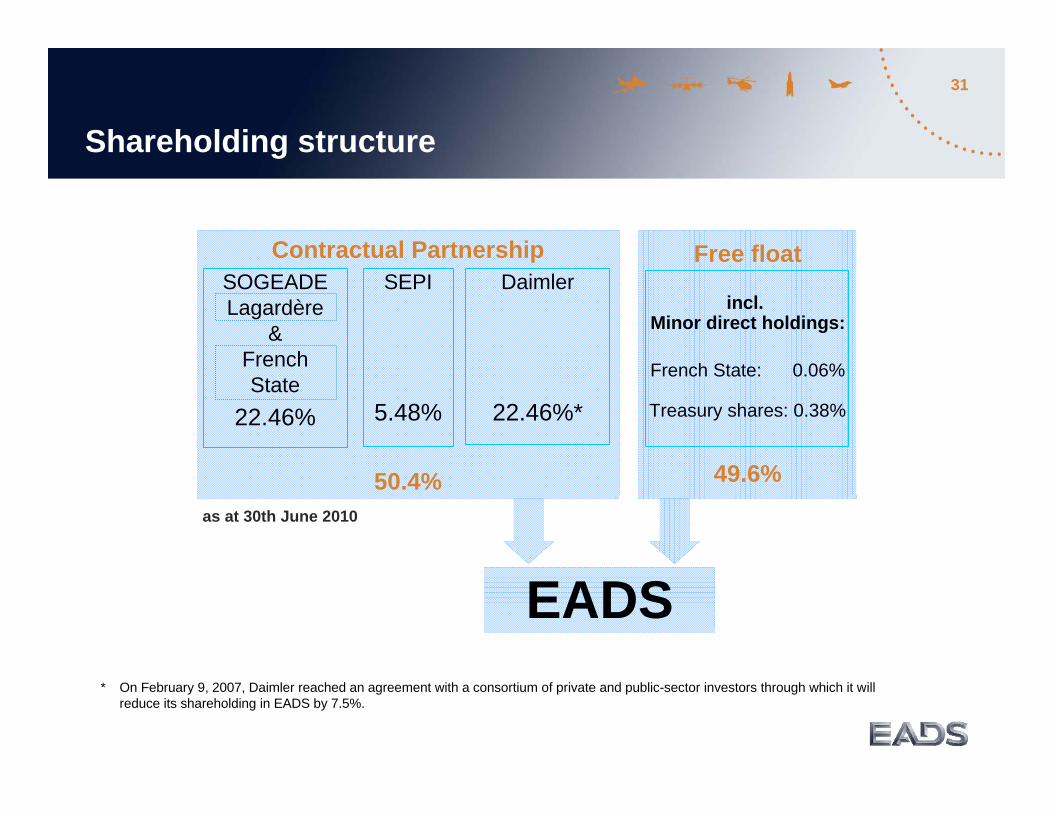
Free float
incl. Minor direct holdings:
French State: 0.06%
Treasury shares: 0.38%
49.6%
Shareholding structure
* On February 9, 2007, Daimler reached an agreement with a consortium of private and public-sector investors through which it will reduce its shareholding in EADS by 7.5%.
as at 30th June 2010
Contractual Partnership
50.4%
SOGEADELagardère
&FrenchState
22.46%
Daimler
22.46%*
EADS
SEPI
5.48%

32
1,26
1,35
1,191,25
1,29
1,33
1,381,36
1,32
1,35
1,10
1,20
1,30
1,40
1,50
Q1 Q2 Q3 Q4 FY
2009 Average FY 2009 2010e Average FY 2010e
Expected EADS Average Hedge Rates € vs. $
Average hedge rates

33
Provision Consumption excluding A400M As at 31 Dec. 2009
0
1
2
3
Closing 2009 < 2013 2013‐ 2014 > 2014
in Bn €
Restructuring Provisions Liquidated Damages LM C

34
Additions and Disposalsto Airbus customer financing gross exposure in $ bn
1.40.9
(0.2)
0.40.6
1.50.6
0.30.80.41.0
1.50.5
(1.0) (0.9) (0.2) (0.2)
(2.9)
(1.1) (0.2) (0.7) (0.7)
(2.2) (1.3) (0.1)
(0.1) (0.1)
(0.1)
(0.2)
(0.2)
(0.1)
(0.2) (0.3)
(0.3) (0.2)
1999 2000 2001 2002 2003 2004 2005 2006 2007 2008 2009 Jun-10
Additions Sell Down Amortisation
-3.5
-2.5
-1.5
-0.5
0.5
1.5
2.5
Net change
Airbus Customer Financing
Estimated Collateral
€ 1.1 bn
Gross exposure in $ bn
Gross
Exposure
€ 1.7 bn
($ 2.1 bn)
Net Exposure€ 0.6 bn
Net Exposure fully provisioned
30th June 2010
Active exposure management
4.3 3.9 3.1 3.8 4.8 4.6 3.8 1.8 1.5 1.5 1.8 2.1

35
EADS: Strong Liquidity Position as at 30 June 2010
€ 13.5 bn
Total Gross Cash
• Maturity 2012• Undrawn• Fully committed by 32 banks• No financial covenants• No MAC clause
€ 8.9 bn
Net Cash
€ 3.0 bn
Credit Facility
Invested in highly rated securities
€ 4.6 bn
Financing Liabilities(incl. € 1.5 bn liabilities of EMTN)
EMTN progamme• Long term rating : A1 / BBB+• CDS in line with its rating/sector

36
Orders at Farnborough Airshow
Aircraft Number Type of Contract Volume (in bn) Date
Air Lease Cooperation ALC A321 20 Firm Order 19.07.2010
Air Lease Cooperation ALC A320 31 Firm Order 19.07.2010
GE Capital Aviation Services GECAS A320 60 Firm Order 4,90$ 19.07.2010
Aeroflot A330-300 11 Firm Order 2,30$ 19.07.2010
Germania S.A.T. A319 5 Firm Order 0,37$ 21.07.2010
Garuda Indonesia A330-200 6 Firm Order 1,20$ 21.07.2010
LAN LAN A320 40 MoU 20.07.2010
LAN LAN A321 10 MoU 20.07.2010
Hong Kong Airlines A350 XWB 15 MoU 3,80$ 20.07.2010
Hong Kong Airlines A330 10 MoU 1,90$ 20.07.2010
Thai Airways International THAI A330-300 7 MoU 1,50$ 21.07.2010
Virgin America A320 40 MoU 3,30$ 22.07.2010
RBS Aviation A320 52 Confirmation of prior announcement 4,30$ 21.07.2010
Aviation Lease & Finance Company ALAFCO A350-900 12 Conversion Order (from A350-800) 21.07.2010
Total* 255 27,87$
t/o total of firm orders 133 13,17$
t/o total of MoU's 122 14,70$ Total of Confirmation of Prior Announcements 52 4,30$
Total of conversion orders 12
Total* 159 15,00$
t/o total of firm orders 156 14,50$
t/o total of MoU's 3 0,50$ Total of Confirmation of Prior Announcements 90 12,02$
Total of order options 6 0,50$
*conversion order, order options & conf. of prior announcements not included
Company/Airline
4,40$
4,20$
111 Firm ordersworth $ 9,8 bnfrom Leasing Companies (not including the RBS confirmation order of 52 a/c)
t/o 94 Firm ordersworth $ 7,0 bnfrom Leasing Companies

37
•Mainly a Sales/Production matching solver•Selective and disciplined policy to limit net exposure intake•Only for selected airlines and based on market price•Only if there are no other financing alternatives available•Selldown of the customer financing exposure as soon as there is an opportunity•Tight control by Airbus over future financing commitments, exposure intake and sell-downs
•ECA support provided 21 Bn$ financing in 2009 (+68% vs. 2008)ECA support
ManufacturerSupport (shared withenginemanufacturers)
Customer Financing and ECA Support
ECA34%ECA34%

38
Efficiency and IntegrationStatus as of YE 2009
•Power 8: € 2.0 bn gross savings in Airbus completed by end 2009, compared to projected cost base.
– ROC: ~8,000 overhead positions reduced 2009; less costly than expected; restructuring provision adjusted € +140 m; working on 2,000 positions to be reduced in 2010;
– Supply chain streamlining and logistics integration;– Lean manufacturing implemented across all sites.
•Power 8+: € 1.0 bn gross annual savings at EADS targeted for end 2012, compared to projected cost base, now starting.
– Airbus: Continue Power 8 efforts; Redesign implementation SA / LR; Subcontracting engineering off-shoring; more low cost dollar zone sourcing;
– Eurocopter: Lead time reduction, enhanced productivity;– Astrium and Cassidian: Engineering optimization, production flow management, procurement improvement.
•Future EADS: € 350 m gross annual savings targeted for end 2012, compared to projected cost base.
– Savings will be achieved through simplification, harmonization and integration of support functions;– 700 people working on 120 projects – for details see slide 25 in appendix;– Integration and Co-ordination:
– Airbus Military: optimization of program management and resource allocation;– Co-ordination of Space and Defence: creation of Centre of Excellence electronics manufacturing and manufacturing-related engineering.
– After Non Recurring Cost impact, net EBIT* impact neutral in 2010, slightly positive in 2011.
* Pre-goodwill impairment and exceptionals
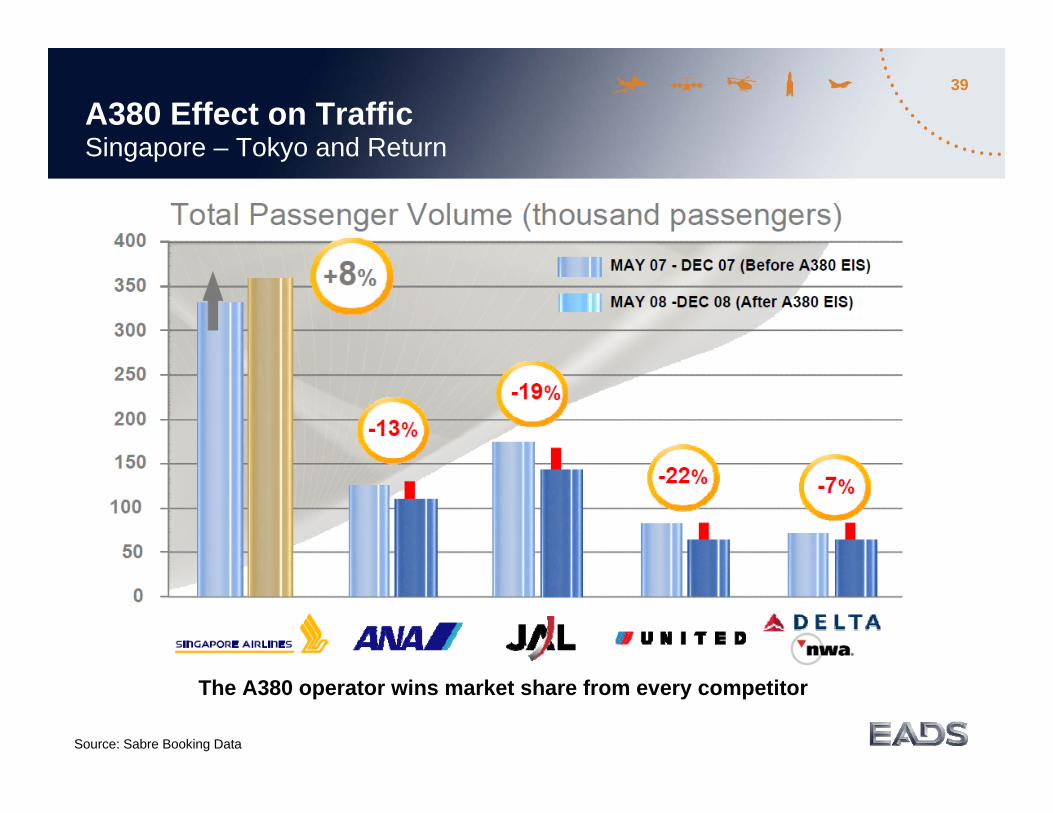
39
A380 Effect on TrafficSingapore – Tokyo and Return
The A380 operator wins market share from every competitor
Source: Sabre Booking Data


