EAE/ASE RECOMMENDATIONS EAE/ASE Recommendations for Image Acquisition and Display Using Three-Dimensional Echocardiography Roberto M. Lang, MD, FASE * ‡ , Luigi P. Badano, MD, FESC †‡ , Wendy Tsang, MD * , David H. Adams, MD * , Eustachio Agricola, MD † , Thomas Buck, MD, FESC † , Francesco F. Faletra, MD † , Andreas Franke, MD, FESC † , Judy Hung, MD, FASE * , Leopoldo Pe ´rez de Isla, MD, PhD, FESC † , Otto Kamp, MD, PhD, FESC † , Jaroslaw D. Kasprzak, MD, FESC † , Patrizio Lancellotti, MD, PhD, FESC † , Thomas H. Marwick, MBBS, PhD * , Marti L. McCulloch, RDCS, FASE * , Mark J. Monaghan, PhD, FESC † , Petros Nihoyannopoulos, MD, FESC † , Natesa G. Pandian, MD * , Patricia A. Pellikka, MD, FASE * , Mauro Pepi, MD, FESC † , David A. Roberson, MD, FASE * , Stanton K. Shernan, MD, FASE * , Girish S. Shirali, MBBS, FASE * , Lissa Sugeng , MD * , Folkert J. Ten Cate, MD † , Mani A. Vannan , MBBS, FASE * , Jose Luis Zamorano, MD, FESC, FASE † , and William A. Zoghbi, MD, FASE * From the University of Chicago, Chicago, Illinois (R.M.L., W.T.); University of Padua, Padua, Italy (L.P.B.); Mount Sinai Medical Center, New York, New York (D.H.A.); San Raffaele Hospital, Milan, Italy (E.A.); University Duisburg-Essen, Essen, Germany (T.B.); Fondazione Cardiocentro Ticino, Lugano, Switzerland (F.F.F.); Klinikum Region Hannover-Siloah, Hannover, Germany (A.F.); Massachusetts General Hospital, Boston, Massachusetts (J.H.); University Clinic San Carlos, Madrid, Spain (L.P.I., J.L.Z.); VU University Medical Center, Amsterdam, The Netherlands (O.K.); Medical University of Lodz, Lodz, Poland (J.D.K.); University of Liege, Liege, Belgium (P.L.); Cleveland Clinic, Cleveland, Ohio (T.H.M.); Methodist DeBakey Heart and Vascular Center, The Methodist Hospital, Houston, Texas (M.L.M., W.A.Z.); King’s College Hospital, London, United Kingdom (M.J.M); Imperial College, London, United Kingdom (P.N.); Tufts University Medical Center, Boston, Massachusetts (N.G.P.); Mayo Clinic, Rochester, Minnesota (P.A.P.); Centro Cardiologico Monzino, IRCCS, Milan, Italy (M.P.); The Heart Institute for Children, Oak Lawn, Illinois (D.A.R.); Harvard Medical School, Boston, Massachusetts (S.K.S.); Medical University of South Carolina, Charleston, South Carolina (G.S.S.); Yale University, New Haven, Connecticut (L.S.); Erasmus MC, Rotterdam, The Netherlands (F.J.T.C.); and ASE Writing Group, Morrisville, North Carolina (M.A.V.). ----------------------------------------------------------------------------------------------------------------------------------------------------------- Keywords Echocardiography † Two-dimensional † Three-dimensional † Transthoracic † Transesophageal Reprint requests: American Society of Echocardiography, 2100 Gateway Centre Boulevard, Suite 310, Morrisville, NC 27560 (E-mail: [email protected]). * Writing Committee of the American Society of Echocardiography. ‡ Drs. Lang and Badano contributed equally to this report. † Writing Committee of the European Association of Echocardiography. The following authors reported no actual or potential conflicts of interest in relation to this document: Eustachio Agricola, MD, Thomas Buck, MD, Judy Hung, MD, FASE, Leopoldo Perez de Isla, MD, PhD, FESC, Otto Kamp, MD, PhD, Patrizio Lancellotti, MD, PhD, FESC, Thomas H. Marwick, MBBS, PhD, Marti L. McCulloch, MBA, RDCS, FASE, Petros Nihoyan- nopoulos, MD, FESC, Mauro Pepi, MD, FESC, Wendy Tsang, MD, Jose Luis Zamorano, MD, FESC, FASE, and William A. Zoghbi, MD, FASE. The following authors reported relation- ships with one or more commercial interests: Roberto M. Lang, MD, FASE, lectured for Philips Ultrasound; Luigi P. Badano, MD, FESC, has received software and equipment from GE Healthcare and TomTec for research and testing purposes and is on the speakers’ bureau of GE Healthcare; David H. Adams, MD, serves as a consultant and inventor with royalties for Edwards Lifesciences; Andreas Franke, MD, FESC, received software and hardware support for research purposes from Philips, GE Healthcare, and Siemens; Jaroslaw D. Kasprzak, MD, FESC, has served as a speaker for GE Healthcare, Philips, and Siemens; Mark J. Monaghan, PhD, FESC, has served as a speaker and received research support from Philips, GE Healthcare, Siemens, and TomTec; Natesa G. Pandian, MD, has received equipment support and served as a speaker for Philips, Toshiba, and GE Healthcare; Stanton K. Shernan, MD, FASE, served as a speaker for Philips Healthcare; Girish S. Shirali, MBBS, FASE, served as a consultant, advisory board member, recipient of research grants, and lecturer for Philips Medical Systems; Folkert J. Ten Cate, MD, was a three-dimensional course director for a Philips teaching course; and Mani A. Vannan, MBBS, FASE, served on the speakers’ bureau and received research support and honoraria from Lantheus and Siemens. Attention ASE: Members: ASE has gone green! Visit www.aseuniversity.org to earn free continuing medical education credit through an online activity related to this article. Certificates are available for immediate access upon successful completion of the activity. Nonmembers will need to join ASE to access this great member benefit! Published on behalf of the European Society of Cardiology. All rights reserved. & The Authors 2012. For permissions please email: [email protected]European Heart Journal – Cardiovascular Imaging (2012) 13, 1–46 doi:10.1093/ehjci/jer316 at ESC Member (EJE) on February 1, 2012 http://ehjcimaging.oxfordjournals.org/ Downloaded from
Transcript
EAE/ASE RECOMMENDATIONS
EAE/ASE Recommendations for ImageAcquisition and Display Using Three-DimensionalEchocardiographyRoberto M. Lang, MD, FASE*‡, Luigi P. Badano, MD, FESC†‡, Wendy Tsang, MD*,David H. Adams, MD*, Eustachio Agricola, MD†, Thomas Buck, MD, FESC†,Francesco F. Faletra, MD†, Andreas Franke, MD, FESC†, Judy Hung, MD, FASE*,Leopoldo Perez de Isla, MD, PhD, FESC†, Otto Kamp, MD, PhD, FESC†,Jaroslaw D. Kasprzak, MD, FESC†, Patrizio Lancellotti, MD, PhD, FESC†,Thomas H. Marwick, MBBS, PhD*, Marti L. McCulloch, RDCS, FASE*,Mark J. Monaghan, PhD, FESC†, Petros Nihoyannopoulos, MD, FESC†,Natesa G. Pandian, MD*, Patricia A. Pellikka, MD, FASE*, Mauro Pepi, MD, FESC†,David A. Roberson, MD, FASE*, Stanton K. Shernan, MD, FASE*, Girish S. Shirali,MBBS, FASE*, Lissa Sugeng, MD*, Folkert J. Ten Cate, MD†, Mani A. Vannan, MBBS,FASE*, Jose Luis Zamorano, MD, FESC, FASE†, and William A. Zoghbi, MD, FASE*
From the University of Chicago, Chicago, Illinois (R.M.L., W.T.); University of Padua, Padua, Italy (L.P.B.); Mount Sinai Medical Center, New York, New York (D.H.A.); San RaffaeleHospital, Milan, Italy (E.A.); University Duisburg-Essen, Essen, Germany (T.B.); Fondazione Cardiocentro Ticino, Lugano, Switzerland (F.F.F.); Klinikum Region Hannover-Siloah,Hannover, Germany (A.F.); Massachusetts General Hospital, Boston, Massachusetts (J.H.); University Clinic San Carlos, Madrid, Spain (L.P.I., J.L.Z.); VU University Medical Center,Amsterdam, The Netherlands (O.K.); Medical University of Lodz, Lodz, Poland (J.D.K.); University of Liege, Liege, Belgium (P.L.); Cleveland Clinic, Cleveland, Ohio (T.H.M.);Methodist DeBakey Heart and Vascular Center, The Methodist Hospital, Houston, Texas (M.L.M., W.A.Z.); King’s College Hospital, London, United Kingdom (M.J.M); ImperialCollege, London, United Kingdom (P.N.); Tufts University Medical Center, Boston, Massachusetts (N.G.P.); Mayo Clinic, Rochester, Minnesota (P.A.P.); Centro CardiologicoMonzino, IRCCS, Milan, Italy (M.P.); The Heart Institute for Children, Oak Lawn, Illinois (D.A.R.); Harvard Medical School, Boston, Massachusetts (S.K.S.); Medical University of SouthCarolina, Charleston, South Carolina (G.S.S.); Yale University, New Haven, Connecticut (L.S.); Erasmus MC, Rotterdam, The Netherlands (F.J.T.C.); and ASE Writing Group,Morrisville, North Carolina (M.A.V.).
Reprint requests: American Society of Echocardiography, 2100 Gateway Centre Boulevard, Suite 310, Morrisville, NC 27560 (E-mail: [email protected]).
* Writing Committee of the American Society of Echocardiography.‡ Drs. Lang and Badano contributed equally to this report.† Writing Committee of the European Association of Echocardiography.
The following authors reported no actual or potential conflicts of interest in relation to this document: Eustachio Agricola, MD, Thomas Buck, MD, Judy Hung, MD, FASE, LeopoldoPerez de Isla, MD, PhD, FESC, Otto Kamp, MD, PhD, Patrizio Lancellotti, MD, PhD, FESC, Thomas H. Marwick, MBBS, PhD, Marti L. McCulloch, MBA, RDCS, FASE, Petros Nihoyan-nopoulos, MD, FESC, Mauro Pepi, MD, FESC, Wendy Tsang, MD, Jose Luis Zamorano, MD, FESC, FASE, and William A. Zoghbi, MD, FASE. The following authors reported relation-ships with one or more commercial interests: Roberto M. Lang, MD, FASE, lectured for Philips Ultrasound; Luigi P. Badano, MD, FESC, has received software and equipment from GEHealthcare and TomTec for research and testing purposes and is on the speakers’ bureau of GE Healthcare; David H. Adams, MD, serves as a consultant and inventor with royaltiesfor Edwards Lifesciences; Andreas Franke, MD, FESC, received software and hardware support for research purposes from Philips, GE Healthcare, and Siemens; JaroslawD. Kasprzak, MD, FESC, has served as a speaker for GE Healthcare, Philips, and Siemens; Mark J. Monaghan, PhD, FESC, has served as a speaker and received research supportfrom Philips, GE Healthcare, Siemens, and TomTec; Natesa G. Pandian, MD, has received equipment support and served as a speaker for Philips, Toshiba, and GE Healthcare;Stanton K. Shernan, MD, FASE, served as a speaker for Philips Healthcare; Girish S. Shirali, MBBS, FASE, served as a consultant, advisory board member, recipient of researchgrants, and lecturer for Philips Medical Systems; Folkert J. Ten Cate, MD, was a three-dimensional course director for a Philips teaching course; and Mani A. Vannan, MBBS,FASE, served on the speakers’ bureau and received research support and honoraria from Lantheus and Siemens.
Attention ASE: Members: ASE has gone green! Visit www.aseuniversity.org to earn free continuing medical education credit through an online activity related to this article.Certificates are available for immediate access upon successful completion of the activity. Nonmembers will need to join ASE to access this great member benefit!
Published on behalf of the European Society of Cardiology. All rights reserved. & The Authors 2012. For permissions please email: [email protected]
European Heart Journal – Cardiovascular Imaging (2012) 13, 1–46doi:10.1093/ehjci/jer316
1. IntroductionThree-dimensional (3D) echocardiographic (3DE) imaging representsa major innovation in cardiovascular ultrasound. Advancements incomputer and transducer technologies permit real-time 3DE acquisi-tion and presentation of cardiac structures from any spatial point ofview. The usefulness of 3D echocardiography has been demonstratedin (1) the evaluation of cardiac chamber volumes and mass, whichavoids geometric assumptions; (2) the assessment of regional left ven-tricular (LV) wall motion and quantification of systolic dyssynchrony;(3) presentation of realistic views of heart valves; (4) volumetric evalu-ation of regurgitant lesions and shunts with 3DE color Dopplerimaging; and (5) 3DE stress imaging. However, for 3D echocardiog-raphy to be implemented in routine clinical practice, a full understand-ing of its technical principles and a systematic approach to imageacquisition and analysis are required. The main goal of this documentis to provide a practical guide on how to acquire, analyze, and displaythe various cardiac structures using 3D echocardiography, as well aslimitations of the technique. In addition, this document describes thecurrent and potential clinical applications of 3D echocardiographyalong with their strengths and weaknesses.
2. Instrumentation
a. Fully Sampled Matrix-ArrayTransducersAn important milestone in the history of real-time 3D echocardi-ography was reached shortly after the year 2000, with the
development of fully sampled matrix-array transducers. Thesetransducers provided excellent real-time imaging of the beatingheart in three dimensions and required significant technologicaldevelopments in both hardware and software, including transducerdesign, microelectronic techniques, and computing.
Currently, 3DE matrix-array transducers are composed ofnearly 3,000 piezoelectric elements with operating frequenciesranging from 2 to 4 MHz and from 5 to 7 MHz for transthoracicechocardiographic (TTE) and transesophageal echocardiographic(TEE) imaging, respectively. These piezoelectric elements arearranged in a matrix configuration within the transducer andrequire a large number of digital channels for these fully sampledelements to be connected. To reduce both power consumptionand the size of the connecting cable, several miniaturized circuitboards are incorporated into the transducer, allowing partialbeam-forming to be performed in the probe. Additionally, devel-opments in transducer technology have resulted in a reducedtransthoracic transducer footprint, improved side-lobe suppres-sion, increased sensitivity and penetration, and the implementationof harmonic capabilities that can be used for both grayscale andcontrast imaging. The most recent generation of matrix transdu-cers are significantly smaller than the previous ones, and thequality of two-dimensional (2D) and 3D imaging has improvedsignificantly, allowing a single transducer to acquire both 2D and3DE studies.
3. Data AcquisitionCurrently, there are two different methods for 3DE data acquisi-tion: real-time or live 3DE imaging and electrocardiographicallytriggered multiple-beat 3DE imaging. Real-time or live 3DE refersto the acquisition of multiple pyramidal data sets per second in asingle heartbeat. Most ultrasound systems have real-time 3DEvolume imaging available in the following modes: live 3D narrowvolume, live 3D zoomed, live 3D wide angled (full volume), andlive 3D color Doppler. Although this methodology overcomesthe limitations imposed by rhythm disturbances or respiratorymotion (Figure 1), it is limited by poor temporal and spatialresolution.
In contrast, multiple-beat 3D echocardiography provides imagesof higher temporal resolution. This is achieved through multipleacquisitions of narrow volumes of data over several heartbeats(ranging from two to seven cardiac cycles) that are subsequentlystitched together to create a single volumetric data set(Figure 2). However, gated imaging of the heart is inherentlyprone to imaging artifacts created by patient or respiratorymotion or irregular cardiac rhythms.
Data Acquisition ModesSimultaneous Multiplane ModeSimultaneous multi-plane imaging is unique to the matrix arraytransducer and permits the use of a dual screen to simultaneouslydisplay two real-time images. The first image is typically a referenceview of a particular structure, while the second image or “lateralplane” represents a plane rotated 30 to 1500 from the referenceplane. Multiplane imaging in the elevation plane is also available.
Color flow Doppler imaging can also be superimposed onto the2D images.
Real-Time 3D Mode—Narrow SectorLive 3D using the matrix array transducer permits a real-timedisplay of a 300 x 600 pyramidal volume. While the size of thesector is usually insufficient to visualize the entirety of a singlestructure in any one imaging plane, the superior spatial and tem-poral resolution permits accurate diagnoses of complex patholo-gies while preserving optimal temporal resolution.
Focused Wide Sector—“ZOOM”The “ZOOM” mode permits a focused, wide sector view ofcardiac structures. It must be noted that enlarging the region ofinterest excessively will result in a further detrimental decreaseof the spatial and temporal resolution relative to real-time 3DE.
Full Volume—Gated AcquisitionThe full volume mode has the largest acquisition sector possible,which is ideal when imaging specific structures such as the mitralvalve or aortic root. This mode also has optimal spatial resolution,which permits detailed diagnosis of complex pathologies. As well, ithas high temporal resolution (.30 Hz). Similar to the real-time 3Dand the focused wide sector—“ZOOM” modalities, the gated fullvolume can also be rotated to orient structures such as valves inunique en face views. Furthermore, the full volume data set canbe cropped or multiplane transected to remove tissue planes inorder to identify components of valvular structures within thevolume or to visualize 2D cross-sectional x, y, and orthogonalplanes using off-line analysis software.
Full Volume with Color Flow DopplerWhen 3DE color flow Doppler imaging was first introducedusing a matrix array transducer, it could only be displayed usinga full volume, gated reconstruction technique. This required theincorporation/“stitching” of 7-14 individual pyramidal volumeslabs gated to the ECG, to create a 3D composite volume, inthe upper-end range of a 400 x 400 sector at a frame rate of15-25 Hz depending upon the selected line density. However,currently 3D color full volume can be acquired with less thanthe 7-14 individual gated volumes and the most recently devel-oped software allows acquisition of as low as 2 beats, albeit atthe cost of temporal resolution.
a. Challenges with 3DE Acquisition
Temporal Versus Spatial ResolutionThe main trade-off in 3DE imaging is between volume rate (i.e.,temporal resolution) and spatial resolution. To improve spatialresolution, an increased number of scan lines per volume (scanline density) is required, which takes longer to acquire andprocess and thereby limits the overall volume rate. Fortunately,imaging volumes can be adjusted in size (i.e., made smaller) toincrease volume rate while maintaining spatial resolution.Because of the frequent artifacts associated with gating, ultrasoundcompanies are developing real-time technology associated with
methods for improving the ultrasound system processing powerneeded to provide full volume (908 × 908) real-time 3DE datasets with adequate spatial and temporal resolution.
ECG Gating and Breath HoldGated data sets are most challenging in patients with arrhythmiasand/or respiratory difficulties. Figure 3 is an example of a 2D depic-tion of an artifact caused by gated 3DE acquisition. Note that thedata set shown in the left panel of Figure 3 appears to be free ofartifacts, whereas the image in the right panel has distinct stitchingartifacts. If the gated acquisition acquires sector slices in a sweepingmotion parallel to the reference image, then every image parallel tothe reference image will appear normal. Gating artifacts are mostprominent when the volumetric data set is viewed from a cutplane perpendicular to the sweep plane. Methods to minimizethe effects of gating artifacts are described in Table 1. As well,the ECG tracing needs to be optimized to obtain a distinct Rwave. Because the most frequent artifacts of gated acquisitionsare stitching artifacts, the number of acquisition beats should betailored to the clinical question to be addressed, taking intoaccount that with more beats, the volume will be wider and thetemporal resolution higher. To improve spatial resolution (i.e.,the number of scan lines per volume), the pyramidal volumeshould be optimized to acquire the smaller volume able to encom-pass the cardiac structure of interest. Before 3DE acquisition, the2D image should be optimized: “suboptimal 2D images result insuboptimal 3DE data sets.”1
3D OptimizationLow gain settings result in echo dropout, with the potential ofartificially eliminating anatomic structures that cannot be recoveredduring postprocessing. Alternatively, with excess gain, there is a de-crease in resolution and a loss of the 3D perspective or depth withinthe data set. As a general rule, both gain and compression settingsshould be set in the midrange (50 units) and optimized with slightlyhigher time gain controls (time gain compensation) to enable thegreatest flexibility with postprocessing gain and compression.Table 1 illustrates the issue of overgaining as well as undergaining.Therefore, it is recommended to slightly overcompensate thebrightness of the image with time gain compensation rather thanusing the power-output gain. Using the postprocessing controlsallows adjustments between high and low gain settings. However,it is important to note the even distribution of gain using the timegain compensation controls, as uneven areas of brightness cannotbe compensated or corrected using postprocessing controls. Aswith 2D echocardiography, optimizing lateral and axial resolutionremains equally important during 3DE acquisition.
4. 3DE Image Display
a. CroppingThe concept of cropping is inherent to 3D echocardiography.In contrast to cross-sectional (i.e., tomographic) modalities, 3Dechocardiography requires that the “viewing perspective” be in
Figure 1 (Top) Example of electrocardiographically triggered multiple-beat 3DE data acquisition from a transthoracic apical window. Narrowpyramidal volumes from four cardiac cycles (top left) are stitched together to form a single volumetric data set (top right). (Bottom) Real-time orlive 3DE single-beat acquisition of the whole heart (bottom left) and the left ventricle (bottom right) from the transthoracic apical window.
the chamber that is in immediate continuity with the region ofinterest. For example, to view the atrioventricular junctions “enface,” the operator must crop off the base and the apex of theheart, so that the operator may visualize the junctions lookingup from below, or looking down from above. Similarly, to viewthe ventricular septum en face, the echocardiographer must cropoff the free walls of both ventricles to view the right ventricular(RV) aspect of the septum from right to left or the LV aspect ofthe septum from left to right. The paradigm for the echocardiogra-pher, therefore, is to change from the cross-sectional approach tothat of the anatomist or surgeon, who can only view intracardiacstructures after exposing them, by cropping the walls of the differ-ent chambers. Three-dimensional cropping can be performedeither before (during) or after data acquisition. Cropping that isperformed before the acquisition has the advantages of providingbetter temporal and spatial resolution, while also providing imme-diate availability of the cropped image. However, if a croppedimage is stored, that image may not be amenable to “uncropping”later. In contrast, if a wide data set is acquired and cropped afteracquisition, it provides the advantage of retaining more diagnosticinformation, but at the expense of loss of spatial and temporalresolution.
b. Post-Acquisition DisplayOnce a 3DE data set is acquired, it can be viewed interactivelyusing a number of 3D visualization and rendering software
packages. Display of 3DE images can be divided into three broadcategories: (1) volume rendering (Figure 4A), (2) surface rendering(including wireframe display; Figures 4B and C), and (3) 2D tomo-graphic slices (Figure 4D). The choice of the display technique isgenerally determined by the clinical application.
c. Volume RenderingVolume rendering is a technique that uses different types of algo-rithms (e.g., ray casting, shear warp, and others) to preserve all3DE information and project it, after processing, onto a 2Dplane for viewing.2 Essentially, these algorithms cast a light beamthrough the collected voxels. Then, all voxels along each lightbeam are weighted to obtain a voxel gradient intensity that inte-grated with different levels of opacification, shading and lightingallows an individual structure to appear solid (i.e., tissue) or trans-parent (i.e., blood pool).3,4 Finally, a variety of shading techniques(distance shading, gray-level gradient coding, and texture shading)are used to generate a 3D display of the depths and textures ofcardiac structures.3,4
Volume-rendered 3DE data sets can be electronically segmen-ted and sectioned. To obtain ideal cut planes, the 3D data setcan be manipulated, cropped, and rotated. Volume rendering pro-vides complex spatial relationships in a 3D display that is particu-larly useful for evaluating valves and adjacent anatomic structures.
d. Surface RenderingSurface rendering is a visualization technique that shows the sur-faces of structures or organs in a solid appearance. To use thistechnique, segmentation of the data set can be applied to identifythe structure of interest.2 Surface rendering of selected structuresis obtained by manual tracing or using semiautomatic border de-tection algorithms to trace the endocardium in cross-sectionalimages generated from the 3D data set segmentation. These con-tours can be combined together to generate a 3D shape that canbe visualized as either a solid or a wireframe object used to createa 3D perspective.5 Wireframe reconstruction is used to generate3D images of subsets of the entire data set in a cagelike picture.
Stereoscopic presentation of the left ventricle has been used toimprove the visual assessment of ventricular shape as well as theappraisal of ventricular structures and the quantification ofcardiac chamber volumes and function. However, surface render-ing frequently fails to provide details of cardiac structures or tex-tures. Solid and wireframe surface-rendering techniques can becombined to allow appreciation of the extent of cardiac structuremotion (i.e., cardiac chamber volume changes during the cardiaccycle).
e. 2D Tomographic SlicesThe volumetric data set can be sliced or cropped to obtain mul-tiple simultaneous 2D views of the same 3D structure. In thismanner, the limitations of acoustic imaging with conventional 2Dechocardiography can be overcome by 3D echocardiography,which allows the acquisition of different cutting planes from virtu-ally any acoustic window. Indeed, it is possible to select unique 2Dcutting planes (which may be difficult or virtually impossible toobtain with 2D transducer manipulation from standard windows)from a volumetric 3D data set and to display the corresponding
Figure 2 Multiple-beat 3DE acquisition acquires narrowvolumes of information over several heartbeats (ranging fromtwo to seven cardiac cycles) that are then stitched together tocreate a larger volumetric data set (A). This method of dataacquisition compensates for the poor temporal resolution ofsingle beat full volumetric real-time 3DE acquisition (B) but hasthe disadvantage of having stitch artifacts.
2D tomographic images in a cine loop format. For example, acardiac chamber can be cut in true longitudinal or transverseplanes, referred to as common long-axis or short-axis views.
Multiple slicing methods are available, such as arbitrary plane,simultaneous orthogonal (or arbitrary angle) slices, and parallelslice planes.6 The arbitrary plane cut allows the operator toorient the cutting plane in any direction, for optimal cropping ofthe cardiac structures of interest. The simultaneous orthogonal2D slice mode consists of two or three 2D planes (coronal, sagit-tal, and transverse) displayed simultaneously. Finally, it is possibleto obtain multiple 2D parallel tomographic slices with uniformlyspaced 2D parallel slices.
These optimized cross-sectional planes of the heart allow accur-ate measurements of chamber dimensions and valve or septaldefect areas as well as improved evaluation of the morphologyand function of different structures with more objectivity andless operator dependency.7 –9 The simultaneous orthogonal 2D
slice mode provides multiple visualization of the same segmentwithin a single cardiac cycle, which can be useful for ventricularfunction analysis as well as for wall motion assessment duringstress echocardiography.10,11
5. Management and Work FlowUntil 3D echocardiography is fully incorporated into daily clinicalpractice, protocols and techniques will remain focus orientedand vary according to disease process as well as institutional use.Currently, many laboratories perform full 2DE exams followedby focused 3DE studies.12 The reason for this inconvenient workflow was that the 2D image quality obtained with the 3D TTEprobe was inferior to that of dedicated 2D TTE probes. Thus,the success of using 3DE in clinical practice depends on a practicalwork flow, which requires (1) a single transducer solution capableof 2D and 3D imaging, (2) accurate automated chamber
Figure 3 With stable cardiac position throughout subvolume acquisition during electrocardiographically triggered multiple-beat 3DE acqui-sition, no stitch or gating artifacts are visible when the subvolumes are joined. This can be seen on either the 2D cut plane perpendicular to thesweep plane (top left) or the 3DE volume (bottom left). Unstable cardiac position during subvolume acquisition caused by patient respiratorymotion or irregular cardiac rhythm results in stitch artifact, where the individual subvolume components constituting the 3DE image can be seenon the 2D cut plane (top right) and the 3DE volume (bottom right). AV, Aortic valve; MV, mitral valve.
Table 1 Methods to avoid gating artifacts and improve 3D data set quality
TGC, Time gain control.
Figure 4 Three-dimensional echocardiographic data sets can be viewed interactively using different 3D visualization and rendering softwarepackages. The techniques used to display 3D images can be divided into four broad categories: volume rendering (A), surface rendering (B),wireframe (C), and 2D tomographic slicing (D).
quantification, and (3) automated display of standard 3DE or 2DEcut planes views from each window acquisition. With the latestgeneration of 3D TTE and TEE probes, the first requirement hasbeen achieved, because the 2DE images obtained with these newtransducers are comparable in quality with those obtained withdedicated 2D transducers. As well, multiple imaging ultrasoundcompanies have developed or are in the process of developingsoftware with automated chamber quantification and automateddisplay of cut planes, which addresses the second and thirdrequirements.
Beyond acquisition work flow, data management, which refersto the manner in which 3DE data are stored and recalled for ana-lysis, also needs to be optimized. Currently, a 2DE exam requireson average 300 to 500 MB of storage space, whereas a combined3DE and 2DE exam may require up to 1.5 GB of storage. Theselarge data sets place a strain on the digital systems of laboratoriesnot only with regard to transmission but also in terms of overallstorage capacity. A Digital Imaging and Communications in Medi-cine standard for 3D echocardiography was approved in 2008,which called for the storage of Cartesian data sets without com-pression, which requires a large amount of digital storage space.Because of the storage requirements, this standard has not beenwidely adopted. Greater use of this standard and perhaps adoptionof a standard with compression will ease 3DE data storageconcerns.
6. 3D Color Doppler Acquisition
a. TTE and TEE Data AcquisitionSimilar to conventional 2D echocardiography, color Dopplersuperimposes flow information onto 3DE morphology. Three-dimensional color Doppler acquisition is performed using live 3Dor multiple-beat full-volume acquisition. Although larger datavolumes are achieved with multiple-beat full-volume colorDoppler acquisition, it is limited by stitching artifacts. In contrast,live 3D color Doppler acquisition is not affected by stitching arti-facts but is limited by smaller color Doppler volumes and lowerframe rates. Although 3D color Doppler data acquisition is feasiblewith TTE and TEE examinations, 3D TEE acquisition currently pro-vides significantly better color Doppler image quality and thereforeis recommended for detailed color flow analysis. Similar to whatoccurs during non–color Doppler 3D data set acquisition, thesize and location of the 3D color Doppler volumes should becarefully defined according to the flow region to be analyzed.
b. Cropping MethodsColor flow analysis includes (1) distal jets, (2) the proximal flowfield of valvular flow regurgitation, and (3) flow through heartdefects such as ventricular or atrial septal defects. Cropping of3D color Doppler data sets follows the same principles as non–color Doppler data set cropping and is determined mainly bythe analysis intended. For regurgitant jets, it is recommended tocrop the 3D color Doppler data set to show two long-axisviews of the jet: one with the narrowest and one with the broadestwidth of the jet. This display should also include a short-axis viewof the jet at the level of the vena contracta (Figures 513 and 6).
Alternatively, color Doppler flow can be displayed using a multipleslice representation extracted from the 3D color Doppler data set,as shown in Figure 7.
c. Orientation and DisplayUnderstanding the orientation of color Doppler flow within thedisplayed views is clinically important. To help with the orientation,it is recommended to display the 3D color Doppler data in at leasttwo different views with known orientation to each other as indi-cated by different colored cutting planes (Figures 5 and 7). It is alsorecommended to display 3D color Doppler data together withcharacteristic anatomic 3D information using standard views.
d. LimitationsThe limitations of 3DE color Doppler acquisition include poorspatial and temporal resolution, both expected to improve withthe advancement of 3DE technology. Currently, live 3DE colorDoppler acquisition is limited to small color Doppler volumes,usually with limited temporal resolution of 10 to 15 voxels/sec.Alternatively, multiple-beam full-volume acquisition of colorDoppler providing larger color Doppler volumes and volumerates (up to 40 voxels/sec) are limited by stitching artifacts, result-ing in significant displacement between different subvolumes(Figure 3, bottom).
7. Transthoracic 3DEExamination ProtocolThree-dimensional TTE full-volume acquisition mode can accom-modate most of the entire heart structures within a single 3Ddata set. However, with existing technology, the decreases inboth spatial-temporal resolution and penetration that wouldresult from enlarging the volume angle to acquire the entireheart from a single acoustic window makes this impractical. Toovercome these limitations, 3DE data sets “should be” acquiredfrom multiple transthoracic transducer positions.
In clinical practice, two protocols have been used: (1) focusedexamination and (2) complete examination.1,6 A focused 3DEexamination usually consists of relatively few 3DE data setsacquired to complement a complete 2D study. Some examplesof focused 3DE examinations are (1) acquisition of a gated 3DEfull-volume data set from the apical window to quantify LVvolumes, LV ejection fraction, and LV shape and to evaluate forLV dyssynchrony in patients with heart failure; (2) data setsacquired from both the parasternal and apical approaches to visu-alize the mitral valve apparatus with the aim of measuring orificearea in a patient with mitral stenosis; and (3) 3D zoom modeacquisition, with high density from the parasternal window tovisualize the aortic valve in a patient with suspected bicuspidvalve. For a focused exam, start with 2D imaging to localize thestructure of interest, then switch to live 3DE imaging to check ifthe structure of interest is encompassed within the volume ofinterest, and then obtain a 3D acquisition in the full-volume orzoom mode. If the patient is unable to hold the respirationduring a gated multiple-beat acquisition or if significant rhythmdisturbances are present, use single-beat full-volume acquisition
(if available) or use narrow-angled 3D acquisition mode. Last,select the highest resolution option that accommodates thevolume of interest.
A complete 3D TTE exam requires multiple acquisitions from theparasternal, apical, subcostal, and suprasternal transducer positions.Table 2 lists the 2D TTE views from which 3DE data sets should beacquired. Because the volume-rendered 3D data set can be croppedto display a variety of intracardiac structures by choosing differentcut planes as an alternative to “view” (referred to heart’s orientationto the body axis), “anatomic planes” (referred to the heart itself)can be used to describe image orientation.14 The most frequentlyused cropping planes are (1) the transverse plane, a horizontalplane that runs perpendicular to the long axis of the body dividingthe heart into superior and inferior segments; (2) the sagittalplane, a vertical plane that divides the heart into right and leftsegments; and (3) the coronal plane, a vertical plane that dividesthe heart into anterior and posterior segments (Figure 8).
8. Transesophageal 3DEExamination ProtocolA comprehensive 3DE examination using the matrix TEE trans-ducer usually starts with real-time imaging modes such as liveand narrow-angled acquisition.15 However, the gated 3DEmodes, including 3D color flow Doppler, should also be usedwhenever ECG and respiration gating requirements are permis-sible, to take advantage of the improved spatial and temporal
resolution of these wide-angled acquisitions. Three-dimensionalTEE data sets acquired using a matrix array include both thearea and depth of the imaging plane, thereby requiring lessprobe manipulation for data acquisition compared with a standard2D TEE examination. Furthermore, unique en face 3DE views withinfinite real-time rotational and cropping plane capabilities, as wellas offline quantitative analyses, should result in accurate diagnosesand ultimately improved clinical decision making.14,16– 724 Althougha systematic approach to performing a comprehensive 3D TEEexamination is recommended, it is recognized that not all viewsmay be optimally obtained in all patients and that additionalunconventional views may be required to obtain additional detailedinformation in patients with complex pathologies.
Initially, a real-time 3DE and a subsequent gated 3DE data setshould be obtained from the midesophageal views to determinethe overall function of the left and right ventricles and to identifystructural valve abnormalities. Table 3 describes the recommendedviews to obtain 3D images of cardiac structures using transesopha-geal echocardiography. Table 4 demonstrates how to display 3DTEE images of the cardiac valves from the original 2D TEE views.Offline analyses of the gated 3DE data set acquired from themidesophageal five-chamber view can be performed to obtainquantitative measures of LV global and regional function.
9. Assessment of the LVAccurate and reproducible quantitative assessment of LV size andfunction are pivotal for diagnosis, treatment, and prediction of
Figure 5 Transthoracic 3DE color Doppler images of a functional mitral regurgitation jet. En face view of the asymmetric vena contracta asseen from the left ventricle (top left). Note that the vena contracta is located along the commissural line. Quantitative assessment of the venacontracta using the en face plane (bottom left). The data set was cropped to create four-chamber (4CH) and two-chamber (2CH) views of thevena contracta, which can be shown en face view (top middle and top right) and perpendicular by tilting 908 upward (bottom middle and bottomright), demonstrating the eccentricity of the vena contracta. AML, Anterior mitral valve leaflet; LVOT, LV outflow tract; PJW, proximal jet width;VCA, vena contracta area.
prognosis of structural heart diseases. In this regard, the mostimportant contribution of 3D echocardiography may be in LVquantification.25 Cumbersome acquisition methods and lack ofuser-friendly analysis software initially precluded widespread useof 3D echocardiography, but the advent of matrix transducers,together with impressive improvements in semiautomated volu-metric analysis, has allowed 3D echocardiography to evolve froma complicated and time-consuming research tool into a simpleand fast imaging modality ready for everyday clinical use.
a. Anatomy and Limitations of 2DEAssessmentThe purpose of 3D imaging of the left ventricle is to providevolume and ejection fraction measurements independent of geo-metric assumptions regarding LV shape.25 The landmarks usedfor this process are the mitral annulus and LV apex, which areused to initiate edge detection by semiautomated quantificationsoftware. Other anatomic features of importance are the LV tra-beculae and papillary muscles, which should be included withinthe LV cavity for the calculation of LV volumes. The trabeculaeare small structures that are often poorly visualized with 3DEimaging, and the use of LV opacification with contrast is the bestway to ensure that they are incorporated within the LV cavity.26–29
The assessment of wall motion requires a frame of reference toallocate segments. The 17-segment model distinguishes six
segments (inferoseptal, anteroseptal, anterior, lateral, inferolateral,inferior) in the base and mid left ventricle, four segments (septal,anterior, lateral, inferior) in the apex, and the apical cap.30 This seg-mentation is based on the mitral annulus, papillary muscles, andapical portion of the LV cavity to define the planes in the longitu-dinal dimension. In the transverse dimension, the segments com-prise 608 arcs, starting at the midpoint of the septum, whichitself is defined by the anterior and posterior RV insertion pointsof the septum. A little more problematic is the definition of region-al LV volume, currently defined in most programs by the spacebetween the endocardial border and a centerline through the LVcavity. This virtual landmark may shift with alterations of LV massand remodeling after myocardial infarction, leading to underestima-tion of serial regional volume changes. The use of an externallydefined frame of reference could overcome this problem, but itis unclear how this can be readily achieved.
LV structural changes that can be identified with 3D echocardi-ography include ventricular septal defects and masses such as LVthrombi or tumors. The sites of these are usually described byreference to the relevant landmarks (mitral annulus, LV outflowtract, and apex) or segmentation.
Despite the utility and established role of 2D echocardiographyto assess LV function, it has a number of important limitations forLV imaging, including foreshortening, malrotation, and angulation.Because of the geometric assumptions of 2D echocardiography,volumetric measurements may be inaccurate if the acquisition of
Figure 6 Example of 3D assessment of functional mitral regurgitation by 3D transesophageal echocardiography and 3D color Doppler. Two-dimensional cross-sectional views demonstrating mitral leaflet tethering and tenting (top left) causing significant eccentric mitral regurgitation(top middle). Three-dimensional echocardiographic view to the mitral valve shows only moderate focal nodular degeneration of mitralleaflet (top right). Cropping of a 3D color Doppler data set reveals a vena contracta area, which is narrow in the five-chamber view (bottomleft), broad in the two-chamber view (bottom middle), and asymmetric along the commissural line in an en face view to the mitral valve(bottom right). Ao, Aorta; LA, left atrium; LAA, left atrial appendage; LV, left ventricle.
2D images is suboptimal. Likewise, appropriate interpretation ofregional LV responses to stress requires all vascular territories tobe imaged and for analogous segments to be displayed at restand stress.
As with its use in other situations, there are fundamentally twoapproaches to the application of 3D echocardiography. The firstinvolves the use of a full-volume data set to create standard 2Dimages in which the cut planes are optimized to ensure that theyare “on axis”; this is the strategy used for segmental wall motionassessment and tracing of LV borders for volume calculations. Insegmental imaging, there are benefits of obtaining orthogonalviews to confirm wall motion abnormalities in any segment. Thesecond is a display of rendered images that provides a 3D impres-sion of a structure, such as might be used for the assessment of LVmass or thrombus.
These benefits are obtained at the cost of technical shortcom-ings of 3D echocardiography. The probe footprint of most 3Dtransthoracic transducers is large, which contributes to difficultyin imaging the anterior and lateral walls because of interferencefrom ribs. Recently, newer 3D transthoracic transducers have
been developed with smaller footprints to overcome these limita-tions. Second, there is lower line density and therefore lowerspatial resolution of 3D echocardiography, which may be partlyreaddressed with the use of LV opacification with contrast.28
Third, 3D echocardiography has lower temporal resolution than2D echocardiography because of the lower volume rate that isattainable with 3D echocardiography. This can be addressed bynarrowing the 3D sector and stitching multiple subvolumes, butat the risk of creating stitching artifacts and with specific limitationsin irregular rhythms or inability to hold the breath.
b. Data Acquisition and Cropping
Data AcquisitionA 3DE acquisition of the entire left ventricle generally takes ,10sec. Although all standard acquisition windows for echocardiog-raphy are available and useful for 3D acquisitions, the ideal andgenerally preferred approach for the acquisition of a full-volumeLV data set is the apical one (Tables 2, 3, and 5). Depending onthe shape of the heart and its position within the chest, a more
Figure 7 Measurement of vena contracta dimensions from a 3D TEE color Doppler data set (bottom right) using 3D analysis software. Thedata set is cropped to create a four-chamber (top left) and a two-chamber view (top right). Note that the vena contracta width is smaller whenmeasured on the four-chamber view compared with the two-chamber view. The cropping plane can be adjusted to present an en face view ofthe vena contracta from which a planar area of 1.11 cm2 (bottom right) can be measured. R, Proximal isovelocity surface area radius.
off-axis position may be appropriate to ensure the acquisition ofthe entire left ventricle. To guarantee optimal image quality, trans-ducer frequency and overall gain should be adjusted accordingly.The best sequence for image optimization is to follow the 2Dimages with real-time 3D images—although there is limited valuein real-time imaging of the left ventricle (except for structuralchanges such as mass or thrombus), this step is of value to opti-mize gain settings—which should be typically higher than thoseused for 2D echocardiography. Acquisition of the full-volumedata set can be guided by a split-screen display of orthogonalviews, which can itself be used for simultaneous imaging in twoor three planes. The full-volume acquisition should be madeduring a breath hold to minimize the risk for breathing (stitch)artifacts. As discussed above, contrast LV opacification is oftenof value.26-29
c. Orientation and DisplayThere is no general agreement on how the imaging planes shouldbe displayed. The proposed “apex-down” 3D display has not beenwidely adapted for LV imaging, perhaps because LV imaging is“3D-guided 2D.” The preference of the writing group is toorient images so that right-sided structures are on the left-handside and the apex is up (Figure 9).
d. Analysis MethodsVolume rendering is of primary value for demonstration of struc-tural abnormalities. Within the left ventricle, these might includethrombi, masses and septal defects. This approach is of limitedvalue for the quantification of LV function.
Surface rendering is of primary value for global and regionalfunctional measurements, including 3D echocardiography–guided2D imaging for measurement of LV volume, ejection fraction andmass. Most vendors offer software packages for both online and
Figure 8 Cropping of the heart in the transverse plane, a horizontal plane that runs parallel to the ground dividing the heart into superior andinferior segments (top left); sagittal plane, a vertical plane that divides the heart into right and left segments (center); and coronal plane, a verticalplane that divides the heart into anterior and posterior segments (top right). The lower panels present the 3D views that result from these cutplanes.
Table 2 Protocol for transthoracic 3Dechocardiography
Protocol For Three-Dimensional TransthoracicEchocardiography
Aortic Valve Left Ventricle/RightVentricle
Pulmonic Valve
Parasternallong-axis viewwith and withoutcolor (narrowangle andzoomedacquisitions)
Apical four-chamberview (narrow andwide angleacquisition)Pleasenote that the imagemust be tilted toplace the rightventricle in thecenter of the imagefor right ventricularacquisition
Parasternal rightventricularoutflow tractview with andwithout color(narrow angleand zoomedacquisitions)
offline quantitative analysis of the left ventricle. Typically, thisprocess involves segmentation of the 3DE data set into severalequiangular 2D longitudinal planes after initialization of a few ana-tomic landmarks, such as the mitral annulus and apex, in severalconventional 2D planes. If necessary, manual corrections to theendocardial borders can be performed,31 after which a semiauto-mated blood endocardial interface detection algorithm allowsthe calculation of cavity contours and display of their changesduring the cardiac cycle providing a volume-versus-time curve(Figure 10). A surface-rendered cavity cast of the left ventricle isthen constructed, from which LV volume is computed withoutgeometric assumptions, directly from voxel counts.
Wireframe models are effective for defining sections of the leftventricle in position and time. These 3DE data can be used toassess LV synchrony, regional strain, curvature, and wall stress.However, these steps are computationally intensive and are notperformed in routine practice.
The analysis of regional function is more complex to communi-cate than global function or even shape. One option is a polar map
display incorporating wall motion scoring; a similar and moredynamic process may be illustrated using contraction frontmapping (Figure 11), which illustrates the spatial distribution ofcontraction and relaxation.
e. Clinical Validation and Application
LV Structural Abnormalities (e.g., Thrombus, Ventricular Septal Defect)These are assessed using visual assessment and 3DE color flowmapping.
Global LV Functional MeasurementsThese include volumes, ejection fraction, LV shape, and regionaland global strain. Of these, LV volumes and ejection fraction arethe closest to clinical application. This measurement of LVvolume and function is rapid, more accurate and reproduciblethan with 2DE, and has an accuracy that is similar to magnetic res-onance imaging, although the variability may be higher as a result ofvarying image quality and operator expertise.32 The availability ofLV cavity shape allows the extraction of additional quantitative in-formation in patients with LV dysfunction (e.g., the 3D sphericityindex).33 The assessment of 2D global strain is an interestingpotential marker of global function; whether this measurementcan be reliably assessed with 3D imaging remains undefined atpresent.
Despite the high correlation with magnetic resonance imagingas the reference technique, several studies using both manualand semiautomated contour detection have shown significantunderestimation of 3D echocardiography–derived LVvolumes.28,31,34–49 The potential reasons for the underestimationare numerous, but systematic underestimation of LV volumes by3D echocardiography compared with magnetic resonanceimaging may be largely explained because 3D echocardiography,unlike magnetic resonance imaging, cannot consistently differenti-ate between the myocardium and the trabeculae.32 To minimizeintertechnique differences, tracing the endocardium to exclude tra-beculae in the LV cavity is recommended for 3D echocardiography.As well, one-beat acquisitions may not successfully capture trueend-systole, because of the reduced temporal resolution. Thiswill lead to inaccurate end-systolic volume calculations andejection fraction measurements.
The reproducibility of LV volume and function measurementsby 3D echocardiography has been assessed in multiplestudies.31,35,50,51 Most of these studies were part of larger studiesin which series of patients were analyzed twice by one observerand by a second observer. Less variation is reported than with2D echocardiography. The best reproducibility was obtained instudies that selected patients on the basis of good imagequality.52 Differences between observers are less likely to be oftechnical origin. Although some differences have been found tobe statistically significant between different baseline settings withdifferent semiautomated endocardial contour tracing algorithms,they do not seem clinically relevant. The normal values of LV end-diastolic and end-systolic volume have not been established bygender and body size and so are not provided in this document.
LV MassMore user interaction is required to identify the epicardium for thecalculation of LV mass. Despite a slight overestimation of LV massby 3D echocardiography in comparison with magnetic resonanceimaging measurements, the accuracy of 3D echocardiography issimilar to that of magnetic resonance imaging in mostpatients.35,42,53-57 However, there are wide limits of agreement,reflecting a number of issues. First, the use of innermost versusoutermost endocardial contour tracing might explain measure-ment differences, as LV mass measurement increases with theinclusion of trabeculae into the LV wall. Second, LV mass measure-ment also relies on accurate visualization and tracing of the epicar-dial contour, which is even more challenging than endocardialtracing. Takeuchi et al.58 and Pouleur et al.48 used
echocardiographic analysis software that semiautomaticallydetected the endocardial surface and then calculated LV mass byarbitrarily adding 8.8 mm of wall thickness to the endocardialsurface. Third, analysis of short-axis magnetic resonance imagesand long-axis 3DE images is distinctly different.
LV DyssynchronyFor the analysis of LV dyssynchrony, individual LV segmentalvolumes are plotted versus time throughout the cardiac cycle.These plots allow measurement of temporal differences in seg-mental time to minimum volume. Regional minimal volume (i.e.,maximal contraction) normally occurs at the same time in ven-tricular systole for all segments. In a left ventricle with dyssyn-chrony, there is dispersion in the timing of regional segments
Table 4 Acquisition and presentation of cardiac valves
Aortic valve (top row): First, with 2D transesophageal echocardiography, the aortic valve should be centered in the acquisition boxes in two orthogonal views. One view should beof the aortic valve in the midesophageal 608 short-axis view and the second in the 1208 long-axis view. Then, live 3D mode should be used to optimize gain settings. Subsequently,full-volume acquisition should be performed. If the 3D volume is acquired from the previously described 2D views, to display the aortic valve, it must be rotated clockwise, 908around the y axis, so that the aortic valve is presented as seen from the ascending aorta with the right coronary cusp located at the 6 o’clock position.Mitral valve (second row): First,with 2D transesophageal echocardiography, the mitral valve should be centered in the acquisition boxes in two different views. One view should be of the mitral valve in themidesophageal 908 “two-chamber” view and the other in the 1208 long-axis view. From those views, the full-volume acquisition should be performed. Once acquired, the volumeshould be rotated counterclockwise, 908 around the x axis. This presents the mitral valve as viewed from the left atrium. Finally, the mitral valve should be rotatedcounterclockwise in plane so that the aortic valve is located at the 12 o’clock position.Pulmonic valve (third row): First, with 2D transesophageal echocardiography, the pulmonicvalve should be centered in the acquisition box in the 08 high-esophageal view. From this view, the full-volume acquisition should be performed. Once it is acquired, the imagevolume should be rotated around the x axis, counterclockwise 908. This will display the pulmonic valve en face as if viewed from the pulmonary artery. Finally, to display thepulmonic valve properly, the image must be rotated in plane 1808 so that the anterior leaflet is located at the 12 o’clock position.TV (bottom row): First, with 2D transthoracicechocardiography, the TV should be acquired from an off-axis apical four-chamber view. The acquisition boxes should be centered on the TV in two orthogonal views. From theseviews, the full-volume acquisition should be performed. After acquisition, the image volume should be rotated around the x axis, counterclockwise 908. This will present the TV asif viewed from the right atrium. Then, the valve should be rotated in plane 458 so that the septal leaflet is located at the 6 o’clock position.
reaching minimal volume as the diseased segments achieve minimalvolume later in systole (Figures 10 and 11). The systolic dyssyn-chrony index (SDI) is calculated as the standard deviation ofregional ejection times (time to regional minimal volume). Para-metric images using color schemes representing timing differencesin segmental contraction can be displayed in a “bull’s-eye” format,which is a practical tool for identifying and localizing areas ofdyssynchrony.
The literature on 3DE dyssynchrony has focused on three majorareas: (1) description of reference values and reproducibility of SDIin normal subjects and different patient subsets, (2) comparison of
3DE measurements of SDI with those using conventional methods(i.e., tissue Doppler), and (3) prediction of responses to cardiacresynchronization therapy (CRT) using 3D echocardiography–derived LV SDI.
Doppler tissue imaging has high temporal resolution but onlyprovides information on longitudinal systolic myocardial contrac-tion of the mid and basal segments, frequently with low reprodu-cibility.59 In contrast, 3D echocardiography evaluates all LVsegments simultaneously. Three-dimensional echocardiography–derived LV SDI was described as highly predictive of responseto CRT at 48 hours,60 6 months,61,62 and 1 year of follow-up.63
Benefits from CRT have been defined as a ≥15% reduction in LVend-systolic volume at follow-up,60,62,63 which can also readily bemeasured using 3D echocardiography.
Finally, the importance of optimal LV pacing lead position wasemphasized in a 3DE study in which the responses to CRT werecompared between patients with the LV pacing lead positionedat the site of maximal mechanical delay and those in whom thepacing lead was positioned distal to that site. LV function,
reverse remodeling, and peak oxygen consumption were signifi-cantly improved in patients with optimal LV pacing lead positionguided by 3D echocardiography, whereas the opposite occurredwith increasing distance between the optimal and the actualpacing site.64 Currently, because these data come from small,single-center, nonrandomized studies, patients should not beselected for CRT on the basis of 3DE parameters until moredata become available.
Figure 9 Example of a triplane 2DE acquisition. This mode is typically acquired from a single transthoracic apical echocardiographic window.A default setting of 608 increments between the three planes allows the simultaneous acquisitions of the four-chamber (4C) and two-chamber(2C) views as well as the apical long axis (top). Three-dimensional full-volume data sets cropped to provide 3DE views from the equivalentapical four-chamber and two-chamber views and long-axis views (bottom). 3C, Three-chamber.
Figure 10 From a transthoracic 3DE data set of the left ventricle (left), the LV endocardium can be traced (middle, top) to obtain the LVvolume throughout the cardiac cycle (right, top). As well, the LV endocardium can be divided according to the 17-segment model (middle,top), and the time each segment requires to attain minimal volume in the cardiac cycle can be identified (right, bottom).
f. Future PerspectivesA large amount of evidence suggests that in the presence of adequateimage quality, LV volumes and functional measurements by 3D echo-cardiography have closer limits of agreement with cardiac magneticresonance measurements and better reproducibility than 2D echo-cardiography, making it the modality of choice for the everyday clin-ical evaluation of LV volumes and ejection fraction.65 Furthermore,LV dyssynchrony assessment by 3D echocardiography might play avaluable role in the selection of patients for CRT through the predic-tion of response but also prove to be useful for the optimization ofLV lead placement.66 Other developments, such as 3D strain meas-urement67 and LV shape analysis,33 show great potential to becomefuture clinical applications. Future advancements in hardware willfacilitate the acquisition of wider angle pyramidal data with higherspatial and temporal resolution in a single cardiac cycle. To continueto enhance the clinical applicability of 3DE imaging, further improve-ments in automatic quantitative analysis software that will enablefast online measurements that are accurate and reproducibleare required.
Currently, 3D TTE and TEE assessment of LV volumesand ejection fraction is recommended over the use of 2D
echocardiography, as it has been clearly demonstrated toprovide more accurate and reproducible measurements.
10. Assessment of the RV
a. Anatomy and Limitations of 2DEAssessmentThe right ventricle is composed of three anatomic and functionalsubunits, which extend from (1) the tricuspid valve (TV) annulusto the proximal os infundibulum, (2) the RV body to the apex,and (3) the RV outflow tract to the pulmonary valve. Thisdivides the RV cavity into three sections: inlet, apical trabecular,and outlet, respectively. The musculature of the right ventricleextends from the atrioventricular to the ventriculoarterial junc-tions. The right ventricle is highly trabeculated, with severalmuscle bands, including the septoparietal trabeculations and themoderator band. From a functional point of view and because ofthe orientation of the RV fibers, global assessment of the rightventricle is difficult, with the two main sections contracting
Figure 11 Three-dimensional TTE data set of the left ventricle as viewed from the apex (left, top) or anteriorly (right, top), with dynamictracking of the LV endocardium. The end-diastolic LV endocardium is visualized as a mesh shell and the end-systolic endocardium as a solidshell. Seventeen-segment, bull’s-eye map of contraction front mapping demonstrating the time required for each segment to reach minimalLV volume (left, bottom). Graph, with time along the x axis and volume along the y axis, demonstrating the time for each segment to reachminimal volume (right, bottom). Ant, Anterior; Inf, inferior; Lat, lateral; Sept, septum.
perpendicular to each other: the proximal (RV inflow) longitudin-ally and the distal (RV outflow) circumferentially.
Because of the peculiar RV morphology and function, 2D echo-cardiography has several limitations in the evaluation of the rightventricle, which can be readily overcome by a 3DE gated wide-angled acquisition, which enables complete assessment of itsgeometry, volumes, and ejection fraction (Figure 12 and 13),displaying the surfaces of the entire right ventricle including theinflow, apex, and outflow tracts.68,69
b. Data AcquisitionSeveral methods and software packages have been used to evalu-ate the right ventricle. Three-dimensional data are acquired in afull-volume data set from the four-chamber apical view adaptedto include the entire right ventricle (Tables 2 and 3). Three-dimensional echocardiographic data sets are typically digitallystored and then postprocessed offline. On-cart dedicated RV ana-lysis software packages will be soon available, further facilitating theuse of these measurements in clinical practice. Current RV analysissoftware displays 2D cut planes of the RV sagittal, four-chamber,and coronal views obtained from the full-volume 3DE data set.
c. Orientation and DisplayThe anatomy and pathology of the TV and the right ventricle arebest visualized using volume-rendered images (Table 5). Whenperforming volumetric analysis using semiautomated border track-ing software data, the right ventricle may be displayed as a
wireframe or surface-rendered cast. Studies describing quantitativechanges in tricuspid annular enlargement and leaflet tenting haveused the wireframe method.70 Cropping tools can be applied to3DE data sets to visualize the RV inflow and outflow tracts. TheTV can be displayed from both the right atrial and RV perspectives.The right atrial view of the TV should be modified to a surgeon’sorientation, as seen in Figure 14. The TV should be displayed withthe septal leaflet at the 6 o’clock position, irrespective of perspec-tive. The right atrium and right ventricle can be visualized usingmultiple cut planes. A variety of axial cuts at the apex, mid, andbase of the right ventricle can be obtained using the long axis ofthe left ventricle. In Figure 13, an axial cut plane of the right ven-tricle depicts a view of the TV and RV outflow tract on the left.Longitudinal cut planes can also demonstrate the right ventriclefrom a typical four-chamber view, coronal view, and RV inflowview. The position of these cut planes is represented on theaxial view. The four-chamber view of the right ventricle demon-strates the RV free wall and septum. The coronal cut plane demon-strates the right atrium, TV (septal and posterior leaflets), RVinflow and outflow, and pulmonic valve. The RV inflow viewshows the right atrium, anterior and posterior TV leaflets, andinterventricular septum.
d. Analysis MethodsThe current methods used to quantify RV geometry and functionsinclude the method of disks, a rotational approach, and mostrecently a volumetric semiautomated border detection approach.
Figure 12 Three-dimensional TTE image of the right ventricle in systole (A) and diastole (B) as acquired from the apical four-chamber(A4C) window. Three-dimensional TTE image of the RV outflow tract in systole (C) and diastole (D) as acquired from the short-axis view(SAX) with the aortic valve in the center, the TV to the left, and the pulmonic valve to the right. ANT, anterior; SEPT, septum.
Two of these methods are currently commercially available andare shown in Figure 15.
Method of Disks and Other MethodsA variety of options for offline 3DE reconstruction of the right ven-tricle exist. After acquisition and automatic display of the RV end-diastolic and end-systolic frames, the operator, in the axial plane,traces a contour of the endocardial border. These traced contoursgenerate disks of fixed height (generally 10 mm) but of varyinglengths and widths, as visualized in the other RV orthogonal views.The volume of the RV cavity is computed by adding the knownareas of the axial traces obtained 10 mm apart (i.e., disk summation).The number of disks required to cover the entire right ventricle frombase to apex varies from seven to eight depending on RV size.
Recently available software calculates RV volumes from end-diastolic and end-systolic endocardial border tracings of sagittal(to outline the TV in the best possible view), four-chamber (to
outline the apex), and coronal (to outline the RV outflow tract)3D echocardiography–derived cross-sectional planes. The oper-ator frequently needs to manually adjust the traced contours ineach frame before reconstruction and quantitative analysis. Trabe-culations are generally included in the endocardial rim, but theapical component of the moderator band is excluded fromthe cavity. The RV volumes are calculated by summation of thevolumes for each slice through the complete data set. Eachvolume data set is imported into the application and manipulatedby rotating, angulating, and slicing in any of the three displayedorthogonal planes. This software analysis, which uses a semiauto-mated border detection algorithm with manual correctionoptions, was validated using in vitro models as well as in vivousing cardiac magnetic resonance as the gold standard.71
Volumetric DisplayThe different software packages create a surface-rendering cast ofthe right ventricle. The end-diastolic and end-systolic volumes as
Figure 13 From a whole-heart transthoracic full-volume 3DE data set, a cropping plane can be used to obtain the following views of the rightventricle (RV): sagittal right ventricular inflow (top left and right), coronal (middle left and right), and four-chamber (4CH) view (bottom left andright). LV, Left ventricle; RA, right atrium; RVOT, right ventricular outflow tract.
well as RV ejection fraction are measured and automatically dis-played. Segmental analysis of the three main sections of the rightventricle (inlet, apex, and outflow segments) may be performed.Curves of global and regional RV function may be generated andanalyzed.
e. Clinical Validation and ApplicationData on RV volumes and function are of diagnostic and prognosticimportance in a variety of cardiac diseases, including valve disease,congenital heart disease, pulmonary hypertension, and heartfailure. Three-dimensional echocardiography allows the quantifica-tion of volumes and function in normal subjects and patients,72
thereby allowing identification of patients with different degreesof severity of RV dilatation and dysfunction.73 Several clinicalstudies have shown a good correlation between cardiac magneticresonance and 3DE volumes and ejection fraction of the right ven-tricle in selected populations, with the majority of studies showinga slight underestimation of volumes compared with the referencetechnique.71,74– 76 Differences in RV volumes have been demon-strated between men (129+ 25 mL) and women (102+33 mL),but adjusting to lean body mass (but not to body surface area orheight) eliminated this difference.76–78 The use of 3D transthoracic
echocardiography has been validated79 –81 in patients with pulmon-ary regurgitation, secundum atrial septal defects, tetralogy of Fallotrepair, Ebstein’s anomaly, and RV cardiomyopathy. The feasibilityand utility of 3D transthoracic echocardiography for guidanceof RV endomyocardial biopsies in children has also beendemonstrated.82
Assessment of RV function is of great interest in cardiovascularsurgery, because right-sided heart failure is one of the most fre-quent causes of morbidity and mortality after valvular and congeni-tal surgery, coronary artery bypass, and heart transplantation. Thishighlights the importance of an accurate preoperative assessmentof the right ventricle to improve risk stratification and early andprecise postoperative follow-up to optimize treatment. In thisregard, 2DE and Doppler parameters (tricuspid annular plane sys-tolic excursion, tissue Doppler imaging of the annulus) have severallimitations, particularly in postoperative follow-up. The evaluationof RV volumes and ejection fraction using 3D echocardiographyovercomes many of the limitations of 2DE methods.83
Currently, 3DE assessment of RV volumes and ejectionfraction shows great promise. However, routine clinicaluse is limited by the need for excellent quality transthor-acic data sets for accurate analysis with softwarepackages.
Figure 15 The RV volume can be determined from 3D echocardiographic data sets by the method of disks (left). Other methods includedynamic endocardial tracking with end-diastolic volumes presented by the mesh shell and end-systolic volumes presented by the solid shell(middle). The RV endocardial shell can be segmented for regional analysis (right).
Figure 14 Three-dimensional TEE images of the TV, whether presented as viewed from the right atrium (left) or the right ventricle (middle),are oriented with the interatrial septum located inferiorly. Three-dimensional echocardiographic color Doppler image demonstrating flow con-vergence in tricuspid regurgitation (right). Ant, Anterior; IAS, interatrial septum; IVS, interventricular septum; Post, posterior; Sept, septum.
a. Anatomy and Limitations of 2DEAssessmentThe mitral apparatus is formed from the hyperbolic paraboloid(i.e., saddle) shaped annulus, the multiscalloped and indentedleaflets connected by opposing anterolateral and posteromedialcommissures, the subvalvular apparatus composed of a highlyvariable chordae tendineae arrangement with dual papillarymuscles, and the LV wall attachments. Function of this apparatusrequires an intricate coordination between multiple anatomiccomponents, each of which has a unique functional geometry.Three-dimensional echocardiographic imaging modalities are idealfor interrogating the anatomy and function of each of the individualcomponents of the mitral apparatus.84
Mitral LeafletsThe anterior mitral valve leaflet has the larger radial surface and isattached to about one third of the annular circumference. The pos-terior leaflet has a larger circumferential attachment (two-thirds ofthe annulus) and is quadrangular is shape. Both leaflets are segmen-ted into three individual scallops: A1, A2, and A3, the anterior, andP1, P2, P3, the posterior (from left to right, respectively; Figure 16).Leaflet segmentation is particularly useful to precisely localizeprolapsing segments and anatomic lesions of the mitral valve.The coaptation line has an upward concavity and can be checkedfor visible leaks while in the closed position. The anterior mitralvalve leaflet is in continuity with the left and noncoronary cuspsof the aortic valve (aortic-mitral curtain85), as seen from the LVperspective in a modified oblique view of the atrioventricularplane (Figure 16).
Three-dimensional TTE data set acquisitions for mitral valvevisualization can be made either from the parasternal or theapical approach. A zoomed acquisition (allowing the highest tem-poral and spatial resolution) is best suited to detail mitral valve
leaflet anatomy and motion. A full-volume acquisition is requiredwhen the entire mitral valve apparatus needs to be assessed.
In contrast to conventional 2D echocardiography, which onlydisplays the mitral valve leaflets en face from the LV perspective,3D echocardiography enables en face visualization from both LVand left atrial perspectives. The latter view is also known as the“surgical view,” because it resembles the intraoperative image ofthe mitral valve after the surgeon, standing on the patient’s rightside, opens the left atrium. Figure 16 displays the “surgical view”appearance of a normal mitral valve by 3D TEE volume rendering.In addition to the visualization of mitral valve leaflets (center) andleft atrial appendage (left), this classic display enables visualizationof the spatial relationship with the tricuspid annulus (right)and with the aortic valve (top, approximately at 1 o’clock)(Figures 16–18, Tables 4 and 6).
Overall, the posterior mitral valve leaflet is best visualized fromthe parasternal window, while the anterior leaflet can be well seenfrom both apical and parasternal windows.86 The ventricular per-spective of the mitral valve obtained from the apical window isthe recommended approach for visualizing the anterior leaflet,while the prolapsing segments are appreciated from the surgicalview of the valve, equally well from both parasternal and apicalwindows.86 Beyond the en face view, 3D echocardiographyallows practically any cut plane of an apical or parasternal dataset to be used to obtain a conventional or unconventionaldisplay of the mitral valve leaflets. This may be necessary to pre-cisely localize the abnormal mitral valve segment. Additionally,data obtained by 3D echocardiography have resulted in the recom-mendation that the diagnosis of mitral valve prolapse should notbe made on the basis of the valve appearance in the 2DEfour-chamber view.
Subvalvular ApparatusThe functional integrity of the subvalvular mitral apparatus can beappreciated from LV long-axis cut planes. En face views of themitral valve from the LV perspective allow evaluation of the
Figure 16 Schematic (left) and 3D TEE image (middle) demonstrating the normal anatomy of the aortic and mitral valves. Three-dimensionalTEE image of the mitral valve as viewed from the left atrium demonstrating (1) a posterior mitral leaflet indentation (right, top), which is definedas a discontinuation in the leaflet that does not extend to the annulus, and (2) a posterior mitral leaflet cleft (right, bottom), which is defined as adiscontinuation in the leaflet that extends to the annulus. Cor., Coronary.
chordal insertions on the tips (primary chordae), body (secondarychordae), and base (tertiary chordae) of the mitral valve leaflets.Conversely, chordal rupture with flail or prolapse can be wellvisualized from left atrial views and/or by selected longitudinalcut planes.
Mitral AnnulusTwo-dimensional echocardiography is not able to provide data aboutmitral annular shape, because mental reconstruction from separate2D views cannot provide the same information as thevolume-rendered 3D reconstruction. Instead, the oval shape of the
Figure 18 Examples of 3D TTE zoom-mode acquisitions of the mitral valve as visualized from the LV (A–C) and left atrial (LA) (D–F)perspectives. Note that the mitral valve should be displayed with the aortic valve (AV) at the 12 o’clock position irrespective of perspective.AMVL, Anterior mitral valve leaflet; PMVL, posterior mitral valve leaflet.
Figure 17 Example of a 3D TEE zoom-mode acquisition of the mitral valve in diastole (A,C) and systole (B,D) as visualized from the leftatrial (LA) (A,B) and LV (C,D) perspectives. The mitral valve should be oriented with the aortic valve (AV) at the 12 o’clock position irre-spective of perspective. AMVL, Anterior mitral valve leaflet; PMVL, posterior mitral valve leaflet.
mitral annulus is best appreciated from the 3DE surgical view of themitral valve with the entire annular circumference captured in onedata set. Moreover, the saddle shape of the mitral valve is best assessedby offline reconstructions, which depict the saddle-shaped contour inthree dimensions with high points that are anterior and posterior andlow points that are lateral and medial. Commercial software has beendeveloped to precisely quantitate the size, shape, and degree of non-planarity of the mitral valve annulus. This has improved our under-standing of mitral valve mechanics. Also, it has assisted surgeons inevaluating the feasibility of mitral valve repair and provided valuableinformation for annuloplasty ring design.
Left VentricleDuring systole, normal motion and contraction of both the leftventricle and mitral annulus are required to maintain valve compe-tence. Any change in LV geometry that affects papillary muscleposition can change the axial relationship of the chordae andleaflets, resulting in poor leaflet coaptation. Three-dimensionaltransthoracic echocardiography not only allows a qualitativeassessment of LV size, geometry, and regional function but alsoenables comprehensive LV quantitation by several parametersand intuitive display modalities. In addition, dynamic 3D renderingof the mitral valve can discriminate between normal leaflet mobility
and tethered leaflets due to regional wall motion abnormalities orglobal LV enlargement with increased sphericity (resulting in ische-mic or functional mitral regurgitation).
Three-dimensional transesophageal echocardiography can eithersupplement 3D transthoracic echocardiography, with severalunique views and additional information, or replace it, when TTEimaging is impossible (e.g., inadequate acoustic window for 3Dechocardiography, intraoperative monitoring).87 Also, 3D transe-sophageal echocardiography has much higher spatial resolutionthan 3D transthoracic echocardiography, resulting in improvedmitral valve anatomic detail. Therefore, assessments of native andprosthetic mitral valve pathology are among the top indicationsfor a 3D TEE exam.24
A comprehensive 2D TEE examination of the entire mitralapparatus still requires numerous probe manipulations, whichincludes six individual imaging windows while advancing thetransducer through three esophageal depths, 1808 of multiplanerotation, and an infinite number of probe rotational and flexionmaneuvers. Alternatively, 3DE windows acquired with a matrix-array transducer include both area and depth (i.e., volumetricimaging) within the imaging plane. Thus, 3D transesophageal echo-cardiography requires less probe manipulation and a more efficientexamination process.
b. Data Acquisition
Simultaneous Multiplane ModeThis mode allows the mitral valve to be seen in two planesin real-time. The first image is typically a reference, midesopha-geal four-chamber or five-chamber 2D image of the mitral appar-atus, while the second image or “lateral plane” represents a planerotated 308 to 1508 from the reference plane. Multiplane imagingin the elevation plane is also available but not as useful for TEEimaging of the mitral apparatus at the midesophageal depth.Color flow Doppler imaging can also be superimposed onto the2D images.
Real-Time 3D Mode: Narrow SectorLive 3D using the matrix-array transducer permits a real-timedisplay of a 308 × 608 pyramidal volume, which is usually insuffi-cient to visualize the entire mitral apparatus in one imagingplane. However, the superior spatial and temporal resolutionpermits accurate diagnoses of complex pathologies while preserv-ing optimal temporal resolution.
Focused Wide Sector: ZoomThe zoom mode permits a focused, wide-sector view of the
mitral valve apparatus from the annulus to the papillary muscletips. It must be noted that enlarging the region of interest exces-sively will result in a further detrimental decrease of the temporalresolution. Although this modality allows the entire mitral appar-atus to be visualized, rotated, and cropped in real time, enlarge-ment of the sector is at the expense of spatial and temporalresolution relative to real-time 3D echocardiography.
Full Volume: Gated AcquisitionThe full-volume mode has the largest acquisition sector possible,which is ideal for imaging the entire mitral apparatus. This mode
also has optimal spatial resolution, which permits detailed diagnosisof complex pathologies. As well, it has high temporal resolution(.30 Hz), which is desirable when diagnosing mechanisms ofabnormal mitral leaflet motion. Similar to the real-time 3D andthe focused wide-sector zoom modalities, the gated full volumecan also be rotated to orient the mitral apparatus in unique enface views from the left atrial and LV perspectives. Furthermore,the full-volume data set can be cropped or multiplane transectedto remove tissue planes to identify components of the mitralapparatus within the volume or to visualize 2D cross-sectional x,y, and orthogonal planes using offline analysis software. Colorflow Doppler can also be performed in this mode improvingassessment of mitral regurgitation jets.
c. Comprehensive Exam
BiplaneThe comprehensive 3DE examination of the mitral apparatusbegins with a preliminary survey using the 2D multiplane modalitywhile manipulating the lateral plane with and without color flowDoppler to identify the primary mechanism and etiology ofmitral valve dysfunction. Thus, biplane imaging could enable theacquisition of an entire 2D multiplane examination of the mitralapparatus at a given esophageal depth.
Real-Time 3DThe size of the real-time 3D sector is usually insufficient to visual-ize the entire mitral apparatus. Nonetheless, the live 3D pyramidalvolume at a decreased depth and appropriate focus can display themitral valve with more than adequate spatial and temporal reso-lution to allow an initial rapid 3D assessment of the mitral appar-atus. The live 3D mode can display the mitral apparatus en facefrom either the left atrial or the LV perspective. A real-time 3DEimage of the entire left ventricle (increased depth and focus)from the midesophageal five-chamber perspective should also beobtained to view the mitral apparatus in continuity with the LVwalls and its association with the coronary sinus. Finally, a real-time3D view of the mitral apparatus should be obtained from the trans-gastric two-chamber view to more clearly visualize the papillarymuscles and chordae tendineae, which lie more perpendicularto the ultrasound beam compared with their orientation at themidesophageal depth.
Focused Wide-Sector Zoom and Full VolumeCapturing the mitral apparatus in the zoom mode from a mid-esophageal five-chamber view permits visualization of the mitralapparatus from the annulus to the papillary muscles, with slightlyreduced spatial and temporal resolution. The full-volume acquisi-tion of the mitral apparatus using the highest line density andmaximum number of individual gated component slabs shouldalways be attempted when ECG gating and the brief acquisitiontime are permissible, to obtain the most optimal spatial andtemporal resolution.
Full Volume with Color Flow DopplerColor flow Doppler should be added to the full-volume acquisitionin patients with mitral regurgitation and/or mitral stenosis. Similar
to the technique for acquiring a wide-sector zoom image, obtaininga 3D color flow Doppler data set initially requires the identificationof a region of interest in the orthogonal planes. The size of theregion of interest should be limited to the mitral apparatus andcolor flow Doppler jet to optimize frame rate. In addition, althougha high line density may be desirable, a lower line density will permita larger sector to be displayed. Finally, the largest number of indi-vidual gated component slabs (seven to 14) should always beattempted when ECG gating and the brief acquisition time are per-missible. Once the full volume with color flow Doppler is obtained,the pyramidal volume can first be viewed as originally obtainedfrom the midesophageal five-chamber view and then rotated toview the mitral apparatus from the left atrial and LV perspectivesto identify the sites of jet origin (Figure 19). Further croppingand use of the black-and-white suppress can be used to identifythe effective mitral valve orifice and regurgitant orifice areas inpatients with mitral stenosis and mitral regurgitation, respectively.
d. Clinical Validation and ApplicationEvaluation of the mitral apparatus using 3D echocardiography ismost useful for (1) defining the extent and location of pathology,(2) determining the mechanism and severity of valvular dysfunc-tion, and, when appropriate, (3) communicating the results ofthe echocardiographic examination to the interventional cardiolo-gist or cardiac surgeon when an intervention is required. Using thevarious 3DE modalities described, it is possible to delineate theextent of disease as seen in patients with myxomatous degener-ation causing diffuse thickening of the anterior and posterior leaf-lets with multisegmental prolapse or those with fibroelasticdeficiency presenting with focal involvement causing single leafletprolapse or an isolated flail scallop (Figure 20). These findingshave a significant impact on the surgical approach. Perhaps moreimportant, 3D echocardiography may be superior to 2DE techni-ques and even direct inspection during surgery for diagnosingthe location and extent of complex mitral valve disease, especially
when commissural pathology or clefts (Figure 16) are present.88–90
The evaluation of mitral prosthetic valve function may also befacilitated with 3DE techniques, especially in identifying the loca-tion and severity of perivalvular leaks (Figure 19) and for guidingthe positioning of percutaneously placed closure devices.91– 94
With improvements in image quality, commercial software hasbeen developed to provide a method for objective quantificationof mitral valve changes. Using 3DE data sets, the mitral annulusand leaflets can be traced to create a 3D model of the mitralvalve (Figure 21). From these models, volumetric measurementsof mitral annular height, mitral leaflet surface area, mitral annulardimensions, and papillary muscle location can be obtained(Figure 22). These dimensions have provided insight into theeffects of various mitral valve pathologies and may be useful fordirecting repair techniques.95
Figure 19 Three-dimensional TEE color Doppler image of mitral regurgitation (left). Three-dimensional TEE color Doppler image of anAmplatzer device after deployment presented as viewed from the right atrium (right). The jet of blood (black arrow) crossing to the rightatrium through the center of the device is normal. A residual leak is present (white arrow). AMP, Amplatzer device; AMVL, anterior mitralvalve leaflet; AV, aortic valve; LA, left atrium; RA, right atrium.
Figure 20 Zoomed 3D TEE view of the mitral valve in patientswith Barlow’s disease with multisegmental, bileaflet billowing (A)and fibroelastic deficiency with P2 flail segment and rupturedchords (B). Leaflet billowing is diagnosed when there is systolicexcursion of the leaflet body into the left atrium due to excessleaflet tissue, with the leaflet free edge remaining below theplane of the mitral annulus. The mitral valve is oriented withthe aortic valve at the 12 o’clock position.
Three-dimensional echocardiography is also superior in quanti-fying mitral stenosis severity, because unlike 2D color Dopplermethods such as proximal isovelocity surface area, 3D methods
are independent of the stenotic valve opening angle and theradius of flow convergence (Figure 23). As well, multiplanar refor-mations from 3DE images can consistently identify the smalleststenotic orifice for area measurements, and these 3DE area mea-surements are known to correlate strongly with area measure-ments derived invasively using the Gorlin formula.7,96 In contrast,2D planimetry often overestimates the orifice area when patientimage quality is poor or if the narrowest cross-sectional orificeis not properly identified.
In cases of rheumatic mitral stenosis, a 3D echocardiography–based score for percutaneous balloon mitral valvuloplasty hasbeen developed with improved predictive value of success com-pared with the 2D echocardiography–based Wilkins score.97
This improvement was achieved by adding evaluation of themitral commissural regions to the score and by allowing assess-ment of individual segments of each leaflet to acknowledge theuneven distribution of anatomic abnormalities in rheumatic mitralstenosis. Most important, the weighting of the individualcomponents of the score were adjusted according to their relativeimportance in predicting the likelihood of successful percutaneousballoon mitral valvuloplasty.
Because of the complex geometry of the mitral apparatus, 3Dechocardiography is uniquely suited for the assessment of mitral re-gurgitation. Delineation of the effective regurgitant orifice area andthe vena contracta are two major strengths of 3D echocardiog-raphy. Assessment of the vena contracta area with 3D echocardiog-raphy has revealed that it is noncircular in most patients, especially
Figure 21 Three-dimensional morphologic analysis of a normal mitral valve. The mitral annulus is manually defined and then repeated inmultiple rotational planes (A), yielding a resultant 3D contour superimposed on the en face view of the valve (B). The mitral valve leafletsare then manually traced in multiple parallel planes (C), resulting in a line of coaptation displayed on a color-coded, 3D-rendered valvesurface (D). AL, anterolateral; Ao, aorta; P, posterior; PM, posteromedial.
Figure 22 Volumetric quantification of the mitral valve allowsaccurate measurements of the height of the saddle-shaped mitralvalve (top left), commissure-to-commissure diameter measure-ments of the mitral annulus (bottom left), mitral annular surfacearea (top right), and the angle between the aortic root and themitral annulus (bottom right). A, Anterior; AL, anterolateral; Ao,aorta; P, posterior; PM, posteromedial.
those with functional mitral regurgitation (Figures 5 and 6). Three-dimensionally derived vena contracta area has been shown to cor-relate more closely with Doppler-derived effective regurgitantorifice area than 2D vena contracta diameter. In most studies,vena contracta area has been quantified by planimetry of 3Dcolor mitral regurgitation jets in orthogonal views to create four-chamber and two-chamber views of the vena contracta, whichcan be shown en face (Figure 513, top middle and top right) and per-pendicular by tilting 908 upward (Figure 5, bottom middle and bottomright) to demonstrate the eccentricity of the vena contracta. With3D echocardiography and color flow imaging, it is also possible toquantitate mitral regurgitant jet volumes. In one study comparing2DE assessment of jet areas and 3DE assessment of jet volumes,the latter showed better correlation with the angiographic refer-ence standard. This difference was particularly pronounced inpatients with eccentric jets.98 An emerging method of mitral regur-gitation quantification by 3D echocardiography is delineation of theanatomic regurgitant orifice area by direct visualization of the valveen face using parametric displays. Direct measurements are advan-tageous in that they account for the complex geometry of the valveand nonplanar geometry of the regurgitant orifice.
As of now, online quantification of the vena contracta and ana-tomic regurgitant orifice area must be done manually; a semiauto-mated method of assessment would make the process more
efficient and user-friendly. Furthermore, there are presently noprofessional society guidelines to assist in 3D quantification ofmitral regurgitation, nor is there a validated reference standardfor comparison of 2D and 3D findings. Despite these obstacles,3DE can be a valuable tool in mitral regurgitation assessment,particularly in those patients with mitral regurgitation that is feltto be underestimated by 2D imaging methods or is anatomicallycomplex.
Three-dimensional TTE and TEE assessments of mitralvalve pathology should be incorporated into routineclinical practice as they provide the best physiologic andmorphologic information regarding the mitral valve.Three-dimensional transesophageal echocardiography isrecommended for guidance of interventional mitralvalve procedures.
12. Aortic Valve and the Root
a. Anatomy and Limitations of 2DEAssessmentThe aortic root is composed of the aortic valve with its three semi-lunar cusps, which form part of the sinuses of Valsalva, and thefibrous interleaflet triangles. The aortic cusps are identified
Figure 23 Multiplanar reconstruction of a rheumatic, stenotic mitral valve imaged with zoomed, transesophageal 3D echocardiography(bottom right). Orthogonal cut planes through the narrowest mitral valve orifice in mid-diastole (top left and right) with a perpendicularplane providing an en face image for mitral valve area (MVA) measurement (bottom left).
by the corresponding presence or absence of the coronaryarteries (left coronary, right coronary, and noncoronary cusps)(Figure 24). Each semilunar cusp is attached to the aortic wall ina curved manner, with the basal attachment located in the left ven-tricle below the anatomic ventriculoaortic junction and the distalattachment at the sinotubular junction.99 The sinuses of Valsalvaand the sinotubular junction are integral parts of the valvular mech-anism, such that any significant dilatation of these structures willresult in aortic valve incompetence. Overall, when tracking thecurved path of the aortic leaflet insertion points, the 3D spatialconfiguration of the aortic valve resembles a crown.
The common approaches for imaging the aortic valve by 3Dtransthoracic echocardiography are from the parasternal andapical views. Three-dimensional data sets including the aorticroot can be cropped and rotated for a dynamic 3D rendering ofthe aortic valve, which can be visualized from both the aorticand ventricular perspectives, as well as sliced in any desired longi-tudinal or oblique plane. The aortic perspective of the valve is bestsuited for assessing valve morphology, while the ventricularperspective may best delineate aortic tumors or vegetations orsubvalvular obstructions.
An exact en face alignment of the cut plane to the aortic valveorifice is sometimes impossible to obtain in the 2D short-axis view,especially in hearts with aortic root pathology or a horizontal pos-ition. In addition, the through-plane motion of the aortic annulusthroughout the cardiac cycle due to the active longitudinal excur-sion of LV base often hampers adequate visualization of the trueaortic valve opening orifice and morphology throughout thecardiac cycle. With three-dimensional echocardiography, en facealignment of the cut plane to the aortic annulus orifice is easily
obtained, irrespective of the actual spatial orientation of theaortic root in the body. Moreover, the 3D en face view allowscomprehensive visualization of the entire aortic valve complex inmotion. Three-dimensional echocardiography also provides add-itional information on the spatial relationship with surroundingstructures, such as the LV outflow tract and mitral annulus,without the need for the cumbersome mental reconstructionapplied with 2D echocardiography.
The 2DE parasternal long-axis view of the aortic valve and rootoften underestimates LV outflow tract area, as it presumes a circu-lar shape. Three-dimensional echocardiography enables multiplaneimaging of the aortic valve (e.g., simultaneous display of the valve inboth the long and short axes), demonstrating the true shape of theLV outflow tract. As well, 3D echocardiography often confirmsnormal and abnormal findings when structures visualized in oneplane can be examined in real time by checking a second orthog-onal plane.
The apical approach allows the en face visualization of the aorticvalve by 3D echocardiography when the parasternal approach isinadequate. Even though the spatial resolution is lower comparedwith the parasternal approach, an accurate assessment of theaortic valve morphology (number of cusps and mobility, openingorifice, regurgitant orifice) and LV outflow tract anatomy is pos-sible from apical images. Gain and thresholding adjustmentsensure an accurate delineation of the aortic valve anatomicdetails, while the addition of various color maps increases thedepth perception in three dimensions. However, adequate visual-ization can be at times difficult by transthoracic 3D echocardiog-raphy either in normal (with very thin cusps, leading tosignificant drop-out of the leaflet bodies) or in heavily calcified
Figure 24 Zoomed 3D TEE image of the aortic valve as seen from the ascending aorta (Ao) in diastole (top left) and systole (top middle) andfrom the LV outflow tract (LVOT) in diastole (bottom left) and systole (bottom middle). Note that the aortic valve is oriented with the rightcoronary cusp (RCC) located inferiorly irrespective of the perspective. The 3D TEE data set is cropped to display the aortic valve in long-axisform during diastole (top right) and systole (top, left). LCC, Left coronary cusp; NCC, noncoronary cusp.
aortic valves, or when the acoustic window is inadequate. Three-dimensional color Doppler data can be displayed simultaneouslywith anatomic information derived from both 3D transthoracicechocardiography and 3D transesophageal echocardiography,adding critical data on aortic valve function and integrity.
b. Data AcquisitionThree-dimensional transesophageal echocardiography from upperesophageal views provides superior spatial resolution and imagequality for aortic valve assessment (Figure 24), and it is themethod of choice when a definite diagnosis cannot be made by3D transthoracic echocardiography.
Biplane ImagingA preliminary survey of the aortic valve can be performed using the2D multiplane modality while manipulating the lateral plane withand without color flow Doppler to identify the mechanism,etiology, and severity of aortic valve stenosis or regurgitation.
Real-Time 3DWith transesophageal echocardiography, a 2D image of the aorticvalve at either the 608 midesophageal, short-axis view or the 1208midesophageal, long-axis view should be obtained. After the 2Dimage is optimized, narrow-angled acquisitions can be used tooptimize the 3D image and to examine aortic valve and rootanatomy. After acquisition, when displayed en face, the aorticvalve should be oriented with the right coronary cusp locatedinferiorly, regardless of whether the aortic or the LV outflowtract perspective is presented (Tables 4 and 6).
Focused Wide-Sector Zoom and Full VolumeOnce a wide-angled acquisition 3D data set of the aortic root isobtained, the cropping plane can be aligned parallel to the aorticvalve orifice, as identified from the long-axis view. This results ina short-axis 3D image of the aortic valve orifice, which can beused for planimetry. As well, the cutting plane can be moved tothe LV outflow tract, the sinus of Valsalva, or the sinotubular junc-tion to obtain these respective cross-sectional areas. Last, thecropping planes can be placed perpendicular as well as parallelto the aortic annulus to assess supravalvular and subvalvularanatomy for serial stenoses.
Full Volume with Color Flow DopplerColor Doppler 3D TEE imaging should also be performed todetect the initial appearance of flow at the onset of systole.These color Doppler signals can also be cropped at the valvelevel using a parallel plane to estimate the orifice area and thevena contracta.
c. Clinical Validation and Application
Quantification of Aortic Valve AreaThree-dimensional echocardiography has been used to improveaortic valve area quantification with either planimetry100-103 orthe continuity equation.104,105 Three-dimensional TTE planime-tered aortic valve area has been reported to be feasible in 92%
of patients, with measured values correlating well with 2D TEEplanimetry and transthoracic echocardiography–derived continuityvalues.106,107 Three-dimensional TTE aortic valve areas were alsofound to have better correlation to invasively measured aorticvalve area compared with 2D TEE values.104 This is due to thedecreased operator variability with 3D echocardiography due toimproved identification on 3D echocardiography of the optimal2D transverse plane on which the aortic valve area is measured.
Beyond using 3D echocardiography to accurately localize the2D plane from which planimetry of the aortic valve area can beperformed, three-dimensional echocardiography also allows accur-ate planimetry of the LV outflow tract.108 Three-dimensional echo-cardiography has demonstrated that this structure is ellipticalrather than round, and similar to 3DE planimetry of the aorticvalve area, 3DE planimetry of the LV outflow tract has beendemonstrated to be more reproducible.109,110 With accuratemeasurement of the LV outflow tract, geometric assumptionsused in the continuity equation are avoided, resulting in moreprecise estimation of aortic valve areas using 3D echocardiographyover traditional 2DE methods.
Other authors have sought to avoid LV outflow tract values inthe calculation of aortic valve area using the continuity equation.104
This is accomplished using 3DE stroke volume obtained using asemiautomated endocardial border detection of the left ventricle.These authors showed that stroke volume obtained using thismethod is superior to 2DE and comparable with magneticresonance imaging measurements.45
Quantitative Aortic Root AnatomyAortic annular diameter was initially reported from computedtomographic studies to be more oval than round.108,111 On 3Dechocardiography, this is clearly appreciated, and 3DE aorticannular measurements from the en face views provide more accur-ate and reproducible measurements compared with 2D echocardi-ography (Figure 25). Accurate annular measurements have greatimplications for percutaneous valve procedures for valve-sizingpurposes, while annular size may also influence the surgical ap-proach and technique in valve-sparing procedures. Moreover,there are a number of parameters, which reflect the spatial rela-tionships of structures in the aortic root, that cannot be measuredby 2D echocardiography. Intercommissural distance and freeleaflet edge lengths, which can be measured by 3D echocardiog-raphy, are used to choose the tube graft size in valve-sparingroot operations.20 Three-dimensional echocardiography can alsomeasure the distance between the annulus and leaflet tips to thecoronary ostia, which is crucial for optimal placement of prostheticvalves by the percutaneous route.
Quantification of Aortic RegurgitationUsing 3DE color Doppler, the exact perpendicular plane to theaortic regurgitation jet can be identified, from which the area ofthe vena contracta can be planimetered.112 This has been shownto have a good correlation with aortographic grading of aortic re-gurgitation. As well, geometric assumptions of the vena contracta,which are invalid when the shape of the regurgitant orifice is non-symmetric, are avoided with direct measurement, thus improvingmeasurement precision.113 Three-dimensional echocardiographic
color Doppler also allows visualization, and measurement ofmultiple jets were feasible and correlated morphologically withsurgical findings.113 However, the practical impact is limited,because this study used electrocardiographically gated 3D colorflow imaging, whereas real-time volume color flow Dopplerimaging is necessary to truly evaluate the feasibility and accuracyof quantification of aortic regurgitation in three dimensions.
Three-dimensional TTE and TEE assessments of theaortic valve should be incorporated when available intothe assessment of aortic stenosis and to elucidate themechanism of aortic regurgitation. Three-dimensionaltransesophageal echocardiography is recommended forguidance of transcatheter aortic valve implantation.
13. Pulmonary Valve and Root
a. Anatomy and Limitations of 2DEAssessmentThe pulmonary root complex is composed of the pulmonary valvewith its three leaflets, the sinuses of Valsalva, the interleaflet trian-gles, and the free-standing distal RV muscular infundibulum. Thethree pulmonic valve leaflets are identified by their position in re-lation to the septum and the aortic valve. The two leaflets attachedto the septum are named the left and right leaflets and correspondto the right and left leaflets of the aortic valve to which they face.The third leaflet is called the anterior leaflet (or, if mirroring theaortic valve, the noncoronary leaflet). Assessment of the pulmon-ary valve by 2D echocardiography is difficult, because the valvecusps are difficult to visualize on the short-axis view, and usually
only two cusps can be simultaneously assessed. Three-dimensionalechocardiography, through the en face view, allows all three leaf-lets to be evaluated concurrently, as well as assessment of theRV outflow tract and main pulmonary artery. This has improvedquantitative assessment of pulmonary regurgitation and stenosis.
The pulmonary valve is better assessed by 3D transesophagealechocardiography, but on 3D transthoracic echocardiography,the best possible images can be obtained from the parasternalapproach.114 After optimizing the image of the pulmonary valveon 2D transthoracic echocardiography, live 3D TTE images ofthe valve can be obtained with greater success.
b. Data Acquisition
BiplaneA preliminary survey of the pulmonary valve can be performedusing the 2D multiplane modality while manipulating the lateralplane with and without color flow Doppler to identify the mech-anism, etiology, and severity of pulmonary valve stenosis orregurgitation.
Real-Time 3DWhen imaging the pulmonic valve in three dimensions, the TEEprobe can be positioned either at the high esophageal positionat 908 or by obtaining a three-chamber LV–aortic root view at1208 and then rotating the probe counterclockwise to bring thepulmonic valve into view. Once the valve is optimally visualized,with live 3D, the pulmonary valve can be displayed in an en faceview from either the pulmonary artery or the right ventricle.When displayed in the en face view, the anterior leaflet should
Figure 25 Three-dimensional TEE data set cropped to demonstrate the aorta in long axis (A, top). Using this image, en face views of thesinotubular junction (A, bottom left), sinus of Valsalva (A, bottom middle), and aortic annulus (A, bottom right) can be obtained for assessment.Dynamic, automatic tracking of the aortic valve leaflets (B, top left) and annulus (B, top right) can be performed, providing aortic valve areathroughout the cardiac cycle (B, middle left and bottom strip). A model derived from the automated tracking is also produced (middle right).
be located superiorly in the 12 o’clock position irrespective ofperspective (Tables 4 and 6).
Focused Wide-Sector Zoom and Full VolumeThe zoom mode image of the pulmonary valve allows visualizationof the pulmonary valve leaflets as well as the main pulmonaryartery and the RV outflow tract. Once the pyramidal volume iscaptured, the en face view of the valve can be displayed. As well,the cropping plane can be used to assess the dimensions of themain pulmonary artery and the RV outflow tract.115 Last, the crop-ping plane can be used to show the RV outflow tract, pulmonaryvalve, and main pulmonary artery in a single image.
Full Volume with Color Flow DopplerIn patients with pulmonary regurgitation or stenosis, color flowDoppler should be added to the full-volume acquisition. The sizeof the region of interest should be limited to the pulmonaryvalve and the color flow Doppler jet to optimize frame rate. Asmentioned previously, the largest number of individually gatedcomponent slabs should always be attempted when ECG gatingand brief acquisition times are possible. Once acquired, the pyram-idal volume can first be viewed as originally obtained and thenrotated to view the pulmonary valve from the pulmonary arteryand right ventricle to identify the site of jet origin. Further croppingand the use of the black-and-white suppress can be used to identifyeffective orifice area, regurgitant orifice area, 3D proximal isovelo-city surface areas, and vena contracta.
c. Clinical Validation and ApplicationEvaluation of the pulmonary valve using 3D echocardiography hasbeen shown to be most useful for defining the location of path-ology and determining the mechanism and severity of valvular dys-function. Using the modalities available with 3D echocardiography,cusp number, thickness, and mobility can be determined in patientswith congenital pulmonary valve diseases and disease processessuch as carcinoid valvulopathy, endocarditis, and so on. Additional-ly, 3D echocardiography provides accurate RV outflow tract supra-valvular, subvalvular, and valvular measurements in patients withcongenital RV outflow tract obstruction. Most importantly, 3Dechocardiography improved the accuracy in the assessment ofpulmonary regurgitation, which has implications in determiningthe timing of surgical intervention.116
There is no current evidence supporting the routine useof 3D transthoracic echocardiography or transesophagealechocardiography for the evaluation of pulmonic valvedisease.
14. Tricuspid Valve
a. Anatomy and Limitations of 2DEAssessmentThe TV is composed of the annulus, leaflets, and chordal and pap-illary muscle apparatus. The tricuspid annulus consists of a fibrousring from which the leaflets are suspended. The normal tricuspidannulus area measures between 8 and 12 cm2 and is approximately20% larger than the mitral annulus. Three-dimensional
echocardiographic assessment of the tricuspid annulus has demon-strated that the tricuspid annulus is bimodal in shape (saddleshaped) with higher or superior points (toward the right atrium)along the anterior and posterior aspects of the annulus and thelow or inferior points (toward the right ventricle) along themedial and lateral aspects of the annulus.117 – 119
The TV, as its name implies, has three leaflets, designated anter-ior, septal, and posterior. The anterior tricuspid leaflet has thelargest leaflet area and is attached along the anterolateral (freewall) surface of the tricuspid annulus. The septal leaflet attachesalong the interventricular surface and the posterior leaflet alongthe posterior portion of the annulus. Embryologically, the septaland posterior leaflets arise from the same endocardial cushionbud, but a cleft forms dividing into the septal and posterior leaflets.Tricuspid leaflets are also thinner and more translucent than themitral valve.
The tricuspid apparatus has two main papillary muscles, locatedanteriorly and posteriorly, and frequently a third one arising fromthe infundibulum (conus or RV outflow tract). Chords from eachpapillary muscle attach to all three tricuspid leaflets.
b. Data AcquisitionTwo-dimensional echocardiographic imaging of the TV requiresreconstruction from multiple planes.120 Three-dimensional TTEimaging of the TV allows visualization of all aspects of the TVfrom a single full-volume data set or a focused examination on aparticular TV aspect using a narrower imaging acquisition modewith higher resolution.120 – 122 Three-dimensional TTE imagingcan be limited by relatively low temporal resolution comparedwith 2D echocardiography.
c. Orientation and DisplayWith 3D echocardiography, it is possible to display the valve in amanner that is not possible using standard 2D echocardiography.Such an example is the en face view of the TV visualizedfrom either the right atrial or RV perspective (Figure 14).When displaying the TV en face, the septal leaflet should belocated in the 6 o’clock position irrespective of perspective(Tables 4 and 6). These en face views may be especiallyhelpful in localizing leaflet disease such as leaflet prolapse, perfor-ation, or vegetation, as well as localizing the origin of regurgita-tion jets, or planimetering the tricuspid orifice area to assessseverity of tricuspid stenosis.121,122 In addition to standardviews, the cropping plane can be adjusted to visualize a particularsection of the TV.
d. Analysis MethodsCropping methods can be performed in a standardized manner toproduce similar views for display. Standard 3DE data sets to cropinto should be obtained from parasternal and apical windows. Asubcostal 3DE data set can also be acquired but will depend onthe image quality of the subcostal window. The full-volume dataset should be optimized to view the TV and the right ventricle.Once cardiac structures are visualized with the cropping plane,the image display can be optimized using the gain, compress, andmagnification settings.
Parasternal ViewsThe TV in the RV inflow view should be optimized for 3D full-volume data acquisition. The cropping plane should crop into thedata set oriented to display the anterior and posterior leaflets ofthe TV. In most views, this should also display the orifice of thecoronary sinus and Eustachian valve (if present). A second para-sternal data set should be acquired with the TV with the RVoutflow tract and aortic valve in the short axis.
Apical ViewsThe cropping plane should crop into the data set along the coronalplane to obtain a four-chamber view of the TV with anterior andseptal leaflets in view and its chordal attachments. Then, the crop-ping plane should be oriented along the sagittal plane to visualizethe posterior and anterior leaflets of the TV. Finally, the croppingplane should be rotated (458) clockwise to include the aortic valve.This maneuver should allow visualization of the septal leaflets andanterior leaflets of the TV.
Transverse ViewsThe cropping plane should crop into the data set from the rightatrium in the transverse plane. A similar view can be obtainedcropping from the right ventricle to visualize the RV aspect ofthe TV and subvalvular apparatus.
e. Clinical Validation and ApplicationThree-dimensional echocardiographic of the TV has providedinsights into normal and abnormal TV anatomy.121,122 In a studyof 29 patients with a spectrum of TV pathologies, 3D echocardiog-raphy provided incremental diagnostic value over 2D echocardiog-raphy with regard to the etiology and location of the abnormalleaflet segments.123 Three-dimensional echocardiography hasdemonstrated that the TV annulus has a bimodal or saddle shapewith distinct high (superior) points oriented anteriorly and poster-iorly and low (inferior) points oriented medially and laterally.117
The bimodal shape is similar to that of the mitral valve annulus.With the development of functional tricuspid regurgitation, the tri-cuspid annulus becomes more planar, and also more circular,expanding mostly along the anterolateral border.117,118
In descriptive studies, 3D echocardiography has provided mech-anistic insights into tricuspid regurgitation in patients with pulmon-ary hypertension70 and congenital heart disease.124 –126 In a studyof 87 patients with pacemakers or implantable cardioverter-defibrillator leads, 3D echocardiography identified the leadposition as it traverses the TV, resulting, at times, in tricuspidregurgitation.127
3. Color Tricuspid RegurgitationThere are few data on 3D color Doppler assessment of tricuspidregurgitation. A recent article by Velayudhan et al.128 demon-strated efficacy in measuring the vena contracta of the tricuspidregurgitant jet using 3D color Doppler data. Figure 14 shows anexample of the use of color 3D echocardiography to guide venacontracta measurements. The concept of 3D-guided measurementof the vena contracta area to quantitative tricuspid regurgitationhas advantages over 2D color Doppler assessment, as it doesnot require geometric assumptions or reliance on the distant jet
for quantification. However, 3D color Doppler temporal reso-lution is low compared with 2D, and the ability to measure thevena contracta area may have technical limitations in individualpatients. The use of 3D to assess tricuspid regurgitation is likelyto increase as more experience is gained and technologicaladvances are made.
There is evidence supporting the routine use of 3Dtransthoracic echocardiography or transesophageal echo-cardiography for the evaluation of TV disease.
15. Right and Left Atria
a. Anatomy and Limitations of 2DEAssessmentThe rapid development of cardiac electrophysiology has triggeredrenewed interest in the anatomy of atrial cavities and their targetstructures. Although fluoroscopy is routinely used to localizeatrial anatomic landmarks during electrophysiologic procedures,this technique is limited by its 2D projection of complex 3D struc-tures that may render difficult interpretation and analysis, and spe-cific atrial structures such as the fossa ovalis, crista terminalis,Eustachian valve, coronary sinus ostium, and pulmonary veinostia may be difficult to visualize. Thus, a preprocedural assessmentof the various atrial landmarks involved in electrophysiologic pro-cedures may have clinical relevance, providing electrophysiologistswith a useful preprocedural anatomic “roadmap.”17 Because theatria are close to the esophagus, 3D transesophageal echocardiog-raphy provides fine anatomic data of internal atrial structures, asrecently shown.129
The cross-sectional approach has been for a long time andremains the most common way of displaying echocardiographicimages. Using 3D transesophageal echocardiography, the sameanatomic structures may be imaged from countless perspectives.Thus, for discrete atrial landmarks, rather than a “cross-sectional”approach, a “structure-oriented” approach should be used. Once aspecific anatomic target has been identified (usually using a zoommodality, biplane oriented), the volume data set can be cropped,expanded, and oriented to obtain the most effective perspective.
Right Atrial AnatomyThe right atrium consists of four components, the right atrialappendage, the venous part, the vestibulum, and the atrialseptum, which is shared with the left atrium. However, specificanatomic structures such as the crista terminalis, cavotricuspidisthmus, Eustachian valve, coronary sinus ostium, and fossa ovale,are of particular interest because they are targets for catheter-based procedures.
Crista TerminalisAn external fat-filled groove, the sulcus terminalis, divides thevenous part of the atrium from the right atrial appendage (thetrue primitive atrium). The sinus node is located in this grooveclose to the superior cavoatrial junction. The sulcus terminaliscorresponds internally to the crista terminalis, which is a roughlyC-shaped muscular band separating the smooth wall of the
venous component from the rough wall of the right atrial append-age.130 Pectinate muscles emerge from the crista terminalis,spreading out into the right atrial appendage. The crista may varyin size and thickness, appearing as a small, thin, valvelike or a broad-based structure. A very large crista terminalis mimicking a mass canbe found in so-called lipomatous hypertrophy of atrial septum,which is caused by an extensive fatty infiltration of the sulcus ter-minalis. The crista terminalis is an area of marked anisotropy, andalmost two thirds of focal right atrial tachycardias occurring in theabsence of structural heart disease arise along the crista termina-lis131 and, occasionally, are the target for catheter ablation.Because the crista terminalis originates from the superior venacava dividing the right atrial appendage from the sinus, both the su-perior vena cava and right atrial appendage are useful landmarks tolocalize the crista terminalis.22 When the crista terminalis has abroad-based insertion, one of the easiest methods for imaging
the entire course of the crista terminalis from right perspectiveis depicted in Figure 26.
Cavotricuspid Isthmus and Surrounding StructuresThe cavotricuspid isthmus is a well-defined region of atrial tissue thatis related to the origin of typical atrial flutter. The cavotricuspidisthmus is a roughly quadrilateral-shaped atrial wall bordered bythe tricuspid hinge line anteriorly and by the Eustachian valve poster-iorly. The inferior border of the ostium of the coronary sinus lines thesuperomedial border, while the inferolateral border is delineated bythe final ramification of the crista terminalis.132 In normal hearts, thetopography of the cavotricuspid isthmus is not flat. Usually a slightdepression (sub-Eustachian pouch or sinus of Keith) between theEustachian ridge and the TV can be found. In some individuals, thispouch may be deeper than normal or even aneurysmal. The Eusta-chian valve is a semilunar flap of fibrous or fibrous-muscular tissue
Figure 26 Still image depicting the two perpendicular 2D TEE planes (A,B) used to acquire a zoomed 3D TEE data set of the interatrialseptum (C). The left side of the atrial septum (AS) in shown in the en face perspective visualized after a 908 up-down rotation (curvedarrow) of the data set (D). Image D can be cropped to remove the left half of the atrial septum (E), and when rotated 908 counterclockwise(curved arrow), the entire course of the crista terminalis (CT) from the superior vena cava (SVC) toward the inferior vena cava (arrows) can bevisualized, as seen in image F. Ao, Aorta; CS, coronary sinus; FO, fossa ovalis; LA, left atrium; RA, right atrium; RAA, right atrial appendage; RUPV,right upper pulmonary vein.
variably developed that guards the entrance of the inferior vena cava.The Eustachian valve continues medially with a muscular band calledthe Eustachian ridge. This latter delineates the border between thefossa ovale and the ostium of the coronary sinus. Occasionally, theEustachian valve may be very prominent. The coronary sinusostium is the entrance of the coronary sinus and a flap of thinfibrous tissue called the Thebesian valve guards it. Because the cavo-tricuspid isthmus is not a specific structure but a muscular region ofright atrial cavity bordered by well recognizable anatomic landmarks,imaging these structures can draw the virtual perimeter of the cavo-tricuspid isthmus. Simultaneous visualization of the posterior tricus-pid hinge line, the Eustachian valve, and the ostium of the coronarysinus can be obtained when focusing on the atrial cavity, regardlessof the initial cut plane used (four-chamber, basal short-axis, orbicaval view). The ostium of coronary sinus is located medially tothe Eustachian valve and can be visualized by a 908 clockwise rotationfrom the four-chamber cut (Figures 27 and 28).
The fossa ovalis is a relevant anatomic landmark important toidentify when performing transseptal punctures for left-sidedcatheter-based procedures and left pulmonary vein ablation. Thesize, location, and topography of the fossa ovalis may vary fromheart to heart. The fossa ovalis is a depression in the right sideof the atrial septum. At the left side, the septum primum coversthis region and is usually featureless. The fossa ovalis actuallyrepresents the “true” atrial septum in the sense that it directly
divides the two atrial chambers. The majority of the remainingtissue that separates the atrial chambers is composed of an infold-ing of the atrial wall with fibrofatty tissue that extends from theepicardium.133 Imaging of the fossa ovalis is usually obtainedfrom a 2D TEE bicaval plane view. The depth of pyramidal dataset should be adjusted to include only the left and the right sidesof the atrial septum. This specific setting allows the entireseptum to be acquired in 3D format without surrounding struc-tures. With a 908 up-down angulation of the pyramidal data set,the entire left-sided aspect of the septum is shown in an “enface perspective” (Figure 29). Once the left side of the atrialseptum is acquired, a 1808 counterclockwise rotation shows theright side of the atrial septum and the fossa ovalis as a depressionon the septum (Figure 30). Sometimes a fine cropping using thearbitrary crop plane is necessary to remove those surroundingatrial structures that may cover the septum. A gain setting atmedium level is usually required to avoid disappearance of thefossa ovalis and creating a false image of an atrial septal defect.
Left Atrial AnatomyThe left atrium consists of three parts: the appendage, the vesti-bule, and the venous component. The left atrial appendage is amultilobar structure located between the left upper pulmonaryvein and the left ventricle. The vestibule is the part of the leftatrium that surrounds the mitral valve orifice and has no distinctive
Figure 27 Three-dimensional TEE en face image of the cavotricuspid isthmus (CVTI) (top right), which is similar to the fluoroscopic left an-terior oblique projection. A view perpendicular allows visualization of the CVTI from the Eustachian valve (EV) insertion point to the white dotsdemarcating the TV hinge line (top left). Magnified 3DE en face image of the EV (bottom left) in which the superior border of the valve is welldefined. With slight rotation, the inferior border can be visualized (bottom middle and right). Ao, Aorta; CS, coronary sinus; FO, fossa ovalis; IVC,inferior vena cava; SVC, superior vena cava.
anatomic characteristics. The pulmonary veins drain oxygenatedblood from the lung into the left atrium through oval-shapedostia. Although there is significant variability in the dimensions,shape, and branching patterns of the pulmonary veins, the mostcommon pattern of entry is two veins from the hilum of eachlung. The superior pulmonary vein ostia tend to be larger andhave longer distances from the ostium to the first-order branchesthan the inferior veins. The right superior pulmonary vein lies justbehind the superior vena cava. The left pulmonary veins are sepa-rated from the left atrial appendage by the ligament of Marshall.
b. Data Acquisition
Biplane ImagingA preliminary survey of the left atrium can be performed using the2D multiplane modality while manipulating the lateral plane withand without color flow Doppler to identify the pulmonary veins.
Real-Time 3DOverall, acquisition of the left atrium for volume and function mea-surements should be from TTE views or TEE transgastric views(Tables 2 and 3). With midesophageal TEE views, the entire leftatrium cannot be seen within the imaging pyramid, precluding mea-surements of left atrial volumes. As well, 3D transesophageal echo-cardiography cannot visualize the entire atrial posterior wall withall four pulmonary veins. However, it can provide high-qualityimages of one or two of the pulmonary vein ostia and surroundingleft atrial tissue. Three-dimensional transesophageal echocardiog-raphy is ideal for visualization of the interatrial septum and itsadjacent structures (Figure 31).
From the midesophageal 908 TEE view of the mitral valve andleft atrial appendage with a slight counter clockwise rotation,one or both of the left pulmonary veins can be displayed. Oncethe 2D TEE image is optimized, narrow-angled acquisitions canbe used to optimize the 3D image (Figure 31). Because the twoleft pulmonary veins have different directions, slight up-and-downmanipulations of the TEE transducer may be required to maximize
Figure 28 Three-dimensional TEE image of the crux cordis, which is the cross-shaped intersection between the atrial and ventricular septalplanes and the plane of the atrioventricular junction (A). With slight rotation of the image to expose the right side of the atrial septum, theostium of the coronary sinus (CS) becomes more visible (B), and the septal isthmus (SI) (C), the region between the inferior border of CS andthe hinge line of the TV, can be visualized. Image D is a photograph of an anatomic specimen presented in a view similar to the image in C. LA,Left atrium; LV, left ventricle; MV, Mitral valve; RA, right atrium; RV, right ventricle.
visualization of the ostia of the superior or inferior pulmonary vein,respectively.
From the midesophageal view of the left pulmonary veins, aclockwise rotation depicts the entire atrial septum en face. Thisimage can be rotated to display it from the left or right atrialperspectives. The right pulmonary veins appear in the long-axisorientation. With a slight down-to-up angulation, the ostia ofboth right pulmonary veins become visible.
Focused Wide-Sector Zoom and Full VolumeOnce a wide-angled acquisition 3D data set of the septum isobtained, the cropping plane can be used to optimize views ofthe septum, demonstrating its relationship to structures such asthe mitral valve, right upper pulmonary vein, and aorta (Table 5).As well, the cropping planes can be aligned perpendicular to thepulmonary vein orifices to obtain ostial dimensions (Figure 32).
Full Volume with Color Flow DopplerColor Doppler 3D imaging should also be performed to assessflow in the pulmonary veins.
Transthoracic EchocardiographyTo assess right and left atrial volumes, the data set should beacquired from an apical approach, taking care to encompass theentire atrial cavities. Sometimes (e.g., in enlarged atria) separate
dedicated acquisitions are needed to be able to acquire thewhole right or left atrium.
c. Clinical Validation and ApplicationThree-dimensional transthoracic echocardiography has been usedto assess left atrial volumes in patients undergoing radiofrequencycatheter ablation of atrial fibrillation.134 –136 Volumes obtainedfrom 3D echocardiography were smaller than on angiography andelectroanatomic mapping. These results suggested that left atrialvolumes obtained by angiography or electroanatomic mappingshould not be used as baseline values for noninvasive follow-up. Aswell, these studies also demonstrated that left atrial volumes andfunction improves if sinus rhythm is maintained after ablation.
There is promise that 3D transthoracic echocardiog-raphy will improve the accuracy of left atrial volume mea-surements. However, no studies to date have evaluatedright atrial volumes.
16. Left Atrial Appendage
a. Anatomy and Limitations of 2DEAssessmentThe left atrial appendage is a long, tubular, multilobar structurethat is usually heavily trabeculated with muscular structures, theso-called pectinate muscles. The left atrial appendage orifice is
Figure 29 Composite image showing the two perpendicular planes on 2D transesophageal echocardiography (A,B) used to acquire zoomed3D TEE data set of the atrial septum (AS) (C). Note that the sector dimension is larger in the x and z directions and shorter in the y direction.These settings allow the interatrial septum to be acquired in high resolution excluding right atrial structures that may mask the right aspect ofthe septum. A 908 up-down rotation (curved arrow) of the pyramidal data set allow the left atrial side of the AS to be viewed (D). LA, Left atrium;MV, mitral valve; RA, right atrium; RUPV, right upper pulmonary vein.
located between the left upper pulmonary vein and the left ven-tricle and extends anteriorly over the atrioventricular (coronary)sulcus.137,138 The orifice separates the trabeculated walls of theleft atrial appendage from the smooth walls of the left atrium(Figure 32).139 The circumflex branch of the left coronary artery
runs close to the left atrial appendage basal orifice. The cardiaclymphatic drainage of the left ventricle is thought to passbeneath the left atrial appendage.137,140 Studies has demonstratedgreat variability in left atrial appendage volume, length,principal-axis angle, and orifice diameter.139,141,142
Figure 30 Three-dimensional TEE image of the left atrial septum (AS) oriented with the right upper pulmonary vein (RUPV) located super-iorly (A). Progressive rotation of this image following the curved arrows (B) reveals the crater-shaped fossa ovalis (FO) (C) and the entrance ofthe superior vena cava (SVC) and coronary sinus (CS) (D).
Figure 31 Three-dimensional TEE image of the left upper pulmonary vein (LUPV) and left lower pulmonary vein (LLPV) (A). Slight angu-lation makes it possible to visualize both ostia simultaneously. Three-dimensional TEE image of right upper pulmonary vein (RUPV) and rightlower pulmonary vein (RLPV) in long-axis (B) and short-axis (C) orientations. Ao, Aortic valve; AS, atrial septum; LOM, ligament of Marshall; MV,mitral valve.
Biplane ImagingTwo-dimensional multiplane imaging of the left atrial appendagecan be performed from a single view of the left atrial appendageat 08, 458, 908, or 1358. Manipulation of the lateral plane allowsidentification of the left atrial appendage lobes.
Real-Time 3DFrom the 08, 458, 908, or 1358 2D TEE views of the left atrialappendage, narrow-acquisition 3D images can be used to optimizegain settings (Table 3).
Focused Wide-Sector Zoom and Full VolumeOn zoom-mode images, the cropping plane can be used to obtainan en face view of the left atrial appendage orifice that can bemeasured. As well, the planes can be adjusted to obtain leftatrial appendage depth. Table 5 describes the presentation of theleft atrial appendage.
c. Clinical Validation and ApplicationThree-dimensional echocardiography plays an important role inpercutaneous closure of the left atrial appendage. Three-dimensional echocardiography has been shown to be superior to2D transesophageal echocardiography in discriminating betweenleft atrial appendage pectinate musculature and thrombus inpatients with atrial fibrillation.100 As well, to determine devicesize, accurate left atrial appendage orifice area is needed. Studieshave shown that 3D TEE measurements from the en face viewof left atrial appendage orifice area correlate well with computed
tomographic values, while 2D transesophageal echocardiographyunderestimated left atrial appendage orifice area. Importantly,3DE imaging allows the left atrial appendage to be well visualizedbefore, during, and after the procedure.
17. 3D Stress EchocardiographyThree-dimensional stress echocardiography represents a major ad-vancement for the evaluation of ischemic heart disease. It has beenperformed with exercise,143,144 dobutamine,10,145 –148 and dypiri-damole,11,149 with high feasibility and good sensitivity and specifi-city for the detection of angiographic coronary artery disease.Three-dimensional stress echocardiography has also been success-fully combined with contrast.150,151 Although a learning curve isrequired to perform 3D stress echocardiography adequately,advantages of 3D stress echocardiography include (1) better visu-alization of the LV apex, which is frequently foreshortened onstandard 2DE apical images; (2) rapid acquisition of peak stressimages before the heart rate declines in recovery; and (3) evalu-ation of multiple segments from different planes from a singledata set. Disadvantages include lower spatial resolution andlower frame rates. Moreover, only recently has 3DE technologyallowed side-by-side display of rest and stress images forcomparison.11
a. Acquisition MethodsMatrix-array transducers allow different approaches to performmultiplanar or 3D stress echocardiography. Whether two oreven three image planes can be recorded simultaneouslydepends on the capabilities of the equipment.
Figure 32 Zoomed 3D TEE image of the left atrial appendage (LAA) orifice as viewed from the left atrium (top left) and of the completeappendage in long axis (LAX) (top middle). From the 3DE data set, two orthogonal LAX 2D planar views of the left atrial appendage can bedisplayed (bottom left and middle) as well as a short-axis view (bottom right). Zoomed 3D TEE image of the pulmonary (Pul) veins in cross-section(top left). A, Area; D, dimension.
In biplane mode, the spatial relation of both image planes can bemodified in three directions: rotation around a central stablelongitudinal axis, elevation, and lateral tilt (Figure 33). Using thetriplane approach, three image planes can be rotated around alongitudinal axis (the y axis) with variable increments (Figure 9).The spatial and temporal resolution of the images acquired witha matrix array transducer in biplane and triplane scanning modesare similar to conventional 2D images. However, the acquisitiontime is shorter because two or three planes are simultaneouslycaptured.
The acquisition of gated 3DE data sets allows analysis of thecomplete circumference of the LV wall and not only two orthree selected image planes with the corresponding wall segments,which can lead to image plane positioning errors. Temporal reso-lution depends on the number of acquired subvolumes andsegment depth but regularly lies between 30 and 50 volumes/sec. The smaller the number or the wider the angle of the acquiredsubsegments, the lower spatial and time resolution will be. Single-beat acquisition of full-volume LV data is a recent developmentfrom some vendors, and the spatial and temporal resolution ofthese systems are currently being evaluated.
b. Data AcquisitionLike conventional 2D techniques, 3D echocardiography duringstress can be performed at rest, at low and peak load or dose,and during recovery. Both physical stress (either bicycle or tread-mill exercise) and pharmacologic stress (mainly dobutamine plus
atropine) can be used in combination with 3D echocardiography.The use of dipyridamole offers the advantage of not increasingthe heart rate significantly, which is of value when using a techniquethat has limited temporal resolution. Left-heart contrast agents canbe used for improved endocardial delineation as continuous infu-sion or bolus injections immediately before the acquisition ofimages at each stress level. However, for gated 3DE data setsacquired over several cardiac cycles, contrast infusions are pre-ferred to maintain a constant concentration of microbubblesduring data acquisition. Many 3DE systems currently have contrastspecific settings, similar to those used with 2D echocardiography.
Biplane ModeThis mode allows the simultaneous acquisition of the parasternallong axis and an adapted parasternal short axis, which can bebest achieved by laterally tilting the second plane 308 to 408 inthe apical direction. From the apical approach, acquisition using abiplane mode starts with simultaneous apical four-chamber andtwo-chamber views. The orientation of the matrix transducer isfirst optimized to obtain an anatomically correct four-chamberview on the left image screen. Using the rotation around thestable y axis (longitudinal rotation), the second image plane (i.e.,right screen) is turned to about 308 so that the inferior wall isseen on the left and the anterior segments on the right imageside. Then, the right image is rotated to about 2408, resulting inan apical long axis with the posterior wall to the left and the ante-roseptal segments to the right. The other biplane image (i.e., leftscreen) remains stable, showing the apical four-chamber-view.Thus, three heartbeats must be acquired serially from two echo-cardiographic windows to record all necessary image planes.Image plane orientation must be stored in the echocardiographicequipment as individual settings to enable side-by-side visualizationfor comparison of rest and stress images.
Triplane ModeAcquisition of triplane data is typically not performed from theparasternal window but rather from a single apical echocardio-graphic window. In most patients, a default setting of 608 incre-ments between the three planes allows the simultaneousvisualization of the four-chamber and two-chamber views as wellas the apical long axis. Furthermore, when omitting parasternalrecordings, triplane scanning facilitates a single transducer positionfor the acquisition of images at each stress stage. Loops from allthree image planes are stored separately and analyzed side byside in a manner comparable with that of conventional 2D stressechocardiography.
Gated ModeThe acquisition of gated 3DE data sets during stress furtherdecreases the number of serially acquired heartbeats. Stress echo-cardiographic acquisition of full-volume data is normally performedfrom a single apical approach, similar to that of the triplane modal-ity. Parasternal gated 3DE recordings in the majority of patients arenot able to encompass the entire left ventricle and therefore arenot recommended. A minimum of a single full-volume data setshould be acquired at each stress level. The main difference
Figure 33 (Top) Biplane mode showing how the spatial rela-tion of both image planes can be modified in three directions:rotation around a central stable longitudinal axis (y axis) (leftpanel), elevation tilt (rotation around a frontal axis, x axis)(middle panel), and lateral tilt (rotation around a capital axis, zaxis) (right panel). Using the multiplane approach, two (bottomleft) or three (bottom right) image planes can be rotated arounda longitudinal axis (y axis) with variable increments. The defaultsetting for the angle between imaging planes is 608.
between conventional 2DE and multiplanar and especially full-volume 3D stress echocardiography is the significantly shorterscanning time required to complete the study.
On the basis of this rapid method of data acquisition, the narrowtime window at peak stress, especially during physical exerciseechocardiography, can be used more effectively when acquiring acomplete 3DE data set. Performing stress echo in a biplane or tri-plane approach results in a higher heart rate during exercise stressacquisition, thus facilitating ischemia detection. Furthermore, thereis no need to change the transducer position during apical scanningonce the optimal window is identified. This makes acquisitioneasier and faster for both beginner and expert echocardiographers(Figure 34).
c. Analysis MethodsA 3DE full-volume data set incorporating the entire left ventricle isrequired for analysis. To optimize the volume rate, the size of thedata set should be adjusted during acquisition so that extraneousstructures such as the right ventricle and left atrium are excluded.Furthermore, if the 3D ultrasound system has an option for in-creasing volume rates (perhaps by using more subvolumes), thatoption should be selected.
On some 3DE systems, single-beat full-volume acquisitions canbe performed at reasonable volume rates, thereby avoiding subvo-lume stitch artifacts. Indeed, if the data set has been created usingsubvolumes, it is important to validate its integrity before proceed-ing with the analysis. This is achieved by cropping down from theapex in a transverse plane, inspecting for stitching artifacts betweensubvolumes. For analysis, a full-volume data set of the left ventriclecan be cropped in a number of different ways using slicing techni-ques to create semiconventional 2D “slices” of the left ventricle(Figure 4). These would typically include the three longitudinal
planes: apical four-chamber, two-chamber, long-axis, and a seriesof transverse (short-axis) planes. The latter planes are usually sixor nine in number and are conventionally arranged in equidistantintervals from the base of the left ventricle to the apex(Figure 35). This is analogous to the display methodology used inmagnetic resonance imaging.
An important advantage of acquiring apical full-volume data setsthat incorporate the entire left ventricle is the avoidance of fore-shortening. Although higher image quality on apical 2D echocardi-ography can often be obtained by using a higher intercostal space,this results in foreshortening of the left ventricle so that the trueLV apex is not visualized. This can be avoided using 3D echocardi-ography because, if the entire left ventricle is incorporated withinthe data set, postacquisition cropping can be used to create 2DEequivalent images that are not foreshortened. Furthermore, theuse of slicing with adjustment of the planes in three vectors facil-itates geometric correction and ensures that no plane is off axis.With 3D, every plane can be adjusted to ensure that it iscorrect geometrically and that it correlates with other planesacquired at different stress stages.
However, manual cropping of the LV data set is time consuming.Therefore, 3D stress echocardiographic software incorporatingauto-cropping features that create standard 2D slices on thebasis of the presumption that the apical full-volume data set hasbeen acquired using a standard orientation. The auto-croppedplanes could then be manually adjusted at baseline to achievethe desired views. This manual cropping adjustment could beused as a template, which the software will then use to createviews at subsequent stress stages. Again, manual adjustmentsshould be possible at each stage. Some 3D stress software usesfeature extraction techniques that incorporate preloaded 3Dimage templates. Pattern recognition is used to identify anatomic
Figure 34 Diagram illustrating the differences between conventional 2DE, multiplanar, and full-volume 3D imaging modes in the number ofseparate views that must be acquired for a complete echocardiographic stress study. As the number of acquisitions decreases, the scanning timerequired to complete the study becomes shorter. 4CV, Four-chamber view; PLAX, parasternal long-axis; PSAX, parasternal short-axis; 3CV, three-chamber view; 2CV, two-chamber view.
landmarks within the 3D data set, simplifying and allowing an auto-mated cropping process. In addition to the use of the slicing tech-nique that creates “standard” 2D views from the 3D data set, it isalso possible to continuously move or rotate the cropping planeduring playback to effectively create an infinite number of planes.For example, a four-chamber equivalent plane could be slowlyrotated through 1808 to help identify off-axis wall motionabnormalities that might otherwise be missed.
d. Orientation and DisplayConventional 2D stress echocardiograms are usually analyzed bydisplaying the same view at different stages side by side. It wouldbe therefore more familiar for most users if the multislice formatderived from stress 3D data sets would also be displayed in aside-by-side format. New 3D stress software allows this feature,and it is recommended to use this display methodology when avail-able. There is a limit to the number of views that can be simultan-eously displayed on a monitor with appropriate size and resolutionto facilitate analysis. An alternative display mode would be to selectjust one view and display it simultaneously with the same viewobtained at other stages.
e. Clinical Validation and ApplicationMultislice views from 3DE stress studies should be interpreted in asimilar way as conventional 2D stress studies evaluatingstress-induced wall motion and thickening abnormalities.Side-by-side display of baseline and the various stress-stageimages facilitates this. Adjustment of the image planes to avoidforeshortening and ensure reproducibility of the scan planesbetween stages will further increase the accuracy of 3DE stresstechniques. In evaluating the diagnostic and prognostic value ofstress echocardiography, it has been demonstrated that it is notonly the presence and severity of stress-induced regional wallmotion abnormalities that are related to the extent of coronarydisease and predictive of outcome, but changes in ejection fractionand ventricular volume have been also shown to be equally im-portant.152,153 By permitting more accurate assessment of LVvolume and ejection fraction, especially in patients with resting
wall motion abnormalities, 3D echocardiography has a potentialto further improve the accuracy of 2D stress echocardiographybut is still limited by temporal resolution.
LV dyssynchrony, which is analogous to tardokinesis, is also amarker for stress-induced ischemia and can be detected by 3Dechocardiography as well as by other techniques. Three-dimensional stress studies using dynamic maps of contraction(Figure 11, lower left) may more accurately localize and estimatethe severity of stress-induced ischemia by identifying areas ofdelayed contraction.
Because of its ability to acquire the entire LV volumewithin one beat, 3D stress transthoracic echocardiographyholds promise for incorporation into clinical practice inthe future.
18. ConclusionsThree-dimensional transthoracic echocardiography currently com-plements routine 2D echocardiography in daily clinical practice byproviding additional volumetric information. However, its full com-plementary potential has not been exploited. Table 7 describes theopinions of the writing group on the basis of available literatureregarding the utility of 3D echocardiography in the assessmentof cardiac function and structures. This recommendation paper isaimed to be a practical technical operation document for 3D trans-thoracic echocardiography and transesophageal echocardiographywith current standard echocardiographic systems and on-cart soft-ware. The details will become obsolete with future systems andsoftware, but once having started clinical 3D echocardiographywith a full understanding of basic terminology and menus, onecan more easily follow future evolution. However, it is importantthat 3D images be displayed in a uniform manner to facilitate inter-pretation and comparisons between studies (Table 5 and 6). In thenear future, the ability to acquire a single-heartbeat full-volumedata set with higher temporal and spatial resolution, and live3DE color Doppler imaging with a larger angle, should be feasible.All these will continue to enhance 3DE utility and efficiency in dailyclinical practice.
Figure 35 A 3D TTE full volume data set can be acquired from the apical window (left) and later cropped into a number of transverse slicesfrom the apex to the base of the left ventricle (right). This imaging display is especially useful during 3D stress studies.
Notice and DisclaimerThis report is made available by the ASE and the EAE as a courtesyreference source for their members. This report contains recom-mendations only and should not be used as the sole basis to makemedical practice decisions or for disciplinary action against anyemployee. The statements and recommendations contained inthis report are based primarily on the opinions of experts, ratherthan on scientifically verified data. The ASE and EAE make noexpress or implied warranties regarding the completeness oraccuracy of the information in this report, including the warrantyof merchantability or fitness for a particular purpose. In no eventshall the ASE or EAE be liable to you, your patients, or anyother third parties for any decision made or action taken by you
or such other parties in reliance on this information. Nor doesyour use of this information constitute the offering of medicaladvice by the ASE or EAE or create any physician-patient relation-ship between the ASE, EAE, and your patients or anyone else.
References1. Hung J, Lang R, Flachskampf F, Shernan SK, McCulloch ML, Adams DB et al. 3D
echocardiography: a review of the current status and future directions. J Am SocEchocardiogr 20 (2007) 213–233.
2. Fenster A, Downey DB, Cardinal HN. Three-dimensional ultrasound imaging.Phys Med Biol 46 (2001) R67–R99.
3. Cao QL, Pandian NG, Azevedo J, Schwartz SL, Vogel M, Fulton D et al. Enhancedcomprehension of dynamic cardiovascular anatomy by three-dimensional echo-cardiography with the use of mixed shading techniques. Echocardiography 11(1994) 627–633.
4. Rankin RN, Fenster A, Downey DB, Munk PL, Levin MF, Vellet AD. Three-dimensional sonographic reconstruction: techniques and diagnostic applications.AJR Am J Roentgenol 161 (1993) 695–702.
5. Pandian NG, Roelandt J, Nanda NC, Sugeng L, Cao QL, Azevedo J et al. Dynamicthree-dimensional echocardiography: methods and clinical potential. Echocardiog-raphy 11 (1994) 237–259.
6. Yang HS, Bansal RC, Mookadam F, Khandheria BK, Tajik AJ, Chandrasekaran K.Practical guide for three-dimensional transthoracic echocardiography using afully sampled matrix array transducer. J Am Soc Echocardiogr 21 (2008) 979–989.
7. Zamorano J, Cordeiro P, Sugeng L, Perez de Isla L, Weinert L, Macaya C et al.Real-time three-dimensional echocardiography for rheumatic mitral valve sten-osis evaluation: an accurate and novel approach. J Am Coll Cardiol 43 (2004)2091–2096.
8. Matsumura Y, Fukuda S, Tran H, Greenberg NL, Agler DA, Wada N et al. Geom-etry of the proximal isovelocity surface area in mitral regurgitation by 3-dimensional color Doppler echocardiography: difference between functionalmitral regurgitation and prolapse regurgitation. Am Heart J 155 (2008) 231–238.
9. Cheng TO, Xie MX, Wang XF, Wang Y, Lu Q. Real-time 3-dimensional echocar-diography in assessing atrial and ventricular septal defects: an echocardiographic-surgical correlative study. Am Heart J 148 (2004) 1091–1095.
10. Yoshitani H, Takeuchi M, Mor-Avi V, Otsuji Y, Hozumi T, Yoshiyama M. Com-parative diagnostic accuracy of multiplane and multislice three-dimensionaldobutamine stress echocardiography in the diagnosis of coronary arterydisease. J Am Soc Echocardiogr 22 (2009) 437–442.
11. Badano LP, Muraru D, Rigo F, Del Mestre L, Ermacora D, Gianfagna P et al. Highvolume-rate three-dimensional stress echocardiography to assess induciblemyocardial ischemia: a feasibility study. J Am Soc Echocardiogr 23 (2010)628–635.
12. Mor-Avi V, Sugeng L, Lang RM. Real-time 3-dimensional echocardiography: anintegral component of the routine echocardiographic examination in adultpatients? Circulation 119 (2009) 314–329.
13. Kahlert P, Plicht B, Schenk IM, Janosi RA, Erbel R, Buck T. Direct assessment ofsize and shape of noncircular vena contracta area in functional versus organicmitral regurgitation using real-time three-dimensional echocardiography. J AmSoc Echocardiogr 21 (2008) 912–921.
14. Muraru D, Cardillo M, Livi U, Badano LP. 3-dimensional transesophageal echo-cardiographic assessment of papillary muscle rupture complicating acute myo-cardial infarction. J Am Coll Cardiol 56 (2010) e45.
15. Vegas A, Meineri M. Core review: three-dimensional transesophageal echocardi-ography is a major advance for intraoperative clinical management of patientsundergoing cardiac surgery: a core review. Anesth Analg 110 (2010) 1548–1573.
16. Moustafa SE, Chandrasekaran K, Khandheria B, Tajik J, Mookadam F. Real-timethree-dimensional transesophageal echocardiography assessment of the mitralvalve: perioperative advantages and game-changing findings. J Heart Valve Dis20 (2011) 114–122.
17. Faletra FF, Regoli F, Nucifora G, Auricchio A. Real-time, fluoroless, anatomic-guided catheter navigation by 3D TEE during ablation procedures. JACC Cardio-vasc Imaging 4 (2011) 203–206.
18. Altiok E, Hamada S, van Hall S, Hanenberg M, Dohmen G, Almalla M et al. Com-parison of direct planimetry of mitral valve regurgitation orifice area by three-dimensional transesophageal echocardiography to effective regurgitant orificearea obtained by proximal flow convergence method and vena contracta areadetermined by color Doppler echocardiography. Am J Cardiol 107 (2011)452–458.
19. Biaggi P, Gruner C, Jedrzkiewicz S, Karski J, Meineri M, Vegas A et al. Assessmentof mitral valve prolapse by 3D TEE angled views are key. JACC Cardiovasc Imaging4 (2011) 94–97.
20. Otani K, Takeuchi M, Kaku K, Sugeng L, Yoshitani H, Haruki N et al. Assessmentof the aortic root using real-time 3D transesophageal echocardiography. Circ J74 (2010) 2649–2657.
21. Pushparajah K, Miller OI, Simpson JM. 3D echocardiography of the atrial septum:anatomical features and landmarks for the echocardiographer. JACC CardiovascImaging 3 (2010) 981–984.
22. Faletra FF, Ho SY, Auricchio A. Anatomy of right atrial structures by real-time3D transesophageal echocardiography. JACC Cardiovasc Imaging 3 (2010)966–975.
23. Lee AP, Lam YY, Yip GW, Lang RM, Zhang Q, Yu CM. Role of real time three-dimensional transesophageal echocardiography in guidance of interventionalprocedures in cardiology. Heart 96 (2010) 1485–1493.
24. Flachskampf FA, Badano L, Daniel WG, Feneck RO, Fox KF, Fraser AG et al.Recommendations for transoesophageal echocardiography: update 2010. Eur JEchocardiogr 11 (2010) 557–576.
25. Monaghan MJ. Role of real time 3D echocardiography in evaluating the left ven-tricle. Heart 92 (2006) 131–136.
26. Caiani EG, Coon P, Corsi C, Goonewardena S, Bardo D, Rafter P et al. Dual trig-gering improves the accuracy of left ventricular volume measurements bycontrast-enhanced real-time 3-dimensional echocardiography. J Am Soc Echocar-diogr 18 (2005) 1292–1298.
27. Nucifora G, Marsan NA, Holman ER, Siebelink HM, van Werkhoven JM,Scholte AJ et al. Real-time 3-dimensional echocardiography early after acutemyocardial infarction: incremental value of echo-contrast for assessment ofleft ventricular function. Am Heart J 157 (2009) 882–888.
28. Jenkins C, Moir S, Chan J, Rakhit D, Haluska B, Marwick TH. Left ventricularvolume measurement with echocardiography: a comparison of left ventricularopacification, three-dimensional echocardiography, or both with magnetic res-onance imaging. Eur Heart J 30 (2009) 98–106.
29. Krenning BJ, Kirschbaum SW, Soliman OI, Nemes A, van Geuns RJ, Vletter WBet al. Comparison of contrast agent-enhanced versus non-contrastagent-enhanced real-time three-dimensional echocardiography for analysis ofleft ventricular systolic function. Am J Cardiol 100 (2007) 1485–1489.
30. Lang RM, Bierig M, Devereux RB, Flachskampf FA, Foster E, Pellikka PA et al.Recommendations for chamber quantification: a report from the AmericanSociety of Echocardiography’s Guidelines and Standards Committee and theChamber Quantification Writing Group, developed in conjunction with theEuropean Association of Echocardiography, a branch of the European Societyof Cardiology. J Am Soc Echocardiogr 18 (2005) 1440–1463.
31. Muraru D, Badano LP, Piccoli G, Gianfagna P, Del Mestre L, Ermacora D et al.Validation of a novel automated border-detection algorithm for rapid and accur-ate quantitation of left ventricular volumes based on three-dimensional echocar-diography. Eur J Echocardiogr 11 (2010) 359–368.
32. Mor-Avi V, Jenkins C, Kuhl HP, Nesser HJ, Marwick TH, Franke A et al. Real-time3-dimensional echocardiographic quantification of left ventricular volumes: mul-ticenter study for validation with magnetic resonance imaging and investigationof sources of error. JACC Cardiovasc Imaging 1 (2008) 413–423.
33. Mannaerts HF, van der Heide JA, Kamp O, Stoel MG, Twisk J, Visser CA. Earlyidentification of left ventricular remodelling after myocardial infarction, assessedby transthoracic 3D echocardiography. Eur Heart J 25 (2004) 680–687.
34. Caiani EG, Corsi C, Zamorano J, Sugeng L, MacEneaney P, Weinert L et al.Improved semiautomated quantification of left ventricular volumes and ejectionfraction using 3-dimensional echocardiography with a full matrix-array trans-ducer: comparison with magnetic resonance imaging. J Am Soc Echocardiogr 18(2005) 779–788.
35. Jenkins C, Bricknell K, Hanekom L, Marwick TH. Reproducibility and accuracy ofechocardiographic measurements of left ventricular parameters using real-timethree-dimensional echocardiography. J Am Coll Cardiol 44 (2004) 878–886.
36. Jacobs LD, Salgo IS, Goonewardena S, Weinert L, Coon P, Bardo D et al. Rapidonline quantification of left ventricular volume from real-time three-dimensionalechocardiographic data. Eur Heart J 27 (2006) 460–468.
37. Shiota T, McCarthy PM, White RD, Qin JX, Greenberg NL, Flamm SD et al.Initial clinical experience of real-time three-dimensional echocardiography inpatients with ischemic and idiopathic dilated cardiomyopathy. Am J Cardiol 84(1999) 1068–1073.
38. Lee D, Fuisz AR, Fan PH, Hsu TL, Liu CP, Chiang HT. Real-time 3-dimensionalechocardiographic evaluation of left ventricular volume: correlation with mag-netic resonance imaging—a validation study. J Am Soc Echocardiogr 14 (2001)1001–1009.
39. Chan J, Jenkins C, Khafagi F, Du L, Marwick T. What is the optimal clinical tech-nique for measurement of left ventricular volume after myocardial infarction? Acomparative study of 3-dimensional echocardiography, single photon emissioncomputed tomography, and cardiac magnetic resonance imaging. J Am Soc Echo-cardiogr 19 (2006) 192–201.
40. Sugeng L, Mor-Avi V, Weinert L, Niel J, Ebner C, Steringer-Mascherbauer R et al.Quantitative assessment of left ventricular size and function: side-by-side com-parison of real-time three-dimensional echocardiography and computed tomog-raphy with magnetic resonance reference. Circulation 114 (2006) 654–661.
41. Corsi C, Lang RM, Veronesi F, Weinert L, Caiani EG, MacEneaney P et al. Volu-metric quantification of global and regional left ventricular function from real-time three-dimensional echocardiographic images. Circulation 112 (2005)1161–1170.
42. Bicudo LS, Tsutsui JM, Shiozaki A, Rochitte CE, Arteaga E, Mady C et al. Value ofreal time three-dimensional echocardiography in patients with hypertrophic car-diomyopathy: comparison with two-dimensional echocardiography and magnet-ic resonance imaging. Echocardiography 25 (2008) 717–726.
43. Zeidan Z, Erbel R, Barkhausen J, Hunold P, Bartel T, Buck T. Analysis of globalsystolic and diastolic left ventricular performance using volume-time curves byreal-time three-dimensional echocardiography. J Am Soc Echocardiogr 16(2003) 29–37.
44. Kuhl HP, Schreckenberg M, Rulands D, Katoh M, Schafer W, Schummers G et al.High-resolution transthoracic real-time three-dimensional echocardiography:
quantitation of cardiac volumes and function using semi-automatic border detec-tion and comparison with cardiac magnetic resonance imaging. J Am Coll Cardiol43 (2004) 2083–2090.
45. Gutierrez-Chico JL, Zamorano JL, Perez de Isla L, Orejas M, Almeria C,Rodrigo JL et al. Comparison of left ventricular volumes and ejection fractionsmeasured by three-dimensional echocardiography versus by two-dimensionalechocardiography and cardiac magnetic resonance in patients with various car-diomyopathies. Am J Cardiol 95 (2005) 809–813.
46. Nikitin NP, Constantin C, Loh PH, Ghosh J, Lukaschuk EI, Bennett A et al. Newgeneration 3-dimensional echocardiography for left ventricular volumetric andfunctional measurements: comparison with cardiac magnetic resonance. Eur JEchocardiogr 7 (2006) 365–372.
47. van den Bosch AE, Robbers-Visser D, Krenning BJ, Voormolen MM, McGhie JS,Helbing WA et al. Real-time transthoracic three-dimensional echocardiographicassessment of left ventricular volume and ejection fraction in congenital heartdisease. J Am Soc Echocardiogr 19 (2006) 1–6.
48. Pouleur AC, le Polain de Waroux JB, Pasquet A, Gerber BL, Gerard O, Allain Pet al. Assessment of left ventricular mass and volumes by three-dimensionalechocardiography in patients with or without wall motion abnormalities: com-parison against cine magnetic resonance imaging. Heart 94 (2008) 1050–1057.
49. Qi X, Cogar B, Hsiung MC, Nanda NC, Miller AP, Yelamanchili P et al. Live/realtime three-dimensional transthoracic echocardiographic assessment of left ven-tricular volumes, ejection fraction, and mass compared with magnetic resonanceimaging. Echocardiography 24 (2007) 166–173.
50. Soliman OI, Kirschbaum SW, van Dalen BM, van der Zwaan HB, Mahdavian DB,Vletter WB et al. Accuracy and reproducibility of quantitation of left ventricularfunction by real-time three-dimensional echocardiography versus cardiac mag-netic resonance. Am J Cardiol 102 (2008) 778–783.
51. Jenkins C, Chan J, Hanekom L, Marwick TH. Accuracy and feasibility of online3-dimensional echocardiography for measurement of left ventricular para-meters. J Am Soc Echocardiogr 19 (2006) 1119–1128.
52. Shimada YJ, Shiota T. A meta-analysis investigation for the source of bias of leftventricular volumes function by three-dimensional echocardiography in com-parison with magnetic resonance imaging. Am J Cardiol 107 (2011) 126–138.
53. Caiani EG, Corsi C, Sugeng L, MacEneaney P, Weinert L, Mor-Avi V et al.Improved quantification of left ventricular mass based on endocardial and epi-cardial surface detection with real time three dimensional echocardiography.Heart 92 (2006) 213–219.
54. Mor-Avi V, Sugeng L, Weinert L, MacEneaney P, Caiani EG, Koch R et al. Fastmeasurement of left ventricular mass with real-time three-dimensional echocar-diography: comparison with magnetic resonance imaging. Circulation 110 (2004)1814–1818.
55. Qin JX, Jones M, Travaglini A, Song JM, Li J, White RD et al. The accuracy of leftventricular mass determined by real-time three-dimensional echocardiographyin chronic animal and clinical studies: a comparison with postmortem examin-ation and magnetic resonance imaging. J Am Soc Echocardiogr 18 (2005)1037–1043.
56. Oe H, Hozumi T, Arai K, Matsumura Y, Negishi K, Sugioka K et al. Comparisonof accurate measurement of left ventricular mass in patients with hypertrophiedhearts by real-time three-dimensional echocardiography versus magnetic reson-ance imaging. Am J Cardiol 95 (2005) 1263–1267.
57. van den Bosch AE, Robbers-Visser D, Krenning BJ, McGhie JS, Helbing WA,Meijboom FJ et al. Comparison of real-time three-dimensional echocardiographyto magnetic resonance imaging for assessment of left ventricular mass. Am JCardiol 97 (2006) 113–117.
58. Takeuchi M, Nishikage T, Mor-Avi V, Sugeng L, Weinert L, Nakai H et al. Meas-urement of left ventricular mass by real-time three-dimensional echocardiog-raphy: validation against magnetic resonance and comparison withtwo-dimensional and m-mode measurements. J Am Soc Echocardiogr 21 (2008)1001–1005.
59. Takeuchi M, Jacobs A, Sugeng L, Nishikage T, Nakai H, Weinert L et al. Assess-ment of left ventricular dyssynchrony with real-time 3-dimensional echocardiog-raphy: comparison with Doppler tissue imaging. J Am Soc Echocardiogr 20 (2007)1321–1329.
60. Marsan NA, Bleeker GB, Ypenburg C, Ghio S, van de Veire NR, Holman ER et al.Real-time three-dimensional echocardiography permits quantification of leftventricular mechanical dyssynchrony and predicts acute response to cardiacresynchronization therapy. J Cardiovasc Electrophysiol 19 (2008) 392–399.
61. Marsan NA, Bleeker GB, Ypenburg C, van Bommel RJ, Ghio S, van de Veire NRet al. Real-time three-dimensional echocardiography as a novel approach toassess left ventricular and left atrium reverse remodeling and to predict re-sponse to cardiac resynchronization therapy. Heart Rhythm 5 (2008)1257–1264.
62. Kleijn SA, van Dijk J, de Cock CC, Allaart CP, van Rossum AC, Kamp O. Assess-ment of intraventricular mechanical dyssynchrony and prediction of response to
cardiac resynchronization therapy: comparison between tissue Doppler imagingand real-time three-dimensional echocardiography. J Am Soc Echocardiogr 22(2009) 1047–1054.
63. Soliman OI, Geleijnse ML, Theuns DA, van Dalen BM, Vletter WB, Jordaens LJet al. Usefulness of left ventricular systolic dyssynchrony by real-time three-dimensional echocardiography to predict long-term response to cardiac resyn-chronization therapy. Am J Cardiol 103 (2009) 1586–1591.
64. Becker M, Hoffmann R, Schmitz F, Hundemer A, Kuhl H, Schauerte P et al. Re-lation of optimal lead positioning as defined by three-dimensional echocardiog-raphy to long-term benefit of cardiac resynchronization. Am J Cardiol 100 (2007)1671–1676.
65. Mor-Avi V, Lang R.M. The use of real-time three-dimensional echocardiographyfor the quantification of left ventricular volumes and function. Curr Opin Cardiol24 (2009) 402–409.
66. Monaghan M. Echocardiographic assessment of left ventricular dyssynchrony—isthree-dimensional echocardiography just the latest kid on the block? J Am SocEchocardiogr 22 (2009) 240–241.
67. Perez de Isla L, Balcones DV, Fernandez-Golfin C, Marcos-Alberca P, Almeria C,Rodrigo JL et al. Three-dimensional-wall motion tracking: a new and faster toolfor myocardial strain assessment: comparison with two-dimensional-wall motiontracking. J Am Soc Echocardiogr 22 (2009) 325–330.
68. Mertens LL, Friedberg M.K. Imaging the right ventricle—current state of the art.Nat Rev Cardiol 7 (2010) 551–563.
69. Mangion JR. Right ventricular imaging by two-dimensional and three-dimensionalechocardiography. Curr Opin Cardiol 25 (2010) 423–429.
70. Sukmawan R, Watanabe N, Ogasawara Y, Yamaura Y, Yamamoto K, Wada Net al. Geometric changes of tricuspid valve tenting in tricuspid regurgitation sec-ondary to pulmonary hypertension quantified by novel system with transthor-acic real-time 3-dimensional echocardiography. J Am Soc Echocardiogr 20(2007) 470–476.
71. Sugeng L, Mor-Avi V, Weinert L, Niel J, Ebner C, Steringer-Mascherbauer R et al.Multimodality comparison of quantitative volumetric analysis of the right ven-tricle. JACC Cardiovasc Imaging 3 (2010) 10–18.
72. Shiota T. 3D echocardiography: evaluation of the right ventricle. Curr OpinCardiol 24 (2009) 410–414.
73. Tamborini G, Brusoni D, Torres Molina JE, Galli CA, Maltagliati A, Muratori Met al. Feasibility of a new generation three-dimensional echocardiography forright ventricular volumetric and functional measurements. Am J Cardiol 102(2008) 499–505.
74. Gopal AS, Chukwu EO, Iwuchukwu CJ, Katz AS, Toole RS, Schapiro W et al.Normal values of right ventricular size and function by real-time 3-dimensionalechocardiography: comparison with cardiac magnetic resonance imaging. J AmSoc Echocardiogr 20 (2007) 445–455.
75. Niemann PS, Pinho L, Balbach T, Galuschky C, Blankenhagen M, Silberbach Met al. Anatomically oriented right ventricular volume measurements withdynamic three-dimensional echocardiography validated by 3-Tesla magnetic res-onance imaging. J Am Coll Cardiol 50 (2007) 1668–1676.
76. Kjaergaard J, Petersen CL, Kjaer A, Schaadt BK, Oh JK, Hassager C. Evaluation ofright ventricular volume and function by 2D and 3D echocardiography com-pared to MRI. Eur J Echocardiogr 7 (2006) 430–438.
77. Kjaergaard J, Sogaard P, Hassager C. Quantitative echocardiographic analysis ofthe right ventricle in healthy individuals. J Am Soc Echocardiogr 19 (2006)1365–1372.
78. Tamborini G, Marsan NA, Gripari P, Maffessanti F, Brusoni D, Muratori M et al.Reference values for right ventricular volumes and ejection fraction with real-time three-dimensional echocardiography: evaluation in a large series ofnormal subjects. J Am Soc Echocardiogr 23 (2010) 109–115.
79. Kjaergaard J, Hastrup SJ, Sogaard P, Chen X, Bay NH, Kober L et al. Advancedquantitative echocardiography in arrhythmogenic right ventricular cardiomyop-athy. J Am Soc Echocardiogr 20 (2007) 27–35.
80. Acar P, Abadir S, Roux D, Taktak A, Dulac Y, Glock Y et al. Ebstein’s anomalyassessed by real-time 3-D echocardiography. Ann Thorac Surg 82 (2006)731–733.
81. Grewal J, Majdalany D, Syed I, Pellikka P, Warnes CA. Three-dimensional echo-cardiographic assessment of right ventricular volume and function in adultpatients with congenital heart disease: comparison with magnetic resonanceimaging. J Am Soc Echocardiogr 23 (2010) 127–133.
82. Scheurer M, Bandisode V, Ruff P, Atz A, Shirali G. Early experience with real-time three-dimensional echocardiographic guidance of right ventricular biopsyin children. Echocardiography 23 (2006) 45–49.
83. Tamborini G, Muratori M, Brusoni D, Celeste F, Maffessanti F, Caiani EG et al. Isright ventricular systolic function reduced after cardiac surgery? A two- andthree-dimensional echocardiographic study. Eur J Echocardiogr 10 (2009)630–634.
84. Lancellotti P, Moura L, Pierard LA, Agricola E, Popescu BA, Tribouilloy C et al.European Association of Echocardiography recommendations for the assess-ment of valvular regurgitation. Part 2: mitral and tricuspid regurgitation (nativevalve disease). Eur J Echocardiogr 11 (2010) 307–332.
85. Levine RA, Durst R. Mitral valve prolapse: a deeper look. JACC Cardiovasc Imaging1 (2008) 304–306.
86. Sugeng L, Coon P, Weinert L, Jolly N, Lammertin G, Bednarz JE et al. Use of real-time 3-dimensional transthoracic echocardiography in the evaluation of mitralvalve disease. J Am Soc Echocardiogr 19 (2006) 413–421.
87. Gutierrez-Chico JL, Zamorano Gomez JL, Rodrigo-Lopez JL, Mataix L, Perez deIsla L, Almeria-Valera C et al. Accuracy of real-time 3-dimensional echocardiog-raphy in the assessment of mitral prolapse. Is transesophageal echocardiographystill mandatory? Am Heart J 155 (2008) 694–698.
88. Tamborini G, Muratori M, Maltagliati A, Galli CA, Naliato M, Zanobini M et al.Pre-operative transthoracic real-time three-dimensional echocardiography inpatients undergoing mitral valve repair: accuracy in cases with simple vs.complex prolapse lesions. Eur J Echocardiogr 11 (2010) 778–785.
89. Pepi M, Tamborini G, Maltagliati A, Galli CA, Sisillo E, Salvi L et al. Head-to-headcomparison of two- and three-dimensional transthoracic and transesophagealechocardiography in the localization of mitral valve prolapse. J Am Coll Cardiol48 (2006) 2524–2530.
90. Grewal J, Mankad S, Freeman WK, Click RL, Suri RM, Abel MD et al. Real-timethree-dimensional transesophageal echocardiography in the intraoperative as-sessment of mitral valve disease. J Am Soc Echocardiogr 22 (2009) 34–41.
91. Garcia-Fernandez MA, Cortes M, Garcia-Robles JA, Gomez de Diego JJ,Perez-David E, Garcia E. Utility of real-time three-dimensional transesophagealechocardiography in evaluating the success of percutaneous transcatheterclosure of mitral paravalvular leaks. J Am Soc Echocardiogr 23 (2010) 26–32.
92. Becerra JM, Almeria C, Perez de Isla L, Zamorano J. Usefulness of 3D transoe-sophageal echocardiography for guiding wires and closure devices in mitral peri-valvular leaks. Eur J Echocardiogr 10 (2009) 979–981.
93. Kim MS, Casserly IP, Garcia JA, Klein AJ, Salcedo EE, Carroll JD. Percutaneoustranscatheter closure of prosthetic mitral paravalvular leaks: are we there yet?JACC Cardiovasc Interv 2 (2009) 81–90.
94. Tsang W, Lang RM, Kronzon I. Role of real-time three dimensional echocardiog-raphy in cardiovascular interventions. Heart 97 (2011) 850–857.
95. Chandra S, Salgo IS, Sugeng L, Weinert L, Settlemier SH, Mor-Avi V et al. Athree-dimensional insight into the complexity of flow convergence in mitral re-gurgitation: adjunctive benefit of anatomic regurgitant orifice area. Am J PhysiolHeart Circ Physiol 301 (2011) H1015–H1024.
96. Perez de Isla L, Casanova C, Almeria C, Rodrigo JL, Cordeiro P, Mataix L et al.Which method should be the reference method to evaluate the severity ofrheumatic mitral stenosis? Gorlin’s method versus 3D-echo. Eur J Echocardiogr8 (2007) 470–473.
97. Anwar AM, Attia WM, Nosir YF, Soliman OI, Mosad MA, Othman M et al. Val-idation of a new score for the assessment of mitral stenosis using real-timethree-dimensional echocardiography. J Am Soc Echocardiogr 23 (2010) 13–22.
98. De SR, Glombitza G, Vahl CF, Albers J, Meinzer HP, Hagl S. Three-dimensionalcolor Doppler: a clinical study in patients with mitral regurgitation. J Am CollCardiol 33 (1999) 1646–1654.
99. Anderson RH. Clinical anatomy of the aortic root. Heart 84 (2000) 670–673.100. Kasprzak JD, Nosir YF, Dall’Agata A, Elhendy A, Taams M, Ten Cate FJ et al.
Quantification of the aortic valve area in three-dimensional echocardiographicdata sets: analysis of orifice overestimation resulting from suboptimal cut-planeselection. Am Heart J 135 (1998) 995–1003.
101. Suradi H, Byers S, Green-Hess D, Gradus-Pizlo I, Sawada S, Feigenbaum H. Feasi-bility of using real time “live 3D” echocardiography to visualize the stenoticaortic valve. Echocardiography 27 (2010) 1011–1020.
102. de la Morena G, Saura D, Oliva MJ, Soria F, Gonzalez J, Garcia M et al. Real-timethree-dimensional transoesophageal echocardiography in the assessment ofaortic valve stenosis. Eur J Echocardiogr 11 (2010) 9–13.
103. Nakai H, Takeuchi M, Yoshitani H, Kaku K, Haruki N, Otsuji Y. Pitfalls of anatom-ical aortic valve area measurements using two-dimensional transoesophagealechocardiography and the potential of three-dimensional transoesophagealechocardiography. Eur J Echocardiogr 11 (2010) 369–376.
104. Gutierrez-Chico JL, Zamorano JL, Prieto-Moriche E, Hernandez-Antolin RA,Bravo-Amaro M, Perez de Isla L et al. Real-time three-dimensional echocardiog-raphy in aortic stenosis: a novel, simple, and reliable method to improve accur-acy in area calculation. Eur Heart J 29 (2008) 1296–1306.
105. Poh KK, Levine RA, Solis J, Shen L, Flaherty M, Kang YJ et al. Assessing aorticvalve area in aortic stenosis by continuity equation: a novel approach using real-time three-dimensional echocardiography. Eur Heart J 29 (2008) 2526–2535.
106. Goland S, Trento A, Iida K, Czer LS, De RM, Naqvi TZ et al. Assessment ofaortic stenosis by three-dimensional echocardiography: an accurate and novelapproach. Heart 93 (2007) 801–807.
107. Ge S, Warner J.G Jr, Abraham TP, Kon ND, Brooker RF, Nomeir AM et al.Three-dimensional surface area of the aortic valve orifice by three-dimensionalechocardiography: clinical validation of a novel index for assessment of aorticstenosis. Am Heart J 136 (1998) 1042–1050.
108. Messika-Zeitoun D, Serfaty JM, Brochet E, Ducrocq G, Lepage L, Detaint D et al.Multimodal assessment of the aortic annulus diameter: implications for trans-catheter aortic valve implantation. J Am Coll Cardiol 55 (2010) 186–194.
109. Doddamani S, Bello R, Friedman MA, Banerjee A, Bowers J.H Jr, Kim B et al.Demonstration of left ventricular outflow tract eccentricity by real time 3Dechocardiography: implications for the determination of aortic valve area. Echo-cardiography 24 (2007) 860–866.
110. Shahgaldi K, Manouras A, Brodin LA, Winter R. Direct measurement of left ven-tricular outflow tract area using three-dimensional echocardiography in biplanemode improves accuracy of stroke volume assessment. Echocardiography 27(2010) 1078–1085.
111. Doddamani S, Grushko MJ, Makaryus AN, Jain VR, Bello R, Friedman MA et al.Demonstration of left ventricular outflow tract eccentricity by 64-slice multi-detector CT. Int J Cardiovasc Imaging 25 (2009) 175–181.
112. Chin CH, Chen CH, Lo H.S. The correlation between three-dimensional venacontracta area and aortic regurgitation index in patients with aortic regurgita-tion. Echocardiography 27 (2010) 161–166.
113. Fang L, Hsiung MC, Miller AP, Nanda NC, Yin WH, Young MS et al. Assessmentof aortic regurgitation by live three-dimensional transthoracic echocardiographicmeasurements of vena contracta area: usefulness and validation. Echocardiog-raphy 22 (2005) 775–781.
114. Kelly NF, Platts DG, Burstow DJ. Feasibility of pulmonary valve imaging usingthree-dimensional transthoracic echocardiography. J Am Soc Echocardiogr 23(2010) 1076–1080.
115. Anwar AM, Soliman O, van den Bosch AE, McGhie JS, Geleijnse ML, Ten Cate FJet al. Assessment of pulmonary valve and right ventricular outflow tract withreal-time three-dimensional echocardiography. Int J Cardiovasc Imaging 23(2007) 167–175.
117. Fukuda S, Saracino G, Matsumura Y, Daimon M, Tran H, Greenberg NL et al.Three-dimensional geometry of the tricuspid annulus in healthy subjects andin patients with functional tricuspid regurgitation: a real-time, 3-dimensionalechocardiographic study. Circulation 114 (2006) I492–I498.
118. Ton-Nu TT, Levine RA, Handschumacher MD, Dorer DJ, Yosefy C, Fan D et al.Geometric determinants of functional tricuspid regurgitation: insights from 3-dimensional echocardiography. Circulation 114 (2006) 143–149.
119. Anwar AM, Soliman OI, Nemes A, van Geuns RJ, Geleijnse ML, Ten Cate FJ.Value of assessment of tricuspid annulus: real-time three-dimensional echocar-diography and magnetic resonance imaging. Int J Cardiovasc Imaging 23 (2007)701–705.
120. Anwar AM, Geleijnse ML, Soliman OI, McGhie JS, Frowijn R, Nemes A et al. As-sessment of normal tricuspid valve anatomy in adults by real-time three-dimensional echocardiography. Int J Cardiovasc Imaging 23 (2007) 717–724.
121. Muraru D, Badano LP, Sarais C, Solda E, Iliceto S. Evaluation of tricuspid valvemorphology and function by transthoracic three-dimensional echocardiography.Curr Cardiol Rep 13 (2011) 242–249.
122. Badano LP, Agricola E, Perez de Isla L, Gianfagna P, Zamorano JL. Evaluation ofthe tricuspid valve morphology and function by transthoracic real-time three-dimensional echocardiography. Eur J Echocardiogr 10 (2009) 477–484.
123. Pothineni KR, Duncan K, Yelamanchili P, Nanda NC, Patel V, Fan P et al. Live/realtime three-dimensional transthoracic echocardiographic assessment of tricuspidvalve pathology: incremental value over the two-dimensional technique. Echocar-diography 24 (2007) 541–552.
124. Abadir S, Leobon B, Acar P. Assessment of tricuspid regurgitation mechanism bythree-dimensional echocardiography in an adult patient with congenitally cor-rected transposition of the great arteries. Arch Cardiovasc Dis 102 (2009)459–460.
125. Enar S, Singh P, Douglas C, Panwar SR, Manda J, Kesanolla SK et al. Live/real timethree-dimensional transthoracic echocardiographic assessment of transpositionof the great arteries in the adult. Echocardiography 26 (2009) 1095–1104.
126. Takahashi K, Inage A, Rebeyka IM, Ross DB, Thompson RB, Mackie AS et al.Real-time 3-dimensional echocardiography provides new insight into mechan-isms of tricuspid valve regurgitation in patients with hypoplastic left heart syn-drome. Circulation 120 (2009) 1091–1098.
127. Seo Y, Ishizu T, Nakajima H, Sekiguchi Y, Watanabe S, Aonuma K. Clinical utilityof 3-dimensional echocardiography in the evaluation of tricuspid regurgitationcaused by pacemaker leads. Circ J 72 (2008) 1465–1470.
128. Velayudhan DE, Brown TM, Nanda NC, Patel V, Miller AP, Mehmood F et al.Quantification of tricuspid regurgitation by live three-dimensional transthoracic
echocardiographic measurements of vena contracta area. Echocardiography 23(2006) 793–800.
129. Faletra FF, Nucifora G, Ho SY. Imaging the atrial septum using real-time three-dimensional transesophageal echocardiography: technical tips normal anatomyits role in transseptal puncture. J Am Soc Echocardiogr 24 (2011) 593–599.
130. Loukas M, Tubbs RS, Tongson JM, Polepalli S, Curry B, Jordan R et al. The clinicalanatomy of the crista terminalis, pectinate muscles and the teniae sagittalis. AnnAnat 190 (2008) 81–87.
131. Olgin JE, Kalman JM, Saxon LA, Lee RJ, Lesh MD. Mechanism of initiation of atrialflutter in humans: site of unidirectional block and direction of rotation. J Am CollCardiol 29 (1997) 376–384.
132. Cabrera JA, Sanchez-Quintana D, Ho SY, Medina A, Anderson RH. The architec-ture of the atrial musculature between the orifice of the inferior caval vein andthe tricuspid valve: the anatomy of the isthmus. J Cardiovasc Electrophysiol 9(1998) 1186–1195.
133. Ho SY. Pulmonary vein ablation in atrial fibrillation: does anatomy matter?J Cardiovasc Electrophysiol 14 (2003) 156–157.
134. Miyasaka Y, Tsujimoto S, Maeba H, Yuasa F, Takehana K, Dote K et al. Left atrialvolume by real-time three-dimensional echocardiography: validation by 64-slicemultidetector computed tomography. J Am Soc Echocardiogr 24 (2011) 680–686.
135. Marsan NA, Tops LF, Holman ER, van de Veire NR, Zeppenfeld K, Boersma Eet al. Comparison of left atrial volumes and function by real-time three-dimensional echocardiography in patients having catheter ablation for atrial fib-rillation with persistence of sinus rhythm versus recurrent atrial fibrillation threemonths later. Am J Cardiol 102 (2008) 847–853.
136. Delgado V, Vidal B, Sitges M, Tamborero D, Mont L, Berruezo A et al. Fate of leftatrial function as determined by real-time three-dimensional echocardiographystudy after radiofrequency catheter ablation for the treatment of atrial fibrilla-tion. Am J Cardiol 101 (2008) 1285–1290.
137. Maurice SM, Palmer AS, Miller AJ, Greene R. Lymphatic drainage of the heart inthe laboratory rat. Lymphology 34 (2001) 145–148.
138. Syed TM, Halperin JL. Left atrial appendage closure for stroke prevention inatrial fibrillation: state of the art and current challenges. Nat Clin Pract CardiovascMed 4 (2007) 428–435.
139. Ernst G, Stollberger C, Abzieher F, Veit-Dirscherl W, Bonner E, Bibus B et al.Morphology of the left atrial appendage. Anat Rec 242 (1995) 553–561.
140. Palmer AS, Miller AJ, Greene R. The lymphatic drainage of the left ventricle inthe Yucatan minipig. Lymphology 31 (1998) 30–33.
141. Al-Saady NM, Obel OA, Camm AJ. Left atrial appendage: structure, function, androle in thromboembolism. Heart 82 (1999) 547–554.
142. Veinot JP, Harrity PJ, Gentile F, Khandheria BK, Bailey KR, Eickholt JT et al.Anatomy of the normal left atrial appendage: a quantitative study of age-related
changes in 500 autopsy hearts: implications for echocardiographic examination.Circulation 96 (1997) 3112–3115.
143. Walimbe V, Garcia M, Lalude O, Thomas J, Shekhar R. Quantitative real-time 3-dimensional stress echocardiography: a preliminary investigation of feasibility andeffectiveness. J Am Soc Echocardiogr 20 (2007) 13–22.
144. Peteiro J, Pinon P, Perez R, Monserrat L, Perez D, Castro-Beiras A. Comparisonof 2- and 3-dimensional exercise echocardiography for the detection of coron-ary artery disease. J Am Soc Echocardiogr 20 (2007) 959–967.
145. Aggeli C, Giannopoulos G, Misovoulos P, Roussakis G, Christoforatou E,Kokkinakis C et al. Real-time three-dimensional dobutamine stress echocardiog-raphy for coronary artery disease diagnosis: validation with coronary angiog-raphy. Heart 93 (2007) 672–675.
146. Matsumura Y, Hozumi T, Arai K, Sugioka K, Ujino K, Takemoto Y et al. Non-invasive assessment of myocardial ischaemia using new real-time three-dimensional dobutamine stress echocardiography: comparison with convention-al two-dimensional methods. Eur Heart J 26 (2005) 1625–1632.
147. Eroglu E, D’hooge J, Herbots L et al. Comparison of real-time tri-plane and con-ventional 2D dobutamine stress echocardiography for the assessment of coron-ary artery disease. Eur Heart J 27 (2006) 1719–1724.
148. Yang HS, Pellikka PA, McCully RB, Oh JK, Kukuzke JA, Khandheria BK et al. Roleof biplane and biplane echocardiographically guided 3-dimensional echocardiog-raphy during dobutamine stress echocardiography. J Am Soc Echocardiogr 19(2006) 1136–1143.
149. Varnero S, Santagata P, Pratali L, Basso M, Gandolfo A, Bellotti P. Head to headcomparison of 2D vs real time 3D dipyridamole stress echocardiography. Cardi-ovasc Ultrasound 6 (2008) 31.
150. Pulerwitz T, Hirata K, Abe Y, Otsuka R, Herz S, Okajima K et al. Feasibility ofusing a real-time 3-dimensional technique for contrast dobutamine stress echo-cardiography. J Am Soc Echocardiogr 19 (2006) 540–545.
151. Takeuchi M, Otani S, Weinert L, Spencer KT, Lang RM. Comparison ofcontrast-enhanced real-time live 3-dimensional dobutamine stress echocardiog-raphy with contrast 2-dimensional echocardiography for detectingstress-induced wall-motion abnormalities. J Am Soc Echocardiogr 19 (2006)294–299.
152. Chuah SC, Pellikka PA, Roger VL, McCully RB, Seward JB. Role of dobutaminestress echocardiography in predicting outcome in 860 patients with known orsuspected coronary artery disease. Circulation 97 (1998) 1474–1480.
153. Arruda AM, McCully RB, Oh JK, Mahoney DW, Seward JB, Pellikka PA. Prognos-tic value of exercise echocardiography in patients after coronary artery bypasssurgery. Am J Cardiol 87 (2001) 1069–1073.
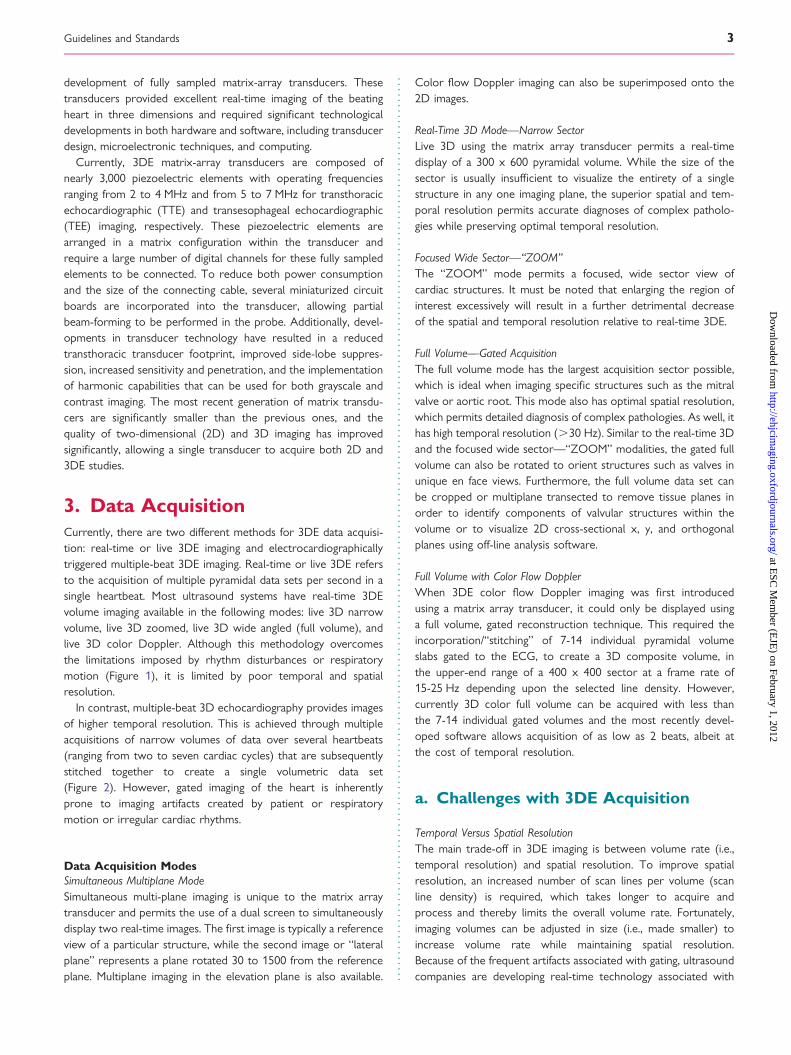
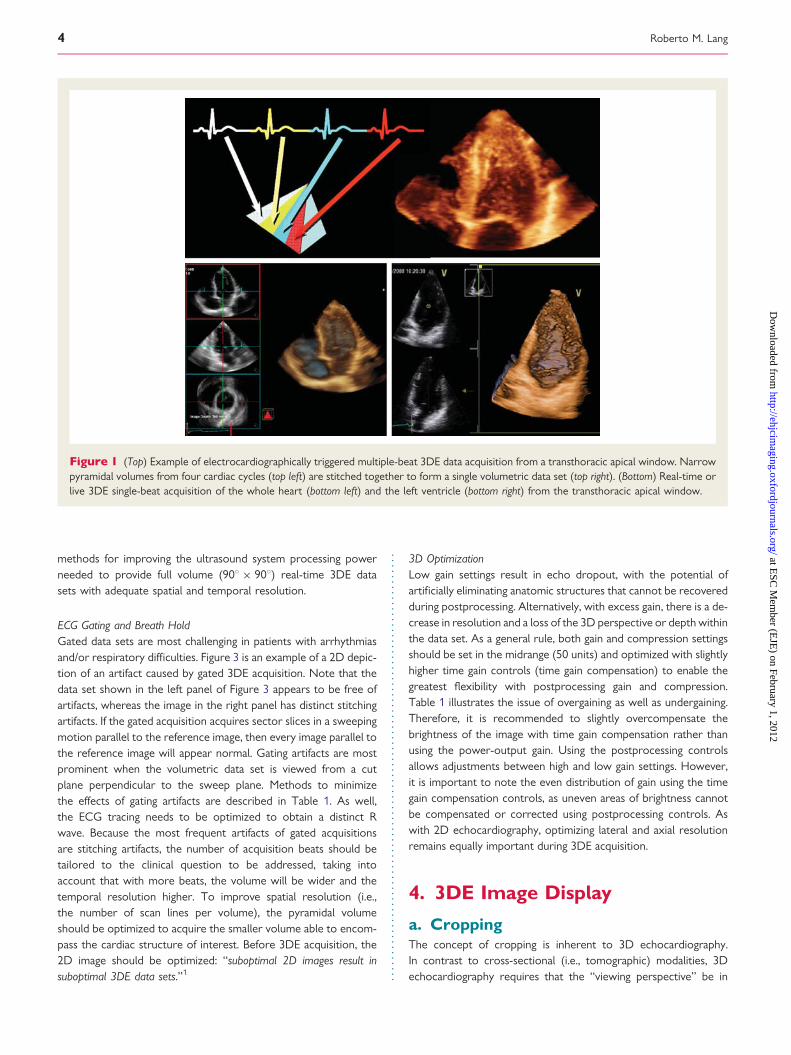

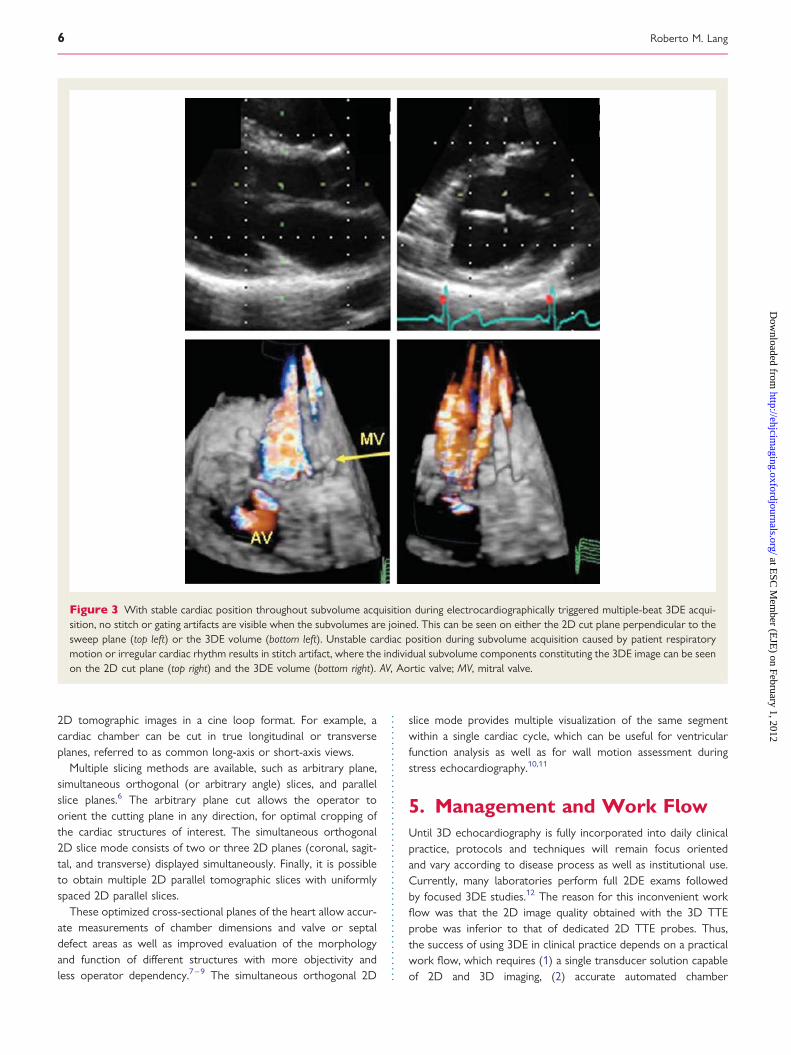
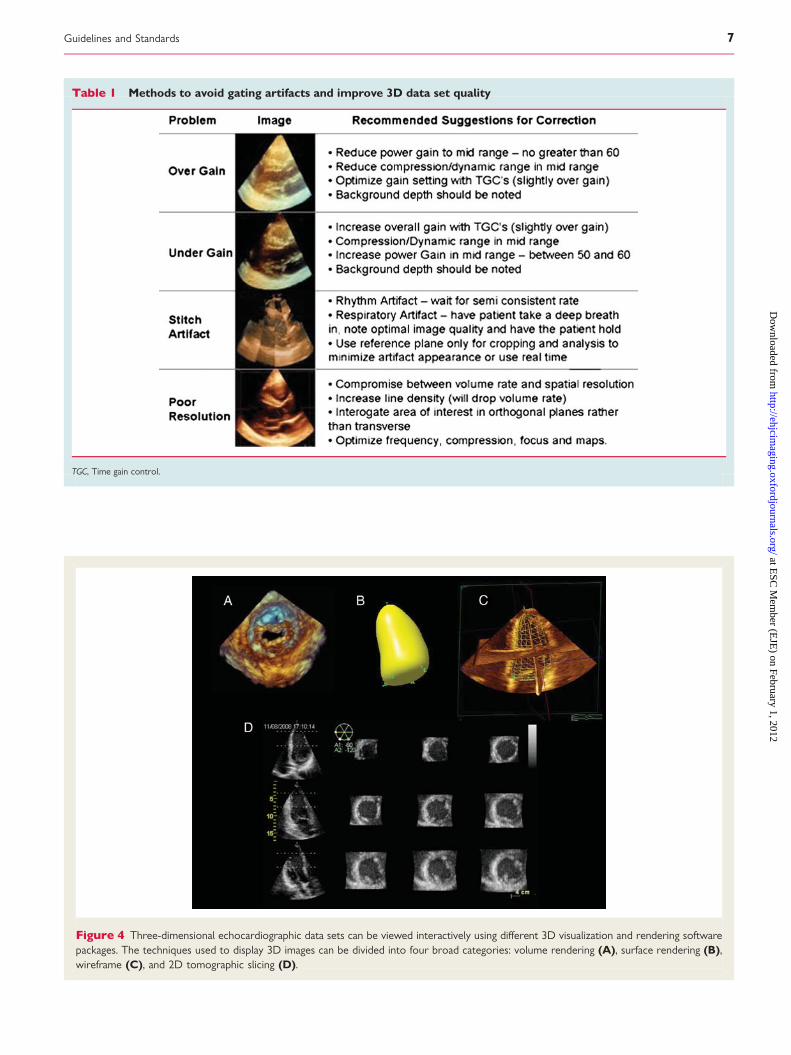

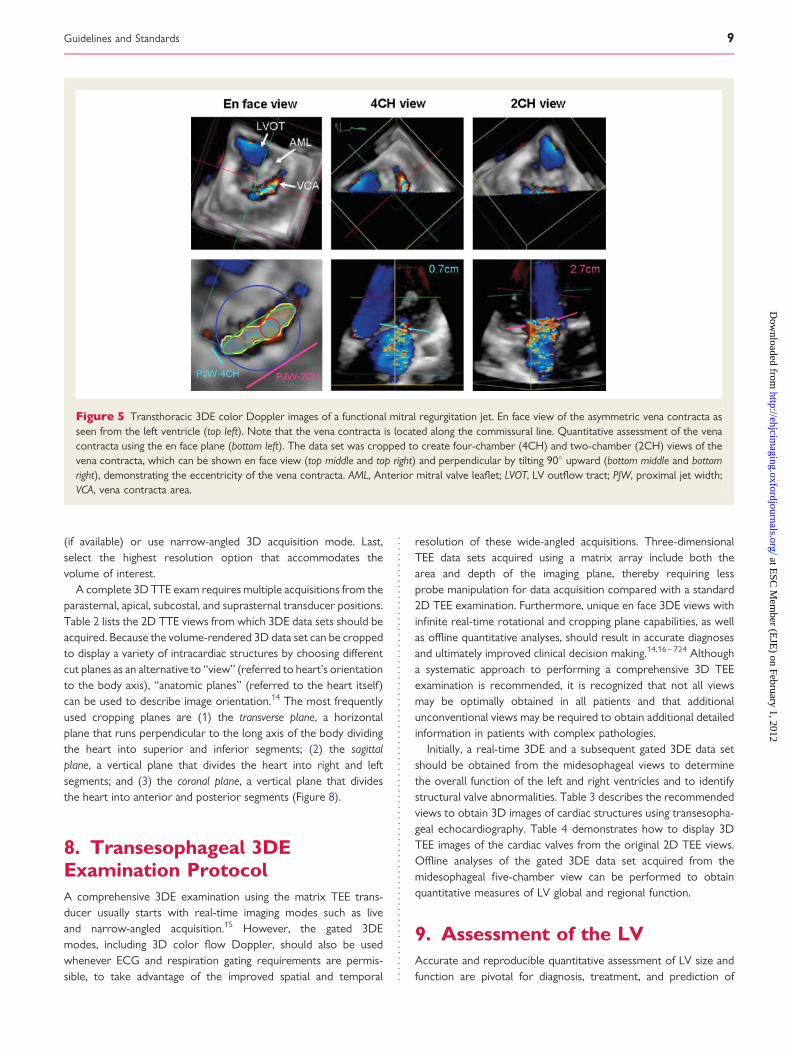
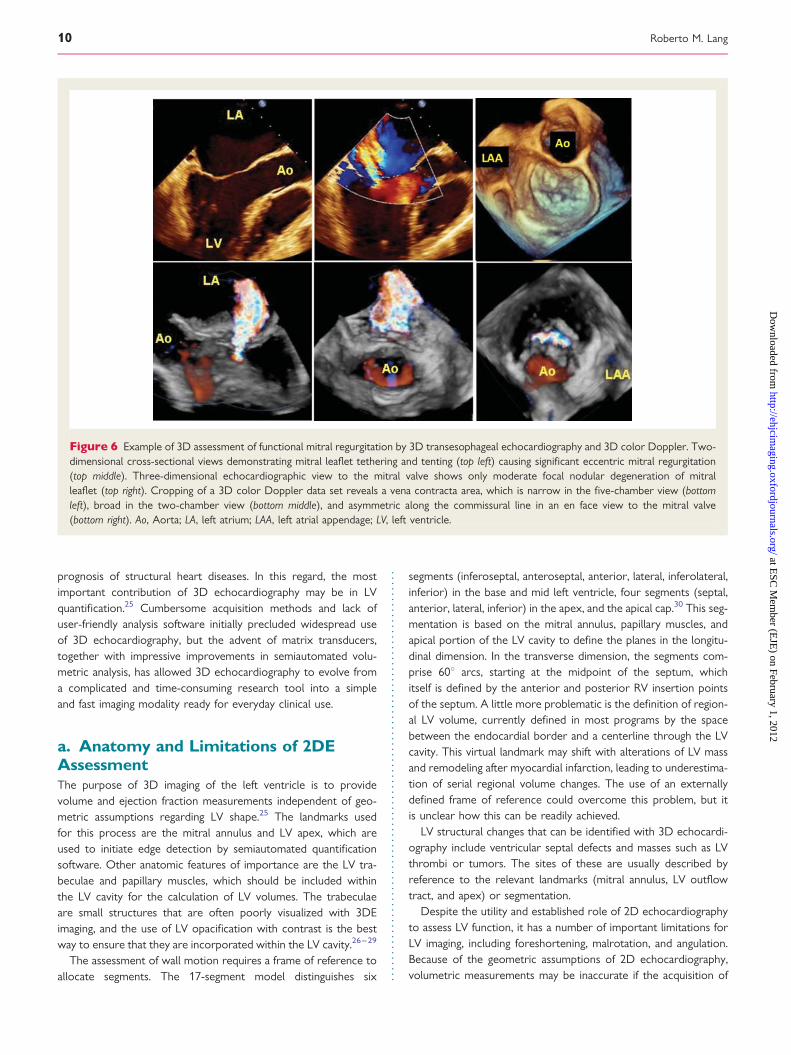
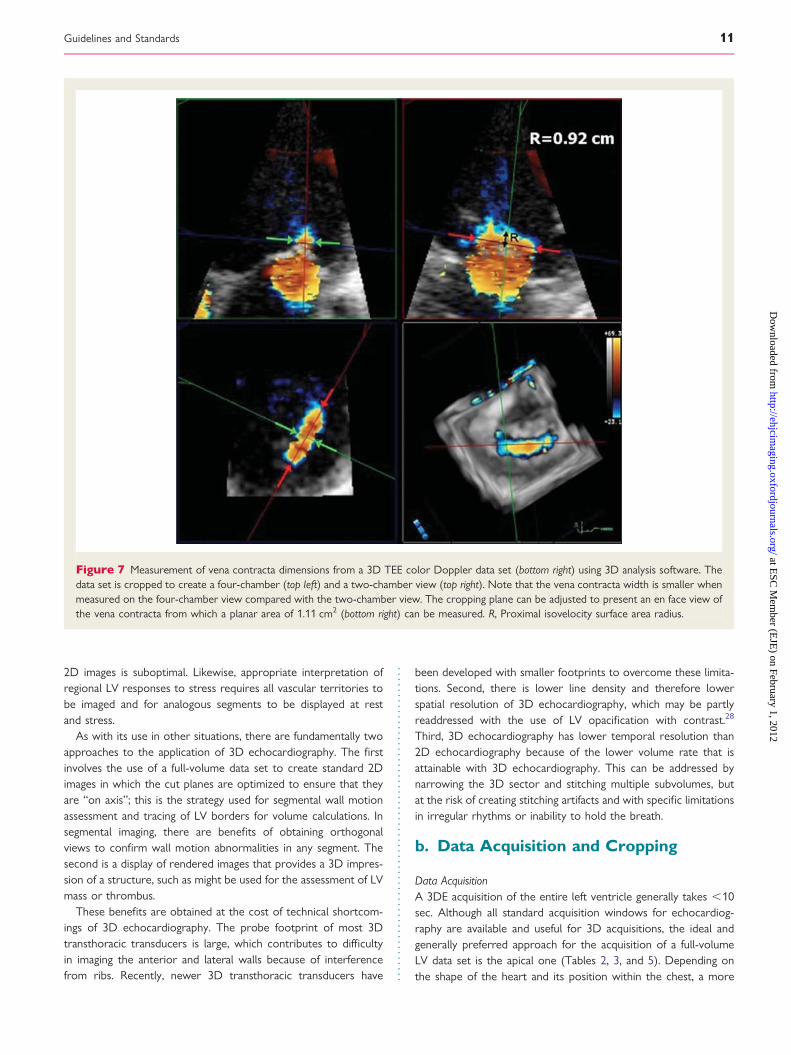
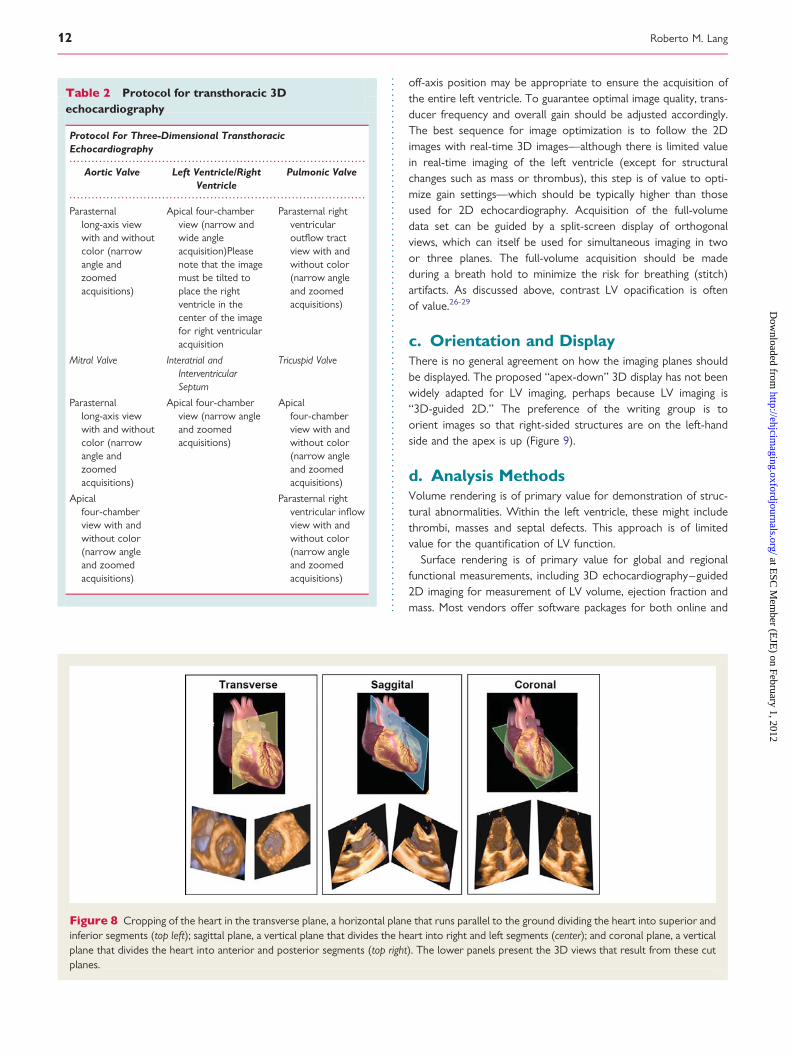

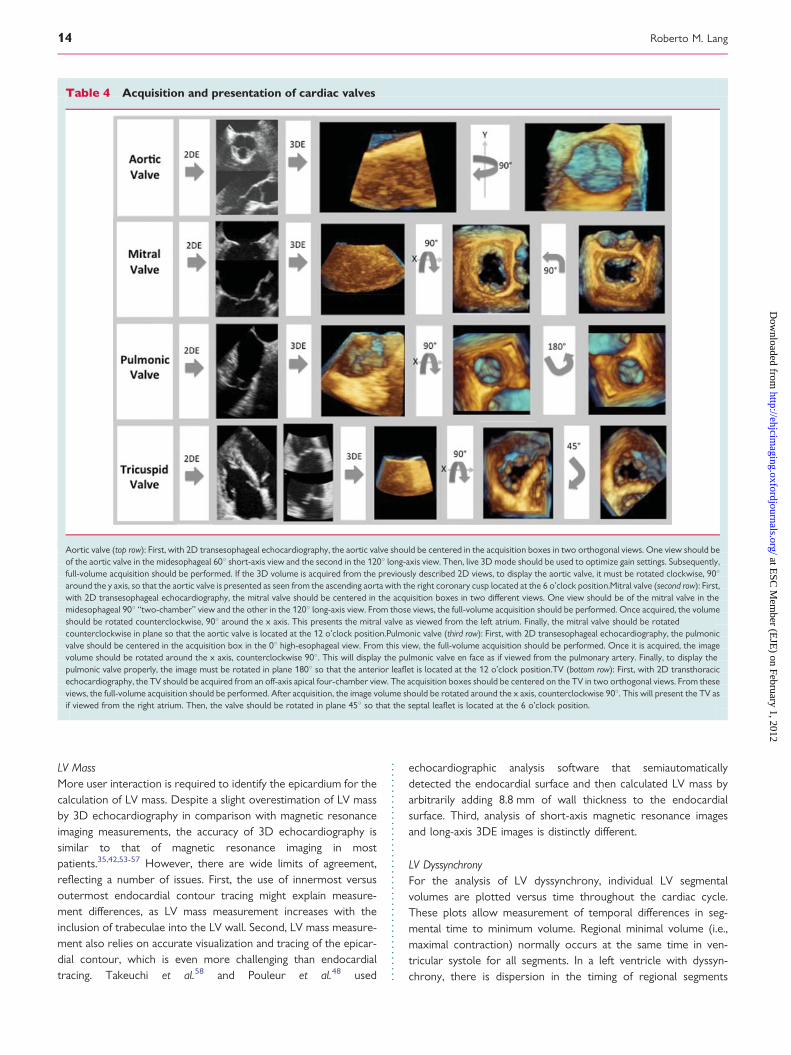
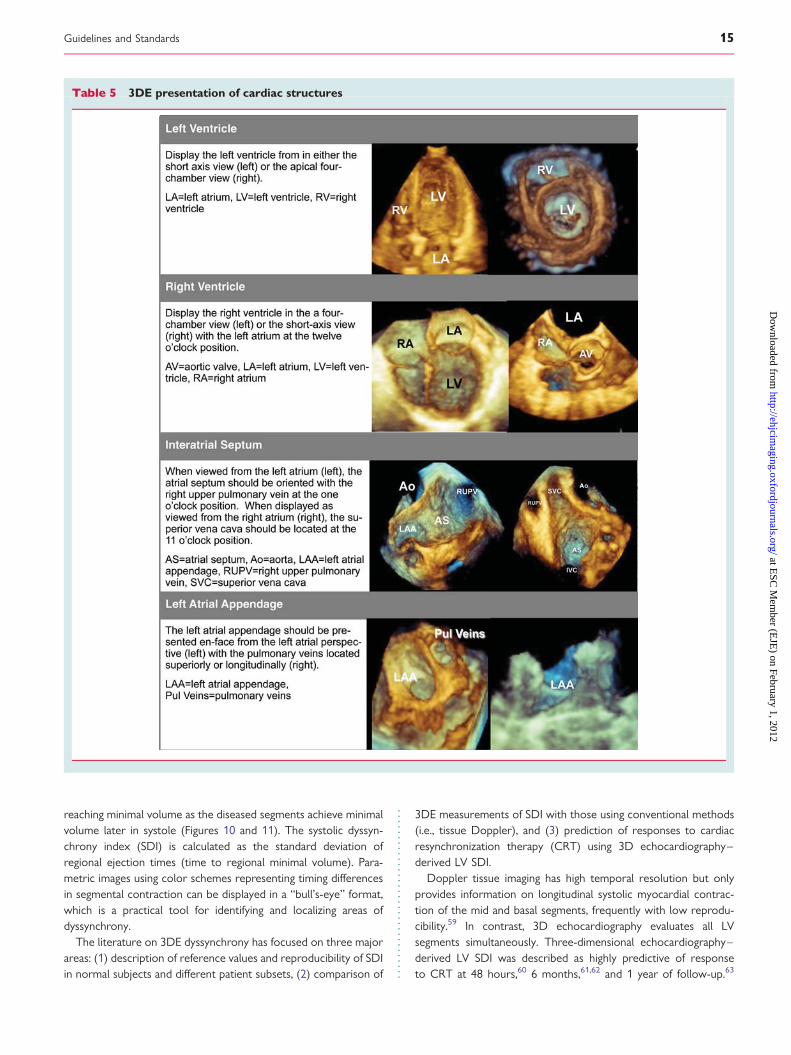
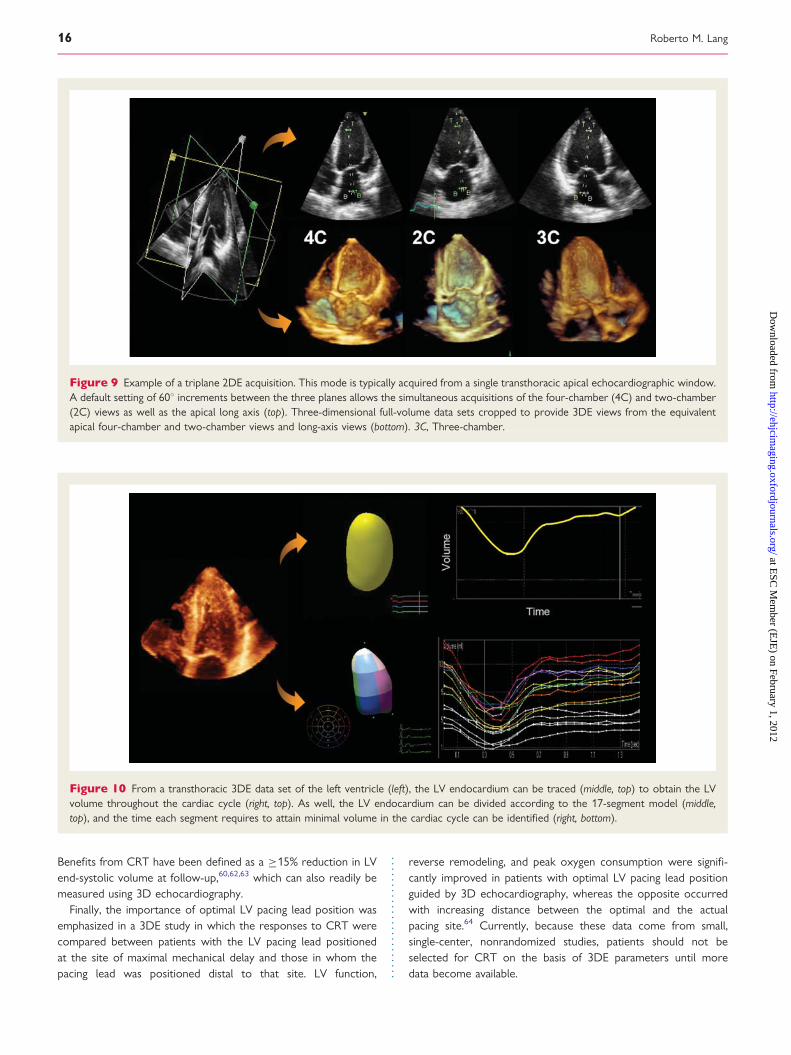


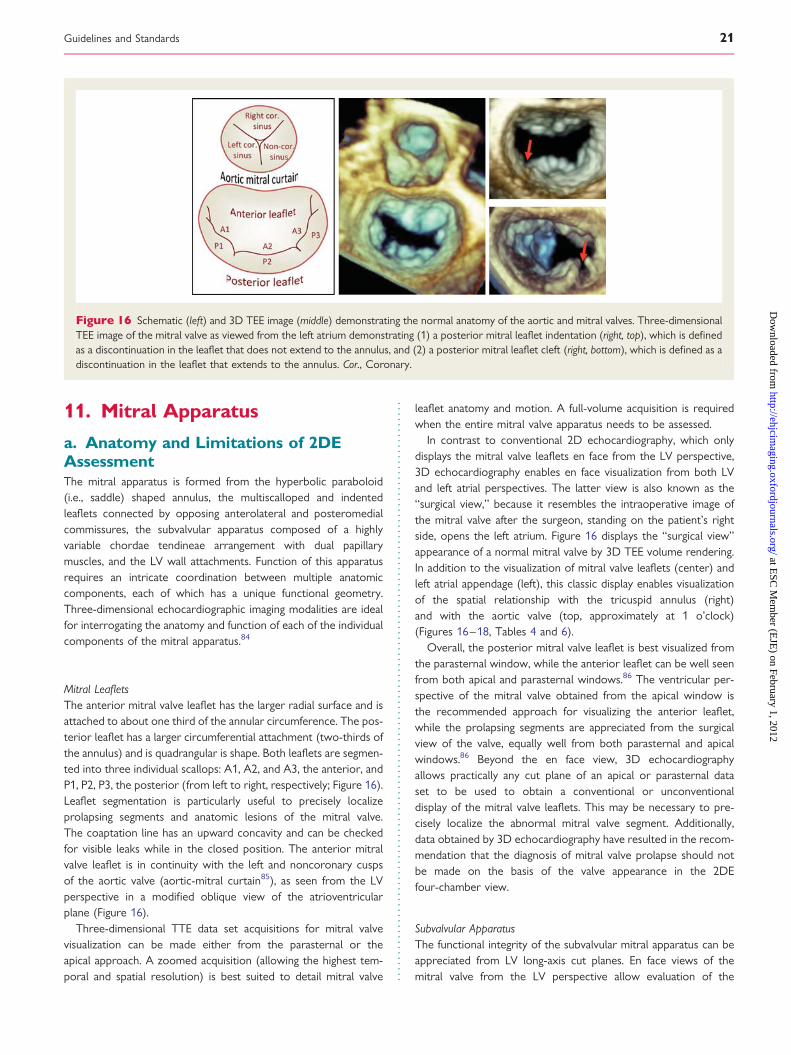


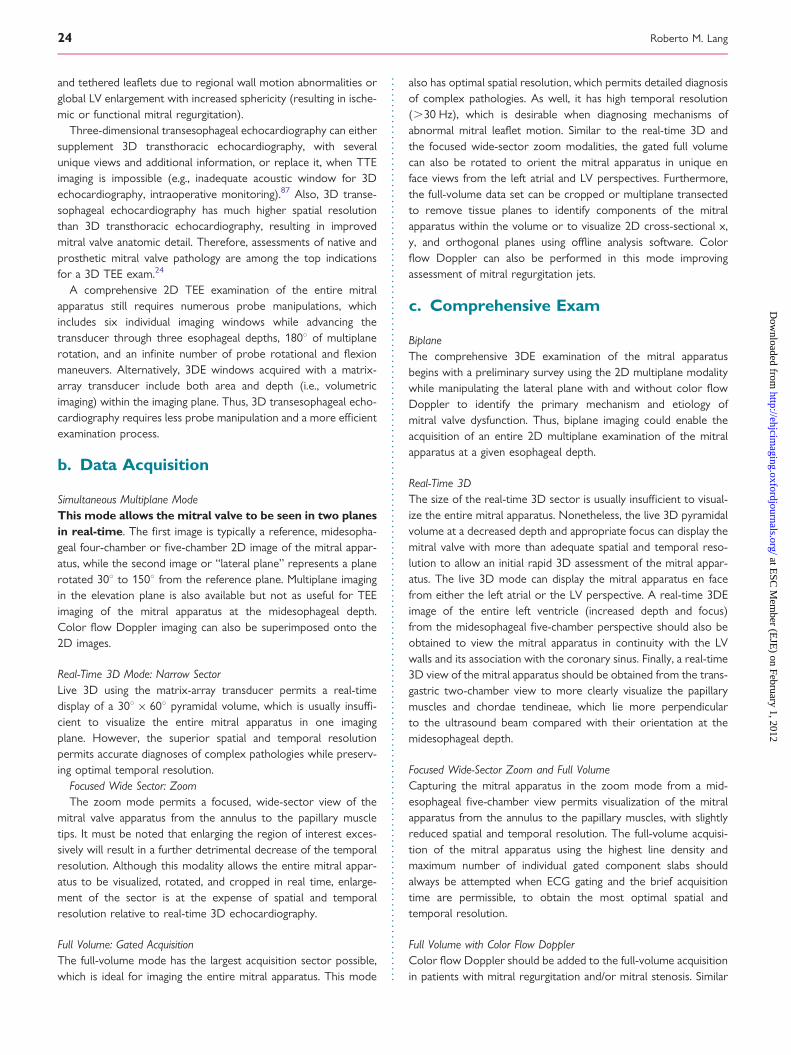
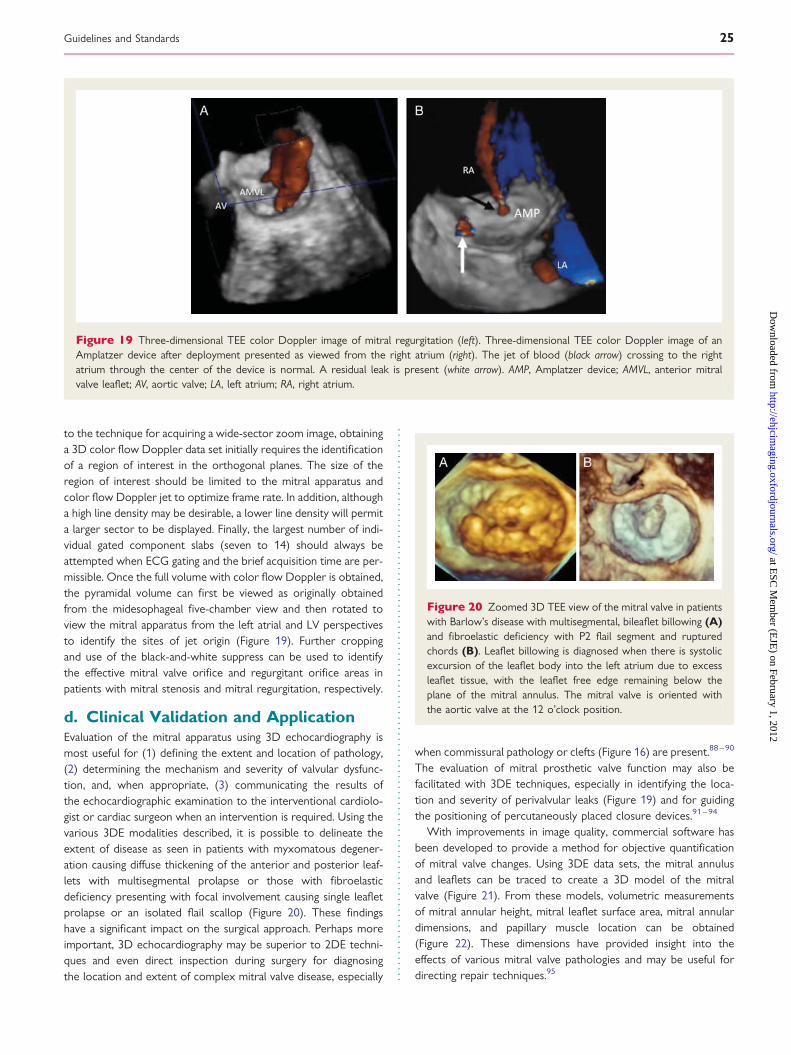


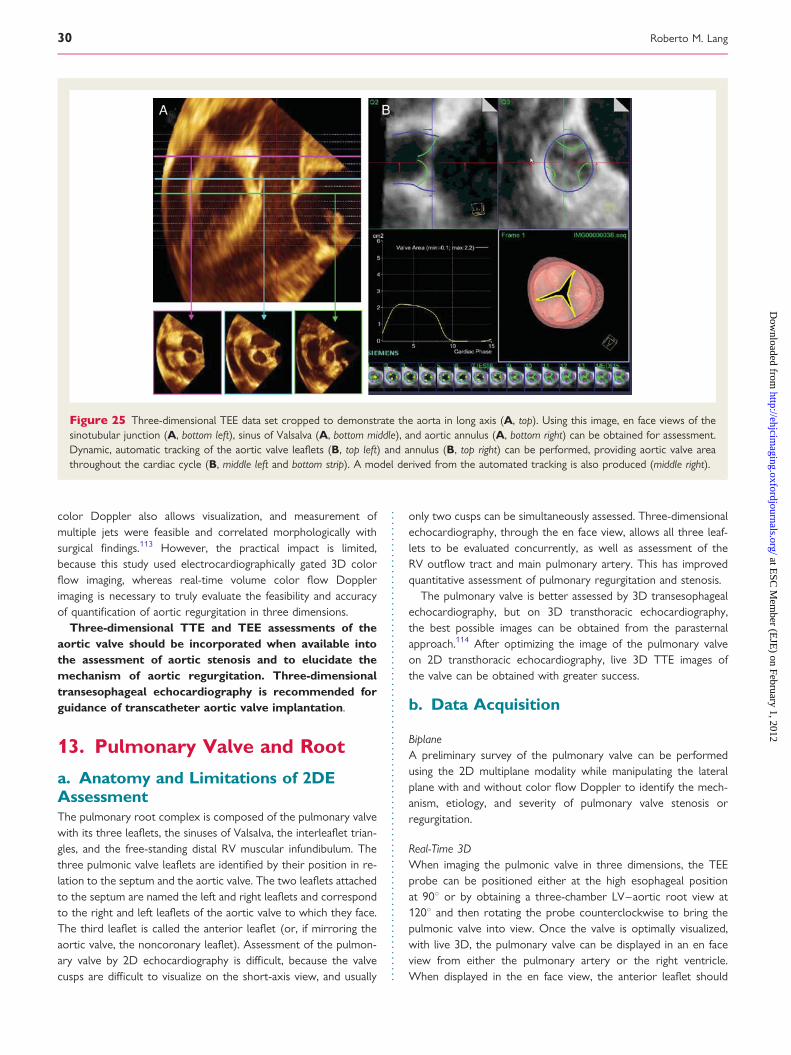

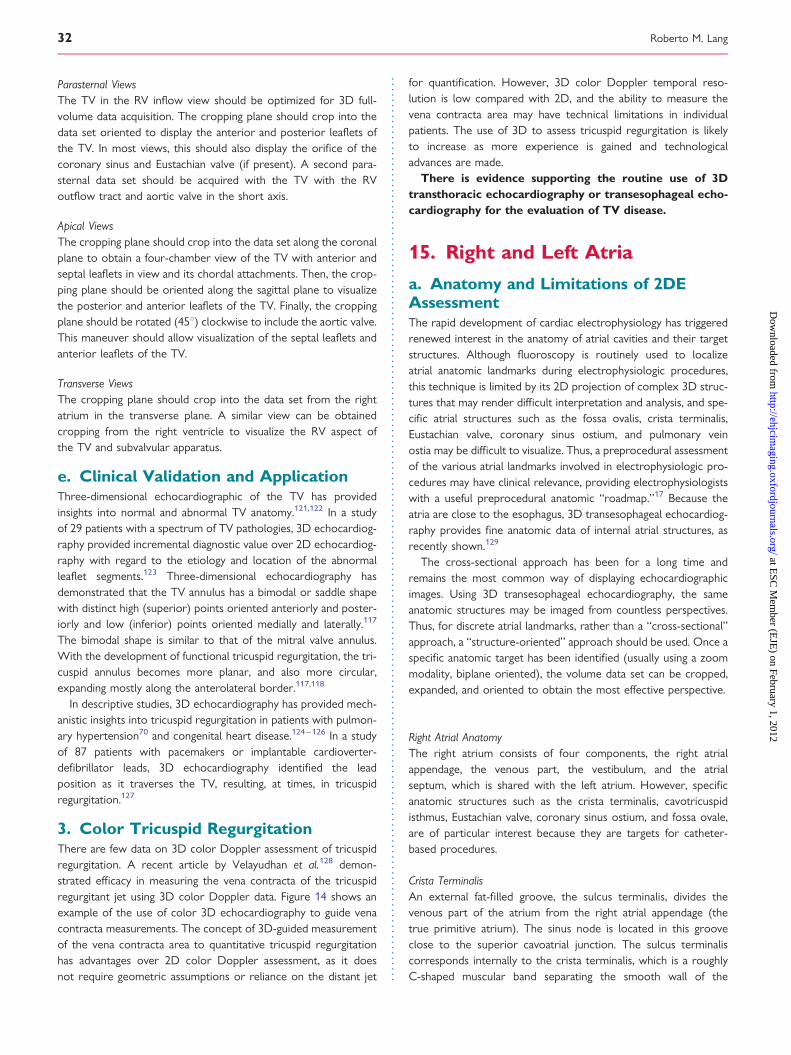
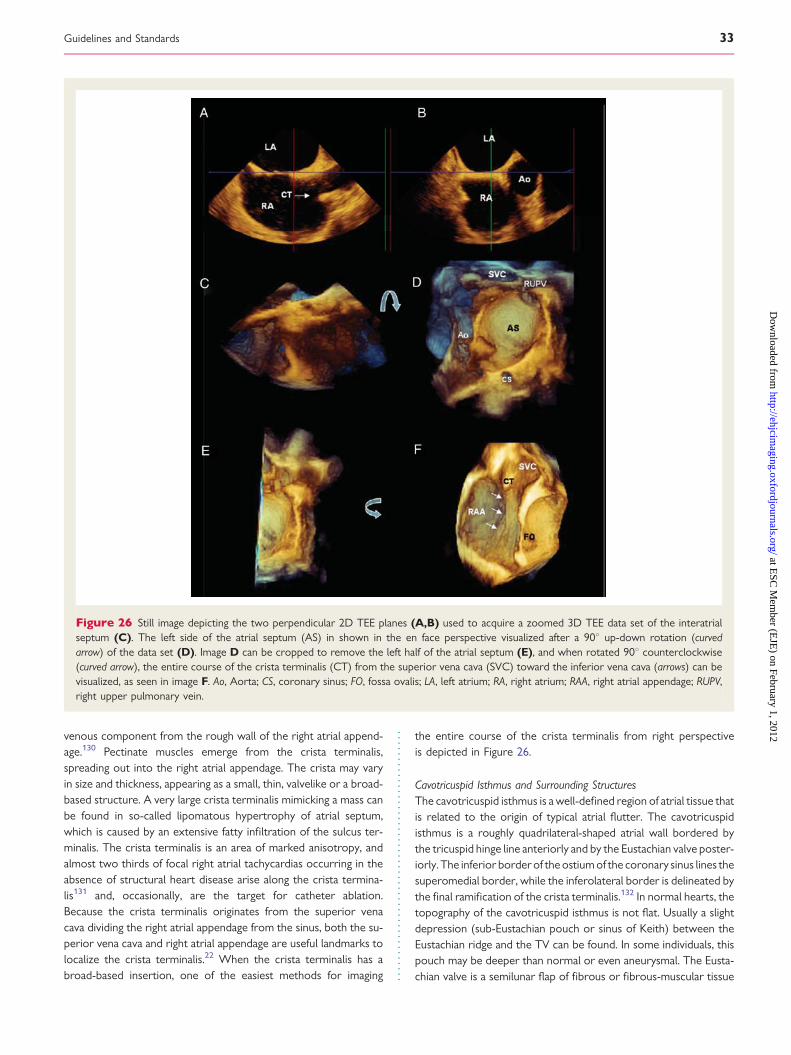


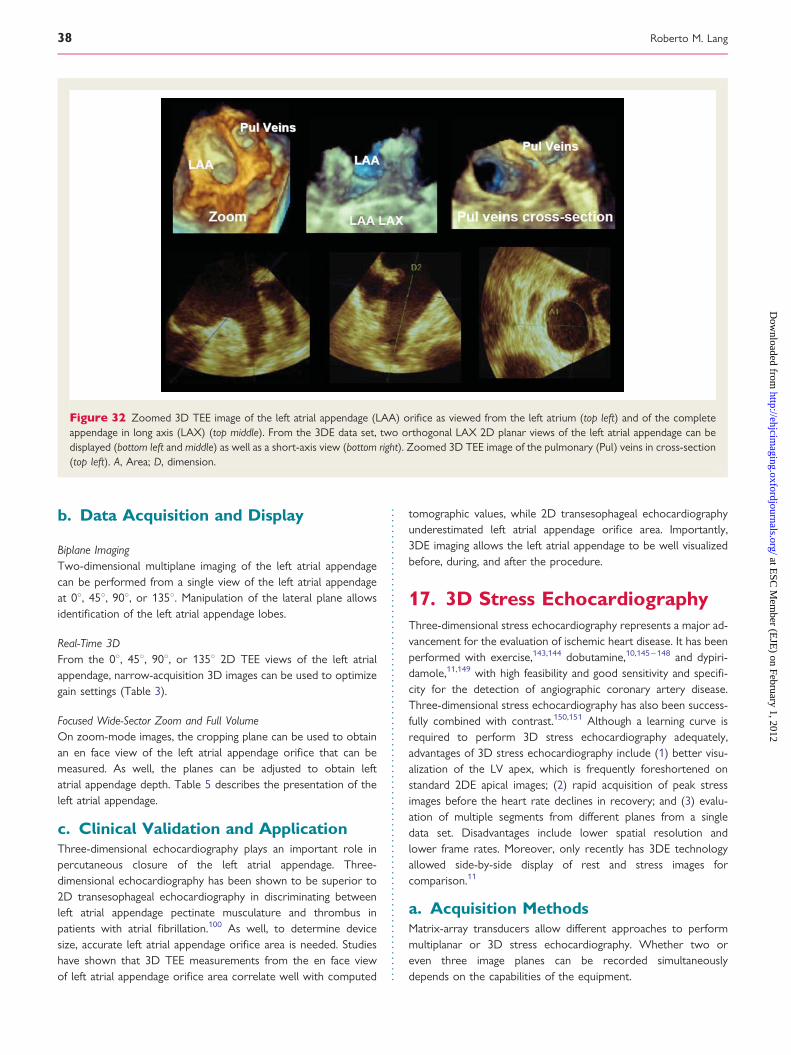
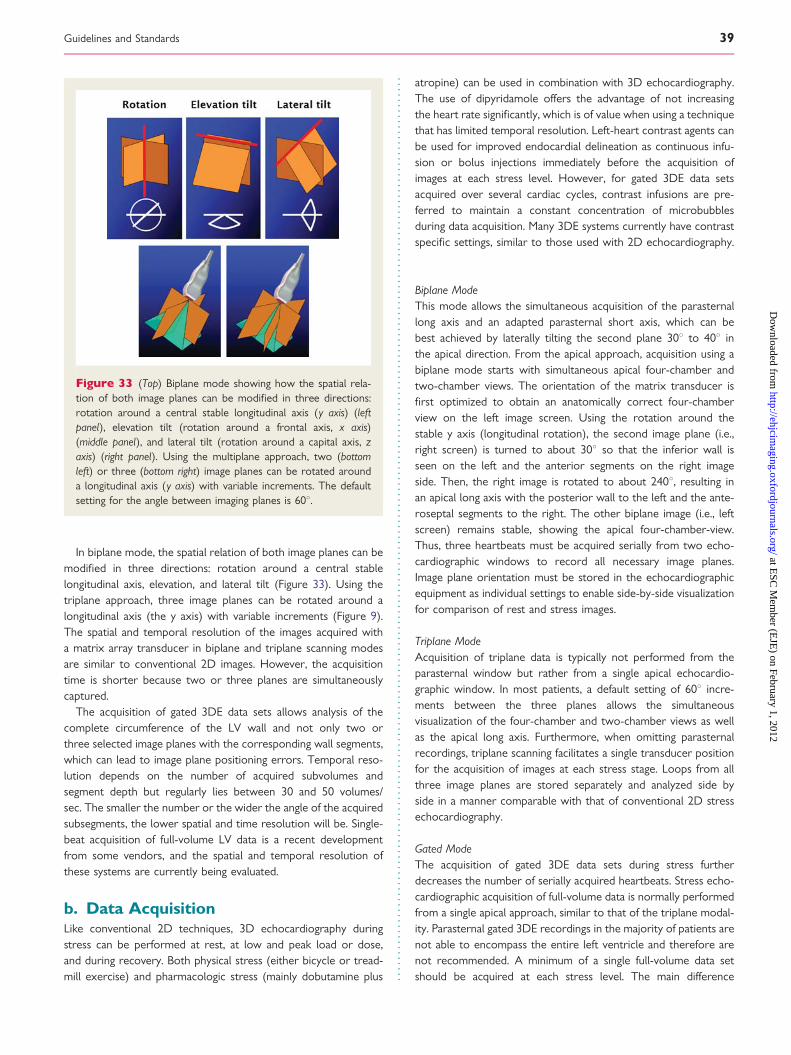
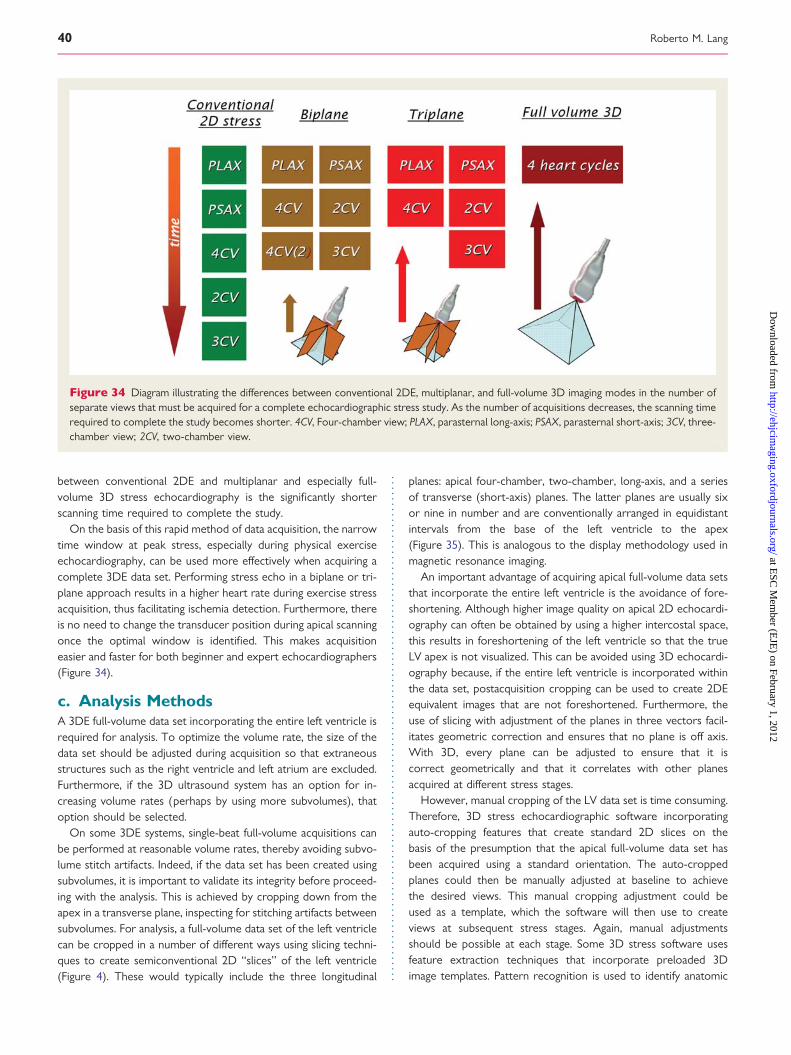


![Libretto Ecocardio Definitivo EAE-ASE[1][1]](https://static.documents.pub/doc/80x56/577c7f941a28abe054a5309a/libretto-ecocardio-definitivo-eae-ase11.jpg)


