40
uLake Ltd Innovative Publisher of Mathematics Texts

Year 9
MathematicsWorkbook
Robert Lakeland & Carl Nugent
uLake Ltdu a e tduLake LtdInnovative Publisher of Mathematics Texts
Level 4
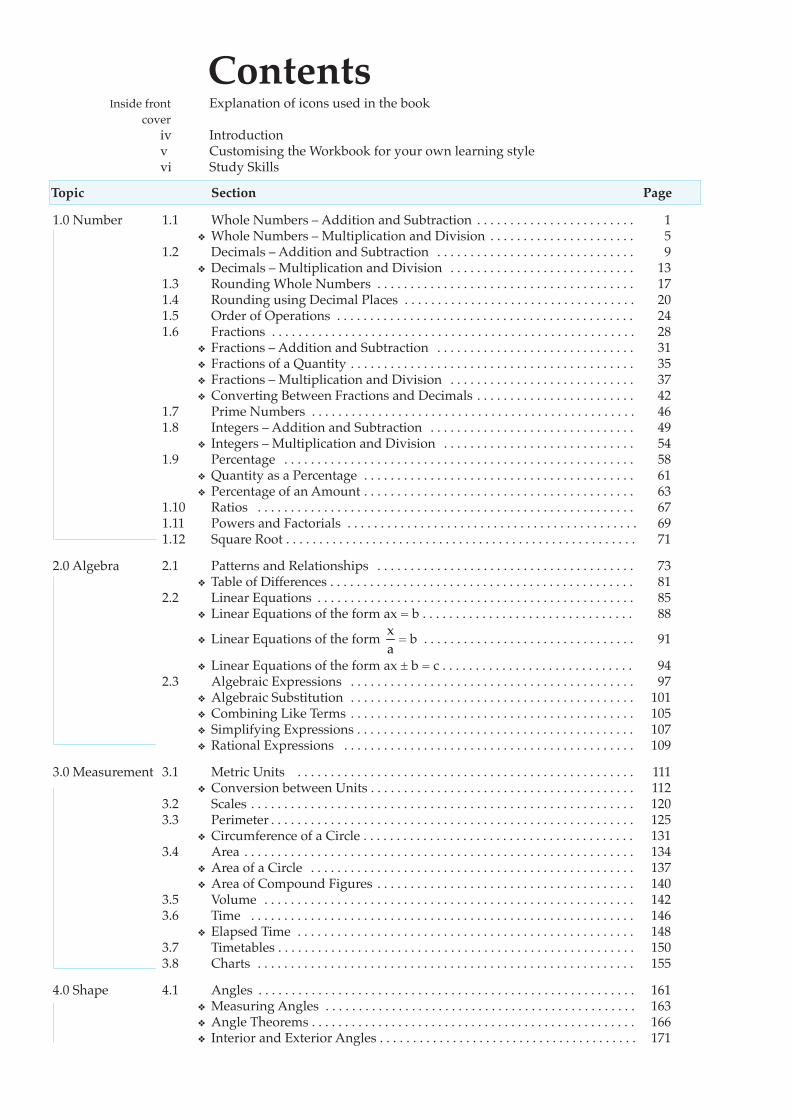
Contents
Topic Section
Inside front Explanation of icons used in the book cover iv Introduction v Customising the Workbook for your own learning style vi Study Skills
1.0 Number 1.1 Whole Numbers – Addition and Subtraction . . . . . . . . . . . . . . . . . . . . . . . . 1 ❖ Whole Numbers – Multiplication and Division . . . . . . . . . . . . . . . . . . . . . . 5 1.2 Decimals – Addition and Subtraction . . . . . . . . . . . . . . . . . . . . . . . . . . . . . . 9 ❖ Decimals – Multiplication and Division . . . . . . . . . . . . . . . . . . . . . . . . . . . . 13 1.3 Rounding Whole Numbers . . . . . . . . . . . . . . . . . . . . . . . . . . . . . . . . . . . . . . . 17 1.4 Rounding using Decimal Places . . . . . . . . . . . . . . . . . . . . . . . . . . . . . . . . . . . 20 1.5 Order of Operations . . . . . . . . . . . . . . . . . . . . . . . . . . . . . . . . . . . . . . . . . . . . . 24 1.6 Fractions . . . . . . . . . . . . . . . . . . . . . . . . . . . . . . . . . . . . . . . . . . . . . . . . . . . . . . . 28 ❖ Fractions – Addition and Subtraction . . . . . . . . . . . . . . . . . . . . . . . . . . . . . . 31 ❖ Fractions of a Quantity . . . . . . . . . . . . . . . . . . . . . . . . . . . . . . . . . . . . . . . . . . . 35 ❖ Fractions – Multiplication and Division . . . . . . . . . . . . . . . . . . . . . . . . . . . . 37 ❖ Converting Between Fractions and Decimals . . . . . . . . . . . . . . . . . . . . . . . . 42 1.7 Prime Numbers . . . . . . . . . . . . . . . . . . . . . . . . . . . . . . . . . . . . . . . . . . . . . . . . . 46 1.8 Integers – Addition and Subtraction . . . . . . . . . . . . . . . . . . . . . . . . . . . . . . . 49 ❖ Integers – Multiplication and Division . . . . . . . . . . . . . . . . . . . . . . . . . . . . . 54 1.9 Percentage . . . . . . . . . . . . . . . . . . . . . . . . . . . . . . . . . . . . . . . . . . . . . . . . . . . . . 58 ❖ Quantity as a Percentage . . . . . . . . . . . . . . . . . . . . . . . . . . . . . . . . . . . . . . . . . 61 ❖ Percentage of an Amount . . . . . . . . . . . . . . . . . . . . . . . . . . . . . . . . . . . . . . . . . 63 1.10 Ratios . . . . . . . . . . . . . . . . . . . . . . . . . . . . . . . . . . . . . . . . . . . . . . . . . . . . . . . . . 67 1.11 Powers and Factorials . . . . . . . . . . . . . . . . . . . . . . . . . . . . . . . . . . . . . . . . . . . . 69 1.12 Square Root . . . . . . . . . . . . . . . . . . . . . . . . . . . . . . . . . . . . . . . . . . . . . . . . . . . . . 71
2.0 Algebra 2.1 Patterns and Relationships . . . . . . . . . . . . . . . . . . . . . . . . . . . . . . . . . . . . . . . 73 ❖ Table of Differences . . . . . . . . . . . . . . . . . . . . . . . . . . . . . . . . . . . . . . . . . . . . . . 81 2.2 Linear Equations . . . . . . . . . . . . . . . . . . . . . . . . . . . . . . . . . . . . . . . . . . . . . . . . 85 ❖ Linear Equations of the form ax = b . . . . . . . . . . . . . . . . . . . . . . . . . . . . . . . . 88
❖ Linear Equations of the form xa
= b . . . . . . . . . . . . . . . . . . . . . . . . . . . . . . . . 91
❖ Linear Equations of the form ax ± b = c . . . . . . . . . . . . . . . . . . . . . . . . . . . . . 94 2.3 Algebraic Expressions . . . . . . . . . . . . . . . . . . . . . . . . . . . . . . . . . . . . . . . . . . . 97 ❖ Algebraic Substitution . . . . . . . . . . . . . . . . . . . . . . . . . . . . . . . . . . . . . . . . . . . 101 ❖ Combining Like Terms . . . . . . . . . . . . . . . . . . . . . . . . . . . . . . . . . . . . . . . . . . . 105 ❖ Simplifying Expressions . . . . . . . . . . . . . . . . . . . . . . . . . . . . . . . . . . . . . . . . . . 107 ❖ Rational Expressions . . . . . . . . . . . . . . . . . . . . . . . . . . . . . . . . . . . . . . . . . . . . 109
3.0 Measurement 3.1 Metric Units . . . . . . . . . . . . . . . . . . . . . . . . . . . . . . . . . . . . . . . . . . . . . . . . . . . 111 ❖ Conversion between Units . . . . . . . . . . . . . . . . . . . . . . . . . . . . . . . . . . . . . . . . 112 3.2 Scales . . . . . . . . . . . . . . . . . . . . . . . . . . . . . . . . . . . . . . . . . . . . . . . . . . . . . . . . . . 120 3.3 Perimeter . . . . . . . . . . . . . . . . . . . . . . . . . . . . . . . . . . . . . . . . . . . . . . . . . . . . . . . 125 ❖ Circumference of a Circle . . . . . . . . . . . . . . . . . . . . . . . . . . . . . . . . . . . . . . . . . 131 3.4 Area . . . . . . . . . . . . . . . . . . . . . . . . . . . . . . . . . . . . . . . . . . . . . . . . . . . . . . . . . . . 134 ❖ Area of a Circle . . . . . . . . . . . . . . . . . . . . . . . . . . . . . . . . . . . . . . . . . . . . . . . . . 137 ❖ Area of Compound Figures . . . . . . . . . . . . . . . . . . . . . . . . . . . . . . . . . . . . . . . 140 3.5 Volume . . . . . . . . . . . . . . . . . . . . . . . . . . . . . . . . . . . . . . . . . . . . . . . . . . . . . . . . 142 3.6 Time . . . . . . . . . . . . . . . . . . . . . . . . . . . . . . . . . . . . . . . . . . . . . . . . . . . . . . . . . . 146 ❖ Elapsed Time . . . . . . . . . . . . . . . . . . . . . . . . . . . . . . . . . . . . . . . . . . . . . . . . . . . 148 3.7 Timetables . . . . . . . . . . . . . . . . . . . . . . . . . . . . . . . . . . . . . . . . . . . . . . . . . . . . . . 150 3.8 Charts . . . . . . . . . . . . . . . . . . . . . . . . . . . . . . . . . . . . . . . . . . . . . . . . . . . . . . . . . 155
4.0 Shape 4.1 Angles . . . . . . . . . . . . . . . . . . . . . . . . . . . . . . . . . . . . . . . . . . . . . . . . . . . . . . . . . 161 ❖ Measuring Angles . . . . . . . . . . . . . . . . . . . . . . . . . . . . . . . . . . . . . . . . . . . . . . . 163 ❖ Angle Theorems . . . . . . . . . . . . . . . . . . . . . . . . . . . . . . . . . . . . . . . . . . . . . . . . . 166 ❖ Interior and Exterior Angles . . . . . . . . . . . . . . . . . . . . . . . . . . . . . . . . . . . . . . . 171
Page

Topic Section
❖ Angle Properties of Parallel Lines . . . . . . . . . . . . . . . . . . . . . . . . . . . . . . . . . . 175 4.2 Isometric Drawings . . . . . . . . . . . . . . . . . . . . . . . . . . . . . . . . . . . . . . . . . . . . . 179 ❖ Mat Plan . . . . . . . . . . . . . . . . . . . . . . . . . . . . . . . . . . . . . . . . . . . . . . . . . . . . . . . 182 ❖ Interpreting Isometric Drawings . . . . . . . . . . . . . . . . . . . . . . . . . . . . . . . . . . 184 4.3 Nets . . . . . . . . . . . . . . . . . . . . . . . . . . . . . . . . . . . . . . . . . . . . . . . . . . . . . . . . . . 186 4.4 Transformations–Reflection...................................... 190 ❖ Line Symmetry . . . . . . . . . . . . . . . . . . . . . . . . . . . . . . . . . . . . . . . . . . . . . . . . . . 195 ❖ Rotation . . . . . . . . . . . . . . . . . . . . . . . . . . . . . . . . . . . . . . . . . . . . . . . . . . . . . . . . 198 ❖ Rotational Symmetry . . . . . . . . . . . . . . . . . . . . . . . . . . . . . . . . . . . . . . . . . . . . . 203 ❖ Translation . . . . . . . . . . . . . . . . . . . . . . . . . . . . . . . . . . . . . . . . . . . . . . . . . . . . . 205 ❖ Enlargement . . . . . . . . . . . . . . . . . . . . . . . . . . . . . . . . . . . . . . . . . . . . . . . . . . . . 211 ❖ Summary of Invariant Properties and Points . . . . . . . . . . . . . . . . . . . . . . . . 216 4.5 Grid References . . . . . . . . . . . . . . . . . . . . . . . . . . . . . . . . . . . . . . . . . . . . . . . . . 217 ❖ Compass Directions and Bearings . . . . . . . . . . . . . . . . . . . . . . . . . . . . . . . . . 223 ❖ Latitude and Longitude . . . . . . . . . . . . . . . . . . . . . . . . . . . . . . . . . . . . . . . . . . 226 4.6 Classes of Two and Three-Dimensional Shapes . . . . . . . . . . . . . . . . . . . . . . 229
5.0 Statistics 5.1 Introduction . . . . . . . . . . . . . . . . . . . . . . . . . . . . . . . . . . . . . . . . . . . . . . . . . . . 231 5.2 Averages . . . . . . . . . . . . . . . . . . . . . . . . . . . . . . . . . . . . . . . . . . . . . . . . . . . . . . 232 5.3 Frequency Tables . . . . . . . . . . . . . . . . . . . . . . . . . . . . . . . . . . . . . . . . . . . . . . 235 ❖ Finding Averages from a Frequency Table . . . . . . . . . . . . . . . . . . . . . . . . . . . 239 5.4 Displaying Data – Dot Plot . . . . . . . . . . . . . . . . . . . . . . . . . . . . . . . . . . . . . . . . 244 ❖ Stem and Leaf Plot . . . . . . . . . . . . . . . . . . . . . . . . . . . . . . . . . . . . . . . . . . . . . 247 ❖ Scatter Plot . . . . . . . . . . . . . . . . . . . . . . . . . . . . . . . . . . . . . . . . . . . . . . . . . . . . 251 ❖ Pie Chart . . . . . . . . . . . . . . . . . . . . . . . . . . . . . . . . . . . . . . . . . . . . . . . . . . . . . . 257 ❖ Bar Graph . . . . . . . . . . . . . . . . . . . . . . . . . . . . . . . . . . . . . . . . . . . . . . . . . . . . . . 261 ❖ Histogram . . . . . . . . . . . . . . . . . . . . . . . . . . . . . . . . . . . . . . . . . . . . . . . . . . . . . . 265 ❖ Line Graph . . . . . . . . . . . . . . . . . . . . . . . . . . . . . . . . . . . . . . . . . . . . . . . . . . . . 269 ❖ Pictograph . . . . . . . . . . . . . . . . . . . . . . . . . . . . . . . . . . . . . . . . . . . . . . . . . . . . . 273 5.5 Statistical Enquiry Cycle . . . . . . . . . . . . . . . . . . . . . . . . . . . . . . . . . . . . . . . . . . 276
6.0 Probability 6.1 Relative Frequency . . . . . . . . . . . . . . . . . . . . . . . . . . . . . . . . . . . . . . . . . . . . . . 283 6.2 Theoretical Probability . . . . . . . . . . . . . . . . . . . . . . . . . . . . . . . . . . . . . . . . . . . 286 6.3 Probability Trees . . . . . . . . . . . . . . . . . . . . . . . . . . . . . . . . . . . . . . . . . . . . . . . . 292
7.0 Numeracy 7.1 Near Double Strategy (Addition) . . . . . . . . . . . . . . . . . . . . . . . . . . . . . . . . . . 297 Strategies 7.2 Tidy Numbers Strategy (Addition) . . . . . . . . . . . . . . . . . . . . . . . . . . . . . . . . . 299 7.3 Place Value Strategy (Addition) . . . . . . . . . . . . . . . . . . . . . . . . . . . . . . . . . . . 302 7.4 Standard Written Form – Expanded Form . . . . . . . . . . . . . . . . . . . . . . . . . . 305 7.5 Place Value Strategy (Subtraction) . . . . . . . . . . . . . . . . . . . . . . . . . . . . . . . . . 308 7.6 Subtracting by ‘Adding On’ . . . . . . . . . . . . . . . . . . . . . . . . . . . . . . . . . . . . . . 311 7.7 Multiplying using Place Value . . . . . . . . . . . . . . . . . . . . . . . . . . . . . . . . . . . . 314 7.8 Multiplying by Rounding and Compensating . . . . . . . . . . . . . . . . . . . . . . . 317 7.9 Dividing by Changing Both Numbers . . . . . . . . . . . . . . . . . . . . . . . . . . . . . . 320 7.10 Dividing by using Reversibility . . . . . . . . . . . . . . . . . . . . . . . . . . . . . . . . . . . . 323
8.0 Practice Number . . . . . . . . . . . . . . . . . . . . . . . . . . . . . . . . . . . . . . . . . . . . . . . . . . . . . . . . 327 Assessments Algebra . . . . . . . . . . . . . . . . . . . . . . . . . . . . . . . . . . . . . . . . . . . . . . . . . . . . . . . . . 329 Measurement . . . . . . . . . . . . . . . . . . . . . . . . . . . . . . . . . . . . . . . . . . . . . . . . . . . 332 Shape . . . . . . . . . . . . . . . . . . . . . . . . . . . . . . . . . . . . . . . . . . . . . . . . . . . . . . . . . 335 Statistics and Probability . . . . . . . . . . . . . . . . . . . . . . . . . . . . . . . . . . . . . . . . . . 338
Answers Number . . . . . . . . . . . . . . . . . . . . . . . . . . . . . . . . . . . . . . . . . . . . . . . . . . . . . . . . 341 Algebra . . . . . . . . . . . . . . . . . . . . . . . . . . . . . . . . . . . . . . . . . . . . . . . . . . . . . . . . . 351 Measurement . . . . . . . . . . . . . . . . . . . . . . . . . . . . . . . . . . . . . . . . . . . . . . . . . . . 357 Shape . . . . . . . . . . . . . . . . . . . . . . . . . . . . . . . . . . . . . . . . . . . . . . . . . . . . . . . . . 362 Statistics . . . . . . . . . . . . . . . . . . . . . . . . . . . . . . . . . . . . . . . . . . . . . . . . . . . . . . . . 371 Probability . . . . . . . . . . . . . . . . . . . . . . . . . . . . . . . . . . . . . . . . . . . . . . . . . . . . . 376 Numeracy Strategies . . . . . . . . . . . . . . . . . . . . . . . . . . . . . . . . . . . . . . . . . . . . . 378 Practice Assessments . . . . . . . . . . . . . . . . . . . . . . . . . . . . . . . . . . . . . . . . . . . . 385
Order Form . . . . . . . . . . . . . . . . . . . . . . . . . . . . . . . . . . . . . . . . . . . . . . . . . . . . 393
Page

1Number
Workbook – Year 9 Mathematics and Statistics – Published by NuLake Ltd New Zealand © Robert Lakeland & Carl Nugent
1.0 Number1.1 Whole Numbers – Addition and Subtraction
Addition of Whole Numbers using Written Methods
To add whole numbers using written methods we begin by ensuring that the columns line up correctly (i.e. the ones with the ones, the tens with the tens, the hundreds with the hundreds and the thousands with the thousands etc).For the problem 1024 + 235 + 6 + 198 we set it out as follows: 1 0 2 4 2 3 5 6 + 1 9 8
We then begin by adding the right most column. If the column totals more than 9, then we ‘carry’ the number of tens into the second column. In this case the column total is 23 so we put the 3 in the ones column and carry the 2 (20) to the next column. We continue in this manner right to left from column to column.
1 0 2 4 2 3 5 6 + 1 9 8 1 2 1 4 6 3
Addition of Whole Numbers using a Calculator
Using a calculator we enter the problem from left to right just as it is written down.For the problem 1024 + 235 + 6 + 198 we enter:
1 2 40 + 2
3 5 6 ++ 1
When using a calculator always check that the answer makes ‘sense’. Use your estimation skills or number strategies to do the problem in your head. For example, using estimation1000 + 200 + 10 + 200 = 1410 so we know that 1463 is a realistic answer to the question.
89 = which gives 1463.
Subtraction of Whole Numbers using Written Methods
Subtraction of Whole Numbers using a Calculator
Using a calculator we enter the problem from left to right just as it is written down.For the problem 4351 – 1492 we enter:
4 5 13 – 1
When using a calculator always check that the answer makes ‘sense’. Use your estimation skills or number strategies to do the problem in your head. For example, using estimation4400 – 1500 = 2900 so we know that 2859 is a realistic answer to the problem.
4 9 enter2
which gives 2859.
To subtract whole numbers using written methods we begin by ensuring that the columns line up correctly (i.e. the ones with the ones, the tens with the tens, the hundreds with the hundreds and the thousands with the thousands etc).For the problem 4351 – 1492 we set it out as follows: 4 3 5 1 – 1 4 9 2
We begin by subtracting from the right most column, borrowing from the column to the left if necessary. In the first column we cannot subtract 2 from 1 so we borrow 10 from the tens column and subtract 2 from 11. We then change the 5 in the tens column (50) to a 4 (40). We continue in this manner right to left from column to column. 3 12 14 11 4 3 5 1 – 1 4 9 2 2 8 5 9
When using a calculator it is a good idea to do the problem twice, ensuring you get the same answer both times. This reduces the likelihood of ‘key in’ error.
©uLake LtduLake Ltd Innovative Publisher of Mathematics Texts

Workbook – Year 9 Mathematics and Statistics – Published by NuLake Ltd New Zealand © Robert Lakeland & Carl Nugent
6 Number
Achievement – Evaluate the following using your calculator. Do each problem twice, as a check, to reduce the likelihood of ‘key in’ error.
31. 2754 x 31 = 32. 45 812 x 15 =
33. 5671 x 142 = 34. 2435 x 124 =
35. 23 x 14 x 25 = 36. 145 x 27 x 38 =
37. 57 x 104 x 319 = 38. 249 x 316 x 478 =
39. 67 993 x 2 451 = 40. 5784 x 204 =
41. 3768 ÷ 3 = 42. 14 166 ÷ 9 =
43. 16 325 ÷ 5 = 44. 7470 ÷ 6 =
45. 1612 ÷ 13 = 46. 5015 ÷ 17 =
47. 39 324 ÷ 29 = 48. 193 572 ÷ 76 =
49. 203 040 ÷ 54 ÷ 16 = 50. 1 084 005 ÷ 65 ÷ 17 =
©uLake LtduLake Ltd Innovative Publisher of Mathematics Texts

Workbook – Year 9 Mathematics and Statistics – Published by NuLake Ltd New Zealand © Robert Lakeland & Carl Nugent
14 Number
Achievement – Evaluate the following using your calculator. Do each problem twice, as a check, to reduce the likelihood of ‘key in’ error.
97. 34.5 x 1.4 = 98. 26.72 x 2.6 =
99. 123.1 x 0.2 = 100. 436.8 x 6.8 =
101. 14.58 x 3.4 = 102. 2.891 x 0.56 =
103. 2.45 x 1.5 x 3.55 = 104. 204.95 x 0.6 =
105. 145.95 x 0.6 x 1.2 = 106. 982.3 x 14.1 =
111. 1443.465 ÷ 1.5 = 112. 6196.48 ÷ 0.94 =
113. 96 ÷ 3.75 = 114. 283.464 ÷ 2.48 =
115. 4603.24 ÷ 15.7 = 116. 2637.36 ÷ 1.85 =
117. 897.875 ÷ 0.275 = 118. 9544.19 ÷ 1.45 =
107. 12.6 x 4.8 x 8.6 = 108. 3.65 x 14.6 x 28.2 =
109. 567.85 ÷ 0.5 = 110. 863.6 ÷ 0.04 =
©uLake LtduLake Ltd Innovative Publisher of Mathematics Texts

19Number
Workbook – Year 9 Mathematics and Statistics – Published by NuLake Ltd New Zealand © Robert Lakeland & Carl Nugent
Merit – Answer the following application problems, rounding to the required accuracy.
167. Taylor works 45 hours per week and earns $25 per hour. How much does he earn to the nearest ten dollars each week?
168. Sam has a loan of $10 250 from the bank. He pays $645 per month. How long to the nearest month will it take him to pay his loan off?
169. Drew travels 485 km per day as a courier. He works 5 days a week for 49 weeks of the year. How far does he travel to the nearest 10 000 km per year?
170. A company’s quarterly profit is listed as $8 455 000. How much profit will they make for the financial year to the nearest 1 000 000 if their profit per quarter stays the same?
171. An airline’s income from a single flight to London is $443 325 less expenses of $275 350. What profit to the nearest $10 000 does the airline make?
172. A company sells 35 250 books at $25 each in one year. What is their gross income to the nearest 10 000?
173. The population of Australia currently (2009) is estimated to be 21 613 115. What is the population of Australia to the nearest million?
174. A syndicate of six people win Lotto first division valued at $1 250 480. How much would each person in the syndicate get rounded to the nearest $10 000?
175. A female lives on average for 43 256 880 minutes. How long does an average female live to the nearest day?
176. A relative leaves a $5 million dollar estate to be divided evenly among an extended family of 24. How much does each person get to the nearest $1000?
177. If every 2 Canadian dollars is equal to 3 NZ dollars, how many NZ dollars to the nearest 100 would you get for 16 500 Canadian dollars?
178. A person wins a lottery which pays out $235 000 per year for 25 years. How much does the person receive in total to the nearest 1 000 000?
179. If every US dollar is equal to 2 NZ dollars, how many US dollars to the nearest 10 would you get for 3425 NZ dollars?
180. A company makes $4 350 285 profit over a 12 month period. How much per day does this equate to, to the nearest 1000?
181. A population of insects doubles everyday. If the population size is initially 20, what will be the population to the nearest 100 insects in 5 days?
182. A marathon runner can run one kilometre in 4 minutes. How long to the nearest ten minutes would it take him to complete a marathon (42 km)?
©uLake LtduLake Ltd Innovative Publisher of Mathematics Texts

27Number
Workbook – Year 9 Mathematics and Statistics – Published by NuLake Ltd New Zealand © Robert Lakeland & Carl Nugent
Use +, –, x, ÷, brackets, exponents as well as square roots with the digits 1, 9, 4 and 5 to make up questions to give the answers from 0 to 50. You can use each of the digits 1, 9, 4, and 5 in any order, but only once in each question. The first one is done for you. Put each of your answers in the appropriate cell of the table drawn below. Note. There is more than one correct answer for each number.
91 – 4 – 5 = 0 = 17 = 34
= 1 = 18 = 35
= 2 = 19 = 36
= 3 = 20 = 37
= 4 = 21 = 38
= 5 = 22 = 39
= 6 = 23 = 40
= 7 = 24 = 41
= 8 = 25 = 42
= 9 = 26 = 43
= 10 = 27 = 44
= 11 = 28 = 45
= 12 = 29 = 46
= 13 = 30 = 47
= 14 = 31 = 48
= 15 = 32 = 49
= 16 = 33 = 50
©uLake LtduLake Ltd Innovative Publisher of Mathematics Texts

Workbook – Year 9 Mathematics and Statistics – Published by NuLake Ltd New Zealand © Robert Lakeland & Carl Nugent
36 Number
Achievement – Evaluate the following.
325. 23
of 21 326. 67
of 14 327. 29
of 72
328. 58
of 32 329. 7
10 of 100 330. 56
of 96
331. 17 of 35 = 10 332.
27 of 40 = 16 333.
38 of = 15
334. 15 of 60 = 48 335.
45 of 36 = 16 336.
5
11 of = 30
Merit – Evaluate the following, showing a line of working to indicate the calculation you are doing.
337. When a box of eggs is dropped two-thirds of them are broken. If the box holds 18 eggs, how many are broken?
338. One hundred and fifty people take part in a survey. Three-fifths of them are female. How many females are there?
339. Taylor spends ninety-five minutes on his homework. Three-fifths of this time he spent on maths. How long did Taylor spend on maths?
340. A box contains forty-eight glasses, one sixth of which have a manufacturing flaw. How many glasses are flawed?
341. The ingredients for an apple crumble for four people is given in the table below. Complete the table to find the quantity of ingredients for the same recipe for three and five people.
Ingredients for four people Ingredients for three people Ingredients for five people320 g of apple
56 g of margarine112 g of flour56 g of sugar
20 g of fruit juice4 g of cinnamon
©uLake LtduLake Ltd Innovative Publisher of Mathematics Texts

Workbook – Year 9 Mathematics and Statistics – Published by NuLake Ltd New Zealand © Robert Lakeland & Carl Nugent
56 Number
Merit – Answer the following integer multiplication and division application problems.
512. If Simon spends $165 more than he earns each month and his current bank balance is $850, what will be his balance in 6 months time?
513. Four brothers decide to purchase a bach costing $245 000. They have $62 000 for a deposit and have to borrow the rest? What is the balance of each of the brothers’ loan account after purchasing the bach?
514. A debt of $230 000 (–$230 000) is to be shared evenly among 8 people. How much of the debt is each person responsible for?
515. A business is losing $440 per month. If their current bank balance is $1500, what will be their balance in 12 months time?
516. An oil rig has to drill to a depth of 384 m (–384 m). If it can drill at a rate of 32 m per day, how many days before it will reach the required depth?
517. A temperature probe registers a temperature of –124˚ C. If the probe’s temperature increases by 8 ˚C per hour, after how many hours will it be at a temperature of 4˚ C?
518. A company’s debt accumulates at a rate of $1.25 million per month (–$1.25 m). a) What would be the company’s annual debt? b) If the annual debt was to be shared evenly between eight directors, what is each director’s liability?
519. A company’s current account after one year in business stands at –$3.45 million. If their average profit per month for the next twelve months is $450 000, what would be the company’s new current account balance at the end of the next financial year?
520. The Mariana Trench is 10 911 metres below sea level (–10 911 m), three times more than the depth of the Hikurangi Trench. What is the depth of the Hikurangi Trench?
521. Laguna del Caban in Argentina is 105 metres below sea level (–105 m). The Dead Sea Shore in Israel is four times lower. What is its depth?
522. The balance of Jason’s overdraft is $2450 OD (–$2450). If Jason’s repayments are $105 per month what will be the balance of his overdraft after 18 months?
523. Kay has a student loan of $8950 (–$8950). If she borrows a further $9750 per year for three years what will be the balance of her loan when she has completed her course?
©uLake LtduLake Ltd Innovative Publisher of Mathematics Texts

Workbook – Year 9 Mathematics and Statistics – Published by NuLake Ltd New Zealand © Robert Lakeland & Carl Nugent
66 Number
Find the answer to each of the following percentage questions. Join the question and answer with a straight line. Each line will pass through a letter. Enter the letter in the appropriate spot at the bottom of the page to answer the riddle.
What would a country be called if everyone in it
lived in their cars?
Write 48% as a simplified fraction
$15.60
Write 0.025 as a percentage. 35%
Express 12 out of 45 as a percentage.
47% (0 dp)
Find 35% of 120.
26.7% (1 dp)
Sally earns $390 a week but is about to get a 4% pay rise. How much does she now get extra a week?
1225
12 out of 32 students in a class bike to school. What is this as a percentage?
42Jason earned $80 and paid $16 tax. What percentage of his earnings did Jason pay in tax?
0.158
Convert 15.8% to a decimal.
What percentage of 48 is 15?
37.5%
31.25%
Convert 7
15 to a percentage.
2.5%
What percentage of 90 is 31.5?
20%
2.5% 42 1225
37.5% 20% 47% 37.5%
C
I
31.25% 35%
0.158 15.6 26.7% 47%
T
O
R
N
A
INA
N
©uLake LtduLake Ltd Innovative Publisher of Mathematics Texts

77Algebra
Workbook – Year 9 Mathematics and Statistics – Published by NuLake Ltd New Zealand © Robert Lakeland & Carl Nugent
Find the answer to the riddle at the bottom of the page by identifying which letter corresponds to the applicable coordinate. For example the coordinate (3, 4) corresponds to the letter Z.
Why did the scarecrow win the Nobel Prize?
(–7, 7) (–6, 3) (0, –7) (–3, –6) (5, 0) (7, 6) (–10, –3) (–6, –5) (–3, –3) (–6, 1) (8, 9) (7, –10)
–10 –9 –8 –7 –6 –5 –4 –3 –2 –1 x1 2 3 4 5 6 7 8 9 10
1
9
8
7
6
5
4
3
2
10y
–1–2–3–4–5–6–7
–8–9
–10
Z
(2, 8) (4, –7) (8, –2) (7, –10) (6, –6) (–9, –8) (5, –3) (2, 2) (5, 8) (1, 0) (–10, 4)
(9, –5) (–10, 9) (–9, –5) (9, –7) (–3, 0) (2, 6) (–9, –10) (–10, 7) (–3, 8) (3, –5)
B
E
O
S
A
W
A
A
E
A
U
U
H
A
C
T
A
A
A
S
A
A
E
A
N
T
S
D
I
N
G
I
N
H
I
S
F
I
E
L
D
U
©uLake LtduLake Ltd Innovative Publisher of Mathematics Texts

Workbook – Year 9 Mathematics and Statistics – Published by NuLake Ltd New Zealand © Robert Lakeland & Carl Nugent
88 Algebra
Linear Equations of the form ax = b
Equations of the form ax = b can be solved by dividing both sides of the equation by ‘a’.Consider 5x = 35Since 5x means 5 times x, then the equation 5x = 35 means ‘five times what number equals 35’.Remember an equation is like a set of scales that must always remain in balance. The centre or balance point of the ‘equation scales’ is the equal sign. An equation will stay in balance as long as what we do to one side of the equation we also do to the other side.For the equation 5x = 35 we divide both sides by 5, because we wish to undo the multiply by 5 and therefore just leave x on its own on one side and a number on the other. So 5x = 35
5x5
= 355
= 5x5
= 355
(divide both sides by 5) x = 7 Another way of setting out the equation is as below. Both sides have to be divided by 5 and an ‘equals’ line has been drawn underneath. 5x = 35 ÷5 ÷5 x = 7
Dividing down
Always check your answer, after solving an equation, by substituting it back into the original equation to confirm it is correct.For the examples above:a) 3 x 8 = 24 3b) –7 x –9 = 63 3
Example
a) 3x = 24
3x3
= 243
= 3x3
= 243
(divide both sides by 3) x = 8
b) –7x = 63 ÷ –7 = ÷ –7 x = –9
Solve the equationsa) 3x = 24 b) –7x = 63
Dividing down
If the ‘a’ value in the equation is negative, e.g. –3, we must divide both sides by –3 NOT just 3.
©uLake LtduLake Ltd Innovative Publisher of Mathematics Texts

Workbook – Year 9 Mathematics and Statistics – Published by NuLake Ltd New Zealand © Robert Lakeland & Carl Nugent
98 Algebra
Achievement – Write an expression for each of the following.
134. The sum of 5 and x. 135. Twelve is added to e.
136. Six is taken away from b 137. The sum of a, b and c.
138. k is increased by 8. 139. Five is decreased by x.
140. The difference between n and 4. 141. The difference between 4 and n.
142. Half of x then add 4. 143. One-quarter of p then minus 5.
144. Double n then add 7. 145. Double x then subtract 3.
146. Add 2 to x, then divide by 5. 147. Four times x minus 7.
148. Subtract 4 from twice the number n. 149. Add 6 to the number x and then multiply by 3.
150. Subtract 2 from n and then multiply by 7. 151. Add a, b and c and then divide by 2.
152. The difference of x and y then multiplied by z. 153. The difference of x and y then divided by z.
154. Subtract 15 from three times a number, n. 155. Multiply the number n by itself and add 3.
156. The product of the number x, y and z. 157. Increase n by 3 and then multiply by 5.
©uLake LtduLake Ltd Innovative Publisher of Mathematics Texts

Workbook – Year 9 Mathematics and Statistics – Published by NuLake Ltd New Zealand © Robert Lakeland & Carl Nugent
102 Algebra
Achievement – Evaluate each expression using the values given.
192. x + 8 – y; when x = 5 and y = 9. 193. x + 2y + z; when x = 3, y = –2 and z = 4
194. 3(a + b); when a = –5 and b = 3 195. a – 5c; when a = 7 and b = –3
196. 2(a – b – c); when a = 3, b = –6 and c = 9. 197. a2 + b2; when a = 5 and b = –9.
200. a3
+ 2ab; when a = 9 and b = 2. 201. abc ÷ 3; when a = 4, b = 9 and c = –2.
198. x + y; when x = 16 and y = –8. 199. x + y2; when x = 25 and y = –3.
186. a + b; when a = 15 and b = 18. 187. 2x + y; when x = 13, y = 4.
188. 4c; when c = –9. 189. x + y + z; when x = 8, y = –9 and c = 5.
190. ab; when a = –2, b = 4. 191. abc; when a = –3, b = –5 and c = 4.
202. (a – 2)2; when a = –6. 203. 3(x + y)2; when x = 6 and b = 7.
204. (x + 3)2 + b; when x = 4 and b = 5. 205. 4(x – 5)2 – y; when x = 2 and y = –2.
206. 2x2y; when x = 5 and y = –3. 207. 2(x + 4)(x – 5); when x = 3.
©uLake LtduLake Ltd Innovative Publisher of Mathematics Texts

Workbook – Year 9 Mathematics and Statistics – Published by NuLake Ltd New Zealand © Robert Lakeland & Carl Nugent
114 Measurement
Example
a) Since there are 10 000 m2 in a hectare and we are going from a larger to a smaller unit we multiply by 10 000. 1.2 ha x 10 000 = 12 000 m2
b) Since there are 100 mm2 in 1 cm2 and we are going from a smaller to a larger unit we divide by 100. 4300 mm2 ÷ 100 = 43 cm2
c) Since 1 hectare is equivalent to 10 000 m2 and we are going from a smaller to a larger unit we divide by 10 000. 15 800 m2 ÷ 10 000 = 1.58 had) Since there are 100 mm2 in 1 cm2 and we are going from a larger to a smaller unit we multiply by 100. 25 cm2 x 100 = 2500 mm2.
Change the following to the unit indicated in brackets.a) 1.2 ha (m2) b) 4300 mm2 (cm2) c) 15 800 m2 (ha) d) 25 cm2 (mm2)
Achievement – Change the following to the unit indicated in brackets.
23. 35 000 m2 (ha) Smaller to larger, so divide 24. 9.2 m2 (cm2) Larger to smaller, so multiply
25. 750 mm2 (cm2) Smaller to larger, so divide 26. 4.5 cm2 (mm2) Larger to smaller, so multiply
27. 2.35 ha (m2) 28. 1200 m2 (ha)
29. 0.75 m2 (cm2) 30. 0.025 m2 (mm2)
31. 65 400 000 mm2 (m2) 32. 12 800 mm2 (m2)
1 ha = 10 000 m2
1 m2 = 10 000 cm2
1 m2 = 1 000 000 mm2
1 cm2 = 100 mm2
©uLake LtduLake Ltd Innovative Publisher of Mathematics Texts

119Measurement
Workbook – Year 9 Mathematics and Statistics – Published by NuLake Ltd New Zealand © Robert Lakeland & Carl Nugent
Find the answer to each conversion between units question. Join the question and answer with a straight line. Each line will pass through a letter. Enter the letter in the appropriate spot at the bottom of the page to answer the riddle.
What did the tie say to the hat?
Convert 4.5 m to centimetres
540 000
Convert 5.4 km to metres 4500
Convert 0.045 km to centimetres
0.045
Convert 45 500 kg to tonnes
5400
Convert 0.054 m3 into litres
450
Convert 5.4 km to centimetres
540Convert 5400 cm to mm
45
Convert 0.54 T to kilograms
Convert 0.0054 L to millilitres
54 000
0.45
Convert 4500 m2 to hectares
4.5
Convert 45 000 g to kilograms
45.5
Y
E
O
L
G
D
I
U
W
R
4.5 450 45.5 5.4 450 54 000 5400 54 54 000 540
54 000 4500 540 45 540 000 540 000 5400 54 000 4500 5.4
54 000 0.045 450 45.5 4500 540 54 000 0.45 5400 45 540 000 54
Convert 0.000 45 cm2 to mm2
Convert 4.5 millilitres to cm3
54
5.4
H
NA
‘
©uLake LtduLake Ltd Innovative Publisher of Mathematics Texts

Workbook – Year 9 Mathematics and Statistics – Published by NuLake Ltd New Zealand © Robert Lakeland & Carl Nugent
124 Measurement
Achievement – Mark the required temperature on each of the following thermometers, by shading up to the correct position.
˚C
10
20
30
40
50
60
106.
0
˚C
10
20
30
40
50
60
107.
0
˚C
10
20
30
40
50
60
108.
0
˚C
10
20
30
40
50
60
109.
0
50 ˚C 28 ˚C 42 ˚C 19 ˚C
0
100
400 500 600
700
800
200 300
110.
0
100
400 500 600
700
800
200 300
111.
0
100
400 500 600
700
800
200 300
112.
Mark the required value on each of the following gauges, by drawing an arrow from the centre of the gauge to the correct position.
600 325 775
113. Mark the value 100.
0 30 60 90 120
114. Mark the value 36.
0 40 80 120 160
Mark the required value on each of the following rulers, by drawing an arrow pointing to the correct position.
115. Mark the value 57.
0 10 20 30 40
116. Mark the value 21.
0 20 40 60 80
117. Mark the value 95.
0 80 160 240 320
118. Mark the value 172.
0 50 100 150 200
119. Mark the value 264.
0 5 10 15 20
120. Mark the value 13.5.
0 80 160 240 320
©uLake LtduLake Ltd Innovative Publisher of Mathematics Texts

137Measurement
Workbook – Year 9 Mathematics and Statistics – Published by NuLake Ltd New Zealand © Robert Lakeland & Carl Nugent
We can use our knowledge of the area of a parallelogram and the circumference of a circle to formulate a rule for the area of a circle.Consider the circle below which has been divided into 10 sectors. If we then ‘unwrap’ these sectors from the circle we obtain an approximate parallelogram with height the radius of the original circle and base πr.
Remember that the circumference of a circle is πd or 2πr, therefore half the circumference is πr.Obviously the top and base of the parallelogram formed are not straight sides, but if we were to divide the circle into 1000 sectors and then unwrap these the top and base would be closer to having a straight top and base.In summary the formula for the area of a circle is Area(circle) = π x r x r = πr2
Area of a Circle
= r
πr
Find the area of the following.a) b)
2.50 m 12.4 cm
c)
4.3 mm
a) Area (circle) = πr2 = π x 2.50 x 2.50 = 19.6 m2 (3 sf)
b) Area (circle) = πr2 = π x 6.20 x 6.20 (half diameter) = 121 cm2 (3 sf)
c) Area (half-circle) = πr2 ÷ 2 = (π x 4.3 x 4.3) ÷ 2 = 29 mm2 (2 sf)
If you are required to find the area of a circle and are given the diameter of the circle, remember to half it to get the radius, before using the formula A = πr2.
To find the area of a semi-circle (half a circle) we find the area of a circle and divide by 2. See example c) above.
Example
©uLake LtduLake Ltd Innovative Publisher of Mathematics Texts

143Measurement
Workbook – Year 9 Mathematics and Statistics – Published by NuLake Ltd New Zealand © Robert Lakeland & Carl Nugent
Achievement – Find the volume of the following by counting cubes. Each cube measures 1 cm3.
220. 221.
222. 223.
224. 225.
©uLake LtduLake Ltd Innovative Publisher of Mathematics Texts

153Measurement
Workbook – Year 9 Mathematics and Statistics – Published by NuLake Ltd New Zealand © Robert Lakeland & Carl Nugent
00000055012005356000063090001200123013301400150016001630170018001900193020302125222022502350
Outrageous Wasters (G)Te KarereBBC WorldTe KarereNZI BusinessBreakfastGood MorningOne News at MiddayEmmerdale (G)Airline (G)Dickinsons Real Deal (G)60 Minute Makeover (G)Te KarereOne News at 4.30Ellen (G)One News at 6pmClose UpCoronation Street (PGR)The Forgotten (AO)Criminal Minds (AO)One News TonightTagata Pasifika (G)Martina Cole: Girl in Gangs (AO)
TV One – Thursday
293. Study the TV One timetable on the right and answer the questions relating to it. a) What time does The Forgotten start. Give your answer in 12-hour time?
b) What is the duration of the programme Criminal Minds?
c) How many times does Te Karere play on Thursday and at what times?
d) Give the total time assigned to TV News on TV One on Thursday?
e) If the program Martina Cole: Girl in Gangs has duration 1 hour 45 minutes when will it end? Give your answer using 24-hour clock time.
f) What is the total time in hours and minutes that Te Karere screens for on a Thursday?
294. Study the school timetable below right and answer the questions relating to it. a) What time is morning briefing?
b) What is the length of each period?
c) How long a break is there between period 4 and period 5?
d) How many periods of English are there in a week?
e) What is the length of a school day from the start of briefing to the end of period 7?
f) A teacher at the school has five duties per week. One before school from 0745 to the start of briefing, two half break duties and two half lunch duties. How long does a teacher spend on duty each week?
©uLake LtduLake Ltd Innovative Publisher of Mathematics Texts

167Shape
Workbook – Year 9 Mathematics and Statistics – Published by NuLake Ltd New Zealand © Robert Lakeland & Carl Nugent
Achievement – Calculate the missing angles.
23. 24.
38˚a 24˚42˚ b
25. 26.
48˚
c
64˚ ff
27. 28.
103˚39˚
d
78˚e
29. 30.
4g4g
2g7h5h
©uLake LtduLake Ltd Innovative Publisher of Mathematics Texts

Workbook – Year 9 Mathematics and Statistics – Published by NuLake Ltd New Zealand © Robert Lakeland & Carl Nugent
174 Shape
Achievement – Calculate the missing angles.
64. 65.
78˚
106˚ c
66. 67.
215˚28˚
c
71˚ e
d 97˚ f
68. 69.
38˚82˚
g
19˚
i
j
70. 71.
68˚
l
115˚
k
27˚
111˚
d143˚
112˚
76˚
34˚ 114˚
97˚
99˚
44˚m
n
h
36˚
34˚
©uLake LtduLake Ltd Innovative Publisher of Mathematics Texts

187Shape
Workbook – Year 9 Mathematics and Statistics – Published by NuLake Ltd New Zealand © Robert Lakeland & Carl Nugent
Achievement – Draw nets for the following three-dimensional shapes.
108. 109.
110. 111.
A triangular prism.
A trapezoidal prism. A quadrilateral frustum with a square base.
A hexagonal pyramid.
©uLake LtduLake Ltd Innovative Publisher of Mathematics Texts

195Shape
Workbook – Year 9 Mathematics and Statistics – Published by NuLake Ltd New Zealand © Robert Lakeland & Carl Nugent
Line SymmetryAn object is symmetrical if a mirror line or lines can be placed on the figure reflecting the object back onto itself.The three letters of the alphabet below have one axis of symmetry.
A C DThese three letters of the alphabet have two axes of symmetry.
H XThe letter X could have four axes of symmetry, if it was drawn as below.
If we trace a shape onto paper and can then fold it so that one half of the object maps exactly onto the other half, then the fold line is an axis of symmetry.
ExampleDraw in the axe(s) of symmetry for the following shapes.a)
b)
c)
a)
b)
c)
One axis of symmetry.
Two axes of symmetry.
Three axes of symmetry.
©uLake LtduLake Ltd Innovative Publisher of Mathematics Texts

211Shape
Workbook – Year 9 Mathematics and Statistics – Published by NuLake Ltd New Zealand © Robert Lakeland & Carl Nugent
Enlargement is the process of enlarging or reducing a shape or figure about a point called the centre of enlargement, using a given scale factor.When the scale factor is greater than one the shape is enlarged.When the scale factor is less than one the shape is reduced.When we enlarge or reduce an object or shape the length of the lines and the area of the shape change, but the angle sizes and orientation remain unchanged (invariant).Consider the enlargement below. The figure ABCD has been enlarged by a scale factor of 2. Each length is twice its original size.
Enlargement
If the original figure in a transformation is labelled ABC then we label the transformed image A’B’C’.
A
BC
The centre of enlargement remains invariant (unchanged) under enlargement.
DA’ D’
C’
B’
Centre of enlargement
An easy way to draw an enlargement is to begin by drawing guide lines from the centre of enlargement through each
of the key points of the shape. The key points of the enlargement when drawn must fit on these guide lines just like the original shape. To calculate the location of the key points of the enlarged figure always count from the centre of enlargement. For example in the enlargement above the distance from the centre of enlargement to the point A is 3 units. If we multiply this by the scale factor 2, the point A’ must be 6 units (2 x 3) from the centre of enlargement directly along the guide line from the centre of enlargement through the point A. From the point A’ it is then just a matter of drawing the lengths of the enlarged shape remembering to multiply the originally lengths by 2 to find what the image lengths need to be.
OA = 3 unitsOA’= 3 x 2 = 6 units
O
You can find the scale factor of an enlargement by inspection or by finding the measurement of an image length and dividing it by the measurement of the original length,
e.g.
length A'D'length AD
= 63
’ =
length A'D'length AD
= 63 = 2, so the scale
factor of the enlargement is 2.
©uLake LtduLake Ltd Innovative Publisher of Mathematics Texts

215Shape
Workbook – Year 9 Mathematics and Statistics – Published by NuLake Ltd New Zealand © Robert Lakeland & Carl Nugent
Achievement – For each of the following enlargements draw in the guide lines through each pair of key points to find the centre of enlargement. Mark it with the letter O. Also find the scale factor of the enlargement. The first one is done for you.
O
BA
CD
EA’ B’
C’D’
E’
By drawing guide lines through each pair of key points, AA’, BB’ etc. and then finding where they intersect we can locate the centre of enlargement, O.To find the scale factor of the enlargement we divide an image length by the equivalent original
length, i.e. Scale factor =
length C'D'length CD
= 84 =
length C'D'length CD
= 84 = 2.
210. A’ B’
C’
D’
E’F’
G’
A BC
DEF
G
B
A’
B’C’
211. 212. A
CD
E
F
D’
E’
F’
213.
A’ B’
C’
D’E’
A BC
DE
A BCD
A’ B’
C’D’
Example
©uLake LtduLake Ltd Innovative Publisher of Mathematics Texts

Workbook – Year 9 Mathematics and Statistics – Published by NuLake Ltd New Zealand © Robert Lakeland & Carl Nugent
234 Statistics
16. 17. 18. 1, 2, 2, 3, 3, 4, 4, 4, 5, 5, 6, 7, 9, 10, 13, 18, 20, 23, 25, 27
23, 34, 12, 45, 23, 56, 34, 23, 34, 58, 13, 17, 34, 78, 3
3.7, 2.5, 1.7, 5.8, 3.6, 2.0, 9.2, 5.8, 6.4, 17.3, 4.4
Calculate the mode of:
19. 20. 21. 1, 2, 2, 3, 3, 4, 4, 4, 5, 5, 6, 7, 9, 10, 13, 18, 20, 23, 25, 27
23, 34, 12, 45, 23, 56, 34, 23, 34, 58, 13, 17, 34, 78, 3
3.7, 2.5, 1.7, 5.8, 3.6, 2.0, 9.2, 5.8, 6.4, 17.3, 4.4
Calculate the median of
26. Tatum sold muffins each lunchtime at school as part of a fundraiser for the Hockey 1st XI. Over a ten day period she sold 28, 45, 32, 55, 32, 40, 40, 29, 38 and 45 muffins. Calculate the mean, median and mode number of muffins sold over the ten day period.
27. The scores of Jake’s last 15 rounds of golf have been, 92, 90, 85, 90, 99, 86, 102, 90, 94, 88, 96, 100, 99, 101 and 90. Calculate the mean, median and mode of his golf scores.
28. The test results of four students were 80, 70, 90 and x. If the mean of the test results was 80, what is the value of test score x?
29. A group of 20 students sold tickets as a fundraiser. The mean number of tickets sold per students was 85. How many tickets were sold altogether?
22. Seven people were asked how far they lived from school in kilometres. The results were 14, 6, 20, 4, 8, 2, 11, 10, 14, 8, 8, 5. Find the mean, mode and median distances.
23. A group of 20 students were asked the number of pets they had. The results were 1, 0, 2, 3, 4, 2, 1, 2, 1, 1, 5, 2, 3, 1, 1, 0, 2, 1, 2, 3. Find the mean, median and mode number of pets.
24. The ages of ten teachers at a school are 34, 43, 30, 56, 37, 28, 25, 35, 40, 42. Calculate the mean and median age of the teachers.
25. The weights to the nearest kg of students in a rugby team were 48, 49, 52, 55, 64, 52, 45, 52, 60, 64, 72, 70, 68, 65, 50. Calculate the mean and median weight of the students.
30. A sports shoe store is offering a special on a particular running show. In the first week of the sale it sold the following sizes of the shoe on special 6, 7, 8, 8, 8, 8, 9, 9, 9, 10, 10, 11. Of the three averages which one would be the most useful to the manager of the store. Calculate that average only and justify why.
Merit – Answer the following questions.©uLake LtduLake Ltd Innovative Publisher of Mathematics Texts

241Statistics
Workbook – Year 9 Mathematics and Statistics – Published by NuLake Ltd New Zealand © Robert Lakeland & Carl Nugent
Merit – Answer the following questions.
35. A plumber receives the following number of calls per day over a period of 33 days. See the frequency table below. Find the mean, mode and median number of daily calls the plumber receives.
Calls per day (x)
Frequencyf
x.f
1 3 32 3 63 2 64 55 36 47 68 39 4
TOTAL 33
36. A marksman receives the following scores after 30 shots at a target. See the frequency table below. Find the mean, mode and median score the marksman gets.
Score (x) Frequencyf
x.f
0 2 05 5 2510 815 620 525 4
TOTAL 30
37. Louise records the ages (to the nearest year) of all the children on her school bus. Find the mean, mode and median age of the children on the bus.
Age (x) Frequencyf
x.f
11 612 913 714 815 316 2
TOTAL 35
38. Triple A Orchards sells apples in large bags by weight. In a sample of 25 bags the number of apples were counted and the results are represented in the frequency table below. Find the mean, mode and median number of apples in a bag.
Apples per bag (x)
Frequencyf
x.f
45 348 349 450 952 454 2
TOTAL 25
©uLake LtduLake Ltd Innovative Publisher of Mathematics Texts

Workbook – Year 9 Mathematics and Statistics – Published by NuLake Ltd New Zealand © Robert Lakeland & Carl Nugent
256 Statistics
57. An investigation was undertaken to see if there was a relationship between the time (hours) a person exercised for per week and their weight (kg). Data was collected in the form (hours, weight) and is given below. (0, 200), (4, 120), (8, 80), (0, 160), (2, 130), (2, 150), (6, 110), (7, 90), (3, 110), (1, 170), (6, 90), (1, 80), (5, 140), (5, 100), (7, 130) (8, 90), (3, 150), (1, 140), (4, 70), (4, 130), (8, 120), (2, 180).a) Plot the data values on the set of axes below.
b) How many hours exercise per week did the heaviest person do? c) Draw a straight line on the graph so that it ‘fits’ the data.d) Describe the relationship between the number of hours exercise per week and a person’s weight.
e) Do you think there are any outliers in the dataset? Give a reason for your answer.
f) What was the weight of the lightest person who exercised 4 hours per week?
g) Calculate the mean number of hours spent exercising by the people in the investigation.
58. Describe the type of relationship (negative, positive, none) you think the following investigations if undertaken would have.a) The amount of homework a student does and the weight of their school bag.
b) The number of cars on the motorway and the time it would take to get to work.
c) The time spent talking on your cell phone and the amount of money left on the phone.
d) The age of a car and its value.
e) The income of people and the amount they spend on eating out.
f) The number of letters in a person’s name and their level of intelligence.
g) The number of years a person has been driving and the number of accidents they have had.
1 2 3 4 5 6Hours
40
80
120
160
Weight (kg)
200
7 8
©uLake LtduLake Ltd Innovative Publisher of Mathematics Texts

259Statistics
Workbook – Year 9 Mathematics and Statistics – Published by NuLake Ltd New Zealand © Robert Lakeland & Carl Nugent
Achievement/Merit – Answer the following questions on pie charts.
59. An electronics store sells 5 different makes of TV. The proportion of sales by brand last month are given in the pie chart below.
a) The pie chart above is divided into 20 sections. What does each section represent as a percentage?
b) What was the most popular brand of TV the electronics store sold last month?
c) What was the least popular brand(s) of TV the electronics store sold last month?
d) What percentage of TVs sold by the electronics store last month were LG?
e) What percentage of TVs sold by the electronics store last month were Samsung?
f) If the electronics store sold 60 TVs last month how many of them were Samsung TVs?
g) If the electronics store sold 60 TVs last month how many of them were Sharp TVs?
h) What angle does the Samsung sector of the pie chart represent?
i) What angle does the Sharp sector of the pie chart?
Monthly TV Sales by Brand
LG
SamsungSharp
Toshiba
Sony
60. Jake’s iTunes music collection comprises 80 albums. A breakdown of the different types of albums (genres) he has are given in the table below.
a) Draw a pie chart to represent Jake’s iTunes music collection by first calculating the angle size for each sector.
b) What percentage of Jake’s music collection is pop?
c) What two types (genre) of music albums in Jake’s collection combine to give the same number as rock albums?
d) What fraction of Jake’s albums are country albums?
e) What proportion of Jake’s music is Blues?
Jake’s iTunes Music
Type Pop Rock Country Blues R&BNo. 30 20 18 10 2
©uLake LtduLake Ltd Innovative Publisher of Mathematics Texts

271Statistics
Workbook – Year 9 Mathematics and Statistics – Published by NuLake Ltd New Zealand © Robert Lakeland & Carl Nugent
71. The line graph below gives the monthly rainfall (mm) for a town in New Zealand.
a) What month of the year was the wettest?
b) What two months had the same rainfall?
c) How many months of the year had 30 mm or more rainfall?
d) Why has a dotted line been drawn between the monthly points?
e) What was the driest month of the year?
f) How much rain fell in October?
g) What was the total rainfall throughout the year ?
Achievement/Merit – Answer the following questions on line graphs.
70. A saucepan of liquid is heated slowly over a gas flame and then allowed to cool. The temperature (˚C) of the liquid is recorded every 5 minutes. A line graph of the results is drawn below.
a) What was the temperature of the liquid prior to heating?
b) What maximum temperature did the liquid reach?
c) What was the temperature after 25 minutes?
d) What was the temperature after 45 minutes?
e) For how long was the temperature above 60 ˚C?
f) After how many minutes was the temperature 40 ˚C?
Temperature
5 15 20 25 Mins
20
40
60
80
˚C
100
100 30 35 40 45
Rainfall
F A M JMonth
10
20
30
40
Rainfall (mm)
50
MJ J A S O N D©uLake LtduLake Ltd Innovative Publisher of Mathematics Texts

277Statistics
Workbook – Year 9 Mathematics and Statistics – Published by NuLake Ltd New Zealand © Robert Lakeland & Carl Nugent
Statistical Enquiry Cycle cont...
The dataset which has been provided gives the age and price of 75 Subrau Imprezas 1.5. Information on the distance (km) the cars have travelled is also included in the table, but for this investigation will not be required.Obviously we could investigate all 75 cars in the dataset but that would take a long time. A better approach is to take a sample of the data. A sample is a smaller selection that hopefully gives us results and values similar to those if we investigated all 75 cars.The size of a sample is important. If it is too small it may not accurately reflect the dataset as a whole. So for this investigation we are suggesting you collect a sample of 30 cars from the dataset of 75. The data in the dataset has been numbered from 001 – 075. We can generate 30 unique numbers in the range 1 to 75 inclusive using the random generating function on the calculator.
DataOn the Casio to generate a random number between 1 and 75 inclusive we press
which will generate a random number each time the = button is pressed. You will need to ignore the digits after the decimal point. On the TI we enter
which will generate a random number each time you press the enter key.As you generate your random numbers shade the left hand square corresponding to the applicable entry in the table. If a random number is repeated, ignore it. Continue until you have 30 entries in the dataset table shaded. This is you sample.
No. Year Age in 2010
km(000s)
Price ($)
043 2010 0 1 35000044 1996 14 172 6000045 2001 9 27 12000046 1999 11 88 9000047 2002 8 115 9000048 2001 9 92 7500049 2001 9 94 9000050 2000 10 59 9000051 2001 9 120 9000052 2002 8 50 14000053 2003 7 68 11000054 2004 6 104 11000055 2001 9 70 10000056 2005 5 95 9000057 1994 16 200 3000058 2006 4 89 13000059 2002 8 105 10000060 2003 7 75 11000061 2004 6 42 13000062 2002 8 71 10000063 2002 8 103 8000064 2007 3 54 18000065 2004 6 84 12000066 2000 10 86 11000067 2002 8 95 10000068 2001 9 41 10500069 2001 9 104 9000070 2001 9 87 10000071 1999 11 54 9000072 2000 10 92 9000073 1996 14 110 6500074 1993 17 85 5000075 1998 12 100 4000
7 x SHIFT5 . +
1 =
Ran#
prb 2 1 2nd .
7 5 enter)
RAND
On the Casio calculator we multiplied the Ran# function by 75 and added 1. The reason we added one is because 75 x Ran# on its own would have produced a number from 0 to 74 inclusive. By adding one we get a number from 1 to 75 inclusive.
©uLake LtduLake Ltd Innovative Publisher of Mathematics Texts

285Probability
Workbook – Year 9 Mathematics and Statistics – Published by NuLake Ltd New Zealand © Robert Lakeland & Carl Nugent
Achievement – Answer the following questions.
6. Four different coloured marbles are placed in a bag. A marble is drawn out and its colour noted. It is then placed back in the bag and another marble drawn out. The process is repeated 100 times. The results of the experiment are given in the table below.
a) List the sample space (possible outcomes) of the experiment.
b) Calculate the relative frequency of a red marble being drawn out.
c) Calculate the relative frequency of a yellow marble being drawn out.
d) Calculate the relative frequency of a blue or green marble being drawn out.
e) If the experiment had been conducted 200 times what do you think the relative frequency of a yellow marble being drawn out would be?
No. of times
Red 32Green 18Blue 21
Yellow 29Total 100
7. A coin and a die are thrown at the same time repeatedly. The results are given in the table below.
a) List the sample space (possible outcomes) oftheexperiment.Thefirstoneisdonefor you.
b) How many times was the coin and die thrown during the experiment?
c) How many times did the coin land heads up during the experiment?
d) How many times did a six land face up on the die during the experiment?
e) Calculate the relative frequency of getting a four on the die and a tail on the coin.
f) Calculate the relative frequency of getting a three on the die and a head on the coin.
g) If the experiment had been conducted 300 times, what do you think the relative frequencyofafiveandtailwouldbe?
H T Total1 6 10 162 10 7 173 8 9 174 13 10 235 6 15 216 2 4 6
Total 45 55 100
H, 1©uLake LtduLake Ltd Innovative Publisher of Mathematics Texts

293Probability
Workbook – Year 9 Mathematics and Statistics – Published by NuLake Ltd New Zealand © Robert Lakeland & Carl Nugent
a) Acoinisthrownfirstfollowedbyadie. Draw a tree diagram to represent this. Put all the probabilities on your tree.b) Using your tree diagram from part a) list all the possible outcomes (sample space).c) Usingyourtreediagramfindtheprobabilityof getting a head followed by the number 5.d) Usingyourtreediagramfindtheprobabilityof getting a tail followed by an even number on the die.
a) Tree diagram showing probabilities and outcomes.
b) Possible outcomes: H1, H2, H3, H4, H5, H6, T1, T2, T3, T4, T5, T6
c) Tofindtheprobabilityofaheadfollowed by the number 5 we put the number of times H5 occurs (1) over the total number of possible outcomes (12) so
P(head followed by 5) = 112
d) Tofindtheprobabilityofatailfollowedby an even number we put the number of times a tail followed by an even number occurs (T2, T4, T6) = 3) over the total number of possible outcomes (12) so
P(tail followed by an even number) = 312
Coin
Outcomes
H T
1 2 3 4 5 6 1 2 3 4 5 6
12
12
16
161
616
16
16
16
161
616
16
16
H1, H2, H3, H4, H5, H6, T1, T2, T3, T4, T5, T6
By reading from the top of the probability tree and down each pair of branches in turn we can list all the possible outcomes, e.g. H1, H2 etc.
Example
©uLake LtduLake Ltd Innovative Publisher of Mathematics Texts

Workbook – Year 9 Mathematics and Statistics – Published by NuLake Ltd New Zealand © Robert Lakeland & Carl Nugent
308 Numeracy Strategies
7.5 Place Value Strategy (Subtraction)
Place ValueThe place value strategy involves choosing the largest number and then successively subtracting the thousands, hundreds, tens and ones of the other number from it. Sometimes this method is also called Separating or Decomposing.When is the ideal situation to use the place value strategy for subtraction?Use the place value strategy when the digits of the smaller number are less than or equal to the corresponding digits in the larger number. Note: In some instances p lace value is still worthwhile using if this is not the case.The problem 357 – 245 is ideal for using the place value strategy, but not so for 324 – 187 because (7 > 4 and 8 > 2).Once we have identified that the strategy we plan to use is place value choose the largest of the numbers as your starting number and successively subtract the thousands, hundreds, tens and then the ones of the other number, from it.Consider the subtraction problem 549 – 214.Step 1 – choose the largest number as your starting number e.g. 549. Step 2 – expand the second number i.e. 216 = 200 + 10 + 4.Step 3 – subtract 200, then 10, then 4 from your the starting number. Your processing or thinking would be as
549 – 200 = 349
349 – 10 = 339
339 – 4 = 335
Example
Use the place value strategy to answer the following questions.a) 68 – 35 = b) 453 – 125 =c) 4876 – 2634 =
Question Strategy Thinkinga) 68 – 35 = Place value 68 – 30 = 38 38 – 5 = 33b) 453 – 125 = Place value 453 – 100 = 353 353 – 20 = 333 333 – 5 = 328c) 4876 – 2634 = Place value 4876 – 2000 = 2876 2876 – 600 = 2276 2276 – 30 = 2246 2246 – 4 = 2242
Many of the questions you will be asked in this section can be solved using multiple strategies not just place value.
Starting number
Total so far
Total so far
Subtracting 100s
Subtracting 10s
Subtracting 1s
Answer
follows:
©uLake LtduLake Ltd Innovative Publisher of Mathematics Texts

Workbook – Year 9 Mathematics and Statistics – Published by NuLake Ltd New Zealand © Robert Lakeland & Carl Nugent
328 Practice Assessments
According to a USA survey 60% of customers who were going to purchase an iPad, were planning to purchase the 16 GB, Wi-Fi + 3G model costing $629 US.
(d) If 300 000 iPads were sold in the first day of sales, how many would you have expected to be the 16GB, Wi-Fi + 3G model?
(e) One megabyte is equivalent to approximately 1 049 000 bytes and one gigabyte is approximately 1000 megabytes. If an iPad data plan gives a user 2 GB of data per month, how many bytes is that? Give your answer in standard form.
(f) 1320 of the customers who purchase an iPad take out the extended online technical support
option and 27
of these end up having to use it. If 420 customers purchase an iPad how
many end up using the extended online technical support?
(g) Jake buys an iPad for $979 on hire purchase. He pays a deposit of $150 and 12 monthly payments of $85. How much more does he pay for the iPad by using hire purchase?
©uLake LtduLake Ltd Innovative Publisher of Mathematics Texts

Workbook – Year 9 Mathematics and Statistics – Published by NuLake Ltd New Zealand © Robert Lakeland & Carl Nugent
346 Answers – Number
Page 41366. = 42367. = 96368. = 64369. = 72
370. 4 1
2
371. a) 130
b) 1 1
2 km
372. 108373. 21374. 120
375. 67
376. 2 2
5
377. 16 2
3378. 184 ha379. $600
Page 43380. 0.2381. 0.15382. 0.225383. 0.875384. 0.95385. 0.52386. 0.265387. 0.93388. 2.04389. 4.06390. 3.65391. 4.85392. 0.003393. 7.4Page 44
394. 45
395.
34
396. 120
397. 25
398. 1320
Page 44 cont...
399.
9125
400.
37200
401.
225
402.
325
403. 95
404. 5120
405. 8920
406. 0.125
407. 720
408. 0.8125
409. 1325
410. 0.575411. 0.075
Convert 2.3 to a simplified fraction
0.85
Convert
1720
to a decimal
Convert
4815
to a decimal
Convert
208650
to a decimal
Convert
1580
to a decimal
Convert 3
1625
to a decimal
0.32Convert 0.165 to a simplified fraction
Convert 0.085 to a simplified fraction
Convert 2.03 to a simplified fraction
0.1875
Convert 3.02 to a simplified fraction
3.64
Convert 1.495 to a simplified fraction
3.2
N
Y
P
S
R
TD
AL
U 2310
17200
33200
203100
15150
299200
O
Page 45
Page 47412. 5, 19413. 31, 37, 41, 43414. 2, 5, 13, 29, 47415. 53, 59416. 11, 23, 61, 67417. 71, 73, 79418. 3, 17, 83, 89419. 97, 101420. 103421. 131, 137, 139
422.
423.
424.
425.
426.
Page 47 cont...
2 x 3 x 5 x 7
12 8x
6 2 2xx 4
2 x 5 x 13
2x2
96
2x32 x 2 x 2 x 2 x 2 x 3
10 25x
5 2 5xx 5
250
2 x 5 x 5 x 5
6 7x
3 2x
42
2 x 3 x 7
427.
10 36x
5 2 6xx 6
2x3
360
2x32 x 2 x 2 x 3 x 3 x 5
10 13x
2 5x
130
10 21x
2 5 3xx 7
210
Why did the parrot wear a raincoat?so he could be polyunsaturated
©uLake LtduLake Ltd Innovative Publisher of Mathematics Texts

Workbook – Year 9 Mathematics and Statistics – Published by NuLake Ltd New Zealand © Robert Lakeland & Carl Nugent
362 Answers – Shape
Topic 4 Shape
Page 1621. ∠RTQ. Obtuse – greater than 90˚andlessthan180˚.2. ∠DGK.Rightangle–equalto 90˚.3. ∠JWS.Acute–between0˚ and90˚.4. ∠BAC.Straightangle–equal to180˚.5. ∠PAF.Reflex–greaterthan 180˚andlessthan360˚.6. ∠TMZ. Obtuse – greater than 90˚andlessthan180˚.Page 1647. ∠ABC=65˚8. ∠DEF=155˚9. ∠GHI=64˚10. ∠JKL=177˚11. ∠MNO=92˚12. ∠PQR=128˚13 ∠ABC=55˚14. ∠DEF=15˚Page 16515. ∠GHI=165˚16. ∠JKL=140˚17. ∠MNO=74˚18. ∠PQR=235˚19. ∠STU=92˚ ∠UTV=50˚20. ∠WXY=92˚ ∠YXZ=72˚21. ∠ABC=22˚ ∠ABD=100˚22. ∠HEF=121˚ ∠FEG=31˚Page 16723. a=142˚24. b=114˚25. c=42˚26. d=38˚27. e=12˚28. f=58˚29. g=18˚30. h=15˚Page 16831. i=134˚32. j=61˚33. k=108˚34. m=324˚
Page 168 cont...35. n=66˚36. p=72˚37. q=31˚38. r=97˚
Page 16939. s=127˚ t=53˚40. u=94˚ v=86˚41. w=157˚ x=23˚ y=23˚42. z=75˚ a=105˚ b=105˚43. c=74˚44. d=19˚ e=85˚45. f=37˚ g=143˚46. h=28˚ i=152˚ j=152˚
Page 17047. m=90˚ Adj.∠sonastr.line=180˚.48. n=52˚ Adj.∠sonastr.line=180˚. o=46˚ Adj.∠sonastr.line=180˚.49. p=120˚ ∠satapoint=360˚.50. q=18˚ Adj.∠sonastr.line=180˚.51. r=29˚ Vert.opposite∠sareequal. s=151˚ Adj.∠sonastr.line=180˚.52. t=27˚ Adj.∠sonastr.line=180˚. u=27˚ Vert.opposite∠sareequal.53. v=36˚ Vert.opposite∠sareequal. w=43˚ Vert.opposite∠sareequal. x=101˚ Adj.∠sonastr.line=180˚.
Page 17254. a=87˚55. b=28˚56. c=29˚ d=151˚57. e=103˚ f=147˚ g=77˚58. h=58˚ i=152˚ j=86˚ k=122˚59. m=63˚ n=63˚ p=117˚60. q=37˚ r=59˚ s=143˚61. t=39˚Page 17362. a=141˚63. b=117˚Page 17464. c=65˚65. d=29˚66. c=83˚ d=97˚67. e=66˚ f=126˚68. g=98˚ h=134˚69. i=89˚ j=146˚70. k=93˚ l=93˚71. m=56˚ n=37˚Page 17672. a=137˚ b=43˚73. c=64˚ d=116˚74. e=93˚ f=93˚75. g=39˚ h=141˚76. m=111˚ n=111˚ p=69˚
©uLake LtduLake Ltd Innovative Publisher of Mathematics Texts

389
Workbook – Year 9 Mathematics and Statistics – Published by NuLake Ltd New Zealand © Robert Lakeland & Carl Nugent
Answers – Practice Assessments
Assessment Schedule – Statistics and Probability – Pages 338 – 340Question No. Achievement Merit Excellence Justification Carry out statistical
graphing and calculations for
data and determine probabilities.
Carry out statistical processes
and determine probabilities
Solve theoretical
probability problems and comment on
significant features shown by
comparative graphs.1 (a) Bar graph with all boxes
filled in correctly.
10
20
30
40
50
Sales (%)Cellphone Sales 2009 by Manufacturer
Manufacturer
AppleRIMNokia HTC Motorola Others
A1Allow one minor
error.
1 (b) 1 801 800 A11 (c) (i) 87 texts A11 (c) (ii) 1891 ÷ 23 = 82.2
texts per dayM
Accept 82 or 83.Working required.
2 (a) 0.75 A22 (b) Prob. = 0.25 x 0.20
= 0.05Num. = 320 x 0.05
= 16 studentsA2/M
2 (c) Prob. = 0.75 x 0.90 = 0.675
A2
3 (a) No, spending more in 2009 than in 2003. In 2003 people were spending $900 per year, whereas in 2009 they were spending $1100.
ERequire correct conclusion plus
figures to back up conclusion.
3 (b) Less familiar with technology.
Less disposable income.
Less influenced by latest trends.
Over 65’s usually have a landline.
A2/MOne valid reason for A2, two valid
reasons for M.
Sufficiency 2 or 3 of A1 and 2 or 3 of A2
Achievement plus1M or 2M
Merit plusE
©uLake LtduLake Ltd Innovative Publisher of Mathematics Texts


