Early Bird Catches the Worm: Predicting Returns Even Before Purchase in Fashion E-commerce Sajan Kedia Myntra Designs, India [email protected]Manchit Madan Myntra Designs, India [email protected]Sumit Borar Google, India [email protected]* ABSTRACT With the rapid growth in fashion e-commerce and customer- friendly product return policies, the cost to handle returned products has become a significant challenge. E-tailers incur huge losses in terms of reverse logistics costs, liquidation cost due to damaged returns or fraudulent behavior. Accurate prediction of product returns prior to order placement can be critical for companies. It can facilitate e-tailers to take preemptive measures even before the order is placed, hence reducing overall returns. Furthermore, finding return prob- ability for millions of customers at the cart page in real-time can be difficult. To address this problem we propose a novel approach based on Deep Neural Network. Users’ taste & products’ latent hidden features were captured using product embeddings based on Bayesian Personalized Ranking (BPR). Another set of embeddings was used which captured users’ body shape and size by using skip-gram based model. The deep neural network incorporates these embeddings along with the engineered features to predict return probability. Using this return probability, several live experiments were con- ducted on one of the major fashion e-commerce platform in order to reduce overall returns (discussed in detail in Section 5). Keywords Return Prediction, Fashion E-Commerce, Deep Neural Net- work, Matrix Factorization, Bayesian Personalized Ranking, Skip-Gram 1. INTRODUCTION E-commerce sector is the fastest growing sector, with an ex- pectation to reach $4 trillion by 2020 1 . In today’s compet- itive market, to increase customer experience, most compa- nies are coming up with hassle-free return policies [1]. Cus- tomers are usually allowed a return within a month or a sim- ilar time period. This policy [2] has improved customer en- gagement, revenue, purchase rate, customer experience, and repeat buying behavior. However, with the promise of easy returns also comes the inevitable high return rate. Stud- * Work done while at Myntra 1 https://www.huffingtonpost.com/michael-lazar/ retailers-people-want-eas_b_12759542.html ies have shown that one-third online orders are returned 2 . Similar behavior has been observed on a major fashion e- commerce platform, with a major reason for returns being the size and fit. With high return rates comes the problem of huge reverse logistic cost. Since the return policy is lenient, customer re- turn the products after using or damaging [3] them to a point that does not meet the quality norms of re-selling the prod- uct [4]. Products won’t be live during the return period re- sulting in lost-sales. The last mile delivery chain is the most energy-intensive task which impacts the sustainability of e- commerce, both economically and ecologically [5]. Hence, returns impact many segments of fashion business such as customer experience, supply chain management, call center demand, inventory, and customer service. It eats a major share of the profit margin of e-tailers. Predominantly, the industry is trying to solve this problem post-order, i.e once the order is placed. Most of the existing literature [6] [7] [8] talks about forecasting returns to solve operational issues. Predicting customer return chances in advance during browsing or at shopping cart page will em- power e-tailers to prevent such orders. In this paper, we propose a novel deep neural network based approach to pre- dict customer’s likelihood of return even before an order is placed. To get users’ taste and products’ latent hidden features, Matrix Factorization(MF) based BPR [9] model is used to detect similar products in a cart. In fashion industry, most of the returns are due to size & fit issues 3 . To capture this in our model, we have created user’s sizing vector using skip-gram based model [10]. In our network, we have used both these vectors along with engineered features. A hybrid dual-model approach is proposed to first, predict the return probability at the cart level, and second, predict at an indi- vidual product level. Prediction happens in real-time at the cart page, so that preemptive actions can be taken based on the return probability value. The possible set of actions are: • Personalized Shipping charges • Make product non-returnable by giving an additional coupon • Try & Buy options • In case of return related refund, money goes directly 2 https://www.wsj.com/articles/ rampant-returns-plague-eretailers-1387752786 3 https://www.shopify.com/enterprise/ ecommerce-returns arXiv:1906.12128v1 [cs.LG] 28 Jun 2019
Transcript
Early Bird Catches the Worm: Predicting Returns EvenBefore Purchase in Fashion E-commerce
ABSTRACTWith the rapid growth in fashion e-commerce and customer-friendly product return policies, the cost to handle returnedproducts has become a significant challenge. E-tailers incurhuge losses in terms of reverse logistics costs, liquidation costdue to damaged returns or fraudulent behavior. Accurateprediction of product returns prior to order placement canbe critical for companies. It can facilitate e-tailers to takepreemptive measures even before the order is placed, hencereducing overall returns. Furthermore, finding return prob-ability for millions of customers at the cart page in real-timecan be difficult.
To address this problem we propose a novel approach basedon Deep Neural Network. Users’ taste & products’ latenthidden features were captured using product embeddingsbased on Bayesian Personalized Ranking (BPR). Anotherset of embeddings was used which captured users’ bodyshape and size by using skip-gram based model. The deepneural network incorporates these embeddings along withthe engineered features to predict return probability. Usingthis return probability, several live experiments were con-ducted on one of the major fashion e-commerce platform inorder to reduce overall returns (discussed in detail in Section5).
1. INTRODUCTIONE-commerce sector is the fastest growing sector, with an ex-pectation to reach $4 trillion by 20201. In today’s compet-itive market, to increase customer experience, most compa-nies are coming up with hassle-free return policies [1]. Cus-tomers are usually allowed a return within a month or a sim-ilar time period. This policy [2] has improved customer en-gagement, revenue, purchase rate, customer experience, andrepeat buying behavior. However, with the promise of easyreturns also comes the inevitable high return rate. Stud-
∗Work done while at Myntra1https://www.huffingtonpost.com/michael-lazar/retailers-people-want-eas_b_12759542.html
ies have shown that one-third online orders are returned2.Similar behavior has been observed on a major fashion e-commerce platform, with a major reason for returns beingthe size and fit.
With high return rates comes the problem of huge reverselogistic cost. Since the return policy is lenient, customer re-turn the products after using or damaging [3] them to a pointthat does not meet the quality norms of re-selling the prod-uct [4]. Products won’t be live during the return period re-sulting in lost-sales. The last mile delivery chain is the mostenergy-intensive task which impacts the sustainability of e-commerce, both economically and ecologically [5]. Hence,returns impact many segments of fashion business such ascustomer experience, supply chain management, call centerdemand, inventory, and customer service. It eats a majorshare of the profit margin of e-tailers.
Predominantly, the industry is trying to solve this problempost-order, i.e once the order is placed. Most of the existingliterature [6] [7] [8] talks about forecasting returns to solveoperational issues. Predicting customer return chances inadvance during browsing or at shopping cart page will em-power e-tailers to prevent such orders. In this paper, wepropose a novel deep neural network based approach to pre-dict customer’s likelihood of return even before an orderis placed. To get users’ taste and products’ latent hiddenfeatures, Matrix Factorization(MF) based BPR [9] model isused to detect similar products in a cart. In fashion industry,most of the returns are due to size & fit issues3. To capturethis in our model, we have created user’s sizing vector usingskip-gram based model [10]. In our network, we have usedboth these vectors along with engineered features. A hybriddual-model approach is proposed to first, predict the returnprobability at the cart level, and second, predict at an indi-vidual product level. Prediction happens in real-time at thecart page, so that preemptive actions can be taken based onthe return probability value. The possible set of actions are:
• Personalized Shipping charges
• Make product non-returnable by giving an additionalcoupon
• Try & Buy options
• In case of return related refund, money goes directly
to wallet which can only be used for shopping againon the same platform
• Restricting payment options like Cash on delivery
• Advance alert for reverse logistics
• Artificially show the product as out of stock & preventthe user from placing that order [11]
Most of these action items require the return prediction ata cart level whereas for rest it should be at an individualproduct level. The proposed hybrid dual-model serves boththe scenarios. As shown in Figure 1, the first two images onthe left side demonstrate the personalized delivery chargeexperiment. One has free delivery charge whereas other has149 as a delivery charge based on the return probability ofthat cart. In the middle image, all the products are similarwhich can be a reason for high return probability as com-pared to the leftmost image where all items are different.The rightmost image demonstrates the non-returnable ex-periment at the product level. For products having a higherprobability of return, an option of making it non-returnableis given to the customer by providing an additional coupon.This experiment helped in reducing returns & reverse logis-tics. Here, the model works at an individual product levelinstead of cart level.
The rest of the paper is organized as follows. In Section2, we briefly discuss the related work. We introduce theMethodology in Section 3, that comprises of feature creationand explanation of hybrid dual-model. In Section 4, Resultsand Analysis are discussed. Then we present Experimentresults in Section 5 and conclude the paper in Section 6.
Figure 1: First two images from the left demon-strate personalized delivery charges for the sameuser having different carts. The third image showsa non-returnable option by giving a small additionalcoupon for the product having high return proba-bility
2. RELATED WORKIn this section, we have briefly reviewed the existing lit-erature on return prediction. In [11] authors used Maha-lanobis Feature Extraction to predict product returns in e-commerce. Here a prediction can only be made once theuser has placed an order, due to which e-tailer can’t take
preventive measures to reduce the returns. Also, this is notdesigned for user-product level prediction. In [7], time-seriesmethods are used to forecast return volume. In [?], authorsare trying to predict returns using a weighted hybrid graphto represent the rich information in the product purchaseand return history. [6] talks about forecasting the returnquantity & time using the historical sales data which is usedto take inventory management decisions. Predicting accu-rately the number of returns won’t be helpful in adoptingpreemptive measures since the prediction is not done duringthe order placement. To address these issues we are propos-ing real-time return prediction at cart page even before thecustomer places the order. Our prediction being at a user-product level is personalized for all users- at different cart(basket) level.
3. METHODOLOGYGiven a user u and current cart C which can contain multipleproducts, our objective is to come up with return probabil-ity score denoted by f(u,C) for a user & cart combination.This probability score is used to implement the action itemsmentioned in Section 1 to reduce the overall returns. Anal-ysis showed that number of similar items in a cart impactsthis score. Hence, we computed:
g(Pi, Pj) representing similarity between product Pi and Pj
Since we don’t have any explicit ratings available for theproducts, the only way to find similarity is by using implicitsignals from user and product interaction graph. For this,we’ve used the Matrix Factorization [12] based Bayesian Per-sonalized Ranking (BPR) approach.
Another significant cause of returns in fashion industry isdue to size & fit issues [13]. It’s very difficult to solve thisproblem since most brands have a different fitting for thesame size number. To address this problem we have createdsizing vectors which are personalized at a user, brand levelbased on their historical data. Skip-gram based model isused to create sizing latent vectors. Finally, a deep neuralnetwork model is trained using these embeddings along withthe engineered features to compute f(u,C).
We propose a hybrid dual-model approach. First, a deepneural network model predicts f(u,C) for the whole cart.Second, gradient boosted techniques are used to predict thereturn probability at a product level.
Being one of the largest players in fashion e-commerce, thereare approximately 600K products live on our platform at anygiven time. Typically, 20% of the products lead to around80% of the revenue, hence it’s very difficult to get signalsfor most of the long-tail products. To solve this problem,product embeddings are created using Matrix Factorization(MF) approach [14].
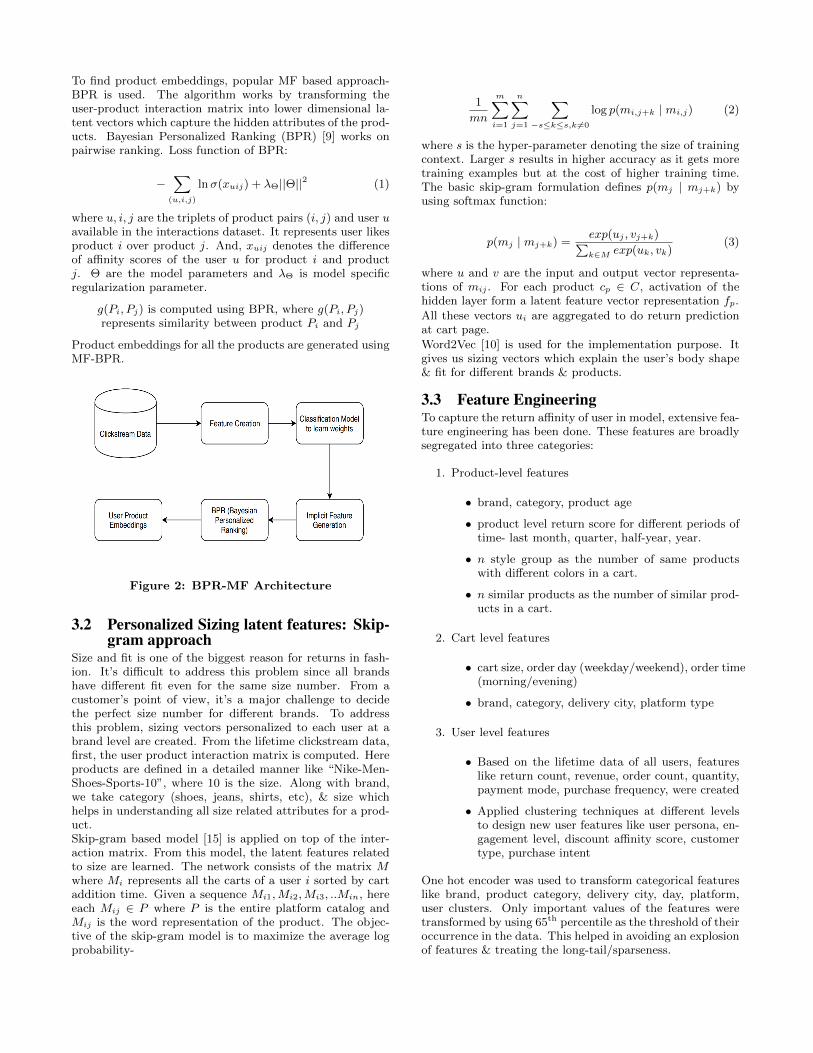
To apply MF, user-product interaction matrix is required.Due to the absence of explicit ratings of products, implicitsignals are generated using features like the number of views,clicks, cart, order from the user clickstream data. Implicitratings are calculated by the weighted sum of these signalswhich are learned by training a classifier. This gives user-product interaction matrix as shown in Figure 2.
To find product embeddings, popular MF based approach-BPR is used. The algorithm works by transforming theuser-product interaction matrix into lower dimensional la-tent vectors which capture the hidden attributes of the prod-ucts. Bayesian Personalized Ranking (BPR) [9] works onpairwise ranking. Loss function of BPR:
−∑
(u,i,j)
lnσ(xuij) + λΘ||Θ||2 (1)
where u, i, j are the triplets of product pairs (i, j) and user uavailable in the interactions dataset. It represents user likesproduct i over product j. And, xuij denotes the differenceof affinity scores of the user u for product i and productj. Θ are the model parameters and λΘ is model specificregularization parameter.
g(Pi, Pj) is computed using BPR, where g(Pi, Pj)represents similarity between product Pi and Pj
Product embeddings for all the products are generated usingMF-BPR.
Size and fit is one of the biggest reason for returns in fash-ion. It’s difficult to address this problem since all brandshave different fit even for the same size number. From acustomer’s point of view, it’s a major challenge to decidethe perfect size number for different brands. To addressthis problem, sizing vectors personalized to each user at abrand level are created. From the lifetime clickstream data,first, the user product interaction matrix is computed. Hereproducts are defined in a detailed manner like “Nike-Men-Shoes-Sports-10”, where 10 is the size. Along with brand,we take category (shoes, jeans, shirts, etc), & size whichhelps in understanding all size related attributes for a prod-uct.Skip-gram based model [15] is applied on top of the inter-action matrix. From this model, the latent features relatedto size are learned. The network consists of the matrix Mwhere Mi represents all the carts of a user i sorted by cartaddition time. Given a sequence Mi1,Mi2,Mi3, ..Min, hereeach Mij ∈ P where P is the entire platform catalog andMij is the word representation of the product. The objec-tive of the skip-gram model is to maximize the average logprobability-
1
mn
m∑i=1
n∑j=1
∑−s≤k≤s,k 6=0
log p(mi,j+k | mi,j) (2)
where s is the hyper-parameter denoting the size of trainingcontext. Larger s results in higher accuracy as it gets moretraining examples but at the cost of higher training time.The basic skip-gram formulation defines p(mj | mj+k) byusing softmax function:
p(mj | mj+k) =exp(uj , vj+k)∑k∈M exp(uk, vk)
(3)
where u and v are the input and output vector representa-tions of mij . For each product cp ∈ C, activation of thehidden layer form a latent feature vector representation fp.
All these vectors ui are aggregated to do return predictionat cart page.
Word2Vec [10] is used for the implementation purpose. Itgives us sizing vectors which explain the user’s body shape& fit for different brands & products.
3.3 Feature EngineeringTo capture the return affinity of user in model, extensive fea-ture engineering has been done. These features are broadlysegregated into three categories:
1. Product-level features
• brand, category, product age
• product level return score for different periods oftime- last month, quarter, half-year, year.
• n style group as the number of same productswith different colors in a cart.
• n similar products as the number of similar prod-ucts in a cart.
2. Cart level features
• cart size, order day (weekday/weekend), order time(morning/evening)
• brand, category, delivery city, platform type
3. User level features
• Based on the lifetime data of all users, featureslike return count, revenue, order count, quantity,payment mode, purchase frequency, were created
• Applied clustering techniques at different levelsto design new user features like user persona, en-gagement level, discount affinity score, customertype, purchase intent
One hot encoder was used to transform categorical featureslike brand, product category, delivery city, day, platform,user clusters. Only important values of the features weretransformed by using 65th percentile as the threshold of theiroccurrence in the data. This helped in avoiding an explosionof features & treating the long-tail/sparseness.
3.4 Hybrid Dual-ModelA dual-model approach is proposed to first, predict the re-turn probability at the cart level, and second, predict atan individual product level. Since millions of orders areplaced every week and these orders usually consist of multi-ple products, it becomes an onerous task to classify returnsaccurately at an individual product level. To overcome thisissue, a classifier is first trained at a higher level (cart) toclassify returnable carts. The second classifier is built on thecarts classified as returnable by the first classifier, which pre-dicts return probability at an individual product level. Thefirst classifier is a fully connected deep neural network model(discussed in the next section), and the second one is a gradi-ent boosted classifier. The set of optimal hyper-parameterswere number of trees: 250, max depth: 7, learning rate:0.005, metric: [auc, binary logloss], number of leaves: 150.
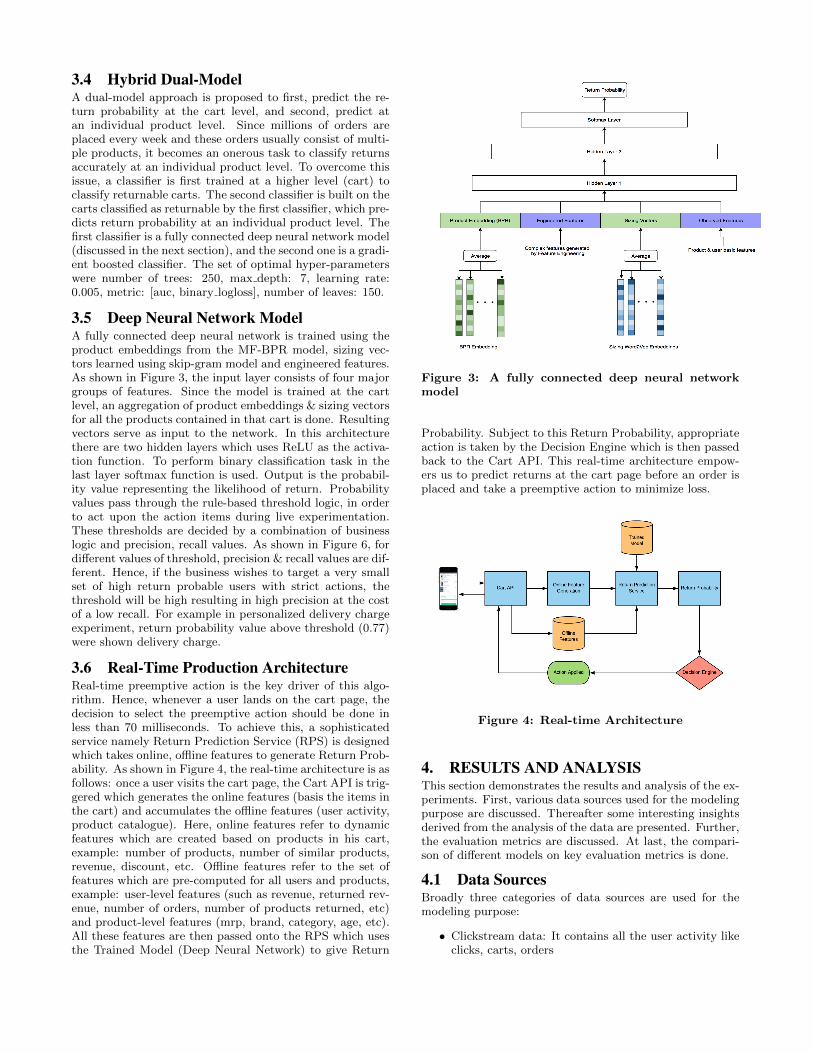
3.5 Deep Neural Network ModelA fully connected deep neural network is trained using theproduct embeddings from the MF-BPR model, sizing vec-tors learned using skip-gram model and engineered features.As shown in Figure 3, the input layer consists of four majorgroups of features. Since the model is trained at the cartlevel, an aggregation of product embeddings & sizing vectorsfor all the products contained in that cart is done. Resultingvectors serve as input to the network. In this architecturethere are two hidden layers which uses ReLU as the activa-tion function. To perform binary classification task in thelast layer softmax function is used. Output is the probabil-ity value representing the likelihood of return. Probabilityvalues pass through the rule-based threshold logic, in orderto act upon the action items during live experimentation.These thresholds are decided by a combination of businesslogic and precision, recall values. As shown in Figure 6, fordifferent values of threshold, precision & recall values are dif-ferent. Hence, if the business wishes to target a very smallset of high return probable users with strict actions, thethreshold will be high resulting in high precision at the costof a low recall. For example in personalized delivery chargeexperiment, return probability value above threshold (0.77)were shown delivery charge.
3.6 Real-Time Production ArchitectureReal-time preemptive action is the key driver of this algo-rithm. Hence, whenever a user lands on the cart page, thedecision to select the preemptive action should be done inless than 70 milliseconds. To achieve this, a sophisticatedservice namely Return Prediction Service (RPS) is designedwhich takes online, offline features to generate Return Prob-ability. As shown in Figure 4, the real-time architecture is asfollows: once a user visits the cart page, the Cart API is trig-gered which generates the online features (basis the items inthe cart) and accumulates the offline features (user activity,product catalogue). Here, online features refer to dynamicfeatures which are created based on products in his cart,example: number of products, number of similar products,revenue, discount, etc. Offline features refer to the set offeatures which are pre-computed for all users and products,example: user-level features (such as revenue, returned rev-enue, number of orders, number of products returned, etc)and product-level features (mrp, brand, category, age, etc).All these features are then passed onto the RPS which usesthe Trained Model (Deep Neural Network) to give Return
Figure 3: A fully connected deep neural networkmodel
Probability. Subject to this Return Probability, appropriateaction is taken by the Decision Engine which is then passedback to the Cart API. This real-time architecture empow-ers us to predict returns at the cart page before an order isplaced and take a preemptive action to minimize loss.
Figure 4: Real-time Architecture
4. RESULTS AND ANALYSISThis section demonstrates the results and analysis of the ex-periments. First, various data sources used for the modelingpurpose are discussed. Thereafter some interesting insightsderived from the analysis of the data are presented. Further,the evaluation metrics are discussed. At last, the compari-son of different models on key evaluation metrics is done.
4.1 Data SourcesBroadly three categories of data sources are used for themodeling purpose:
• Clickstream data: It contains all the user activity likeclicks, carts, orders
• Product Catalogue: Millions of products are catalogedwith attributes and details such as color, brand, gen-der, category, product age, etc
• Cart data: This contains all the historical carts/baskettransactions data
4.2 AnalysisThe analysis shows that out of all the returns 4% occur whenthere are some similar products present in the cart. Similarproduct not necessarily means the same product in differentsize, color; it can be a similar pattern based on the product’svisual attributes. As shown in Figure 1, in the middle imageall three t-shirts have similar visual attributes like pockets,design, pattern etc.
Figure 5: Reasons for Return
An order having the same product with different colors ac-counted for 2% of the total returned orders. Next analysiscaptures reasons for returns in online fashion. When a cus-tomer returns a product, the reason for return is asked. Fig-ure 5 shows all the major reasons for a return. 53% of totalreturns were due to size and fit related issues. This analysiswas a major motivation behind creating personalized sizingvectors.
Return rates are highly dependent on the cart size, withcart size more than five products return rates goes to 72%,whereas cart with one product has return chances of 9%.Return behavior change with the day of the week (week-day, week- end), time (morning, evening). Aged inventoryhad an almost double probability of being returned as com-pared to newer ones. Historical data showed that the returnrate was higher than the platform average for some set ofproducts. These products were 0.16% of the live catalogand contributed approx 1.9% returns. The search rankingof these products was de-boosted. Further, some of thesewere de-listed from the platform to reduce overall returns.
4.3 Evaluation MetricsAs this is a classic binary classification problem, standardevaluation metrics are used, namely Precision, Recall, Areaunder the curve (AUC), Receiver operating characteristic(ROC) curve. Apart from this, during the model deploy-ment in real time, we have used the Precision-Recall curveextensively. As shown in Figure 6, Precision-Recall values
Model AUC Precision RecallBaseline 71.6 65 18Higher Level Aggregates 80.1 69 32BPR based Embedding 81.9 69 34Word2Vec based Sizing Vector 81.9 71 34Fully Connected Network 83.2 74 34
Table 1: Model Results
change for different values of threshold. This threshold isdecided based on the business logic.
Figure 6: Precision Recall value at different thresh-old
If the business wishes to target very high return probableproducts by providing an additional coupon & making itnon-returnable, the threshold value will be high resultingin high precision and low recall. This threshold value maydiffer for different experiments. Based on the value of thereturn probability, we have created segments such as High,Medium, Low representing users’ return affinity. Experi-ments were performed segment-wise, resulting in entirelydifferent A/B tests. For Model performance comparisonAUC, precision and recall were used as shown in table 1.Figure 7 depicts the performance of all the models in termsof ROC curve.
Figure 7: Comparison of Model performance usingROC, which clearly show that Deep neural networkbased model as a winner
4.4 ResultsIn this section, the results of different models are discussedin a detailed manner (table 1). A baseline gradient boostedclassifier created using basic user and product observablefeatures resulted in 71.6% AUC. To improve this baselinemodel, extensive feature engineering was performed whichboosted AUC by 8%. Another 1.8% increment in AUC wasachieved by using the product embeddings learned usingBPR. To further improve the precision, personalized sizingvectors at the user, brand level were used resulting in a 2%increment in precision. These sizing vectors were learnedusing the skip-gram word2vec model. Further improvementin the AUC was difficult to achieve using the boosted clas-sifier. Hence, a fully connected deep neural network modelwas trained using aggregated embeddings of product & siz-ing along with engineered features as the input layer. Thismodel out-performed all previous models with AUC, preci-sion increased to 83.2%, 74% respectively. Figure 7 depictsthe comparison between the ROC curves of all the mod-els, with the deep neural network achieving the highest areaunder the curve.
Some of the most important features turned out to be theproduct return score (product’s lifetime return rate), cartsize, payment type, user’s lifetime returned quantity, sizingvectors, user’s purchase frequency, product price, productembeddings. The first few features were discussed in Section4.2. Apparently, these features turned out to be importantfrom the model’s perspective too.
5. EXPERIMENTSIn this section, the live experiments performed on one of theleading fashion platform are discussed. Experiments wereconducted on three action items from the suggested ones inSection 1. First experiment comprised of applying person-alized delivery charge which was different for all customersdepending on their respective live cart. The dual model firstpredicts the return probability for a cart and then use thisin a gradient boosted approach to identify the exact numberof products that will be returned from that cart. Combiningthis result along with the business logic gives the final valueof personalized delivery charge which varies from 0 to 149.An A/B test was performed on a live production environ-ment for nearly 100K users. The conclusion derived fromthis experiment was that even though the number of ordersreduced by 1.7% in the test set as compared to the controlset, the return percentage dropped even by a higher number(3%). Further analysis indicated that 90% of churned usershad a high probability of return.
The second experiment was to make product non-returnableby providing an additional coupon. The product-level modelgave the return probability of each individual product in thecart. If this probability is high, we offer a small nudge ofadditional coupon and make that product non-returnable.This compensates for the reverse logistics or possible damagecosts. The result from A/B test showed that 27% of theusers applied this option in the cart and marked 1.5 products(on an average) in their cart as non-returnable. This reducedthe return rate in the test set by 4% as compared to thecontrol set.
Third, Try & Buy experiment was conducted where theusers can try out their purchases at the time of delivery,keep what they like and return the rest on-the-spot. The
hypothesis behind conducting this experiment was that itwill reduce the reverse-logistics cost incurred during a re-turn. Adoption of try & buy feature was 40% which reducedthe return rate in the test set by 3.7% as compared to thecontrol set.
6. CONCLUSIONE-tailers experience return-rate problem leading to increasedcosts and lower profit margins. To solve this, a novel ap-proach is proposed in this paper to detect returns and imple-ment certain actions items. Depending on the current cartconfiguration of a user, a hybrid dual-model is built usinga deep neural network to detect returnable carts, productsin real-time. Experiment results on action items show thataccurate prediction of returns can lead to a reduction in therate of return. As future work, we plan to apply this modelon more action items which can further help in reducing theoverall returns.
7. REFERENCES
[1] C. Bonifield, C. Cole, and R. L. Schultz, “Product re-turns on the internet: A case of mixed signals?” Jour-nal of Business Research, vol. 63, no. 9-10, pp. 1058–1065, 2010.
[2] S. Bandyopadhyay and A. Paul, “Equilibrium returnspolicies in the presence of supplier competition,” Mar-keting Science, vol. 29, pp. 846–857, 09 2010.
[3] L. C. Harris, “Fraudulent consumer returns: exploitingretailers’ return policies,” European Journal of Market-ing, vol. 44, no. 6, pp. 730–747, 2010. [Online]. Avail-able: https://doi.org/10.1108/03090561011032694
[4] J. Chen and P. C. Bell, “The impact of customer returnson pricing and order decisions,” European Journal ofOperational Research, vol. 195, pp. 280–295, 2009.
[5] J. B. Edwards, A. C. McKinnon, and S. L.Cullinane, “Comparative analysis of the carbonfootprints of conventional and online retailing: Alast mile perspective,” International Journal ofPhysical Distribution & Logistics Management, vol. 40,no. 1/2, pp. 103–123, 2010. [Online]. Available:https://doi.org/10.1108/09600031011018055
[6] J. Ma and H. M. Kim, “Predictive model selectionfor forecasting product returns,” Journal of MechanicalDesign, vol. 138, no. 5, p. 054501, 2016.
[7] B. Toktay, Forecasting product returns. INSEAD, 2001.
[8] A. Canda, X. Yuan, and F. Wang, “Modeling and fore-casting product returns: An industry case study,” in2015 IEEE International Conference on Industrial En-gineering and Engineering Management (IEEM), Dec2015, pp. 871–875.
[9] S. Rendle, C. Freudenthaler, Z. Gantner, andL. Schmidt-Thieme, “Bpr: Bayesian personalized rank-ing from implicit feedback,” in Proceedings of thetwenty-fifth conference on uncertainty in artificial in-telligence. AUAI Press, 2009, pp. 452–461.
[10] T. Mikolov, K. Chen, G. Corrado, and J. Dean,“Efficient estimation of word representations in vectorspace,” CoRR, vol. abs/1301.3781, 2013. [Online].Available: http://arxiv.org/abs/1301.3781
[11] P. Urbanke, J. Kranz, and L. Kolbe, “Predicting prod-uct returns in e-commerce: The contribution of maha-lanobis feature extraction,” in ICIS, 2015.
[12] A. Mnih and R. R. Salakhutdinov, “Probabilistic ma-trix factorization,” in Advances in neural informationprocessing systems, 2008, pp. 1257–1264.
[13] S. Arora and D. Warrier, “Decoding fashion contextsusing word embeddings.”
[14] P. O. Hoyer, “Non-negative matrix factorization withsparseness constraints,” Journal of machine learningresearch, vol. 5, no. Nov, pp. 1457–1469, 2004.
[15] T. Mikolov, I. Sutskever, K. Chen, G. S. Corrado,and J. Dean, “Distributed representations of words and
phrases and their compositionality,” in NIPS, 2013.