Early Detection of Fragile X Syndrome: Applications of aNovel Approach for Improved Quantitative Methylation
Analysis in Venous Blood and Newborn Blood SpotsYoshimi Inaba,1 Charles E. Schwartz,2 Quang M. Bui,3 Xin Li,1 Cindy Skinner,2 Michael Field,4
Tiffany Wotton,5 Randi J. Hagerman,6,7 David Francis,1 David J. Amor,1,8 John L. Hopper,3
Danuta Z. Loesch,9 Lesley Bretherton,8,10,11 Howard R. Slater,1,8 and David E. Godler1*
BACKGROUND: Standard fragile X syndrome (FXS) diag-nostic tests that target methylation of the fragile Xmental retardation 1 (FMR1) CpG island 5� of the CGGexpansion can be used to predict severity of the diseasein males from birth, but not in females.
METHODS: We describe methylation specific–quantitativemelt analysis (MS-QMA) that targets 10 CpG sites,with 9 within FMR1 intron 1, to screen for FXS frombirth in both sexes. The novel method combines thequalitative strengths of high-resolution melt and thehigh-throughput, quantitative real-time PCR standardcurve to provide accurate quantification of DNA meth-ylation in a single assay. Its performance was assessed in312 control (CGG �40), 143 premutation (PM) (CGG56 –170), 197 full mutation (FM) (CGG 200 –2000),and 33 CGG size and methylation mosaic samples.
RESULTS: In male and female newborn blood spots, MS-QMA differentiated FM from control alleles, with sen-sitivity, specificity, and positive and negative predictivevalues between 92% and 100%. In venous blood of FMfemales between 6 and 35 years of age, MS-QMA cor-related most strongly with verbal IQ impairment (P �0.002). In the larger cohort of males and females, MS-QMA correlated with reference methods Southern blotand MALDI-TOF mass spectrometry (P � 0.05), butwas not significantly correlated with age. Unmethyl-
ated alleles in high-functioning FM and PM males de-termined by both reference methods were also un-methylated by MS-QMA.
Fragile X syndrome (FXS)12 is a severe neurodevelop-mental disorder which is complex and heterogeneousin both clinical phenotype and epigenotype. FXS is oneof the major inherited conditions comorbid with autis-tic behaviors, with an incidence of approximately 1 in4000 in the general population [reviewed in Hagermanet al. (1 )]. The trinucleotide expansion of the CGGrepetitive sequence in the fragile X mental retardation 1(FMR1) gene of more than 200 repeats is termed fullmutation (FM), and is usually associated with the “shutdown” of the gene expression due to methylation of itspromoter and loss of its protein product (FMRP),which is essential for normal neurodevelopment (2–5 ).The more common small expansions, which aretermed grey zone (GZ) alleles (44 –54 CGG repeats in 1in approximately 30 individuals) and permutation(PM) alleles (55–199 CGG repeats in 1 in approxi-
1 Cyto-molecular Diagnostic Research Laboratory, Victorian Clinical Genetics Servicesand Murdoch Childrens Research Institute, Royal Children’s Hospital, Melbourne,Victoria, Australia; 2 Center for Molecular Studies, J.C. Self Research Institute ofHuman Genetics, Greenwood Genetic Center, Greenwood, SC; 3 Centre for Molec-ular, Environmental, Genetic and Analytic Epidemiology, University of Melbourne,Carlton, Victoria, Australia; 4 Genetics of Learning Disability Service, New SouthWales, Australia; 5 New South Wales Newborn Screening Program, Children’sHospital at Westmead, Sydney, New South Wales, Australia; 6 The MIND Institute,University of California, Davis Medical Center, Sacramento, CA; 7 Department ofPediatrics, University of California, Davis School of Medicine, Sacramento, CA;8 Department of Paediatrics, University of Melbourne, Melbourne Victoria, Australia;9 School of Psychological Science, La Trobe University, Melbourne, Victoria, Austra-lia.; 10 Melbourne School of Psychological Sciences, University of Melbourne; Mel-bourne Victoria, Australia; 11 Department of Clinical Psychology, The Royal Chil-dren’s Hospital, Melbourne; Victoria, Australia.
* Address correspondence to this author at: Cyto-molecular Diagnostic ResearchLaboratory, Victorian Clinical Genetics Services and Murdoch Childrens Re-
search Institute, Royal Children’s Hospital, Melbourne, Victoria, 3052, Australia.Fax �613-9348-1391; e-mail [email protected].
mutation; PM, permutation; MS, mass spectrometry; FREE1, fragile X–relatedepigenetic elements 1; MS-QMA, methylation specific-quantitative melt anal-ysis; UFM, unmethylated FM; FSIQ, full scale intelligence quotient; HRM,high-resolution melt; NBS, newborn blood spots; AFU, aligned fluorescenceunits; MR, methylation ratio; VIQ, verbal IQ; PIQ, performance IQ; ASD, autismspectrum disorder; AUC, area under the ROC curve; WAIS, Wechsler AdultIntelligence Scale.
Clinical Chemistry 60:7963–973 (2014)
Molecular Diagnostics and Genetics
963
mately 300 individuals) (6 – 8 ), have been primarily as-sociated with the late-onset conditions (9 –11 ).
Although real-time PCR-based methylation test-ing for FXS is available (12 ) and is specific for FXSmales carrying the FM with a methylated FMR1 CpGisland located 5� of the expansion, there is currently noreal-time PCR– based test that can be used to predictspecific cognitive and behavioral impairments in fe-male carriers with expanded FMR1 alleles. Using theMALDI-TOF mass spectrometry (MS)– based Epi-TYPER system, we have identified novel epigeneticmarkers for FXS, fragile X–related epigenetic elements1 (FREE1) and 2 (FREE2), that are inversely correlatedwith FMRP expression in males and females with ex-panded FMR1 alleles (13, 14 ). Using the MALDI-TOFMS EpiTYPER system, we have shown that methyl-ation analysis of the CpG sites located within FMR1intron 1 of FREE2 (positioned 3� of the expansion) issuperior to methylation-sensitive Southern blot (usedin current FXS diagnostics) and FMRP immunostain-ing in blood as a predictor of cognitive impairment andis related to X-inactivation skewing in FM females(15, 16, 17 ). To make FREE2 methylation analysis ac-cessible for use in most diagnostic laboratories, we havedeveloped a new real-time PCR– based method namedmethylation-specific– quantitative melt analysis (MS-QMA), which targets methylation of the same intronicsites. We then performed a large-scale validation of themethod in previously clinically described cohorts(15, 17–19 ) and compared its performance attributesto those of the reference methods.
Methods
PARTICIPANTS AND CLINICAL ASSESSMENTS
The patient cohort comprised 258 male and 427 femalesamples from individuals from birth to 82 years of agecollected as part of previous studies (15, 17–19 ). Ofthese, formal cognitive assessments were performed onsamples from 23 PM females, 21 FM females, and 3high-functioning unmethylated FM (UFM) males[with full scale IQ (FSIQ) between 71 and 81] deter-mined using the Wechsler intelligence test appropriatefor chronological age as described in our previous pub-lications (15, 18, 20 ). The study was approved by theRoyal Children’s Hospital and Southern Health andthe Institutional Review Board of the University of Cal-ifornia at Davis.
MOLECULAR STUDIES
The MS-QMA protocol was based on a combined real-time PCR standard curve method and high-resolutionmelt (HRM) analysis performed on bisulfite convertedDNA as described in Fig. 1. The input was either one3-mm dried blood spot or DNA extracted from 0.3–1 mL
of venous blood, with DNA or blood spot lysate ex-tracted and CGG repeat sized as previously described(17, 21–24 ). For 19 FM females, the FMR1 activationratio has been previously determined using methyl-ation sensitive Southern blot as described in (25 ).FMRP immunoreactivity in venous blood smears waspreviously assessed in 18 of these FM females and wasexpressed as the percentage of lymphocytes stainingpositive for the protein (26, 27 ). FREE2 methylationwas also assessed in the same samples using the Seque-nom EpiTYPER system, as previously described (13 ).
MS-QMA OF FREE2 SEQUENCE
Real-time PCR standard curve method and HRM anal-ysis. For newborn blood spots (NBS), 1 or 2 3-mmpunches from each spot disk were processed as previ-ously described (17 ). The 96 bisulfite-converted sam-ples (with 3 controls and 93 unknown samples perplate) were serially diluted 4 times postconversion (Fig.1A). The four 96-well plates were then transferred intoa 384-well format for real-time PCR analysis utilizingMeltDoctor™ HRM reagents in 10-�L reactions permanufacturer instructions (Life Technologies). Forreal-time PCR, we used a unique primer set that targetsspecific CpG sites within the FREE2 region that werepreviously shown to be most significantly associatedwith cognitive impairment in FM females (15 ). Theannealing temperature for the thermal cycling protocolwas 65 °C for 40 cycles. The ViiA™ 7 Real-Time PCRSystem (Life Technologies) was used to initially mea-sure the rate of dye incorporation into double-strandedDNA to quantify the DNA concentrations of the un-known samples using the relative standard curvemethod (Fig. 1B). The dynamic linear range (usuallybetween 0.05 and 10 ng/�L) was determined from thestandard curve using a series of doubling dilutions of aconverted DNA standard from a control lymphoblastcell line during each run. To progress to the next stageof the analysis, the unknown samples had to be withinthis dynamic linear range (Fig. 1, wells on the 384 platein pink). The HRM step followed the real-time PCRwithout additional sample handling/ sample transfer.In the temperature range of 74 and 82 °C the productsfrom the methylated FREE2 sequence separated intosingle strands at higher temperatures than those fromunmethylated FREE2. The HRM software module forthe ViiA 7 system was then used to plot the rate of PCRproduct separation to single strands at different tem-peratures with the difference in fluorescence first con-verted to aligned fluorescence units (AFU) at the tem-perature that provided the greatest separation betweenmethylated and unmethylated sequences, and thenconverted to the methylation ratio (MR) from themethylation curve, as described in Fig. 1.
964 Clinical Chemistry 60:7 (2014)
DATA ANALYSIS
Testing for normality of the distribution of the MR wasconducted using the Shapiro–Wilk test at significancelevel P � 0.05. Depending on results of this test, for theintergroup comparisons the following tests were used:2-sample t-tests, if the data were normally distributed,or nonparametric Mann–Whitney tests, if the data
were not normally distributed. We also classified indi-viduals with FSIQ, verbal IQ (VIQ), and performanceIQ (PIQ) values of 70 and above (referred to as �70) asnegative and those with FSIQ, VIQ, and PIQ valuesbelow 70 (referred to as �70) as positive. For males weclassified individuals with FM alleles recruited throughthe developmental delay/autism spectrum disorder
Fig. 1. Overview of MS-QMA of FREE2.
The protocol is based on a single bisulfite converted DNA plate (1 conversion per sample) (A), being, serially diluted 4 times(B), with these dilutions analyzed using the real-time PCR (RT-PCR) standard curve method (C) and HRM analysis usingFREE2-specific primers for dried blood spot (DS) DNA PCR products (D). This system utilizes a custom-designed computeralgorithm to simultaneously perform steps (E), (F), and (G), which determines DNA concentrations and quality postconversionfor all dilutions from the unknown samples from the RT-PCR standard curve (pink diamonds). The unknown sample dilutions(blue star in the graphs in sections E and F) within the concentration and QC ranges (depicted by pink diamonds) areautomatically plotted against the HRM methylation standard curve (section G, right). The sample dilutions outside the QC range(depicted by yellow diamonds in the graph in section F) are not utilized in HRM analysis, and are discarded. (G), The HRMmethylation standard curve is also automatically obtained from 100% methylated and completely unmethylated control samplesspiked at different ratios. The AFU measure for the methylation standard curve and unknowns is analyzed at the melting temperaturefor which there is the greatest difference in fluorescence between 100% methylated and completely unmethylated controls, whichcorresponds to the lowest temperature point for which all double-stranded DNA (DS DNA) from the unmethylated strands hascompletely melted. AFU measurements for the unknowns are then converted to MR from the HRM standard curve (G).
Detection of Fragile X Syndrome using MS-QMA
Clinical Chemistry 60:7 (2014) 965
(ASD) referrals for FXS testing as positive, and all othermale samples as negative. ROC curve analysis was usedto evaluate the ability of MS-QMA MR to classify thepositive and negative classes. Area under the ROCcurve (AUC) computed using predicted probabilitiesfrom logistic regression was used as the summary mea-sure of diagnostic accuracy, and the Youden Index (28 )was used to determine the optimal threshold (cutoffpoint) for MS-QMA analysis.
The relationships between MS-QMA MR and eachoutcome variable, including cognitive scores and othermolecular measures, were assessed using simple linearregression analysis. All analyses were conducted usingRMS, DiagnosisMed, and the publicly available R sta-tistical computing package (15, 29 ).
Results
DEVELOPMENT AND TECHNICAL VALIDATION OF THE FREE2
MS-QMA ASSAY
To assess the intrarun variation and the ability of theassay to predict the expected MR, we performed 16different spiking experiments (see Fig. 1 in the DataSupplement that accompanies the online version ofthis report at http://www.clinchem.org/content/vol60/issue7). We identified 78 °C as the lowest temperatureat which all unmethylated alleles are completelymelted, at which point no further fluorescence is emit-ted. At this temperature, the 100% methylated allelesare actively melting and emitting fluorescence. Wefound that the most reliable method with the lowestinter- and intrarun variation (2 SDs) and the lowestdetection limit (limit of detection of 0.02 MR) used theAFU from the aligned fluorescence curves at 78 °C.This produced a correlation coefficient of 0.998 for theHRM standard curve, representing the relationship be-tween AFU at 78 °C and the expected MR in the spikedsamples.
SENSITIVITY AND SPECIFICITY OF MS-QMA ANALYSIS OF VENOUS
BLOOD DNA AND CORRELATION OF COGNITIVE IMPAIRMENT IN
FEMALES WITH FMR1 EXPANSIONS AND IN FM MALES
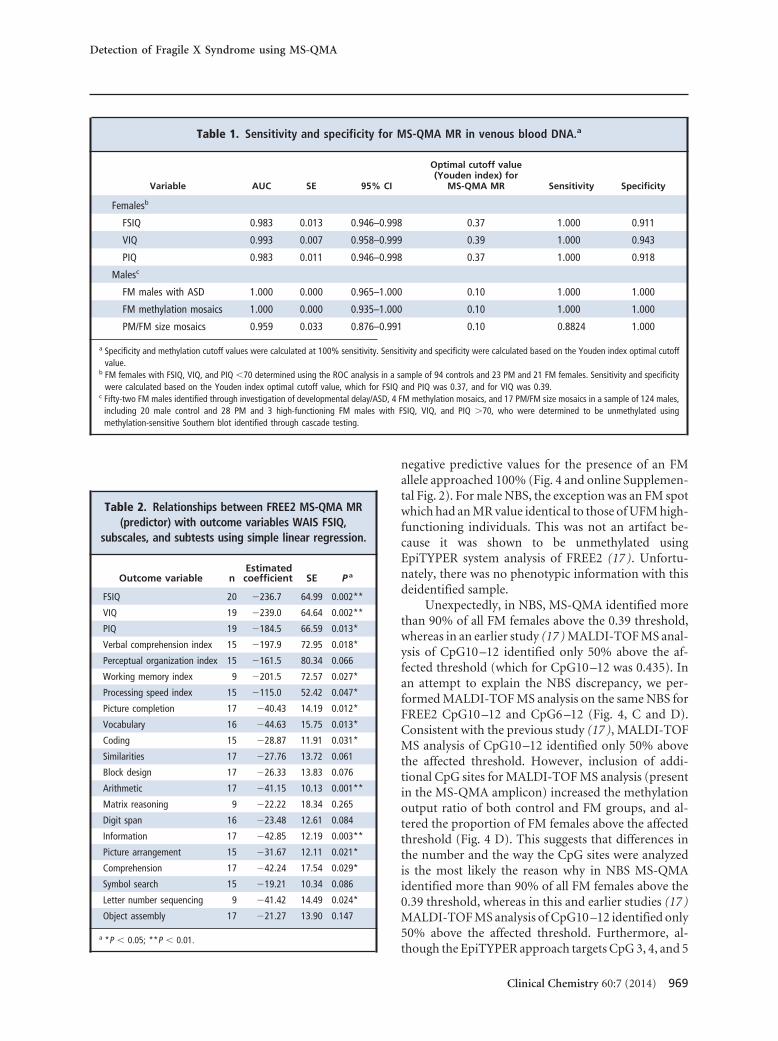
We performed MS-QMA analysis in 138 females (Fig.2) previously examined for the relationship betweenFREE2 methylation and cognitive impairment using theMALDI-TOF MS– based EpiTYPER system (15) (Fig. 2and online Supplemental Table 1) and 288 females (Fig.3), the majority of whom had no formal cognitive assess-ment performed (Fig. 3). We found that assay sensitivityand specificity for FM females with IQ �70 in the sub-group of 138 participants varied depending on the type ofIQ measure used. The optimal threshold of 0.39 MR thatprovided sensitivity of approximately 95% and specificityof 100% was for detection of FM females with VIQ �70(Table 1A). The threshold of 0.37 MR provided the high-
est sensitivity and specificity, of approximately 92% and100%, respectively, for both the FSIQ and PIQ assess-ments in FM females.
Notably, there was also some overlap betweencontrols and PM and low-functioning FM females atthe lower threshold of 0.37 for FSIQ and PIQ (Fig. 2),suggesting that the VIQ threshold of 0.39 should beused instead. At 0.39 MR there were no female controls(CGG �40) with MR values above this threshold.When applied to a group of 288 females (Fig. 3), ap-proximately 50% of all FM females had an MR above0.39 MR. In contrast, only 1 PM female had an MRabove the 0.39 threshold, and only 2 PM females had anMR of 0.39. This equates to 0% of controls and approx-imately 3% of PM females at or slightly above the VIQ�70 threshold. These 3% of PM females and 19% ofFM females had MS-QMA output within a borderlinerange of 0.39 – 0.41 MR (Fig. 2 and 3), suggesting thatCGG sizing should be used on all samples in this rangeto resolve any potential overlap between allele classes.
It is also important to note that in this borderlinerange (0.39 – 0.41 MR) there was overlap between VIQ�70 and �70 for a proportion of FM females. How-ever, for all PM and FM samples above and below thisborderline range, MS-QMA VIQ �70 sensitivity, spec-ificity, and positive and negative predictive values were100% (Fig. 2 and online Supplemental Fig. 2). Each FMfemale within the borderline range (0.39 – 0.41 MR)had 86% probability for VIQ �70 (high functioning).Furthermore, all PM females within this range had100% probability for VIQ �70, suggesting that in rela-tion to verbal cognitive impairment, the MS-QMA re-sults should be reported as risk or probability depend-ing on where the MR values fall.
Intergroup comparison of MS-QMA in venousblood DNA from 124 males showed that the medianMR was significantly higher for FM males (identifiedthrough investigation of developmental delay/ASD),FM methylation mosaics, and PM/FM size mosaicsthan for male controls, PM males, and high-functioning UFM males with FSIQ, VIQ, and PIQ of�70 (Fig. 3). A threshold of 0.1 MR provided sensitiv-ity and specificity approaching 100% for FM males andFM methylation mosaics, whereas for PM/FM size mo-saics the sensitivity was 88% and specificity was 100%at this threshold (Table 1).
CORRELATION OF FREE2 MS-QMA ANALYSIS WITH COGNITIVE
SCORES AND OTHER MOLECULAR MEASURES
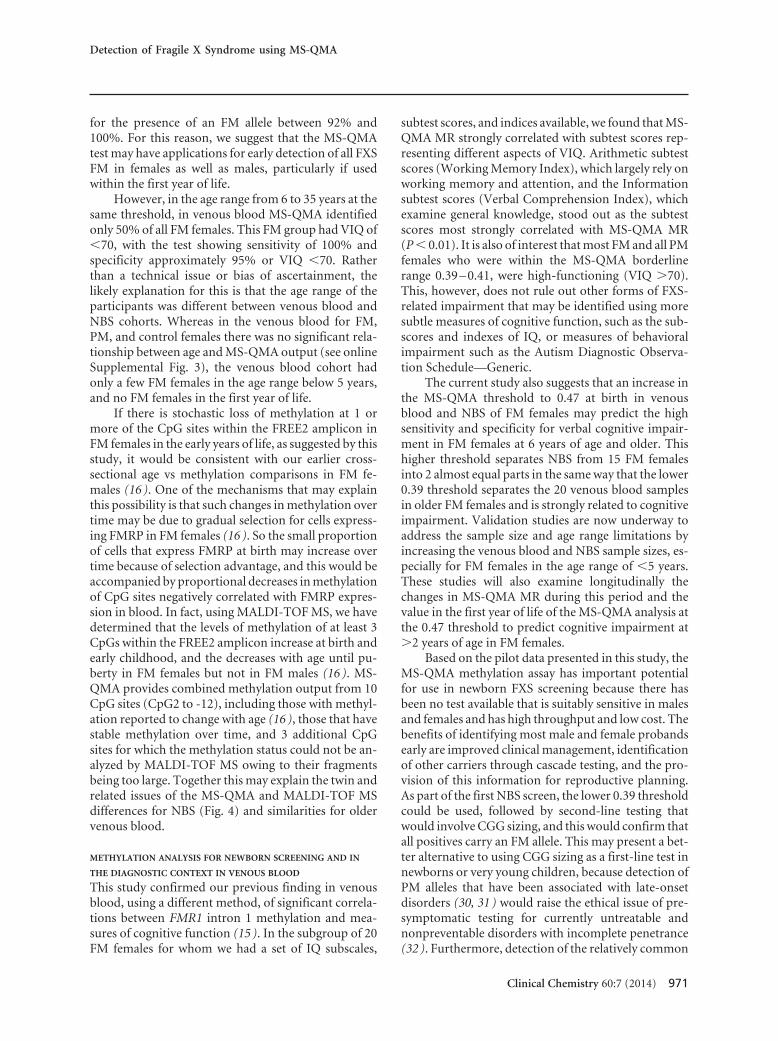
The level of FREE2 methylation in venous blood DNAdetermined using MS-QMA correlated significantlywith the Wechsler Adult Intelligence Scale (WAIS)(30 ) FSIQ, VIQ and PIQ, and most WAIS subtestscores (Table 2). The epigenotype–phenotype correla-tions were most evident for the relationships of MS-
Fig. 2. Comparison between groups of FREE2 MS-QMA MR in venous blood based on Wechsler IQ scores and CGGexpansion size in 138 females.
(A), The median MS-QMA MR was significantly increased in FM females with scores �70 for FSIQ compared to FM females withscores �70, PM females and controls. This was also the case for VIQ (B), PIQ (C). The broken line represents the optimalthreshold value (cutoff point) for each IQ measure determined using AUC and Youden Index as summary measures of diagnosticaccuracy described in Table 1.The red broken line represents threshold determined to provide optimal separation for FM femalesbased on VIQ of 70. The purple broken line represents the upper limit of the borderline range where for VIQ there is overlapbetween FM females with VIQ � and �70. The blue broken line represents threshold determined to provide optimal separationfor FM females based on FSIQ and PIQ of 70, and is equivalent to the maximum value of the female control sample. Note: FMIQ �70 compared to controls: ***P � 0.001; **P � 0.01; *P � 0.05; FM IQ �70 compared to PM IQ �70: ���P � 0.001;��P � 0.01; �P � 0.05; and FM IQ �70 compared to FM IQ �70: ###P � 0.001; ##P � 0.01; #P � 0.05.
Detection of Fragile X Syndrome using MS-QMA
Clinical Chemistry 60:7 (2014) 967
QMA MR with VIQ, and the Arithmetic and Informa-tion subtests (P � 0.01). However, in PM females thesesubscale and subtest scores did not show significantcorrelations. In these samples, MS-QMA MR was alsosignificantly correlated with FREE2 CpG sites exam-ined using the EpiTYPER system (see online Supple-mental Table 3), with P � 0.0001 for all of these sites.Of the other molecular parameters available throughour previous studies for these samples (13, 14 ), FREE2MS-QMA also showed a significant correlation (P �0.018) with the FMR1 activation ratio determined us-
ing methylation-sensitive Southern blot, which repre-sents the methylation status of the FMR1 CpG island 5�of the expansion on normal-size alleles in these fe-males. Correlation with FMRP levels was of borderlinesignificance (P � 0.058), with no significant correla-tion observed with CGG size in the FM range of thesefemales (see online Supplemental Table 2).
MS-QMA DETECTION OF FXS ALLELES IN NBS
In NBS at the threshold of 0.1 for males and 0.39 forfemales, the sensitivity, specificity, and positive and
Fig. 3. Distribution of MS-QMA MR in a larger cohort of controls and FMR1 expansion males and females.
(A), MR in venous blood DNA from 20 male controls, 28 PM, 3 high-functioning UFM males (identified through cascade testingwith FSIQ, VIQ and PIQ �70, and determined to be unmethylated on Southern blot analysis), 52 FM males (identified throughinvestigation of developmental delay/ASD), 4 FM methylation mosaics, and 17 PM/FM size mosaics. (B), MR in venous bloodDNA from 88 female controls, 105 PM, and 95 FM females (identified through investigation of developmental delay/ASD). Note:Formal IQ testing was performed on only the UFM group. The red broken line is the threshold identified in Fig. 2 which separatesFM females with VIQ � or �70. The purple broken line represents the upper limit of the borderline range where for VIQ thereis overlap between FM females with VIQ � and �70 in Fig. 2.The green broken line is the threshold that separates FM malesfrom UFM, PM and control males. Each brace connected to the broken line indicates the range of methylation values and theproportion of FM identified above this threshold. Compared to controls: ***P � 0.001; **P � 0.01; *P � 0.05; compared toPM IQ �70: ���P � 0.001; ��P � 0.01; �P � 0.05.
968 Clinical Chemistry 60:7 (2014)
negative predictive values for the presence of an FMallele approached 100% (Fig. 4 and online Supplemen-tal Fig. 2). For male NBS, the exception was an FM spotwhich had an MR value identical to those of UFM high-functioning individuals. This was not an artifact be-cause it was shown to be unmethylated usingEpiTYPER system analysis of FREE2 (17 ). Unfortu-nately, there was no phenotypic information with thisdeidentified sample.
Unexpectedly, in NBS, MS-QMA identified morethan 90% of all FM females above the 0.39 threshold,whereas in an earlier study (17 ) MALDI-TOF MS anal-ysis of CpG10 –12 identified only 50% above the af-fected threshold (which for CpG10 –12 was 0.435). Inan attempt to explain the NBS discrepancy, we per-formed MALDI-TOF MS analysis on the same NBS forFREE2 CpG10 –12 and CpG6 –12 (Fig. 4, C and D).Consistent with the previous study (17 ), MALDI-TOFMS analysis of CpG10 –12 identified only 50% abovethe affected threshold. However, inclusion of addi-tional CpG sites for MALDI-TOF MS analysis (presentin the MS-QMA amplicon) increased the methylationoutput ratio of both control and FM groups, and al-tered the proportion of FM females above the affectedthreshold (Fig. 4 D). This suggests that differences inthe number and the way the CpG sites were analyzedis the most likely the reason why in NBS MS-QMAidentified more than 90% of all FM females above the0.39 threshold, whereas in this and earlier studies (17 )MALDI-TOF MS analysis of CpG10 –12 identified only50% above the affected threshold. Furthermore, al-though the EpiTYPER approach targets CpG 3, 4, and 5
Table 1. Sensitivity and specificity for MS-QMA MR in venous blood DNA.a
Variable AUC SE 95% CI
Optimal cutoff value(Youden index) for
MS-QMA MR Sensitivity Specificity
Femalesb
FSIQ 0.983 0.013 0.946–0.998 0.37 1.000 0.911
VIQ 0.993 0.007 0.958–0.999 0.39 1.000 0.943
PIQ 0.983 0.011 0.946–0.998 0.37 1.000 0.918
Malesc
FM males with ASD 1.000 0.000 0.965–1.000 0.10 1.000 1.000
FM methylation mosaics 1.000 0.000 0.935–1.000 0.10 1.000 1.000
a Specificity and methylation cutoff values were calculated at 100% sensitivity. Sensitivity and specificity were calculated based on the Youden index optimal cutoffvalue.
b FM females with FSIQ, VIQ, and PIQ �70 determined using the ROC analysis in a sample of 94 controls and 23 PM and 21 FM females. Sensitivity and specificitywere calculated based on the Youden index optimal cutoff value, which for FSIQ and PIQ was 0.37, and for VIQ was 0.39.
c Fifty-two FM males identified through investigation of developmental delay/ASD, 4 FM methylation mosaics, and 17 PM/FM size mosaics in a sample of 124 males,including 20 male control and 28 PM and 3 high-functioning FM males with FSIQ, VIQ, and PIQ �70, who were determined to be unmethylated usingmethylation-sensitive Southern blot identified through cascade testing.
Table 2. Relationships between FREE2 MS-QMA MR(predictor) with outcome variables WAIS FSIQ,
subscales, and subtests using simple linear regression.
Outcome variable nEstimatedcoefficient SE P a
FSIQ 20 �236.7 64.99 0.002**
VIQ 19 �239.0 64.64 0.002**
PIQ 19 �184.5 66.59 0.013*
Verbal comprehension index 15 �197.9 72.95 0.018*
Perceptual organization index 15 �161.5 80.34 0.066
Working memory index 9 �201.5 72.57 0.027*
Processing speed index 15 �115.0 52.42 0.047*
Picture completion 17 �40.43 14.19 0.012*
Vocabulary 16 �44.63 15.75 0.013*
Coding 15 �28.87 11.91 0.031*
Similarities 17 �27.76 13.72 0.061
Block design 17 �26.33 13.83 0.076
Arithmetic 17 �41.15 10.13 0.001**
Matrix reasoning 9 �22.22 18.34 0.265
Digit span 16 �23.48 12.61 0.084
Information 17 �42.85 12.19 0.003**
Picture arrangement 15 �31.67 12.11 0.021*
Comprehension 17 �42.24 17.54 0.029*
Symbol search 15 �19.21 10.34 0.086
Letter number sequencing 9 �41.42 14.49 0.024*
Object assembly 17 �21.27 13.90 0.147
a *P � 0.05; **P � 0.01.
Detection of Fragile X Syndrome using MS-QMA
Clinical Chemistry 60:7 (2014) 969
within FREE2, these cluster as 1 fragment which is toobig in size (Da) to be captured within the mass spec-trum. For this reason, CpGs 3–5 cannot be analyzed bythe EpiTYPER approach.
Discussion
In this study we present a novel method, MS-QMA,which is much simpler and more cost-effective than theSequenom EpiTYPER approach for methylation anal-ysis of the FREE2 region if used in FXS diagnostics andpopulation screening. In females the FMR1 activationratio determined using the Southern blot was signifi-cantly correlated with FREE2 methylation assessed us-
ing MS-QMA and the EpiTYPER system (14 ). Inmales, 2 PM/FM mosaics and 3 high-functioning FMmales (IQ �70) unmethylated in the FMR1 CpG island5� of the expansion by Southern blot (13 ), were belowthe 0.1 MR threshold within FREE2 as determined us-ing MS-QMA and the EpiTYPER system (Fig. 4A).Therefore, the ability of MS-QMA to differentiate thehigh-functioning FM males from the typical FXS malesis likely to be of prognostic value when used for earlydetection of FXS in males.
A somewhat surprising finding was that in NBS ata 0.39 threshold MS-QMA identified not only most FMmales, but also almost all FM females, with sensitivity,specificity, and positive and negative predictive values
Fig. 4. MS-QMA and MALDI-TOF MS analysis of different FMR1 intron 1 unit in the same NBS: comparisons of controland FM groups.
(A), MS-QMA CpG2–12 MR in spots from 87 male controls (CGG �40) and 13 FM males; (B), MS-QMA CpG2–12 MR in spotsfrom 95 female controls (CGG �40), and 15 FM females. (C), MALDI-TOF MS CpG 10–12 methylation output ratio (MOR) and(D), MALDI-TOF MS CpG 6–12 MR in spots from 95 female controls (CGG �40) and 15 FM females. Note: Only spots storedat room temperature for �10 years were included, because storage within this period was found to have no significant impacton the MS-QMA and MALDI-TOF MS outputs. Compared to controls, ***P � 0.001. The green broken line is the threshold fromFig. 3 that separated FM males from UFMs, PM, and control males. The red broken line is the threshold from Fig. 2 whichseparated FM females of VIQ � or �70. The purple broken line is the threshold which separated FM female NBS cohort into2 equal portions. The blue broken line is the CpG6–12 threshold above maximum value of blood spot female controls. Eachbrace connected to the broken line gives the range of values above the specific threshold and the proportion of FM identifiedabove this threshold.
970 Clinical Chemistry 60:7 (2014)
for the presence of an FM allele between 92% and100%. For this reason, we suggest that the MS-QMAtest may have applications for early detection of all FXSFM in females as well as males, particularly if usedwithin the first year of life.
However, in the age range from 6 to 35 years at thesame threshold, in venous blood MS-QMA identifiedonly 50% of all FM females. This FM group had VIQ of�70, with the test showing sensitivity of 100% andspecificity approximately 95% or VIQ �70. Ratherthan a technical issue or bias of ascertainment, thelikely explanation for this is that the age range of theparticipants was different between venous blood andNBS cohorts. Whereas in the venous blood for FM,PM, and control females there was no significant rela-tionship between age and MS-QMA output (see onlineSupplemental Fig. 3), the venous blood cohort hadonly a few FM females in the age range below 5 years,and no FM females in the first year of life.
If there is stochastic loss of methylation at 1 ormore of the CpG sites within the FREE2 amplicon inFM females in the early years of life, as suggested by thisstudy, it would be consistent with our earlier cross-sectional age vs methylation comparisons in FM fe-males (16 ). One of the mechanisms that may explainthis possibility is that such changes in methylation overtime may be due to gradual selection for cells express-ing FMRP in FM females (16 ). So the small proportionof cells that express FMRP at birth may increase overtime because of selection advantage, and this would beaccompanied by proportional decreases in methylationof CpG sites negatively correlated with FMRP expres-sion in blood. In fact, using MALDI-TOF MS, we havedetermined that the levels of methylation of at least 3CpGs within the FREE2 amplicon increase at birth andearly childhood, and the decreases with age until pu-berty in FM females but not in FM males (16 ). MS-QMA provides combined methylation output from 10CpG sites (CpG2 to -12), including those with methyl-ation reported to change with age (16 ), those that havestable methylation over time, and 3 additional CpGsites for which the methylation status could not be an-alyzed by MALDI-TOF MS owing to their fragmentsbeing too large. Together this may explain the twin andrelated issues of the MS-QMA and MALDI-TOF MSdifferences for NBS (Fig. 4) and similarities for oldervenous blood.
METHYLATION ANALYSIS FOR NEWBORN SCREENING AND IN
THE DIAGNOSTIC CONTEXT IN VENOUS BLOOD
This study confirmed our previous finding in venousblood, using a different method, of significant correla-tions between FMR1 intron 1 methylation and mea-sures of cognitive function (15 ). In the subgroup of 20FM females for whom we had a set of IQ subscales,
subtest scores, and indices available, we found that MS-QMA MR strongly correlated with subtest scores rep-resenting different aspects of VIQ. Arithmetic subtestscores (Working Memory Index), which largely rely onworking memory and attention, and the Informationsubtest scores (Verbal Comprehension Index), whichexamine general knowledge, stood out as the subtestscores most strongly correlated with MS-QMA MR(P � 0.01). It is also of interest that most FM and all PMfemales who were within the MS-QMA borderlinerange 0.39 – 0.41, were high-functioning (VIQ �70).This, however, does not rule out other forms of FXS-related impairment that may be identified using moresubtle measures of cognitive function, such as the sub-scores and indexes of IQ, or measures of behavioralimpairment such as the Autism Diagnostic Observa-tion Schedule—Generic.
The current study also suggests that an increase inthe MS-QMA threshold to 0.47 at birth in venousblood and NBS of FM females may predict the highsensitivity and specificity for verbal cognitive impair-ment in FM females at 6 years of age and older. Thishigher threshold separates NBS from 15 FM femalesinto 2 almost equal parts in the same way that the lower0.39 threshold separates the 20 venous blood samplesin older FM females and is strongly related to cognitiveimpairment. Validation studies are now underway toaddress the sample size and age range limitations byincreasing the venous blood and NBS sample sizes, es-pecially for FM females in the age range of �5 years.These studies will also examine longitudinally thechanges in MS-QMA MR during this period and thevalue in the first year of life of the MS-QMA analysis atthe 0.47 threshold to predict cognitive impairment at�2 years of age in FM females.
Based on the pilot data presented in this study, theMS-QMA methylation assay has important potentialfor use in newborn FXS screening because there hasbeen no test available that is suitably sensitive in malesand females and has high throughput and low cost. Thebenefits of identifying most male and female probandsearly are improved clinical management, identificationof other carriers through cascade testing, and the pro-vision of this information for reproductive planning.As part of the first NBS screen, the lower 0.39 thresholdcould be used, followed by second-line testing thatwould involve CGG sizing, and this would confirm thatall positives carry an FM allele. This may present a bet-ter alternative to using CGG sizing as a first-line test innewborns or very young children, because detection ofPM alleles that have been associated with late-onsetdisorders (30, 31 ) would raise the ethical issue of pre-symptomatic testing for currently untreatable andnonpreventable disorders with incomplete penetrance(32 ). Furthermore, detection of the relatively common
Detection of Fragile X Syndrome using MS-QMA
Clinical Chemistry 60:7 (2014) 971
GZ and PM alleles which do not cause FXS at apopulation-wide level, would require large-scale ge-netic counseling follow-up, which would have signifi-cant add-on cost– benefit implications.
In the diagnostic context, MS-QMA can be easilycombined with several PCR-based approaches recentlydeveloped to reliably amplify PM and small FM alleles(23, 33, 34 ). MS-QMA methylation values could beused to accurately separate most high-end unmethyl-ated PM from low-end methylated FM alleles, and mayin the future provide prognostic information fromquantitative methylation data in both males and fe-males. This could remove the need for the cumbersomeSouthern blot and identify all categories of expandedalleles.
In summary, the intended applications for MS-QMA methylation analysis in venous blood or NBS areto identify (a) those individuals likely to be cognitivelyimpaired, as reflected by low VIQ (�70) at �2 years ofage, with analyses performed any time after birth, and(b) most FM males and females through NBS or venousblood samples, with analyses performed in the first yearof life. The main difference between the 2 applications(which are not mutually exclusive) is in the thresholdsused to distinguish between the positive and negativecases. In this study, the utility of the borderline rangebetween 0.39 and 0.41 MR in venous blood could ef-fectively split the FM female group at �5 years of ageinto 2 equal parts and differentiate low-functioningFM females (VIQ �70), from high-functioning FMand PM females and from females that do not have anexpanded FMR1 allele. In NBS, however, the cutoffthreshold had to be increased to 0.47 MR to achieve thesame 50/50 split for FM females analyzed at birth. Wesuggest that this may be due to stochastic loss of meth-ylation at 1 or more of CpG sites within the FREE2amplicon, and that future longitudinal studies are re-quired to validate the prognostic potential of this assayif tests are performed at birth or the first year of life topredict cognitive impairment at �2 years of age. Thiswould maximize the period when the therapeutic in-tervention may be most effective. However, if the lower0.39 threshold is used in NBS, we show that it can iden-tify more than 90% of all FM males and females. This is
superior to the comparator EpiTYPER system, whichtargets the same sites as MS-QMA but cannot analyzesome of these because their fragments are too large forMALDI-TOF MS– based assessment (35 ).
Author Contributions: All authors confirmed they have contributed tothe intellectual content of this paper and have met the following 3 re-quirements: (a) significant contributions to the conception and design,acquisition of data, or analysis and interpretation of data; (b) draftingor revising the article for intellectual content; and (c) final approval ofthe published article.
Authors’ Disclosures or Potential Conflicts of Interest: Upon man-uscript submission, all authors completed the author disclosure form.Disclosures and/or potential conflicts of interest:
Employment or Leadership: Y. Inaba, Murdoch Childrens ResearchInstitute; D. Amor, VCGS.Consultant or Advisory Role: R. Hagerman, Roche/GenentechFragile X Advisory Board and Novartis Fragile X Treatment Advisoryboard; D. Loesch, National Institute of Child Health and HumanDevelopment (grant HD 36071); H. Slater, NHMRC Project (grant104299), NHMRC development grant (1017263), E.W. Al ThrasherAward, USA, and Martin & E.H. Flack Trust, Australia.Stock Ownership: None declared.Honoraria: None declared.Research Funding: NHMRC Project (grant 1049299), the VictorianGovernment’s Operational Infrastructure Support Program, Mur-doch Childrens Research Institute, Royal Children’s Hospital Foun-dation, and the South Carolina Department of Disabilities and Spe-cial Needs (SCDDSN); R. Hagerman, Roche, Novartis, SeasideTherapeutics, Forest, and Curemark; D.E. Godler, NHMRC Project(grant 104299), NHMRC development grant (1017263), Martin &E.H. Flack Trust, Australia, and E.W. Al Thrasher Award, USA.Expert Testimony: None declared.Patents: Y. Inaba, patent number AU2013900227; D.E. Godler, filingnumber 2013/900227 and patent numbers PCT/AU2010/000169,PCT/AU2010/001134, AU2010903595, and AU2011/902500.
Role of Sponsor: The funding organizations played no role in thedesign of study, choice of enrolled patients, review and interpretationof data, or preparation or approval of manuscript.
Acknowledgments: We thank the study participants for their con-tribution and Dr. Benjamin Ong from the Sequenom Platform Fa-cility (MCRI) and Dr. Annette Taylor and Debbie Hennerich (Kim-ball Genetics, a Division of LabCorp) for methylation analysis, fragileX CGG sizing, and FMRP testing for a proportion of FM and PMcases. We also thank James Pitt, Nick Tzanakos, and other membersof the Newborn Screening Laboratory at the Victorian Clinical Ge-netics Services for retrieval of residual NBS. Dedicated to the mem-ory of Ethan Francis Schwartz 1996 –1998.
References
1. Hagerman RJ, Berry-Kravis E, Kaufmann WE, OnoMY, Tartaglia N, Lachiewicz A, et al. Advances inthe treatment of fragile X syndrome. Pediatrics2009;123:378–90.
2. Verkerk AJ, Pieretti M, Sutcliffe JS, Fu YH, KuhlDP, Pizzuti A, et al. Identification of a gene(FMR-1) containing a CgG repeat coincident witha breakpoint cluster region exhibiting length vari-ation in fragile X syndrome. Cell 1991;65:905–14.
3. Pieretti M, Zhang FP, Fu YH, Warren ST, Oostra
BA, Caskey CT, Nelson DL. Absence of expressionof the FMR-1 gene in fragile X syndrome. Cell1991;66:817–22.
4. Weiler IJ, Greenough WT. Synaptic synthesis ofthe Fragile X protein: possible involvement insynapse maturation and elimination. Am J MedGenet 1999;83:248–52.
5. Irwin SA, Swain RA, Christmon CA, Chakravarti A,Weiler IJ, Greenough WT. Evidence for alteredFragile-X mental retardation protein expression in
response to behavioral stimulation. NeurobiolLearn Mem 2000;74:87–93.
6. Heitz D, Devys D, Imbert G, Kretz C, Mandel JL.Inheritance of the fragile X syndrome: size of thefragile X premutation is a major determinant ofthe transition to full mutation. J Med Genet1992;29:794–801.
7. Fu YH, Kuhl DP, Pizzuti A, Pieretti M, Sutcliffe JS,Richards S, et al. Variation of the CGG repeat atthe fragile X site results in genetic instability:
972 Clinical Chemistry 60:7 (2014)
resolution of the Sherman paradox. Cell1991;67:1047–58.
8. Maddalena A, Richards CS, McGinniss MJ, Broth-man A, Desnick RJ, Grier RE, et al. Technicalstandards and guidelines for fragile X: the first ofa series of disease-specific supplements to theStandards and Guidelines for Clinical GeneticsLaboratories of the American College of MedicalGenetics. Quality Assurance Subcommittee of theLaboratory Practice Committee. Genet Med2001;3:200–5.
9. Hagerman RJ, Hall DA, Coffey S, Leehey M, Bour-geois J, Gould J, et al. Treatment of fragileX-associated tremor ataxia syndrome (FXTAS)and related neurological problems. Clin IntervAging 2008;3:251–62.
10. Sherman SL. Premature ovarian failure in thefragile X syndrome. Am J Med Genet 2000;97:189–94.
11. Loesch DZ, Godler DE, Evans A, Bui QM, GehlingF, Kotschet KE, et al. Evidence for the toxicity ofbidirectional transcripts and mitochondrial dys-function in blood associated with small CGGexpansions in the FMR1 gene in patients withparkinsonism. Genet Med 2011;13:392–9.
12. Coffee B, Keith K, Albizua I, Malone T, Mowrey J,Sherman SL, Warren ST. Incidence of fragile Xsyndrome by newborn screening for methylatedFMR1 DNA. Am J Hum Genet 2009;85:503–14.
13. Godler DE, Tassone F, Loesch DZ, Taylor AK,Gehling F, Hagerman RJ, et al. Methylation ofnovel markers of fragile X alleles is inverselycorrelated with FMRP expression and FMR1 acti-vation ratio. Hum Mol Genet 2010;19:1618–32.
14. Godler DE, Slater SH, Bui QM, Ono M, Gehling F,Francis D, et al. FMR1 intron 1 methylation pre-dicts FMRP expression in blood of female carriersof expanded FMR1 alleles. J Mol Diagn 2011;13:528–36.
15. Godler DE, Slater HR, Bui QM, Storey E, Ono MY,Gehling F, et al. Fragile X mental retardation 1(FMR1) intron 1 methylation in blood predictsverbal cognitive impairment in female carriers ofexpanded FMR1 alleles: evidence from a pilotstudy. Clin Chem 2012;58:590–8.
16. Godler DE, Inaba Y, Shi EZ, Skinner C, Bui QM,Francis D, et al. Relationships between age andepi-genotype of the FMR1 exon 1/intron 1
boundary are consistent with non-randomX-chromosome inactivation in FM individuals,with the selection for the unmethylated statebeing most significant between birth and pu-berty. Hum Mol Genet 2013;22:1516–24.
17. Inaba Y, Herlihy AS, Schwartz CE, Skinner C, BuiQM, Cobb J, et al. Fragile X-related element 2methylation analysis may provide a suitable op-tion for inclusion of fragile X syndrome and/or sexchromosome aneuploidy into newborn screening:a technical validation study. Genet Med2013;15:290–8.
18. Loesch DZ, Sherwell S, Kinsella G, Tassone F,Taylor A, Amor D, et al. Fragile X-associatedtremor/ataxia phenotype in a male carrier of un-methylated full mutation in the FMR1 gene. ClinGenet 2012;82:88–92.
19. Tassone F, Hagerman RJ, Chamberlain WD,Hagerman PJ. Transcription of the FMR1 gene inindividuals with fragile X syndrome. Am J MedGenet 2000;97:195–203.
20. Tassone F, Hagerman RJ, Loesch DZ, LachiewiczA, Taylor AK, Hagerman PJ. Fragile X males withunmethylated, full mutation trinucleotide repeatexpansions have elevated levels of FMR1 mes-senger RNA. Am J Med Genet 2000;94:232–6.
21. Loesch DZ, Godler DE, Khaniani M, Gould E,Gehling F, Dissanayake C, et al. Linking the FMR1alleles with small CGG expansions with neurode-velopmental disorders: preliminary data suggestan involvement of epigenetic mechanisms. Am JMed Genet A 2009;149A:2306–10.
22. Khaniani MS, Kalitsis P, Burgess T, Slater HR. Animproved diagnostic PCR assay for identificationof cryptic heterozygosity for CGG triplet repeatalleles in the fragile X gene (FMR1). Mol Cyto-genet 2008;1:5.
23. Tassone F, Pan R, Amiri K, Taylor AK, HagermanPJ. A rapid polymerase chain reaction-basedscreening method for identification of all ex-panded alleles of the fragile X (FMR1) gene innewborn and high-risk populations. J Mol Diagn2008;10:43–9.
24. Christie L, Wotton T, Bennetts B, Wiley V, WilckenB, Rogers C, et al. Maternal attitudes to newbornscreening for fragile X syndrome. Am J MedGenet A 2013;161A:301–11.
25. de Vries BB, Wiegers AM, Smits AP, Mohkamsing
S, Duivenvoorden HJ, Fryns JP, et al. Mentalstatus of females with an FMR1 gene full muta-tion. Am J Hum Genet 1996;58:1025–32.
26. Loesch DZ, Huggins RM, Taylor AK. Application ofrobust pedigree analysis in studies of complexgenotype-phenotype relationships in fragile Xsyndrome. Am J Med Genet 2002;107:136–42.
27. Tassone F, Hagerman RJ, Ikle DN, Dyer PN,Lampe M, Willemsen R, et al. FMRP expression asa potential prognostic indicator in fragile X syn-drome. Am J Med Genet 1999;84:250–61.
28. Youden WJ. Index for rating diagnostic tests.Cancer 1950;3:32–5.
29. R Development Core Team. The R Project forStatistical Computing. http://www.r-project.org/(Accessed February 2009).
30. Godler DE, Slater HR, Amor D, Loesch DZ. Meth-ylation analysis of fragile X-related epigeneticelements may provide a suitable newborn screen-ing test for fragile X syndrome. Genet Med2010;12:595.
31. Hagerman PJ, Hagerman RJ. Fragile X-associatedtremor/ataxia syndrome–an older face of thefragile X gene. Nat Clin Pract Neurol 2007;3:107–12.
32. Bailey DB Jr, Armstrong FD, Kemper AR, SkinnerD, Warren SF. Supporting family adaptation topresymptomatic and “untreatable” conditions inan era of expanded newborn screening. J PediatrPsychol 2009;34:648–61.
33. Filipovic-Sadic S, Sah S, Chen L, Krosting J,Sekinger E, Zhang W, et al. A novel FMR1 PCRmethod for the routine detection of low-abundance expanded alleles and full mutationsin fragile X syndrome. Clin Chem 2010;56:399–408.
34. Hantash FM, Goos DG, Tsao D, Quan F, Buller-Burckle A, Peng M, et al. Qualitative assessmentof FMR1 (CGG)n triplet repeat status in normal,intermediate, premutation, full mutation, andmosaic carriers in both sexes: implications forfragile X syndrome carrier and newborn screen-ing. Genet Med 2010;12:162–73.
35. Tost J, Gut IG. DNA methylation analysis by MALDImass spectrometry. In: Meyers RA, ed. Epigeneticregulation and epigenomics. Weinheim: Wiley-Blackwell; c2012. p 105–44.