Defra RESEARCH CONTRACT RESERVOIR SAFETY ADVICE TASK B : EARLY DETECTION OF INTERNAL EROSION FEASIBILITY REPORT Volume 1 of 2: Main Report Ref. XU0248/ 201 Revision A02 November 2003 Hill Park Court Springfield Drive Leatherhead Surrey, KT22 7NL ENGLAND
Transcript
Defra RESEARCH CONTRACT RESERVOIR SAFETY ADVICE TASK B : EARLY DETECTION OF INTERNAL EROSION FEASIBILITY REPORT Volume 1 of 2: Main Report Ref. XU0248/ 201 Revision A02 November 2003
Hill Park Court Springfield Drive Leatherhead Surrey, KT22 7NL ENGLAND
TASK B EARLY DETECTION OF INTERNAL EROSION RESERVOIR SAFETY ADVICE FEASIBILITY REPORT DEFRA RESEARCH CONTRACT
0 of 2 02/11/2004 2:16 PM L:\EWE_Operations\UK_D&W\XU0248 - Defra research\201 Task B Internal eroison\Stage 1 - Feasibility Report\Task B FINAL- on Defra web site\Vol 1\Task B Feasibility report Cover Rev A02.doc
VOLUME PLAN
Volume
1
Main Report
2
Appendices A to H : Supporting Documentation A: Terms of Reference B: Literature Review C: Results of Questionnaire B D: Detailed consideration of 6 cases E: Expert Elicitation F : Possible techniques for early detection of internal erosion G: Options and costs for remote monitoring
Annex Annex to Tasks A and B : Feasibility Reports 1: Bibliography 2: Questionnaire : Number returned and implied number of incidents / yr in UK 3: Package sent out as Questionnaire
TASK B EARLY DETECTION OF INTERNAL EROSION RESERVOIR SAFETY ADVICE FEASIBILITY REPORT DEFRA RESEARCH CONTRACT
11/11/2004 3:26 PM 0 of 70 L:\EWE_Operations\UK_D&W\XU0248 - Defra research\201 Task B Internal eroison\Stage 1 - Feasibility Report\Task B FINAL- on Defra web site\Vol 1\Task B Main text 05 Website.doc
CONTENTS
EXECUTIVE SUMMARY 4
1 INTRODUCTION 5 1.1 Objectives of Task B 5 1.2 Task overview 6
1.2.1 Definition of Monitoring 6 1.2.2 Challenges of this task 6
1.3 Deliverables for this task 7 1.4 Structure of Report 7 1.5 Methodology 8
1.5.1 Introduction 8 1.5.2 Literature Review 8 1.5.3 Questionnaire to dam owners and panel engineers 9 1.5.4 Expert elicitation 9 1.5.5 Instrumentation and monitoring systems 11
1.6 Acknowledgments 11
2 CHARACTERISTICS OF UK DAMS 12 2.1 Data in BRE database 12 2.2 Features relevant to detection of internal erosion 13
3 CURRENT PRACTICE IN MANAGING INTERNAL EROSION 14 3.1 Introduction 14 3.2 Surveillance 14 3.3 Instrumentation 15 3.4 Control of internal erosion 15 3.5 Investigation of suspected internal erosion 17 3.6 Physical works arising from internal erosion incidents 18 3.7 Promoting and maintaining good practice 18
4 SYNTHESIS OF AVAILABLE THEORY AND CASE HISTORY DATA 20 4.1 Introduction 20 4.2 Definitions 21 4.3 Current practice for design of new dams 23
4.3.1 Embankments 23 4.3.2 Appurtenant works through embankments 25 4.3.3 Areas of uncertainty 25
4.4 Case history data: practical observations relevant to progressive internal erosion 26 4.4.1 Introduction 26 4.4.2 Prevalence and location of internal erosion 26 4.4.3 Dispersive soils and soil erodibility 27 4.4.4 Effectiveness of downstream shoulder fill as filter 28 4.4.5 Seepage and interpretation of pore pressure readings 28 4.4.6 Interpretation of settlement 29 4.4.7 Change of embankment properties with time 30 4.4.8 Unprotected pipes and culverts 30 4.4.9 Mechanisms of failure, including singularities 30
4.5 Models of progressive internal erosion 31 4.5.1 General 31 4.5.2 Effect of singularities 32
4.6 Quantification of Concentrated leakage 32 4.6.1 General 32
TASK B EARLY DETECTION OF INTERNAL EROSION RESERVOIR SAFETY ADVICE FEASIBILITY REPORT DEFRA RESEARCH CONTRACT
11/11/2004 3:26 PM 1 of 70 L:\EWE_Operations\UK_D&W\XU0248 - Defra research\201 Task B Internal eroison\Stage 1 - Feasibility Report\Task B FINAL- on Defra web site\Vol 1\Task B Main text 05 Website.doc
4.6.2 Initiation of Pathway - Hydraulic fracture 32 4.6.3 Initiation of internal erosion 35 4.6.4 Continuation 35 4.6.5 Progression (and initiation) of internal erosion 36 4.6.6 Breach mechanisms 41
4.7 Quantification of Suffusion and Piping 42 4.7.1 Suffusion 42 4.7.2 Piping 42
4.8 Unprotected pipes and culverts through embankments 43 4.9 Conclusions 44
5 STRATEGY FOR EARLY DETECTION OF INTERNAL EROSION 46 5.1 Introduction 46 5.2 Strategy 47
5.2.1 Long term objective 47 5.2.2 Interim strategy 47
5.3 Prioritisation of Indicators 49 5.4 Role for Surveillance and for real time monitoring 52
5.4.1 Comparison of features 52 5.4.2 Response to detection of internal erosion 53 5.4.3 Conclusion 53
5.5 Intrinsic condition 54 5.6 Special issues at unprotected pipes and culverts 54 5.7 Assessment of proportionate approach 54 5.8 Frequency of monitoring 56
6 ACTIONS TO PROGRESS AN EFFECTIVE SOLUTION TO MONITORING INTERNAL EROSION 58 6.1 Future research 58 6.2 Field trials 59
TASK B EARLY DETECTION OF INTERNAL EROSION RESERVOIR SAFETY ADVICE FEASIBILITY REPORT DEFRA RESEARCH CONTRACT
11/11/2004 3:26 PM 2 of 70 L:\EWE_Operations\UK_D&W\XU0248 - Defra research\201 Task B Internal eroison\Stage 1 - Feasibility Report\Task B FINAL- on Defra web site\Vol 1\Task B Main text 05 Website.doc
List of Tables Table 1.1 : Summary of Deliverables 7 Table 1.2 : Key papers relevant to early detection of internal erosion (ordered by date) 8 Table 1.3 : Headings in Questionnaire B 9 Table 1.4 : Summary of questions adopted for elicitation exercise 10 Table 2.1 : Chronology of main events relating to dam safety in UK 12 Table 2.2 : Distribution of characteristics of all embankment dams 12 Table 2.3 : Distribution of embankment dam height and age 12 Table 2.4 : Subdivision of UK embankment dams into types and dam life years 13 Table 2.5 : Features which have an important influence on the ease of detection of internal erosion. 13 Table 3.1 : Opinion of UK dam industry on value of instrumentation 16 Table 3.2 : Status of trials of new techniques for investigating suspected internal erosion 17 Table 4.1 : Key terms relating to Internal erosion 21 Table 4.2 : Different types of internal erosion (after Charles, 1998) 21 Table 4.3 : Terms relating to the process of internal erosion 22 Table 4.4 : Definitions of contributory factors to internal erosion 22 Table 4.5 : Key references for design of filters for new dams 23 Table 4.6 : Features normally included in design of new embankment dams 24 Table 4.7 : Features normally included in design of new appurtenant works through embankment dams 25 Table 4.8 : Prevalence and location of leakage and internal erosion 26 Table 4.9 : US SCS Criteria for filters (1986) 35 Table 4.10 :Predictive equations from Wan et al (2002) for Erosion rate Index 39 Table 4.11 : Outcome from Expert Elicitation of effect of material properties of core on time to failure of puddle clay dams 40 Table 4.12 : Failure mechanisms likely to lead to progressive internal erosion 41 Table 4.13 : Outcome from Expert Elicitation of effect of material properties of shoulders on time to failure of puddle clay dams 41 Table 4.14 : Published allowable Seepage Gradient to prevent piping 43 Table 5.1 : Proposed Outline Strategy for early detection of internal erosion 48 Table 5.2 : Criteria for determining the priority of Indicators for use in early detection of internal erosion 50 Table 5.3 : Candidates parameters as Indicators of internal erosion in body of dam 51 Table 5.4 : Candidates parameters as Indicators of internal erosion associated with appurtenant works 51 Table 5.5 : Comparison of features of surveillance and real time monitoring 52 Table 5.6 : Candidate Parameters relating to Intrinsic condition (vulnerability or change) 55 Table 5.7 : Indicative ALARP calculation of proportionate cost for early detection of progressive internal erosion 55 Table 5.8 : Indicative incremental annual costs of options for increased monitoring in relation to "early detection of internal erosion" 55 Table 5.10 Preliminary adjustment to base frequency for dam specific vulnerability 56 Table 5.9 Suggested Guide for in-service dam base monitoring frequency 57 Table 6.1 : Issues for future research 58 Table 6.2 : Options for field trials 60
TASK B EARLY DETECTION OF INTERNAL EROSION RESERVOIR SAFETY ADVICE FEASIBILITY REPORT DEFRA RESEARCH CONTRACT
11/11/2004 3:26 PM 3 of 70 L:\EWE_Operations\UK_D&W\XU0248 - Defra research\201 Task B Internal eroison\Stage 1 - Feasibility Report\Task B FINAL- on Defra web site\Vol 1\Task B Main text 05 Website.doc
List of Figures Figure 3.1 : Frequency of surveillance to detect internal erosion (Q3, 25, 40) 19 Figure 3.2 : Frequency of surveillance to detect a level 2 incident (by respondent) (Q3) 19 Figure 4.1 : Percentage of puddle clay dams with ongoing, steady leakage flow 45 Figure 4.2 : Percentage of homogenous dams with ongoing, steady leakage flow 45 Figure 4.3 : For puddle clay dams with ongoing, steady leakage flow; % with internal erosion 45 Figure 4.4 : For homogenous dams with ongoing, steady leakage flow; % with internal erosion 45 Figure 4.5 : Percentage split into different mechanisms for puddle clay dams 45 Figure 4.6 : Percentage split into different mechanisms for homogenous dams 45 Figure 4.7 : Event train for internal instability in service 45 Figure 4.8 : Time based model of progressing internal erosion 45 Figure 4.9 : Event tree for progression of internal erosion within an embankment dam 45 Figure 4.10 : Illustration of crack width on leakage flow and average shear stress on sides of crack 45 Figure 4.11a Effect of crack width on erosion rate for an Erosion Rate Index of 4 45 Figure 4.11b Effect of crack width on erosion rate for an Erosion Rate Index of 1 45 Figure 4.11c Effect of crack width on erosion rate for Erosion Rate Index of 1 to 6 45 Figure 4.11d Variation of turbidity with crack width and Erosion Rate Index 45 Figure 4.12 : Distribution of timing of actions following detection of serious internal erosion 45 Figure 4.13 : Magnitude of internal erosion leakage flow at various satges in incidnet 45 Figure 4.14 : Time to failure vs. gradient 45 Figure 4.15 : Time to failure vs. dam height 45 Figure 4.16 : Time to failure vs. plasticity index 45 Figure 4.17 : Leakage rates: average ongoing and minimum detectable 45 Figure 4.18 : Average erosion rate for dams with ongoing, steady internal erosion 45 Figure 4.19 : Distribution of dam critical flow for population of all UK embankment dams 45 Figure 4.20 : Time from detection to failure of puddle clay dams, if no intervention 45 Figure 4.21 : Time from detection to failure of homogenous dams, if no intervention 45 Figure 4.22 : Effect of characteristics of core material on time to failure (puddle clay core) 45 Figure 4.23 : Effect of compaction and hydraulic gradient on time to failure (for puddle core clay dams) 45 Figure 4.24 : Effect of characteristics of dam shoulders on time to failure (for puddle core clay dams) 45 Figure 4.25: For concentrated leaks at puddle clay dams, % that would behave in a particular way 45 Figure 5.1: Process diagram illustrating strategy for early detection of internal erosion 57 Figure 5.2: Consequence diagram for UK dams 57
TASK B EARLY DETECTION OF INTERNAL EROSION RESERVOIR SAFETY ADVICE FEASIBILITY REPORT DEFRA RESEARCH CONTRACT
11/11/2004 3:26 PM 4 of 70 L:\EWE_Operations\UK_D&W\XU0248 - Defra research\201 Task B Internal eroison\Stage 1 - Feasibility Report\Task B FINAL- on Defra web site\Vol 1\Task B Main text 05 Website.doc
EXECUTIVE SUMMARY This report is produced as part of an ongoing programme of research into reservoir safety in the UK, funded by government. The main objective of this particular project is to:
“provide a cost-effective approach to the early detection of progressive internal erosion in embankment dams”
The project commenced in September 2002 and is due for completion in late 2004. This report is the first of three stages, comprising a feasibility study to propose an outline strategy to achieve the above; this strategy is to be presented for peer review at a meeting of the British Dam Society. The two subsequent stages are development and testing of systems to provide warning of internal erosion, and preparation of technical guidance. This research project has included a questionnaire to the UK dam industry, use of expert elicitation, literature reviews and informal discussions with practitioners in other countries. In order to keep the length of the main report to manageable proportions, literature reviews and other non-core material has been included as Appendices, the text in the main report being limited to summaries of precedent and other important features. Section 2 comprises a review of the characteristics of UK dams, Section 3 current practice in managing internal erosion and Section 4 a synthesis of available theory and case history data. It is concluded that
• Internal erosion in the vicinity of appurtenant works appears to be the greatest risk of rapid failure
• The threat from internal erosion to the body of the embankment needs to be considered in the connect of the whole system of core and upstream and downstream shoulders
The proposed outline strategy is given in Table 5.1 and comprises a risk based approach utilising a mixture of the following
a) surveillance b) investigations to better quantify the risk of failure due to internal erosion; followed where
appropriate by upgrading works c) real time monitoring for Consequence Category A dams
A number of options for Stage 2 of the research, the field trials, have been identified as shown in Table 6.2, with the choice partly dependent on the budget available.
TASK B EARLY DETECTION OF INTERNAL EROSION RESERVOIR SAFETY ADVICE FEASIBILITY REPORT DEFRA RESEARCH CONTRACT
11/11/2004 3:26 PM 5 of 70 L:\EWE_Operations\UK_D&W\XU0248 - Defra research\201 Task B Internal eroison\Stage 1 - Feasibility Report\Task B FINAL- on Defra web site\Vol 1\Task B Main text 05 Website.doc
1 INTRODUCTION
1.1 Objectives of Task B This project is part of a three year contract for reservoir safety advice awarded by Defra to KBR. The contract includes for two specific research contracts, of which this is the second. Clause 8 of the Specification states that the specific objective is to provide a cost-effective approach to the early detection of progressive internal erosion in embankment dams; whilst the introduction to Clause 11 states that it is to devise an effective solution to the problem of monitoring internal erosion and leakage which undertakers could be expected to adopt without incurring disproportionate expense. The major emphasis should be given to embankment dams which predate modern geotechnical engineering and which, as a consequence, do not incorporate adequately designed filters within the embankment or instrumentation systems. The hazards posed by unprotected pipes and culverts passing through embankment dams require particular attention.…… and describes three stages, as follows Stage 1 - The development of a strategy for the early detection of internal erosion in embankment dams.
• The starting point will be to assess overall feasibility and the respective roles of surveillance and real time remote monitoring of instrumentation and warning systems.
• Techniques for remote monitoring of instrumentation located in or on the dam to detect internal erosion will be identified and evaluated.
• The contractor will produce an outline strategy within a year and present it for peer review at a meeting of a professional body (e.g. British Dams Society).
Stage 2 – In the light of feedback at the review meeting, the strategy will be refined. Appropriate instrumentation and monitoring systems, which can provide immediate warning of changes to normal leakage levels, will be developed and tested on appropriate dams. Further development of the strategy may then be required. Stage 3 – Technical guidance will be prepared and a meeting of a professional body held to ensure wide dissemination of the strategy and the instrumentation developments. Stage 2 is provisional, dependent on the cost and whether part funding can be obtained form other sources e.g. Instrumentation manufacturers. This report comprises the response to Stage 1 of the Contract.
TASK B EARLY DETECTION OF INTERNAL EROSION RESERVOIR SAFETY ADVICE FEASIBILITY REPORT DEFRA RESEARCH CONTRACT
02/11/2004 2:20 PM 4 of 70 L:\EWE_Operations\UK_D&W\XU0248 - Defra research\201 Task B Internal eroison\Stage 1 - Feasibility Report\Task B FINAL- on Defra web site\Vol 1\Task B Main text 05 Website.doc
EXECUTIVE SUMMARY This report is produced as part of an ongoing programme of research into reservoir safety in the UK, funded by government. The main objective of this particular project is to:
“provide a cost-effective approach to the early detection of progressive internal erosion in embankment dams”
The project commenced in September 2002 and is due for completion in late 2004. This report is the first of three stages, comprising a feasibility study to propose an outline strategy to achieve the above; this strategy is to be presented for peer review at a meeting of the British Dam Society. The two subsequent stages are development and testing of systems to provide warning of internal erosion, and preparation of technical guidance. This research project has included a questionnaire to the UK dam industry, use of expert elicitation, literature reviews and informal discussions with practitioners in other countries. In order to keep the length of the main report to manageable proportions, literature reviews and other non-core material has been included as Appendices, the text in the main report being limited to summaries of precedent and other important features. Section 2 comprises a review of the characteristics of UK dams, Section 3 current practice in managing internal erosion and Section 4 a synthesis of available theory and case history data. It is concluded that
• Internal erosion in the vicinity of appurtenant works appears to be the greatest risk of rapid failure
• The threat from internal erosion to the body of the embankment needs to be considered in the connect of the whole system of core and upstream and downstream shoulders
The proposed outline strategy is given in Table 5.1 and comprises a risk based approach utilising a mixture of the following
a) surveillance b) investigations to better quantify the risk of failure due to internal erosion; followed where
appropriate by upgrading works c) real time monitoring for Consequence Category A dams
A number of options for Stage 2 of the research, the field trials, have been identified as shown in Table 6.2, with the choice partly dependent on the budget available.
TASK B EARLY DETECTION OF INTERNAL EROSION RESERVOIR SAFETY ADVICE FEASIBILITY REPORT DEFRA RESEARCH CONTRACT
02/11/2004 2:20 PM 5 of 70 L:\EWE_Operations\UK_D&W\XU0248 - Defra research\201 Task B Internal eroison\Stage 1 - Feasibility Report\Task B FINAL- on Defra web site\Vol 1\Task B Main text 05 Website.doc
1 INTRODUCTION
1.1 Objectives of Task B This project is part of a three year contract for reservoir safety advice awarded by Defra to KBR. The contract includes for two specific research contracts, of which this is the second. Clause 8 of the Specification states that the specific objective is to provide a cost-effective approach to the early detection of progressive internal erosion in embankment dams; whilst the introduction to Clause 11 states that it is to devise an effective solution to the problem of monitoring internal erosion and leakage which undertakers could be expected to adopt without incurring disproportionate expense. The major emphasis should be given to embankment dams which predate modern geotechnical engineering and which, as a consequence, do not incorporate adequately designed filters within the embankment or instrumentation systems. The hazards posed by unprotected pipes and culverts passing through embankment dams require particular attention.…… and describes three stages, as follows Stage 1 - The development of a strategy for the early detection of internal erosion in embankment dams.
• The starting point will be to assess overall feasibility and the respective roles of surveillance and real time remote monitoring of instrumentation and warning systems.
• Techniques for remote monitoring of instrumentation located in or on the dam to detect internal erosion will be identified and evaluated.
• The contractor will produce an outline strategy within a year and present it for peer review at a meeting of a professional body (e.g. British Dams Society).
Stage 2 – In the light of feedback at the review meeting, the strategy will be refined. Appropriate instrumentation and monitoring systems, which can provide immediate warning of changes to normal leakage levels, will be developed and tested on appropriate dams. Further development of the strategy may then be required. Stage 3 – Technical guidance will be prepared and a meeting of a professional body held to ensure wide dissemination of the strategy and the instrumentation developments. Stage 2 is provisional, dependent on the cost and whether part funding can be obtained form other sources e.g. Instrumentation manufacturers. This report comprises the response to Stage 1 of the Contract.
TASK B EARLY DETECTION OF INTERNAL EROSION RESERVOIR SAFETY ADVICE FEASIBILITY REPORT DEFRA RESEARCH CONTRACT
02/11/2004 2:20 PM 6 of 70 L:\EWE_Operations\UK_D&W\XU0248 - Defra research\201 Task B Internal eroison\Stage 1 - Feasibility Report\Task B FINAL- on Defra web site\Vol 1\Task B Main text 05 Website.doc
1.2 Task overview
1.2.1 Definition of Monitoring The terms of reference refer to �early detection� and also to �monitoring�. It is suggested that monitoring to reduce the probability of internal erosion could be all, or some, of the following a) Physical monitoring, with trigger values set so that if the readings vary from normal by more than a set amount an alarm is triggered b) Surveillance, namely audio and visual monitoring by trained staff c) Physical investigations to improve the understanding of the vulnerability of the particular dam to internal erosion, followed perhaps by physical mitigation measures such as the inclusion of filters The practicality of Item �b� will depend on the potential rate of deterioration, and thus how frequently visits would need to be made if any problem was to be identified and action taken in time to avoid a failure. Where a dam was vulnerable to rapid deterioration following initiation of internal erosion the only practicable option may be some form of real time monitoring with an automatic warning system.
1.2.2 Challenges of this task
The challenges are to a) obtain reliable information on rates of development of internal erosion, and
whether all internal erosion is �progressive�; or whether in some circumstances the rate of erosion would stay constant with time
b) identify • the key factors controlling the rate of erosion, • what may trigger progressive deterioration, • the timeline in which deterioration may be noticed and action taken to arrest
and control the deterioration • the indicators of such deterioration
c) identifying and/ or developing instrumentation which is effective at detecting internal erosion (as differentiated from leakage)
d) defining the criteria to differentiate disproportionate from proportionate expense e) thus identify practicable and cost effective means of identifying deterioration
TASK B EARLY DETECTION OF INTERNAL EROSION RESERVOIR SAFETY ADVICE FEASIBILITY REPORT DEFRA RESEARCH CONTRACT
02/11/2004 2:20 PM 7 of 70 L:\EWE_Operations\UK_D&W\XU0248 - Defra research\201 Task B Internal eroison\Stage 1 - Feasibility Report\Task B FINAL- on Defra web site\Vol 1\Task B Main text 05 Website.doc
1.3 Deliverables for this task The methodology for responding to the terms of reference were given in the Inception Report and are not reported here. The deliverables for this Task are summarised in Table 1.1.
Table 1.1 : Summary of Deliverables
Item Implementation programme for Task (in Inception Report)
Item number
Date due Date completed
Inception Report 5 22 Nov. 2002 26th Nov 2003 Questionnaire 41 4 Feb 2003 21st March 2003 Feasibility Report ** 47 14 July 2003 7th November 2003 BDS Meeting 50 6 October 2003 London - 27th October
2003 (progress report) Glasgow � December 2003 (completed report)
Tender docs for trial 55 31 October 2003 Strategy for trial** 53 3 December 2003 Report on trials** 61 17 August 2004 Technical Guidelines 63 15 September 2004 BDS Meeting 66 19 October 2004
** Subject to review by Steering Group as well as Defra
1.4 Structure of Report The report is structured so that a) information in common with Task A (�System of incident reporting�) is given in
an Annex volume, including the references b) supporting data is given in appendices, with the key issues discussed in the body of
the text.
TASK B EARLY DETECTION OF INTERNAL EROSION RESERVOIR SAFETY ADVICE FEASIBILITY REPORT DEFRA RESEARCH CONTRACT
02/11/2004 2:20 PM 8 of 70 L:\EWE_Operations\UK_D&W\XU0248 - Defra research\201 Task B Internal eroison\Stage 1 - Feasibility Report\Task B FINAL- on Defra web site\Vol 1\Task B Main text 05 Website.doc
1.5 Methodology
1.5.1 Introduction This section summarises the methodology adopted for identifying a cost effective means of early detection of internal erosion.
1.5.2 Literature Review The results of a literature review is given in Appendix B, with a Bibliography in the Annex volume. The key references are given in Table 1.2.
Table 1.2 : Key papers relevant to early detection of internal erosion (ordered by date)
Authors Date Title, Publication European Working Group
2002 Charles, Gerainger 2001, repeated at BDS 2002 � 70 (previous progress report in 1998 by Charles at European conference)
Fell et al 2001 The time for development and detectability of internal erosion and piping in embankment dams. Univ of New South Wales Report R-399. June. 38pp
ICOLD 2000 Q78, Beijing. �Monitoring of dams and their foundations� (85 papers)
Foster, Fell and Spannagle
2000 A method for assessing the relative likelihood of failure of embankment dams by piping. Pages 1034 onwards includes �factors affecting the warning time and ability to intervene to prevent failure�
Vaughan 2000 a) Internal erosion of dams � assessment of risks b) Filter design for dam cores of clay, a retrospect. Both in Conf Filters and drainage in geotechnical and environmental engineering. Balkema.
Foster and Fell 1999 A framework for estimating the probability of failure of embankment dams by piping using event tree methods. Univ of New South Wales Report DRAFT. April. 38pp
ICOLD 1997 Q 73, Florence. �Special problems with earthfill dams�. (61 papers). General Report by Charles
TASK B EARLY DETECTION OF INTERNAL EROSION RESERVOIR SAFETY ADVICE FEASIBILITY REPORT DEFRA RESEARCH CONTRACT
02/11/2004 2:20 PM 9 of 70 L:\EWE_Operations\UK_D&W\XU0248 - Defra research\201 Task B Internal eroison\Stage 1 - Feasibility Report\Task B FINAL- on Defra web site\Vol 1\Task B Main text 05 Website.doc
1.5.3 Questionnaire to dam owners and panel engineers A questionnaire was developed and issued to recipients listed in Annex 2, covering both their views on internal erosion generally and a request for data on specific instances of internal erosion (52 questions, 93 sub questions). The latter was subdivided into headings as shown in Table 1.3. The results of the questionnaire are discussed in Appendix C, and for some questions also in the main text; the latter as shown in the table.
Table 1.3 : Headings in Questionnaire B
Question number
Number of sub-Q
Section of Main Report
Start End 7 18 Background/ Incident details 12 4.4
19 22d Event detection 7 - 23 28 Rate of deterioration 11 3.2 29 39 Characteristics of dam at location of incident 26 4.6.5 40, 49
44d 49d
Surveillance before/ after 19 3.2
45 48 Prior warnings 7 4.6.5 50 55 Action taken to control 9 3.4, 3.6 56 57 Drawdown capacity 2 -
The results of the Questionnaire are given in Appendix C, with summary plots given in this volume. For a number of cases the dam owner was visited to obtain more detailed information on the incident, with this given in Appendix D.
1.5.4 Expert elicitation Elicitation is a process whereby quantitative estimates of the variables of interest (62 questions), with an associated uncertainty band, are made by experts. This is discussed further in Appendix E. Although it was originally intended to have one session with four experts, discussions with the facilitator suggested a larger number of experts would be preferable. Moreover the results of the first session had significant scatter, so it was decided to repeat the elicitation with two additional experts and preceded by a discussion of the factors governing the variables of interest. The expert elicitation therefore comprised two meetings on 14th March and 21st July 2003, with eleven experts as follows:- Experts Individuals Remarks Steering Group Panel AR Millmore, Reilly Steering group owners� representatives
Dutton, Robertshaw
KBR Panel AR Engineer Brown, Gosden, Hewlett, Hughes KBR Supervising Engineer Bruggemann Academic Peter Vaughan, Paul Tedd Attended second
session only The groups of questions posed are summarised in Table 1.4.
TASK B EARLY DETECTION OF INTERNAL EROSION RESERVOIR SAFETY ADVICE FEASIBILITY REPORT DEFRA RESEARCH CONTRACT
02/11/2004 2:20 PM 10 of 70 L:\EWE_Operations\UK_D&W\XU0248 - Defra research\201 Task B Internal eroison\Stage 1 - Feasibility Report\Task B FINAL- on Defra web site\Vol 1\Task B Main text 05 Website.doc
Table 1.4 : Summary of questions adopted for elicitation exercise
Question Number of Units for response Results presented in numbers questions Figure Table
Puddle Clay Homogenous 1-11 Calibration questions, to calibrate accuracy
and informativeness of experts 11
12-31 % of UK dams with �ongoing� leakage, and internal erosion
6 % of whole population 4.1, 4.3 4.2, 4.4 4.8
Average leakage, erosion rates 2 4.17, 4.18 32-46 Quantify
• minimum detectable flow rate 17 Whole population 4.18
• dam critical flow 4.19 • rate of deterioration i.e. ongoing to
progressive internal erosion 4.20 4.21
47 � 57, 72-74
Contributory factors to rate of progression 7 Changes from a notional baseline dam
4.22- 4.24 No questions 4.11
58-71 Chance nodes in event tree 8 For all incidents of progressive internal erosion
4.5, 4.25 4.6 4.8, 4.13
Total 40
TASK B EARLY DETECTION OF INTERNAL EROSION RESERVOIR SAFETY ADVICE FEASIBILITY REPORT DEFRA RESEARCH CONTRACT
02/11/2004 2:20 PM 11 of 70 L:\EWE_Operations\UK_D&W\XU0248 - Defra research\201 Task B Internal eroison\Stage 1 - Feasibility Report\Task B FINAL- on Defra web site\Vol 1\Task B Main text 05 Website.doc
1.5.5 Instrumentation and monitoring systems
Identification of candidate systems has included consultation with manufacturers, as described in Appendices F and G.
1.6 Acknowledgments The project benefited from a Steering Group to advise Defra, appointed at the suggestion of KBR, which comprised:
Jim Millmore � Chairman Babtie Group David Dutton British Waterways Andrew Robertshaw Yorkshire Water Nick Reilly Independent
We would like to thank both the Steering group and the following who participated in the Expert Elicitation workshops: Prof. Peter Vaughan, Dr Paul Tedd. The contribution of Prof Vaughn in provision of a detailed commentary on some of the issues; and Prof Fell of Australia in providing copies of research work on internal erosion are gratefully acknowledged.
TASK B EARLY DETECTION OF INTERNAL EROSION RESERVOIR SAFETY ADVICE FEASIBILITY REPORT DEFRA RESEARCH CONTRACT
02/11/2004 2:20 PM 12 of 70 L:\EWE_Operations\UK_D&W\XU0248 - Defra research\201 Task B Internal eroison\Stage 1 - Feasibility Report\Task B FINAL- on Defra web site\Vol 1\Task B Main text 05 Website.doc
2 CHARACTERISTICS OF UK DAMS
2.1 Data in BRE database There are some 2600 reservoirs which fall within the ambit of the Reservoirs Act 1975, of which about 2100 are embankment dams. There has been a long history of dam construction in the UK with a summary of some of the main events affecting reservoir safety summarised in Table 2.1. It can be seen that modern standards of design and construction have only been available for less than 25% of UK dams. There is a wide diversity of dams in the UK that comes under the ambit of the Act in terms of age, size, method of construction and ownership. The distribution of British dams in terms of the date of construction and height of dam are illustrated in Tables 2.2 and 2.3; the former including the reservoir capacity. The predominance of small dams should be noted. This is important as it affects the resources which the dam owner is willing to make available to improve dam safety and means that in some cases the owner is a private individual with no 24 hour �operations room� into which data from a real time monitoring system could be fed. The totals of the various types of embankment dam are summarised in Table 2.4.
Table 2.1 : Chronology of main events relating to dam safety in UK
Number of dams in UK
1925 Last dam failure causing loss of life 1,500 1930 Reservoirs (Safety Provisions) Act 1,600 1960 Soil Mechanics formalised as science 2,100 1966 Recognition of cracking by hydrofracture 1974 Flood Studies Report issued - start of modern hydrological techniques 2,300 1985 Reservoirs Act, 1975 2,500
Table 2.2 : Distribution of characteristics of all embankment dams
Percent of dam population Note 1 10% 25% Median 75% 90% Date completed: prior to 67% 1808 1851 1890 1940 1975 Height (m); less than 78% 2.5 4 7 13 21 Reservoir capacity (1000m3); less than
87% 32 60 160 700 2800
1. % of dams for which this data is available
Table 2.3 : Distribution of embankment dam height and age
Height Total Date of construction <15m >=15<30m >=30m Not known <1840 216 13 0 25 254 >=1840<1960 609 287 37 58 991 >=1960 193 36 27 20 276 Not known 327 24 2 232 585 Subtotal 1345 360 66 335 2106
TASK B EARLY DETECTION OF INTERNAL EROSION RESERVOIR SAFETY ADVICE FEASIBILITY REPORT DEFRA RESEARCH CONTRACT
02/11/2004 2:20 PM 13 of 70 L:\EWE_Operations\UK_D&W\XU0248 - Defra research\201 Task B Internal eroison\Stage 1 - Feasibility Report\Task B FINAL- on Defra web site\Vol 1\Task B Main text 05 Website.doc
Table 2.4 : Subdivision of UK embankment dams into types and dam life years
Dams in existence in 2000
Total dam life years (> 5 years old)
Number % of total Pre 1975 1975-2000 Concrete core dams 26 1% 779 1,354 Homogeneous Earthfill dams 1,023 49% 88,272 21,308 Other Earthfill dams 264 13% 15,444 5,280 Puddle clay core dams 735 35% 62,857 18,232 Rolled clay core dams 56 3% 214 1,138 Total for all UK embankment dams 2,104 167,566 47,312
2.2 Features relevant to detection of internal erosion
There are a number of features which are common to a significant number of UK dams which have an important influence on the ease of detection of internal erosion. These are summarised in Table 2.5.
Table 2.5 : Features which have an important influence on the ease of detection of internal erosion.
Feature Problem Remarks �Puddle� (homogenous material)
a) �Puddle� is a process which does not necessarily involve imported clay i.e. many �puddle core� dams would actually be homogenous in terms of material
b) The puddle was not always in a core i.e. some dams may have had the upstream face puddled following canal practice.
a) Need clarity between �puddle core dam� �puddle face� and �puddle clay core dam� It is likely that much of the data on dam type in the BRE database is ambiguous and is inconsistent in differentiating between these forms of construction
b) Example of �b� is quoted by Vaughan as Aldenham dam near Watford, built to provide compensation water for the Grand Union canal
Dams on permeable foundation
Cannot see changes in seepage Stronger case for instrumentation e.g. temperature sensing
Small dams
The downstream face and crest have often become woodland; which a) significantly affects the ease of
visual detection of internal erosion
b) means pore pressures within the embankment are significantly affected by transpiration from the trees
Culverts through dams
Some old dams have outlet works (and spillways) draining into a culvert, which is within the body of the embankment
This is likely to be a preferential path for internal erosion
Pipes through dams
In small old dams these are sometimes open jointed clay pipes
The joints are likely to be a preferential path for internal erosion
TASK B EARLY DETECTION OF INTERNAL EROSION RESERVOIR SAFETY ADVICE FEASIBILITY REPORT DEFRA RESEARCH CONTRACT
02/11/2004 2:20 PM 14 of 70 L:\EWE_Operations\UK_D&W\XU0248 - Defra research\201 Task B Internal eroison\Stage 1 - Feasibility Report\Task B FINAL- on Defra web site\Vol 1\Task B Main text 05 Website.doc
3 CURRENT PRACTICE IN MANAGING INTERNAL EROSION
3.1 Introduction This section summarises the available data on current practice in monitoring and detecting internal erosion. It is based on the responses to the questionnaire (Appendix C) and informal discussions with a number of dam owners. The opinions revealed by Questions 2 to 6 of the Questionnaire are summarised in Appendix C, as follows:-
• Table C1 � by category of respondent • Text Section C.5
3.2 Surveillance
Current practice in relation to Surveillance in UK can be assessed from the questionnaire as follows, being also shown graphically on Figures 3.1 and 3.2. Q25 – what was the elapsed time between the last surveillance visit and the near miss incident being detected Although 34 incidents were reported, this question was only answered for 21 of them. For these incidents the last surveillance visit occurred in 43% of cases one day or less; in 52% two days or less and in 76% one week or less. Views on the required frequency of visits were also indicated as follows: Q3 – What frequency of visual inspection is required to forestall a Level 2 incident (emergency drawdown) due to Internal erosion? Overall 35% of respondents suggested to be effective visual inspection is required every 2 days or more frequently, whilst 35% suggested weekly, with scatter around these values. The Panel AR engineers employed by consulting engineers had a greater proportion (45%) who considered every 2 days or more frequently was necessary. In Australia recommendations in relation to the frequency of surveying are set out in the �Guidelines on dam safety management� (August 2003, 2nd Edition), being based on the consequence class. The key elements of the guidelines are reproduced in Appendix B. For the highest dams the recommended default value is daily, although a note to the table states that the frequency may be increased or reduced taking into account the risk posed by the dam, referring to Pattle et al (1999) as an example of such a process.
TASK B EARLY DETECTION OF INTERNAL EROSION RESERVOIR SAFETY ADVICE FEASIBILITY REPORT DEFRA RESEARCH CONTRACT
02/11/2004 2:20 PM 15 of 70 L:\EWE_Operations\UK_D&W\XU0248 - Defra research\201 Task B Internal eroison\Stage 1 - Feasibility Report\Task B FINAL- on Defra web site\Vol 1\Task B Main text 05 Website.doc
3.3 Instrumentation The opinions revealed by the Questionnaire are summarised in Appendix C,
• Table C1 by category of respondent • Table C2 by type of dam • Text Section C.3 • Table 3.1 summarises the responses to the various questions on instrumentation
(Q6, 22, 41, 42, 46, 49) Seepage quantity, turbidity and visual inspection were considered to be of high value, settlement monitoring of medium value and piezometers of low value. For dams where near-miss incidents had occurred instrumentation was installed as follows:-
Percentage of dams with at least one instrument
Settlement monitoring points 41% Standpipe piezometer 30% Other forms of piezometer 3% V-notch weir 18%
Issues which were not probed in the questionnaire (due to the need to restrict its length) and may be relevant to this project were a) the usage and value of hand held equipment e.g. crack gauges, thermometer b) how the number and type of instrumentation, and frequency of reading, varies with
dam consequence category, height or age. c) the reliability of existing instrumentation
3.4 Control of internal erosion The dam industry reported current practice in closed question 50 and open question 55. The responses to the questions are shown in tabular form in Appendix C together with a summary of the responses to open questions. The most common measure to control internal erosion was to lower the reservoir (73%), with this generally being effective (although 9% reported it as having no effect). Placing a filter downstream was reported by 12%, and dumping material into the reservoir by 6%.
Table 3.1 : Opinion of UK dam industry on different forms of instrumentation
A: Opinion of UK dam industry on value of different types of instrumentation (Q6)Standpipe piezometer
C: Instrumentation installed in dam (Q41)Number Standpipe
piezometersOther forms
of piezometerSettlement monitoring
points
V notch or other
quantification of seepage
0 to 0 59% 59% 38% 56%1 to 1 0% 0% 0% 6%2 to 2 0% 0% 0% 12%3 to 5 15% 0% 6% 9%
6 to 10 3% 3% 24% 0%11 to 15 6% 0% 3% 0%16 to 20 3% 0% 6% 0%
>20 3% 0% 12% 3%Blank 12% 38% 12% 15%
D: Frequency of reading instruments (Q42)Frequency
(weeks)Standpipe
piezometersOther forms
of piezometerV notch or
other quantification of seepage
Frequency (weeks)
Settlement monitoring
points
0 to 0.5 6% 6% 6% 0 to 4 3%1.5 to 1 3% 0% 12% 5 to 8 0%2 to 2 3% 3% 0% 9 to 12 0%3 to 4 3% 0% 6% 13 to 16 3%5 to 8 0% 0% 0% 17 to 20 3%9 to 12 0% 0% 0% 21 to 25 6%
13 to 25 3% 0% 0% 26 to 52 24%>25 12% 0% 6% >52 3%
Blank 71% 91% 71% Blank 59%
E: Indication of internal erosion prior to incident (Q46)Seepage: Quantity
F : Change in frequency of reading following incident (one year later; Q49)2= twice as often Surveillance Piezometers Seepage
measurementSettlement
<=1 56% 18% 24% 35%1.01 to 1.25 0% 0% 0% 0%1.26 to 1.5 3% 0% 0% 0%1.51 to 1.75 0% 0% 0% 0%1.76 to 2 18% 6% 6% 3%2.01 to 2.5 0% 0% 0% 0%2.51 to 5 0% 6% 6% 3%>5 0% 9% 15% 9%Blank 24% 62% 50% 50%
L:\EWE_Operations\UK_D&W\XU0248 - Defra research\201 Task B Internal eroison\Stage 1 - Feasibility Report\Task B FINAL- on Defra web site\Vol 2\Questionnaire B - Analysis of responses + annex figs feb 04 R06.xls 02/11/2004 14:24
TASK B EARLY DETECTION OF INTERNAL EROSION RESERVOIR SAFETY ADVICE FEASIBILITY REPORT DEFRA RESEARCH CONTRACT
02/11/2004 2:20 PM 17 of 70 L:\EWE_Operations\UK_D&W\XU0248 - Defra research\201 Task B Internal eroison\Stage 1 - Feasibility Report\Task B FINAL- on Defra web site\Vol 1\Task B Main text 05 Website.doc
3.5 Investigation of suspected internal erosion Historically the investigation of suspected internal erosion has been generally to • monitor leakage flows, including samples of seepage water to measure whether
particles are being eroded • carry out a site investigation to obtain information on the construction of the dam
(and appurtenant structures) • install piezometers to establish the phreatic surface and whether there are any
concentrated leaks. However, in recent years trials of other techniques of non-destructive investigation have been carried out on dams, as summarised in Table 3.2 (list and description of techniques given in Appendix F; some of the techniques may be used for both investigation and/or monitoring)
Table 3.2 : Status of trials of new techniques for investigating suspected internal erosion
Technique Status Remarks Temperature profile within dam
Developed in Germany since 1990 for leakage investigations from canals; used in UK since 2000 with British Waterways now being the sole UK agent (Dutton, 2002). Has been used on several UK dams and many canal embankment locations
In the right conditions can be very effective.
Infrared Thermography
Trial of camera used for assessing the thermal performance of buildings. Tedd & Hart 1998
Although it could detect surface temperature difference of 0.2oC, it was not possible to identify the source of the known wet areas on the downstream face of one dam
Acoustic Used on concrete faced rockfill dams
To be included in new ICOLD Bulletin on underwater repair techniques
Geophysical The EU funded IMPACT programme (Investigation of extreme flood processes and uncertainty; 2001-2004) includes as Theme 6 geophysical investigation of linear flood defence embankments; using Geoelectric, GPR, seismic and gravimetric
The research is in progress, with no results published to date
Resistivity has been trialled by at least two major UK dam owners (in 2000) to investigate the source of a concentred leak
Not published
Other trials are described in Appendix F, including systematic field and laboratory research in Canada
To be published, but probably on commercial basis to recoup research cost
TASK B EARLY DETECTION OF INTERNAL EROSION RESERVOIR SAFETY ADVICE FEASIBILITY REPORT DEFRA RESEARCH CONTRACT
02/11/2004 2:20 PM 18 of 70 L:\EWE_Operations\UK_D&W\XU0248 - Defra research\201 Task B Internal eroison\Stage 1 - Feasibility Report\Task B FINAL- on Defra web site\Vol 1\Task B Main text 05 Website.doc
3.6 Physical works arising from internal erosion incidents Details of techniques currently used as upgrades or remedial works following internal erosion are given in Questions 51 to 57 of the questionnaire (Appendix C). Question 54 suggests that site investigation was carried out in 40% of cases, the most common number of exploratory holes comprising 11 to 20 holes. Question 51 and 52 reveal that grouting was the most common works (26%), although in 15% of cases further works were then necessary. Question 57 reveals that in 6% of cases the drawdown capability was increased, to around to between 0.1 and 0.5m/day.
3.7 Promoting and maintaining good practice In UK management of internal erosion depends on
• The Panel system of individuals with sufficient experience of construction and operation of dams to intercede when things appear to be going wrong. These people are accredited by government (in effect by their peers)
• The system of Engineering Guides, and CPD of both dam owners and panel engineers through professional societies such as the British Dam Society.
Some owners also appoint independent panels to review proposals for physical works (although they are not usually involved in an emergency).
Figure 3.1 : Questionnaire case history data Frequency of surveillance visits to detect internal erosion (Q3, 25, 40)
0
1
2
3
4
5
6
7
80% 10% 20% 30% 40% 50% 60% 70% 80% 90% 100%
% of responses less than this
Freq
uenc
y of
sur
veill
ance
vis
its (d
ays)
Q3 To be able to have a reasonablereliability of detecting internal erosion in timeto forestall a Level 2 incident, in yourpersonal opinion: What frequency of visualinspection is required (use fractions of a dayif necessary)Q25 What was the elapsed time between thelast surveillance visit of the dam and theevent being detected?
Q40 What was the frequency of visits to thedam before the incident?
Figure 3.2 - Frequency of surveillance to detect a Level 2 incident by respondent (Q3)
0%
10%
20%
30%
40%
50%
60%
70%
0 to 0.5 0.51 to 1 1.01 to 2 2.01 to 3 3.01 to 4 4.01 to 5 5.01 to 7 >7
Minimum frequency of visits
perc
enta
ge o
f res
pond
ents
Dam Owners >15 Panel AR EmployeePanel AR OtherSup. Engineer Dam OwnerSup. Engineer ConsultantOverall
TASK B EARLY DETECTION OF INTERNAL EROSION RESERVOIR SAFETY ADVICE FEASIBILITY REPORT DEFRA RESEARCH CONTRACT
02/11/2004 2:20 PM 20 of 70 L:\EWE_Operations\UK_D&W\XU0248 - Defra research\201 Task B Internal eroison\Stage 1 - Feasibility Report\Task B FINAL- on Defra web site\Vol 1\Task B Main text 05 Website.doc
4 SYNTHESIS OF AVAILABLE THEORY AND CASE HISTORY DATA
4.1 Introduction Before considering ways in which the management of internal erosion can be improved, the objective of this project, it is necessary to first summarise current knowledge of internal erosion. This is carried out both in terms of available theory and in field observations (the empirical approach). This section of the report therefore a) sets out a system of definitions to be used for this project, based on both published
work by others and the Integrated System research contract by KBR. b) summarises current design guidelines for new dams c) describes case histories of internal erosion, with features relevant to defining
models of internal erosion (e.g. highlighting some of the complexities, where field observations support available models and where singularities may govern the process)
d) sets out a system of models of internal erosion to be used for this project. This system has been derived as a judgement by the KBR team working on this research project, building on published work by others.
e) summarises the current status of quantification of this model f) concludes by summarising the basis on which the options for a strategy for early
detection of internal erosion may be considered This Section should be read in conjunction with • Appendix B - a summary of a literature review. • Appendix C - the results of the questionnaire to UK dam professionals • Appendix D - detailed consideration of six case histories • Appendix E - the results of the expert elicitation exercise
In the text the results of the questionnaire and expert elicitation are prefixed by Q and E, to differentiate the two set of question numbers.
TASK B EARLY DETECTION OF INTERNAL EROSION RESERVOIR SAFETY ADVICE FEASIBILITY REPORT DEFRA RESEARCH CONTRACT
02/11/2004 2:20 PM 21 of 70 L:\EWE_Operations\UK_D&W\XU0248 - Defra research\201 Task B Internal eroison\Stage 1 - Feasibility Report\Task B FINAL- on Defra web site\Vol 1\Task B Main text 05 Website.doc
4.2 Definitions It is important to provide a consistent set of definitions of the factors affecting internal erosion, to provide clarity of thinking in issues such as differentiating causes from effects, and the different mechanisms of deterioration. Definitions used in this report are summarised in Tables 4.1 to 4.4.
Table 4.1 : Key terms relating to Internal erosion
Term Definition Source Seepage Slow uniform flow of water through a porous medium. Section 3.4.1 of Leakage Concentrated, uncontrolled flow of water through a
crack or defect. Johnston et al (1999)
Internal erosion
The removal of solid material, usually in suspension, from within an embankment or its foundation by the flow of water (thus excludes solution of material)
Charles (1998)
Table 4.2 : Different types of internal erosion (after Charles, 1998)
Piping a) A process that starts at the exit point of seepage and where a continuous passage or pipe is developed in the soil by backward erosion. When the pipe approaches the source of water there is a sudden breakthrough.
b) The hydraulic gradient at the point where the water flows out of the ground is critical, but is difficult to predict as it depends on localised weaknesses in the fill. Cohesionless soils, particularly fine sands and silts are most susceptible.
c) Usually commences on the downstream surface of the embankment slope Suffusion Mass erosion in soils which are internally unstable. Fines are transported by
seepage flow between the larger sizes of the embankment fill or the foundation soils and the process may lead to either an accumulation of fines in some part of the fill, or fines being taken entirely out of the embankment
Concentrated leaks
In cohesive soils which are capable of sustaining an open crack, concentred leaks may occur with erosion of soil particles along the sides of a crack. The crack may be caused by a) Hydraulic fracture, b) Preferential flow paths (inhomogeneous core, interface between layers) c) Hydraulic separation between fill and structure d) Collapse settlement on saturation (possibly leading to wet seams) Erosion may either be along the interface, or into an open crack or joint in the conduit wall
TASK B EARLY DETECTION OF INTERNAL EROSION RESERVOIR SAFETY ADVICE FEASIBILITY REPORT DEFRA RESEARCH CONTRACT
02/11/2004 2:20 PM 22 of 70 L:\EWE_Operations\UK_D&W\XU0248 - Defra research\201 Task B Internal eroison\Stage 1 - Feasibility Report\Task B FINAL- on Defra web site\Vol 1\Task B Main text 05 Website.doc
Table 4.3 : Terms relating to the process of internal erosion
(as Table 2.3 of Integrated System Research Report, with some additions specific to internal erosion)
Term used in this report (alphabetical order)
Definition
Contributory factor
Factor which affects the outcome of the application of a mechanism of deterioration (includes Intrinsic condition, operating regime)
Incident Detectable change in Indicator causing sufficient concern to lead to some action (Levels 1 to 4 as shown in Table C2)
Indicator(s) Measurable outcome from the application of a mechanism of deterioration e.g. deformation, seepage, instrumentation results.
Intrinsic condition of dam
Current physical property or dimension of the dam which can be measured and which affects the outcome of the application of a mechanism of deterioration. Although initially determined by construction details; this may change with time due to ageing, neglect, maintenance or upgrading.
Failure Uncontrolled sudden large release of water Failure mode(s) Means by which a failure (uncontrolled sudden large release of water) may
occur Mechanism(s) of deterioration
Process by which the integrity of the dam is undermined. The mechanism can have a quantitative threshold above which deterioration is likely to occur e.g. slope protection designed to withstand waves due to 100 year wind
Threat(s) Random Event (External threat) or Potential Internal Instability (Internal threat) that poses a threat to the integrity of the dam
Stages in mechanism of deterioration Initiation Subdivided into two stages
a) pathway for internal erosion initiated b) internal erosion initiates
Continuation Erosion either controlled/ terminated by a filter, or other protective feature, or continues
Progression Backward erosion of �piping�, or enlargement of concentrated leak Failure Breach mechanism forms
Table 4.4 : Definitions of contributory factors to internal erosion
Dispersive soils Clay soils which disperse or deflocculate in the presence of relatively pure water
TASK B EARLY DETECTION OF INTERNAL EROSION RESERVOIR SAFETY ADVICE FEASIBILITY REPORT DEFRA RESEARCH CONTRACT
02/11/2004 2:20 PM 23 of 70 L:\EWE_Operations\UK_D&W\XU0248 - Defra research\201 Task B Internal eroison\Stage 1 - Feasibility Report\Task B FINAL- on Defra web site\Vol 1\Task B Main text 05 Website.doc
4.3 Current practice for design of new dams
4.3.1 Embankments Current practice for the design of new embankments against internal erosion is summarised in the form of key technical papers in Table 4.5, and in terms of physical measures in Table 4.6. Historically the following have also been adopted at various points in time, but less emphasis is put on them at the present day:- i) minimum width of clay in relation to head ii) place the clay wet of optimum such that positive pore pressures develop in the
core, greater than the reservoir head, to reduce the risk of hydraulic fracture iii) incline the core, with the core at the base of the dam upstream of that at the
crest, to increase stresses within the core and thus reduce the risk of hydraulic fracture
Table 4.5 : Key references for design of filters for new dams
Author Date Title, publication Remarks ICOLD 1994 Embankment dams: granular
filters and drains. Review and recommendations. Bulletin 95
Includes good literature reviews and set of main references in this area
US Soil Conservation service
1986 Engineering Guide for determining the gradation of sand and gravel filters. Soil Mechanics Note No 1.210-VI
Based on new laboratory tests, also published in papers by Sherard et al, 1985, 1984 (two)
Kenny & Lau
1985 Internal stability of granular filters. Canadian Geotech J.
Alternative approaches to evaluate the safety of broadly graded materials against suffusion are given in Lafleur (1987)
Sherard 1989 Critical filters for impervious soils J Geotech Eng. ASCE. July
Vaughan (1982) has suggested an alternative approach based on permeability of the filter
US Soil Conservation Service
1991 Engineering Guide for the use of geotextiles. Design Note No 24
TASK B EARLY DETECTION OF INTERNAL EROSION RESERVOIR SAFETY ADVICE FEASIBILITY REPORT DEFRA RESEARCH CONTRACT
02/11/2004 2:20 PM 24 of 70 L:\EWE_Operations\UK_D&W\XU0248 - Defra research\201 Task B Internal eroison\Stage 1 - Feasibility Report\Task B FINAL- on Defra web site\Vol 1\Task B Main text 05 Website.doc
Table 4.6 : Features normally included in design of new embankment dams
Design Feature Purpose Remarks 1 Specification of
characteristics of material downstream of watertight element (filter)
To block any internal erosion in the event that a pathway has been initiated
The rules for filter design are not universally agreed, with some of the contentious issues described in ICOLD Bulletin 95 (1994)
2 Crack filling fine sand upstream of the impervious element
Wash into any pathway and block flow
3 Providing adequate drainage capacity
a) To ensure that seepage emerges in a controlled way through graded materials, rather than in an uncontrolled fashion on the downstream face of the embankment
b) To prevent saturation of the downstream shoulder
4 Limiting exit gradients to avoid piping modern practice would use zoned fills including filters rather than relying on this, because of the uncertainty over what constitutes tolerable gradients
5 Providing a clean granular soil layer on top of the core which acts as a �capillary break�.
To prevent drying out of the core due to evaporation, which is exacerbated where there is a grass cover
This caused serious leakage of the King George Fifth bank of Thames Water in the aftermath of the long partial drawdown adopted as a precaution after the �Dam Busters� raid (Bishop, 1946).
TASK B EARLY DETECTION OF INTERNAL EROSION RESERVOIR SAFETY ADVICE FEASIBILITY REPORT DEFRA RESEARCH CONTRACT
02/11/2004 2:20 PM 25 of 70 L:\EWE_Operations\UK_D&W\XU0248 - Defra research\201 Task B Internal eroison\Stage 1 - Feasibility Report\Task B FINAL- on Defra web site\Vol 1\Task B Main text 05 Website.doc
4.3.2 Appurtenant works through embankments There is no single publication setting out good practice in the design of pipes and culverts through embankment dams. Current design practice to prevent internal erosion associated with appurtenant works to new dams includes the features summarised in Table 4.7.
Table 4.7 : Features normally included in design of new appurtenant works through embankment dams
Design Feature Purpose 1 Wherever possible route draw off works
through tunnel in abutment Insitu abutment would normally be non-erodible rock, such that the material surrounding the tunnel would not be susceptible to internal erosion
2 Where a pipe or culvert is unavoidable, locate within a second culvert
So that the reservoir head cannot be in direct contact with the embankment fill
3 Detail the pipe or culvert, where it passes through the core, to have sloping sides with a greater width at the base,
To ease compaction of the interface and thus reduce the risk of low contact pressures
4 Detail a filter and drain around the pipe downstream of the core, as for the embankment.
To block any material being carried along the interface between the appurtenant works and adjacent fill
4.3.3 Areas of uncertainty
There are number of areas where current design practice is not well established, including:-
a) the influence of water chemistry on causing blockage of filters and drains (e.g. precipitation of dissolved minerals due to a reduction in pressure on exiting into atmospheric pressure from within the body of the dam or foundation)
b) the importance and influences of bacteriological growth on the performance of filters and drains
TASK B EARLY DETECTION OF INTERNAL EROSION RESERVOIR SAFETY ADVICE FEASIBILITY REPORT DEFRA RESEARCH CONTRACT
02/11/2004 2:20 PM 26 of 70 L:\EWE_Operations\UK_D&W\XU0248 - Defra research\201 Task B Internal eroison\Stage 1 - Feasibility Report\Task B FINAL- on Defra web site\Vol 1\Task B Main text 05 Website.doc
4.4 Case history data: practical observations relevant to progressive internal erosion 4.4.1 Introduction
This section summarises the key case history data on
a) the prevalence of internal erosion b) features that complicate detection of internal erosion
4.4.2 Prevalence and location of internal erosion Data is available from the questionnaire (Appendix C) and Elicitation (Appendix D) on the prevalence and location of internal erosion is summarised in Table 4.8.
Table 4.8 : Prevalence and location of leakage and internal erosion
Questionnaire (Tables C1, C2)
Elicitation1
Prevalence of leakage; by location - Figures 4.1, 4.2 Along or into a structure - 10%, 5% Embankment - 9,% 11% Embankment into foundation - 6%, 3% Foundation - 8%, 5%
(foundation) 1. For puddle clay, homogenous respectively 2. The number of serious internal erosion incidents a year is given in Table Annex
2.3 and is estimated as three Level 2 (emergency drawdown) incidents a year, and 10 Level 3 (precautionary drawdown) incidents a year. These represent 0.2% and 0.5% of the stock of 1800 UK embankment dams.
In terms of the prevalence of seepage Brown and Gosden (2000) report that over 50% of a portfolio of small dams had longstanding visible seepage, with the most common seepage probably being foundation seepage, where the original design either had no cut-off, or an inadequate cut-off, and seepage is occurring in relatively stable foundation strata. Where changes in seepage have occurred which have required action, this was most often associated either with seepage along, or in the vicinity of, structures, or along the embankment foundation interface, or with tree roots. They consider these percentages are not surprising when viewed in relation to the age, and thus form of construction of these dams, which will not have incorporated internal filters and drains.
TASK B EARLY DETECTION OF INTERNAL EROSION RESERVOIR SAFETY ADVICE FEASIBILITY REPORT DEFRA RESEARCH CONTRACT
02/11/2004 2:20 PM 27 of 70 L:\EWE_Operations\UK_D&W\XU0248 - Defra research\201 Task B Internal eroison\Stage 1 - Feasibility Report\Task B FINAL- on Defra web site\Vol 1\Task B Main text 05 Website.doc
The elicitation suggests that the prevalence of leakage is typically about 10 to 20% of UK dams, with internal erosion occurring at 10 to 20% of these. The issue of which mechanism of internal erosion is prevalent is interesting. It could be argued that piping is only likely to affect new dams, as with old dams any vulnerability to piping would have been exposed in the first few years of their lives. Related issues are how the three types of internal erosion are differentiated in the field, whether the UK dam industry uses the terms as defined in Table 4.2 and thus whether the data available is reliable. All that can be concluded is that concentrated leaks predominate, but that the other two types probably also occur.
4.4.3 Dispersive soils and soil erodibility The definition of a dispersive soil is given in Table 4.4. This is an important subject area because it affects how rapidly erosion would occur in the event that a leakage path was formed. The erodibility depends on the combination of clay and water chemistry, with dispersive soils eroding much more rapidly than non-dispersive. Laboratory tests reported in Atkinson, Charles & Mhach (1990, QJEG, 23, pp103-108) showed that of puddle clays from four UK dams tested using a new �Cylinder Dispersion test� one (a puddle clay from South Wales) was dispersive when both the pore water and free water were water from the reservoir. Further information on dispersive clays is given in ICOLD Bulletin No 77 (1990). Question 38 of the questionnaire asked for details of any dispersion testing that had been carried out. All but one of the responses to the questionnaire reported that no testing had been carried out. The one set of results available wee from an author of this report, where results from a commercial laboratory on Hythe Clay showed it was mildly dispersive. Vaughan (Pers comm., 2003) notes that as far as he is aware dispersive soil water combinations are very rare in Britain. The only instance he has come across was a laminated pro-glacial soil with layers of fine silt and clay at Osmotherly on the N York moors. It formed the foundation of the dam. This soil would disperse in distilled water without using a dispersant. It was highly erodible. Research underway in Australia (Wan, Fell, Foster, 2002) involves a modified pin-hole test where a 6mm diameter hole is drilled along the axis of a sample prepared in a standard compaction mould, and the rate of erosion measured. They report that the rate of erosion between different soils can vary by up to 106 times (see Section 4.6.4). The extent to which UK clays would test positive to the standard dispersion tests remains open. On the one hand there is limited evidence to suggest there may be some dispersive clays. On the other hand practical experience over the last few decades suggests it not a common problem. The issue of testing the erodibilty of soils is discussed further in Section 6.
TASK B EARLY DETECTION OF INTERNAL EROSION RESERVOIR SAFETY ADVICE FEASIBILITY REPORT DEFRA RESEARCH CONTRACT
02/11/2004 2:20 PM 28 of 70 L:\EWE_Operations\UK_D&W\XU0248 - Defra research\201 Task B Internal eroison\Stage 1 - Feasibility Report\Task B FINAL- on Defra web site\Vol 1\Task B Main text 05 Website.doc
4.4.4 Effectiveness of downstream shoulder fill as filter To be effective as a filter the downstream shoulder material must a) have a suitable grading to trap fines being eroded from the core b) be non-cohesive, so it cannot sustain an open crack The filter performance can be examined by drilling and sampling. A more convenient and supplementary method is to measure permeability in-situ (Vaughan, 2000b). If long piezometers with sand pockets are used a complete vertical profile of permeability could be attained from a few holes. However, conclusively establishing whether the material is non-cohesive is less straightforward. Vaughan (Pers Comm, 2003) a) suggests that many old transition fills are good filters, (but there is little other
published data on this). b) reports that new filter drains can be installed using slurry trench techniques. The
trench is formed in the usual way and filled with the granular filter by a tremmie pipe. A polymer mud is used which self-destructs in a few days, leaving loose sand which is densified by vibration. In New Zealand a connection was drilled from the diversion tunnel to the finished tunnel to ensure drainage (paper in waterpower).
4.4.5 Seepage and interpretation of pore pressure readings
In recent years it has been realised that seepage regimes can be more complex than a simple linear seepage model, due to a) dependence of permeability on effective stress, pore pressure and insitu structure
(e.g. Vaughan in his 1994 Rankine lecture presents observations of non-linear seepage due to this effect, including several different forms of non-linear pore pressure distributions across a dam core)
b) interaction of evaporation, transpiration and rainfall to provide unexpected behaviour in terms of both the position of the top of the saturated zone, and pore pressures in the partially saturated zone (e.g. Vaughan, 1994; Blight, 1997; Vaughn Kovacevic & Ridley, 2002).
�b� includes that a dam with a downstream fill of comparable or lower permeability than the average annual rainfall will develop high downstream pore pressures because of rainfall infiltration. Piezometric heads to within 2 to 3m below the slope surface can develop. This has nothing to do with seepage from the reservoir. A variation on this is if there is an impermeable layer within the fill, this may act as an aquaclude. A spring line may then develop on the downstream slope just above the aquaclude. Proving that this has nothing to do with the reservoir can be difficult. Further difficulties in the interpretation of pore pressures arise from old rubble or pipe drains, which are either not known to be present, or are known to be present but in unknown locations. These may result in local drainage; alternatively collapse and blockage of a pipe drain can force the flow in it to the surface, giving the appearance of a new spring. These highlight the need for caution in interpreting pore pressure readings
TASK B EARLY DETECTION OF INTERNAL EROSION RESERVOIR SAFETY ADVICE FEASIBILITY REPORT DEFRA RESEARCH CONTRACT
02/11/2004 2:20 PM 29 of 70 L:\EWE_Operations\UK_D&W\XU0248 - Defra research\201 Task B Internal eroison\Stage 1 - Feasibility Report\Task B FINAL- on Defra web site\Vol 1\Task B Main text 05 Website.doc
4.4.6 Interpretation of settlement In principle there are the following potential causes of ongoing settlement after a dam has reached seepage equilibrium:- a) cyclic loading of dam due to varying reservoir level b) creep c) internal erosion The following text is based largely on contributions from Vaughan (pers comm., 2003). The first cause occurs in a dam with a reasonably permeable upstream shell in which water pressures go up and down with the reservoir. Effective stresses go up during drawdown and down again during re-impounding. The cyclic soil deformation is not elastic. The dam settles during drawdown but does not recover all the settlement on re-impounding. There is ongoing long-term settlement due to this effect (Tedd, Charles, Holton & Robertshaw, 1997; Kovacevic, Charles, Potts, Tedd & Vaughan, 1997; Vaughan, Chalmers & Mackay, 2000). The settlement is likely to be consistent across the valley, varying with dam height. Settlement is likely to be linear if plotted against the cumulative depth of drawdown (Vaughan, Chalmers & Mackay, 2000). Settlement will be much larger in old uncompacted fills than in newer compacted dam fills. Long term settlement is often attributed to creep. While creep does sometimes occur, settlement due to cyclic impounding is more probable. With occasional rather inaccurate field measurements the two cannot be differentiated. Detailed observations (Tedd, Charles, Holton & Robertshaw, 1997) show that movement corresponds to reservoir level change. Vertical movement is negligible while the reservoir level is constant The third cause of settlement is due to loss of material by internal erosion. Non-cohesive soils cannot sustain an opening under water; they collapse. Settlement is likely to take the form of a sink hole. There may be little sign of a sink hole until it actually breaks the surface. The diameter of the pipe below the sinkhole may be no more than 1m. In clays (cohesive soils) an erosion path can remain open up to a certain size. Generally stable settlement due to material loss is likely to take the form of a depression (Vaughan, 2000b). The depression is likely to spread over a length approximately given by lines at 60o to the horizontal from the point of soil loss upwards to the surface. Depressions are likely to be local to points of soil loss and not to affect the dam crest along its whole length. With central clay core dams with non-cohesive shoulders, typical of UK puddle core dams, the core seems to develop a general depression in response to loss of material at depth. The hole in the core allows loss of upstream fill and a sink hole develops up the upstream boundary of the core, emerging on the crest or upstream face of the dam. The principal risk seems to be overtopping if the sinkhole lowers the crest sufficiently. This mechanism (or something like it) seems to have occurred in several British Dams, as shown in Table B.2 in Appendix B. The nature of failure if internal erosion of the core occurs is perhaps the greatest uncertainty in evaluating the safety of dams with central clay cores. Clearly the formation of a sink hole over the upstream boundary of the core can cause failure by overtopping, but does not necessarily do so. Further assessment of this risk is desirable.
TASK B EARLY DETECTION OF INTERNAL EROSION RESERVOIR SAFETY ADVICE FEASIBILITY REPORT DEFRA RESEARCH CONTRACT
02/11/2004 2:20 PM 30 of 70 L:\EWE_Operations\UK_D&W\XU0248 - Defra research\201 Task B Internal eroison\Stage 1 - Feasibility Report\Task B FINAL- on Defra web site\Vol 1\Task B Main text 05 Website.doc
If a dam is apparently vulnerable to this type of failure, then will accurate settlement measurements give effective early warning?
4.4.7 Change of embankment properties with time Finite element analyses of cyclic reservoir drawdown indicate that total stresses in a dam core go up when this is simulated; Kovacevic, Charles, Potts, Tedd, & Vaughan,1997; Vaughan, Chalmers & Mackay, 2000). There is intuitive sense in this since continuing strain and stress change is likely to anneal stresses, with low ones rising and high ones reducing. The result from analysis could be controlled by the assumptions assumed, although there is no evidence for this. Field data could be produced to examine this phenomenon. This and other phenomenon would be expected to change the density and moisture content of the various embankment fills with time. In particular it could be argued that the fills in older embankment dams which were constructed relatively loose, would consolidate with time such that their current density may not be significantly less than more modern equivalents.
4.4.8 Unprotected pipes and culverts Question 27 of the questionnaire (table C2 in Appendix C) shows that for the case histories provided those with the shortest time to failure were those associated with appurtenant works. This is consistent with the view that if internal erosion occurs in the body of a dam the shoulders may often act to slow, if not prevent failure. This emphasises that priority should be given to consideration of unprotected pipes and culverts, as indicated in the terms of reference for this project.
4.4.9 Mechanisms of failure, including singularities Back analysis of failures often shows that the initiating cause was often a number of interrelated effects, of which construction and other details not shown on typical sections played an important part. This is discussed further in Section 4.5.2.
TASK B EARLY DETECTION OF INTERNAL EROSION RESERVOIR SAFETY ADVICE FEASIBILITY REPORT DEFRA RESEARCH CONTRACT
02/11/2004 2:20 PM 31 of 70 L:\EWE_Operations\UK_D&W\XU0248 - Defra research\201 Task B Internal eroison\Stage 1 - Feasibility Report\Task B FINAL- on Defra web site\Vol 1\Task B Main text 05 Website.doc
4.5 Models of progressive internal erosion
4.5.1 General It is helpful to have some form of mapping of the process of internal erosion, which covers the overall process from events that initiate internal erosion through to credible mechanisms for failure (breach leading to uncontrolled release of a large quantity of water). As part of the previous Integrated System research project an �event train� and associated definitions was developed for internal erosion. This has been reviewed and extended as described below. It has been found that there is no one type of diagram which is ideal for showing the whole process. Some form of fault tree would have the benefits of
• a recognised convention for showing relationships and • quantitative relations between stages
However they cannot deal with cyclic or intermittent behaviour or �rates of deterioration� and do not show the complex relationship(s) between the process itself, contributory factors and indicators. On the other hand an event train, such as that used in the Integrated System has the advantages of flagging the contributory factors and indicators as well as the process (terminology in Table 4.3), but the disadvantage that it is only qualitative. An important point in building (and testing) any model for the processes of internal erosion is that for internal erosion to occur it is necessary to have all of:-
a) A supply of water b) A conduit for eroded fines to travel along c) An exit point where these fines can be discharged downstream of the dam d) Sufficient velocity (or stress conditions e.g. hydraulic gradient) for fines to be
eroded from the sides of the conduit The process diagram required for this aspect of internal erosion is more complex than those required for estimating the probability of failure, because of the need to include the dimension of time. It is concluded that the process is complex and best shown with a variety of techniques, to capture the complexity of the process, as follows:- Figure Title Remarks
4.7 Event train for internal instability of an embankment dam in service
a) Extended version of that in Integrated System. b) Shows contributory factors and indicators
4.9 Event tree for progression of internal erosion within embankment dam
a) Logic diagram of physical sequence. b) Separate diagrams required for each of the
three types of internal erosion listed in Table 4.2.
4.8 Time-based model of progressing internal erosion
Various sequential stages, similar to the four defined by Foster and Fell (2001). However, in practice any internal erosion may be intermittent, reacting to changes in reservoir level etc.
TASK B EARLY DETECTION OF INTERNAL EROSION RESERVOIR SAFETY ADVICE FEASIBILITY REPORT DEFRA RESEARCH CONTRACT
02/11/2004 2:20 PM 32 of 70 L:\EWE_Operations\UK_D&W\XU0248 - Defra research\201 Task B Internal eroison\Stage 1 - Feasibility Report\Task B FINAL- on Defra web site\Vol 1\Task B Main text 05 Website.doc
4.5.2 Effect of singularities Singularities are defined as those features of a dam which do not occur on the typical section drawing, but may have an important influence on the occurrence of internal erosion. These include
a) irregularities in the foundation e.g. local steepening to form a step to found a culvert
b) construction stage features, such as foundation drains c) reduced stresses at the interface between the embankment and appurtenant
structures (or pipes) through the dam d) variations in fill materials e) trial pits, or other localised excavations into the dam
Similarly repairs, or raising of a dam crest may create conditions which increase the risk of internal erosion, particularly at the interface of the new and old works. Thus although analysis, including sensitivity analysis, of �typical sections� is a key tool, consideration should also be given to what singularities may be present at a dam and the influences they may have on the occurrence of internal erosion.
4.6 Quantification of Concentrated leakage
4.6.1 General
This section summarises available information on quantification of elements of the internal erosion process model described in the preceding sub-section; including published papers and the results of the questionnaire and expert elicitation carried out as part of this study.
4.6.2 Initiation of Pathway - Hydraulic fracture
4.6.2.1 General In simple terms hydraulic fracture may be described as occurring when the horizontal reservoir pressure is greater than the sum of the cross valley total stress in the core and any tensile strength of the core. Although historically designers have attempted to reduce the likelihood of hydraulic fracture, it is now recognised that hydraulic fracture may occur even at well built dams and design is instead concentrated on blocking any erosion. Some of the papers summarising experiences of hydraulic fracture of clay cores and ways in which the likelihood of hydraulic fracture may be predicted include (in order of date of publication)
Author Date Title, publication Remarks Vaughan et al 1970 Cracking and erosion of the rolled
clay core of Balderhead dam and the remedial works adopted for its repair
Sherard 1986 Hydraulic fracturing in embankment dams. ASCE J Geotech Eng 112(10)
Many dams experience hydraulic fracture, but self heal due to swelling of core
In addition it is now recognised that in certain circumstances hydraulic fracture can occur in watertight elements other than clay e.g.. Brown & Bruggemann, 2002.
TASK B EARLY DETECTION OF INTERNAL EROSION RESERVOIR SAFETY ADVICE FEASIBILITY REPORT DEFRA RESEARCH CONTRACT
02/11/2004 2:20 PM 33 of 70 L:\EWE_Operations\UK_D&W\XU0248 - Defra research\201 Task B Internal eroison\Stage 1 - Feasibility Report\Task B FINAL- on Defra web site\Vol 1\Task B Main text 05 Website.doc
4.6.2.2 Features of hydraulic fracture
Reservoir water pressure induces hydro-fracture and contributes to crack and fissure stability. Indicators of hydraulic fracture are • a sudden development of flow when the crack forms at some depth below water
level ; • probably, a sudden sealing when the reservoir level is dropped a short way. The
latter is because a crack shuts as the pressure is reduced. The crack may still be well below the water level. The drawdown level at which leakage stops is not an indicator of the level of the leak.
The interaction of gravitational stress and reservoir seepage pressure is complex. Total stresses within a dam before impounding are often less than the eventual seepage pressure. Thus there is a potential for hydro-fracture. However, as impounding occurs and effective stresses change, the minimum stresses increase to values higher than seepage pressures and cracking does not occur. This may only be true of a thin zone on the upstream side of a core (Vaughan, 1987; Dounias et al, 1989 & 1996). The opposite occurs if pore pressures are high at the end of construction and decay by consolidation during and after impounding. Total stresses decrease with the decreasing pore pressure (Prentice, Fletcher &Tedd 1996). The margin against hydrofracture in the body of the embankment is unnervingly small, but it cannot be increased and it seems to be sufficient in the vast majority of dams. The cause of hydrofracture seems to be local zones of low stress caused by, for instance, arching of a narrow core or steep steps in an abutment, etc. Stress analysis has shown that the narrow puddle filled cut-off trenches used in early dams, which were significantly narrower that the cores themselves, would have been particularly prone to cracking by hydraulic fracture. Note that the trenches were often in fissured rock. While fissured rocks are very poor filters (Vaughan, 2000b), they are generally non-erodible. Thus leakage through a crack in puddle cannot increase and cause a rapid failure. A slow loss of puddle leading to settlement will occur. Sensitivity to the risk of hydrofracture can be assessed from geometry (the narrowness of the core, the presence of a puddle filled trench, the evenness of the longitudinal profile) backed by stress analysis. Repairs can be a source of cracking. They can cause stress changes which create a risk of potential hydro-fracture. If a repair offers a seepage path through the dam, some form of filter drainage protection is best added with the repair to ensure self-sealing. Reliance on backfilling and compaction alone is unwise. The same applies to significant changes to a dam such as raising. Extension upward of an old puddle core will involve a width to height ratio more slender than was adopted in the 19th century after the failures of the Bilberry and Dale Dyke dams and generally found satisfactory.
TASK B EARLY DETECTION OF INTERNAL EROSION RESERVOIR SAFETY ADVICE FEASIBILITY REPORT DEFRA RESEARCH CONTRACT
02/11/2004 2:20 PM 34 of 70 L:\EWE_Operations\UK_D&W\XU0248 - Defra research\201 Task B Internal eroison\Stage 1 - Feasibility Report\Task B FINAL- on Defra web site\Vol 1\Task B Main text 05 Website.doc
4.6.2.3 Near surface effects Points relating to the potential for occurrence of hydraulic fracture just below the maximum retention level (MRL) of the reservoir include a) the UK dam industry consider that the majority of incidents (82%) had an intake to
the erosion path within one metre of MRL (Q17 of questionnaire). It is accepted that this may be based on the evidence that the leak stopped when the reservoir was lowered by this amount; however for some of the dams remedial works would have been limited to the upper part of the dam with the fact that this remedied the leak suggesting that for some of the dams the leak was indeed at this elevation.
b) Fell (personal comm., 2003) considers that in some dams there is evidence, in the form of wet seams just below MRL, that there was saturation settlement of the clay on first filling, leaving a zone of low stress at MRL
c) Dornstadter (1997) presents data showing that at 3m and 5m depth in a dam the seasonal variation in temperature is typically 10 oC and 3oC (for surface variation of 20oC). This is likely to generate horizontal strains which may be sufficient to lead to an increased risk of hydraulic fracture in winter (and or hydraulic separation by structures); the table below showing reported values for the coefficient of thermal expansion (the thermal stress strain behaviour will be complicated, relating to both saturated and unsaturated behaviour)
300 Page 685 of Thomas & He (1995); quoted as coming from Ohnishi et al, 1987
Water 600 Cooke, 1987 d) In hot weather evaporation and transpiration from the surface of the dam will cause
moisture content changes to some depth, which will in the extreme cause shrinkage cracks
Understanding soil behaviour in the upper few metres of the dam is complex. It is understood that insitu measurements by BRE generally commenced at 5m depth, and as the measurements were on reservoirs with significant annual variation in water level this would have masked any seasonal changes in internal stresses.
4.6.2.4 Homogenous dams Homogenous dams should be less susceptible to hydraulic fracture, due to the flatter slopes giving higher stresses in the body of the embankment. However, if an apparently homogeneous dam has strong layering, this could cause problems. A thin permeable layer along which impounding pore pressures penetrate preferentially can promote hydraulic fracture. A pressure sufficient to cause fracture may be introduced in the crack. If impounding is sufficiently rapid for this to happen without general adjustment of the seepage pressures in the embankment centre to the new water level, increase of total stress in response to this will not occur and the cracking pressure will be lower. The effect of layering is likely to be worst at first impounding, or when impounding is more rapid than previously.
TASK B EARLY DETECTION OF INTERNAL EROSION RESERVOIR SAFETY ADVICE FEASIBILITY REPORT DEFRA RESEARCH CONTRACT
02/11/2004 2:20 PM 35 of 70 L:\EWE_Operations\UK_D&W\XU0248 - Defra research\201 Task B Internal eroison\Stage 1 - Feasibility Report\Task B FINAL- on Defra web site\Vol 1\Task B Main text 05 Website.doc
4.6.2.5 Summary Currently there are a variety of views on the prevalence and mechanism of internal erosion. In particular consideration of seasonal thermal strains in the upper part of the body of the embankment may provide a valuable increase in the understanding of mechanisms and if valid suggests that in terms of season the most vulnerable time for hydraulic fracture in the upper part of an embankment is late winter. However, the conclusions by Sherard (1986) as reproduced below are still considered valid: �concentrated leaks occur commonly throughout the impervious sections of embankment dams by hydraulic fracture without being observed�usually these concentrated leaks do not cause erosion, either because the velocity is too low or because the leak discharges into an effective filter. Subsequently the leakage channel is squeezed shut by swelling or softening of the embankment material forming the walls of the crack. In the typical case no measurable leakage emerges downstream, and there is no other indication that a concentrated leak developed and was subsequently sealed. This action probably occurs to some degree in most embankment dams�.
4.6.3 Initiation of internal erosion For simplicity this is covered with progression, as the conditions for both are similar, and best considered after the review of conditions for Continuation
4.6.4 Continuation Constraints on whether internal erosion continues once initiated, or whether it ceases, are a) whether the materials downstream of the impervious element (base soil) will act as
a filter to the eroded material. b) whether material from the upstream shoulder is washed in and blocks the erosion
path c) the reservoir is lowered, such that the erosion path closes under the reduced
reservoir load In this section only the first of these is considered. The main reference on filter design splits the base soil into four different types, as shown in Table 4.9.
Table 4.9 : US SCS Criteria for filters (1986)
Base soil Base soil description Filter criteria category % finer than
0.075mm* D � Filter d � base soil**
1 Fine silts and clays >85% D15 ≤ 9 d85 (but 0.2mm min)
2 Sands, silts, clays 40 � 85% D15 ≤ 0.7mm 3 Silty and clayey sands and
*after adjustment to be 100% passing 4.75mm sieve **for base soils 1 to 3 adjusted to be 100% passing 4.75mm sieve Filters are to have a maximum size of 75mm (to avoid segregation) and a maximum of 5% passing the 0.075mm sieve with the plasticity index of the fines equal to zero (to ensure the filter is non-cohesive i.e. will collapse to fill any cracks)
TASK B EARLY DETECTION OF INTERNAL EROSION RESERVOIR SAFETY ADVICE FEASIBILITY REPORT DEFRA RESEARCH CONTRACT
02/11/2004 2:20 PM 36 of 70 L:\EWE_Operations\UK_D&W\XU0248 - Defra research\201 Task B Internal eroison\Stage 1 - Feasibility Report\Task B FINAL- on Defra web site\Vol 1\Task B Main text 05 Website.doc
Vaughan (1982) suggests that the boundary of effective filtration is better defined by permeability, with a �perfect� filter being defined such that its permeability k = 6.1 x 10⁻⁶ δ1.42 in which k is in m/s and δ is in µm; with δ being the diameter of the smallest particle that can arise due to erosion. He argues (2000) that in general adoption of the SCS criteria (the �critical filter�) is less conservative than the perfect filter, particularly for sandy clays, but that �in plastic clays the critical filter may be finer than the perfect filter, a paradox since the perfect filter is based on a worst credible design approach�. With broadly graded soils it is not sufficient to consider only the d85 of the base soil, but also to consider whether finer fractions could be eroded leaving behind the coarser particles. Quantitative guidance is given in Lafleur (1987) and Kenny and Lau (1985). It is unknown whether the subdivision of soil into groups relevant to filter design would be directly relevant to initiation and progression of internal erosion, although similar forms of grouping would be expected to apply.
4.6.5 Progression (and initiation) of internal erosion
4.6.5.1 General There is little published data on the initiating conditions for (and rate of progression of) internal erosion once a pathway has been formed.
4.6.5.2 Wan et al, 2002 The only directly relevant paper is a report on laboratory tests in Australia by Wan et al (2002); the tests being as follow:-
Erosion test Slot Hole Laboratory sample
2.2mm wide x 10mm deep x 1m long slot inside a 0.15m wide x 0.1m deep x 1m long rigid sample box
6mm diameter hole in �standard compaction mould�
Head on inlet, outlet
2500mm, 300mm Variable 50-800mm; 100mm
Three parameters were defined, a) the �Coefficient of Soil erosion� Ce, where εt= Ce (τt - τc) b) the �Erosion rate index� I, where I= -log (Ce), and subscripts SET and HET
indicates that the value is determined from the Slot and Hole Erosion tests respectively
c) the �Critical Shear Stress�, τc , taken by the authors as the hydraulic shear stress corresponding to the minimum head at which erosion is first initiated (rather than extrapolating the plot of erosion rate vs. shear stress back to zero shear stress)
where εt is the rate of erosion per unit surface area of slot/ hole at time t (kg/s/m2) τt is the hydraulic shear stress along the slot at time t (N/m2) I varies from less than 2 (extremely rapid erosion) to greater than 6 (extremely slow erosion). A total of 157 tests were carried out on 13 different Australian and American soil types; with predictive equations for coarse and fine grained soils.
TASK B EARLY DETECTION OF INTERNAL EROSION RESERVOIR SAFETY ADVICE FEASIBILITY REPORT DEFRA RESEARCH CONTRACT
02/11/2004 2:20 PM 37 of 70 L:\EWE_Operations\UK_D&W\XU0248 - Defra research\201 Task B Internal eroison\Stage 1 - Feasibility Report\Task B FINAL- on Defra web site\Vol 1\Task B Main text 05 Website.doc
It was shown that τc tends to increase with Erosion rate index; figure 3 of the paper showing it going from zero at IHET of 2 to about 150kPa at IHET of 6. These are comparable with recommended permissible unit tractive forces for canals given in Figures 7.10 and 7.11 of Chow (1986), which vary from 1.4 to 90kPa. These equations are given in Table 4.10, together with an application of the test values to some typical UK soils. A sensitivity analysis of how the leakage rate, shear stress on the walls of the crack and rate of erosion varies with IHET and size of hole is presented on Figures 4.10 and 4.11. This confirms that the rate of erosion spans over several orders of magnitude It is noted that although the list of soils used (table 2 of paper) show two glacial tills (SM) the equations appear inappropriate for UK cohesive glacial tills, as the Balderhead core is shown as extremely resistant to erosion. Data is also available from the research report (Wan & Fell, 2002), obtainable from the University of NSW in Australia, with some results summarised in Appendix B. This includes that of the 13 soils tested, fine grained soils (clays) generally have an Erosion Rate Index of 3 or greater, whilst the coarse grained soils (clayey sands) have an Erosion Rate Index of 3 or lower. The sensitivity study considers the variation in the following to the width of a 1m high 3m long crack under 10m average reservoir head:-
Effect of width of crack on
Basis of estimate (Equation)
Results plotted on Figure
Comments
Leakage flow a) Reynolds number < 2000: Laminar flow between parallel plates; u = gSc2/12µ (Eqn 6.21 of Massey, 1989)
b) >2000 as turbulent flow. u2= 2mgS/f ; (Eqn. 7.2 of Massey, 1989) with f of 0.02; plus inlet/exit losses of 2.0 v2/2g
4.10
Average shear stress on sides of crack
τ = g m S; Eqn 3.3 of Wan and Fell, 2002b
4.10 This is average shear stress. Actual shear will vary with position.
Erosion Rate ε = Ce (τt - τc) Equation 1 of Wan et al, 2002a
4.11a to 4.11c
Each increment of one in Erosion Rate Index, I, corresponds to increase in 10 of erosion rate
Turbidity of leakage flow
Suspended solids i.e. erosion rate/ leakage rate
4.11d
TASK B EARLY DETECTION OF INTERNAL EROSION RESERVOIR SAFETY ADVICE FEASIBILITY REPORT DEFRA RESEARCH CONTRACT
02/11/2004 2:20 PM 38 of 70 L:\EWE_Operations\UK_D&W\XU0248 - Defra research\201 Task B Internal eroison\Stage 1 - Feasibility Report\Task B FINAL- on Defra web site\Vol 1\Task B Main text 05 Website.doc
where b crack length c crack width
Ce Coefficient of soil erosion f friction factor (coefficient) g weight per unit mass of water I Erosion Rate Index (=-log(Ce)) m hydraulic mean depth (area/ wetted perimeter) S hydraulic slope (Friction head/ crack length). u mean velocity γw unit weight of water τc Hydraulic shear stress along crack (subscript c denotes critical shear stress i.e.
initiation of erosion) µ Absolute viscosity of water (10-3 Pa s; table page 4 of Massey, 1989))
Observations on the results of this sensitivity study are:
Figure Contents Observations 4.10 Crack width vs.
• Leakage flow rate,
• shear stress vs.
a) flow is laminar for cracks less than about 0.6mm, and turbulent for wider cracks
b) For crack width varying by three orders of magnitude, the leakage flow rate varies by five orders of magnitude (from minimum detectable, to �Dam critical leakage flow�; and shear stress by four orders of magnitude)
4.11a- 4.11c
Crack width vs. Erosion rate for six values of Erosion Rate Index I
a) Although the relationships plot broadly as a straight line on linear axes, when six values of I are superimposed and plotted together on log-log paper to allow comparison there is a kink at low erosion (as a consequence of plotting on log-log paper)
b) The crack width for the onset of erosion varies from 0.3 to 9 mm (corresponding to leakage flow of 0.1 to 20l/s)
c) Rate of erosion for a given, significant, crack width varies by five orders of magnitude depending on Erosion Rate Index.
d) If 5m3 (10,000kg) taken as critical volume of erosion, then for a 20mm wide crack the time period to reach this cumulative erosion varies from 1 day to 200,000 days (500 years) (or for a clay core, with Erosion Index of 3 to 6 it varies from 1000 days to 500 years)
4.11d Crack width vs. turbidity
Turbidity for Soil Index 4 to 6 would not be visible by the human eye; that for Soil Erosion Rate Index 6 would be very dirty.
The conclusions are a) the model postulated by Wan & Fell appears reasonable, although it is questioned
whether the erosion rate really has such wide variation (the argument put forward by Fell is that permeability of soils has a similar wide range in value, such that the results are reasonable)
b) the critical shear stress concept implies that there is leakage flow with no erosion, when the shear stress is less than the critical shear stress, which is reasonable for more plastic soils
c) the time period for a critical volume of erosion has enormous range consistent with the results from the questionnaire and elicitation; however, in reality the time to failure will depend on the overall system response (i.e. shoulders as well as core), such that the sensitivity values are an upper bound and may be constrained (reduced) by the effect of the shoulders.
Table 4.10 :Predictive equations from Wan et al (2002) for Erosion rate Index
Application to typical UK soils
Symbol Units Coarse grained (SC, SM) Fine grained (CL, ML, CH)Glacial Till Credible range of Diff Remarks Glacial Till range of Diff Remarks
Balderhead; Kennard et al,
1967, Vaughan et al, 1970
of parameter correction Atkinson et al, 1990 Balderhead; Kennard et al, 1967, Vaughan et al, 1970
correction
Parameter
Value Parameter
Value Parameter
Value
Base 6.623 -10.201 6.623 -10.20 -10.20rd Mg/m3 Dry density of soil -0.016 9.572 1.99 -0.03 1.7 2 -0.03 -0.03 0.00 1.63 15.61 1.99 19.05 182.33 1745.26 1562.93
rd/rdmax % Compaction relative to proctor -0.104 -0.042 102 -10.61 80 110 -8.32 -11.44 -3.12 why more erodible if denser?
95 -3.99 102 -4.28 0.18 -0.01 -0.19
w % Water content -0.044 0.103 12 -0.53 10 20 -0.44 -0.88 -0.44 small 20 2.06 12 1.24 0.13 0.01 -0.11Dwf % (w - OMC)/OMC x 100% -0.074 0.0097 -20 1.48 -15 15 1.11 -1.11 -2.22 1 0.01 -20 -0.19 0.00 0.00 0.00 NegligibleS % Degree of saturation 0.113 Not app. 80 9.04 70 ##### 7.91 11.30 3.39 - - - - - -
Parameter IHET = (Base + S factor x value of parameter
at subject dam)
London ClayCoarse grained
(SC, SM)
Fine grained (CL, ML,
CH)
02/11/2004 14:44L:\EWE_Operations\UK_D&W\XU0248 - Defra research\201 Task B Internal eroison\Stage 1 - Feasibility Report\Task B FINAL- on Defra web site\Vol 1\task B tables & figs 09 Nov.xls
TASK B EARLY DETECTION OF INTERNAL EROSION RESERVOIR SAFETY ADVICE FEASIBILITY REPORT DEFRA RESEARCH CONTRACT
02/11/2004 2:20 PM 40 of 70 L:\EWE_Operations\UK_D&W\XU0248 - Defra research\201 Task B Internal eroison\Stage 1 - Feasibility Report\Task B FINAL- on Defra web site\Vol 1\Task B Main text 05 Website.doc
4.6.5.3 Questionnaire and elicitation : rate of deterioration and time to failure No other references which have been identified which quantify initiating conditions for (and the rate of progression of) internal erosion once a pathway has been formed. The main source of data is therefore the information from the questionnaire and expert elicitation; summarised as follows:- Questionnaire Elicitation Figures Q (see
commentary in Appendix=x C)
timing and magnitude of leakage at different stages in incident case histories
4.12, 4.13 23, 24, 27b Not app
Effect of soil properties on rate of deterioration
Rates of erosion Not app Fig 4.18 Time to failure, if no intervention
4.20, 4.21 As Questionnaire
Prior warning None 45 to 48
Table 4.11 : Outcome from Expert Elicitation of effect of material properties of core on time to failure of puddle clay dams
Q Base case, and change Ratio of best estimate of change in time to failure (>1 means dam will fail
quicker than base case)
Figure
Core material : Base case is CH 4.22 49 CL 1.4 50 ML 2.0 51 CV 0.96 52 SC 1.7 53 GW 2.5 Gradient: Base case 1.0 4.23 47 2.5 3.2 48 5.0 8.6 Compaction: Base case 98% 4.23 54 90% 1.5 55 80% 2.3
It can be seen that rates of deterioration appear to be very variable. However, it is noted from Q27 of the questionnaire that incidents involving internal erosion into or along appurtenant works appear to have a greater proportion of incidents which were likely to lead to a rapid failure.
TASK B EARLY DETECTION OF INTERNAL EROSION RESERVOIR SAFETY ADVICE FEASIBILITY REPORT DEFRA RESEARCH CONTRACT
02/11/2004 2:20 PM 41 of 70 L:\EWE_Operations\UK_D&W\XU0248 - Defra research\201 Task B Internal eroison\Stage 1 - Feasibility Report\Task B FINAL- on Defra web site\Vol 1\Task B Main text 05 Website.doc
4.6.6 Breach mechanisms Figure 4.9 shows some of the failure mechanisms that are possible, depending on the characteristics of the different zones forming the embankment dam. Some of these mechanisms are likely to be predominantly rapid �progressive� failures, whilst other mechanisms would be slower, corresponding to �steady erosion�.
Table 4.12 : Failure mechanisms likely to lead to progressive internal erosion
Non-cohesive 9, 10 6 4 2, 3 The key issues which are likely to govern which mechanism is most likely to occur at a dam are a) whether the downstream shoulder fill is non-cohesive, such that it could not sustain
a open crack b) the permeability of the downstream fill At this stage there is no conclusive data available on which mechanisms are most likely to govern at a particular dam, although the importance of understanding the whole system of core and shoulders should not be underestimated. The magnitude of leakage flow which is considered that could no longer be controlled (dam critical flow) is shown on Figure 4.19, including both the response to Q27b of the questionnaire and the result of the expert elicitation.
Table 4.13 : Outcome from Expert Elicitation of effect of material properties of shoulders on time to failure of puddle clay dams
Q Base case, and change Ratio of best estimate of change in time to failure (>1 means dam will fail quicker than
base case) Upstream shoulder: Base case CL 56 SC 1.6 57 Rockfill 5.9 Downstream shoulder: Base case CL 72 SC 1.7 73 Glacial till 1.4 74 Coarse gravel (London embankments) 2.2
Notes 1. Shown graphically on Figure 4.24
TASK B EARLY DETECTION OF INTERNAL EROSION RESERVOIR SAFETY ADVICE FEASIBILITY REPORT DEFRA RESEARCH CONTRACT
02/11/2004 2:20 PM 42 of 70 L:\EWE_Operations\UK_D&W\XU0248 - Defra research\201 Task B Internal eroison\Stage 1 - Feasibility Report\Task B FINAL- on Defra web site\Vol 1\Task B Main text 05 Website.doc
4.7 Quantification of Suffusion and Piping
4.7.1 Suffusion Although in principle only broadly graded cores should be susceptible to suffusion, it is noted that the following may be vulnerable to suffusion
a) downstream shoulder material of clay core dams, as a secondary effect of concentrated leakage through the core
b) foundation (particularly where there is no positive foundation cut-off) An important point is that internal erosion by suffusion is less likely to lead to progressive (rapid) failure, than concentred leaks or piping. The expert elicitation estimate of the proportion of internal erosion that is due to suffusion is shown on Figures 4.5 and 4.6. Skempton & Brogan (1994) describe laboratory tests on internally unstable sandy gravels, which show that a significant proportion of the sand content is washed out by piping at hydraulic gradients far lower than the critical gradient given by classical theory. By contrast piping of the sand from stable sandy gravels occurs at approximately the full theoretical gradient. The tests were considered to broadly confirm Kenny�s criterion for the internal stability of granular materials. Blackwell et al (1995) in a paper on particulate damage to groundwater wells note that for particle migration it is necessary to both have particles fine enough to go through the well filter and a certain minimum velocity of flow (pS157). They quote a paper where the velocity required to mobilise particles with porosity in the range 0.26 to 0.35 and hydraulic conductivity from 1 to 4.5cm/s such that
V = 0.098K 0.356 where V and permeability K are expressed in cm/s. For the range of permeabilities for which the expression was derived the critical velocity is in the range 0.019 to 0.033cm/s
4.7.2 Piping Careful consideration of allowable and actual seepage gradients to structures on permeable foundations are required. Piping will occur at the downstream toe when the porewater uplift pressures at a point are greater than the total vertical stress at that point. The subject of piping and internal erosion are covered in textbooks such as Cedegren (1989). Papers also include
• Removal of head limitation on Kotri barrage, Pakistan (Elliot, 1994) • Mathematical analysis for piping in pervious foundations (Yener, 1994)
Preliminary methods of analysis of foundation seepage include Lane�s weighted creep theory (USBR, 1973, 2nd edition, but deleted from third edition) and Blighs theory (reproduced in Maccaferri, 1987). These give, respectively, an allowable gradient and weighted creep ratio to control seepage and prevent piping; these values being summarised in Table 4.14. However, no means of estimating the rate of progression of piping, from initiation to failure, have been identified.
TASK B EARLY DETECTION OF INTERNAL EROSION RESERVOIR SAFETY ADVICE FEASIBILITY REPORT DEFRA RESEARCH CONTRACT
02/11/2004 2:20 PM 43 of 70 L:\EWE_Operations\UK_D&W\XU0248 - Defra research\201 Task B Internal eroison\Stage 1 - Feasibility Report\Task B FINAL- on Defra web site\Vol 1\Task B Main text 05 Website.doc
Table 4.14 : Published allowable Seepage Gradient to prevent piping
Soil type Limiting value of coefficient C in Bligh�s theory (Maccaferri, 1987)
Limiting value of Lane�s weighted creep ratio1
(USBR, 1973) Fine sand or silt 18 8.5 Medium sand 12 6.0 Medium gravel 4 to 9 3.5 Boulders with some cobbles and gravel
Not given 2.5
Very hard clay or hardpan 3 to 6 1.6 1. Ratio of head to sum of vertical seepage length plus one third horizontal seepage
length
4.8 Unprotected pipes and culverts through embankments Internal erosion may occur a) along the outside of the pipe or culvert b) into the pipe or culvert, through gaps in the wall The general comments on internal erosion in the previous section are also applicable to �a�. The only difference is that the size of any aperture due to hydraulic separation may be different (larger in critical situations) from that of apertures in the body of the dam. In regard to �b� the key issues are
• whether such gaps may already exist e.g. for the reasons in Table 2.5 • credible mechanisms for new gaps to occur in future (e.g. differential
settlement along the pipe or culvert; for example due to erosion of fines from under the culvert due to flow along the outside of the culvert)
• whether any gap would act as a filter to the adjacent fill • whether the gap could enlarge, or whether it would act as a choke to the
volume of leakage and thus the rate of deterioration In regard to pipes through embankments cast iron has a finite life (Doyle, Seica & Grabinsky, 2003) and soil conditions can encourage corrosion from the outside. There is little published on �b� and it is something that requires further consideration, but on a dam specific basis. Where gaps already exist then lining the inside of the pipe or culvert may be an effective way of reducing the risk of internal erosion at this location.
TASK B EARLY DETECTION OF INTERNAL EROSION RESERVOIR SAFETY ADVICE FEASIBILITY REPORT DEFRA RESEARCH CONTRACT
02/11/2004 2:20 PM 44 of 70 L:\EWE_Operations\UK_D&W\XU0248 - Defra research\201 Task B Internal eroison\Stage 1 - Feasibility Report\Task B FINAL- on Defra web site\Vol 1\Task B Main text 05 Website.doc
4.9 Conclusions
The understanding of internal erosion processes is still immature; with quantitative methods only available for limited elements of the internal erosion process. Although internal erosion is the subject of one of the working groups of the European Club (Charles, 1998) to date this has largely collected data. The most relevant recent work is that in Australia, both in developing models of internal erosion and laboratory testing of the rate of erosion, with this section drawing significantly on this work. On the data available at present key conclusions are a) leakage may occur without internal erosion b) the rate of deterioration due to internal erosion can be very variable, depending on
both the erodibility of the clay, and the properties of the adjacent shoulders c) In particular some dams may in principle be �intrinsically safe�, in that the rate of
deterioration of a typical section would be slow (�steady internal erosion�), whilst at other dams once internal erosion commenced the rate of erosion would increase rapidly (�progressive internal erosion�)
d) notwithstanding this the importance of �singularities� should not be underestimated, and means that it is unlikely that dams without filters can with complete confidence be considered �intrinsically safe�
e) similarly there are a significant number of additional uncertainties over detailing where a pipe or culvert passes through the embankment, and thus the risk associated with these structures
f) the assessment and management of internal erosion has to be based on experience of performance and observations, in parallel with improving models of progressive internal erosion
Figure 4.1- Percentage of puddle clay dams with ongoing, steady leakage flow
0.0%
0.1%
1.0%
10.0%
100.0%Body of dam
Along interface withappurtenant works
Body of dam intofoundation
Leakage throughfoundation
% o
f tot
al p
opul
atio
n
Lower bound (5%) Best estimateUpper bound (95%)
Elicitation Q12-15
Figure 4.2 - Percentage of homogenous dams with ongoing, steady leakage flow
0.01%
0.10%
1.00%
10.00%
100.00%Body of dam
Along interface withappurtenant works
Body of dam intofoundation
Leakage throughfoundation
% o
f tot
al p
opul
atio
n
Lower bound (5%) Best estimateUpper bound (95%)
Elicitation Q116-19
Figure 4.3 - For puddle clay dams with ongoing, steady leakage flow; percentage with ongoing internal erosion
1.0%
10.0%
100.0%Body of dam
Along interface withappurtenant works
Body of dam intofoundation
Leakage throughfoundation
% o
f tot
al p
opul
atio
n
Lower bound (5%) Best estimateUpper bound (95%)
Elicitation Q20-23
Figure 4.4 - For homogenous dams with ongoing, steady leakage flow; percentage with ongoing internal erosion
0.1%
1.0%
10.0%
100.0%Body of dam
Along interface withappurtenant works
Body of dam intofoundation
Leakage throughfoundation
% o
f tot
al p
opul
atio
n
Lower bound (5%) Best estimateUpper bound (95%)
Elicitation Q24-27
Figure 4.5 - Percentage split into different mechanisms for puddle clay dam
0%
10%
20%
30%
40%
50%
60%
70%
80%
Q E58Concentrated leak
in body of dam
Q E59Concentrated leak
along interfacewith appurtenant
works
Q E60 Suffusion inbody of dam
Q E61 Piping inbody of dam
Q E62 Foundation Q E63Embankment into
foundation
Perc
enta
ge o
f who
le p
opul
atio
n of
UK
dam
s, if
inte
rnal
ero
sion
wer
e to
occ
ur
Lower bound (5%) Best estimateUpper bound (95%)
Total of all mechanisms, for best estimate equals 100%
Figure 4.6 - Percentage split into different mechanisms for homogenous dams
0%
10%
20%
30%
40%
50%
60%
70%
Q E58Concentrated leak
in body of dam
Q E59Concentrated leak
along interfacewith appurtenant
works
Q E60 Suffusion inbody of dam
Q E61 Piping inbody of dam
Q E62 Foundation Q E63Embankment into
foundation
Perc
enta
ge o
f who
le p
opul
atio
n of
UK
dam
s, if
inte
rnal
ero
sion
wer
e to
occ
ur
Lower bound (5%) Best estimateUpper bound (95%)
Total of all mechanisms, for best estimate equals 100%
Figure 4.7 Internal erosion : Event train for Internal Instability of an embankment in serviceNB: Different event trains would apply for appurtenant works and dams < 5 years old
Stage in Event train
Contributory factors Mechanism of deterioration (response to threat) Indicators (symptoms; see Note 2)Intrinsic Condition Other Process for internal erosion Leakage
downstreamInternal pore
pressuresInternal stress
Internal deformation
Surface Settlement
Narrow core Reservoir level Suffusion - fines Concentrated leaks - fines Piping (exit gradient > critical) - mass instability
Profile of foundation (differential settlement)
Rapid changes 1. Initiation of pathwayRelative stiffness of shoulder material Refilling after long
drawdownHigh gradient Hydraulic fracture (in body of dam) High gradient Minor Wet seam in
coreVery local
Permeability/ stiffness of fill Usually high Hydraulic separation (at appurtenant works, abutments)
Preferential flow paths due to defect in original construction e.g. sand lenses mixed into clay fill
2. Initiation of Internal erosion (movement of soil particles)
Loose fines not part of soil matrix Erosion from sides, crown & invert of pathway
"Blow-out" of impervious layer in foundation
Fines which form part of soil matrix Erosion at ends, as hole migrates upstream/ downstream
Piping in homogenous soils Minor Turbidity
very localised Minor Minor Negligible
Blockers of erosion path 3. Decision Point : Continuation (does internal erosion cease?)Filters Particle migration prevented at downstream constriction (filter, discontinuity width in rock foundation, crack width in structure)Upstream shoulder washes in and acts as crack filler
Particle migration ceases at upstream end ( concrete cut-off etc)
Upstream/ downstream shoulder (or water retaining element) cannot sustain a pipe
Hole collapses, stopping flow
No
Rate of erosion: Steady state or accelerating 4. Mechanism of deterioration - Progression (see Figure 4.2)Dispersive soils Tortuosity of path a) if loose fines not part of the matrix - fines
wash out, no settlement but increasing permeability gives increasing flow
Hole enlarges but cannot migrate upstream or downstream, arch forms,
migrates to surface
As Concentrated leaks Increasing discharge,
turbidity
Void commences
Minor Very local to void
Sometimes medium (but
delayed)
Degree of compaction and compaction moisture content
Reservoir level: - changes; unusually high
b) if fines are part of soil matrix, reduction in soil volume, leading to concentrated leak
Hole migrates upstream (to reservoir) or downstream
As Concentrated leaks
Reservoir water chemistry Filter eventually clogs as coarser material carried through
Hydraulic gradient across cut-off
Failure (breach) mode(s)Downstream zone (Note 1) a) Gross enlargement of internal erosion path, including pipe Minor MediumCrest width b) Overtopping (due to reduced freeboard caused by sinkhole/ crest settlement)Freeboard c) Slope instability, due to pore pressure increases on weak layer (and/ or saturation of downstream shoulder)
c only all a, c
Notes1. Can it support a roof? How erodible? Flow capacity vs. through flow due to internal erosion2. Other mechanisms of deterioration of dam that may affect indicators
Settlement e.g. Collapse on saturationLong term changes in pore pressure distribution due to changes in reservoir levels (reservoir operation)Mining under dam Leaching/ precipitation by reservoir waterDeterioration of water tight element (where formed by materials other than soil)Tree rootsAnimal activity (moles, rabbits)
Major discharge,
turbidity
Medium range of influence
L:\EWE_Operations\UK_D&W\XU0248 - Defra research\201 Task B Internal eroison\Stage 1 - Feasibility Report\Task B FINAL- on Defra web site\Vol 1\task B tables & figs 09 Nov.xls 02/11/2004 14:53
L:\EWE_Operations\UK_D&W\XU0248 - Defra research\201 Task B Internal eroison\Stage 1 - Feasibility Report\Task B FINAL- on Defra web site\Vol 1\task B tables & figs 09 Nov.xls 02/11/2004 14:54
Figure 4.8 Time based model of Progressing Internal Erosion
0.01
0.1
1
10
100
1000
Time
Flow
litr
e/ s
ec
0.001
0.01
0.1
1
10
100
Turb
idity
gra
m/li
tre
Progressive erosion - no Intervention Progressive erosion- with intervention"Steady" internal erosion Turbidity for progressive erosion g/litre
Initiation/ Continuation
Acceleration
Detection
Constant rate of erosion Progressive (Accelerating) erosion
Dam Critical flow rate i.e. > cannot control by lowering reservoir
Detectable flow rate
Response to temporary lowering of RWL
Time before detected depends on surveillance frequency
Figure 4.9 Event tree for progression of Internal erosion within an embankment dam
50.0% 0.166666667
0 0
BREACH MECHANISM
33.3% Chance
0 0
50.0% 10
25.0%Chance
00
50.0% 20
50.0%Chance
00
25.0%0.013888889
00
50.0% 30
25.0%Chance
00
50.0% 40
50.0% Chance
0 0
50.0% 50
33.3%Chance
00
50.0% 60
50.0% Chance
0 033.3%
0.020833333 70
0
50.0% 80
0.0%Chance
00
50.0% 90
50.0% Chance
0 0
50.0% 0.083333333 100 0
Chance
0
0.0% 0
0 0
33.3% 0.333333333
0 0
33.3% 0.333333333
0 0
Notes1 Progression may depend on rate e.g. short term vs. long term strength (drained vs. undrained strength)2 separate trees for foundation; embankment into foundation3 Likelihood of each path at some of chance nodes will depend on type of embankment dam and/ or appurtenant works
Fines blocked at downstream shoulder (filtered)
Fines can wash out through downstream fill
Hole in core remains open
Hole in core collapses/ migrates upwards (non cohesive core)
Diagram #1
Hole migrates to upstream face of reservoir
Holes starts migrating, but sand fines from upstream shoulder migrate through core and block at downstream
filter/ shoulder (crack filler)
Hole extends upstream of core
Migrates horizontally to downstream face/ toe
Migrates vertically (surface collapse)
Hole migrates to downstream face of embankment (fill cohesive such that can sustain open crack)
Slip caused by saturation of downstream shoulder
Hole extends downstream of core
Migrates horizontally to reservoir (clay shoulder)
Migrates vertically (non cohesive shoulder)
Hole in core enlarges; migrates vertically upwards
Hole in core enlarges; becomes large enough for upstream zone to migrate along hole
Downstream shoulder limits flow,Either a) with no erosion
Or b) fines washed out (suffusion of downstream fill)Or c) piping initiates at downstream face, as secondary mechanism
Hole in core enlarges; migrates vertically upwards
Hole in core enlarges; becomes large enough for upstream zone to migrate along hole
Upstream shoulder does not erode, and stable flow develops
Concentrated leak throughbody of dam
Concentrated leak along appurtenant works (event tree similar to concentrated leak
through body of dam)
Suffusion
Piping
Type of internal erosion
Downstream shoulder so coarse that it does not limit flow Hole in core enlarges; becomes large enough for upstream zone to migrate along hole
L:\EWE_Operations\UK_D&W\XU0248 - Defra research\201 Task B Internal eroison\Stage 1 - Feasibility Report\Task B FINAL- on Defra web site\Vol 1\task B tables & figs 09 Nov.xls 02/11/2004 14:56
Figure 4.10 : Effect of crack width on Leakage flow and average shear stress on sides of crack
0.001
0.01
0.1
1
10
100
10000.1 1 10 100
Crack width (mm)
leak
age
flow
(l/s
), fo
r 1m
long
cra
ck
0.00
0.01
0.10
1.00
Ave
rage
she
ar s
tres
s on
sid
es o
f cra
ck (k
Pa)
Leakage flow (l/s)Shear (Tractive) force
Elicitation Q32 indicates minimum detectableleakage rate of 0.04 litre/s (range 0.0016 to 0.3l/s)(2, 0.1 and 16 litre.min respectively)
Elicitation Q35 indicates dam critical flow (control of the reservoir has been lost and failure is inevitable) of 0.4 m3/s
Elicitation Q30 indicates leakage rate for puddle clay dams with ongoing internal erosion is 0.8l/s
02/11/2004 14:58L:\EWE_Operations\UK_D&W\XU0248 - Defra research\201 Task B Internal eroison\Stage 1 - Feasibility Report\Task B FINAL- on Defra web site\Vol 1\task B tables & figs 09 Nov.xls
Figure 4.11a Effect of crack width on erosion rate for an Erosion Rate Index of 4
0
5
10
15
20
25
30
350 20 40 60 80 100 120
Crack width (mm)
Eros
ion
rate
kg/
day,
for 3
m lo
ng 1
m h
igh
crac
k un
der 1
0m h
ead
4
Erosion RateIndex
Figure 4.11b Effect of crack width on eroion rate, for Erosion Rate Index of 1
0
5000
10000
15000
20000
25000
30000
35000
400000 20 40 60 80 100 120
Crack width (mm)
Eros
ion
rate
kg/
day,
for 3
m lo
ng 1
m h
igh
crac
k un
der 1
0m h
ead
1
Erosion RateIndex
02/11/2004 15:00L:\EWE_Operations\UK_D&W\XU0248 - Defra research\201 Task B Internal eroison\Stage 1 - Feasibility Report\Task B FINAL- on Defra web site\Vol 1\task B tables & figs 09 Nov.xls
Figure 4.11c Effect of crack width on erosion rate, for Erosion Rate Index of 1 to 6
0.001
0.01
0.1
1
10
100
1000
10000
1000000.1 1 10 100
Crack width (mm)
Eros
ion
rate
kg/
day,
for 3
m lo
ng 1
m h
igh
crac
k un
der 1
0m h
ead
123456
Erosion RateIndex
Elicitation Q28 indicates average erosion rate is 0.02kg/day
02/11/2004 15:00L:\EWE_Operations\UK_D&W\XU0248 - Defra research\201 Task B Internal eroison\Stage 1 - Feasibility Report\Task B FINAL- on Defra web site\Vol 1\task B tables & figs 09 Nov.xls
Figure 4.11d Variation of turbidity with crack width and Erosion Rate Index
0.00001
0.0001
0.001
0.01
0.1
1
10
100
1000
100000.1 1 10 100
Crack width (mm)
Turb
idity
(mg/
l = F
TU)
123456
Erosion RateIndex
Lower limit of visual detection is about 5mg/l
Figure 4.12 - Questionnaire case history data Timing of actions following detection of serious internal erosion (Q23)
1
10
100
10000% 10% 20% 30% 40% 50% 60% 70% 80% 90% 100%
% of case histories less than this
Tim
e be
twee
n de
tect
ion
and
actio
n as
lege
nd (h
ours
)
the first physical action taken on site whichwould reduce the risk of failure?the maximum flow rate from the leak (orother symptom of internal erosion)the incident was controlled (e.g. reservoirdrawn down and leak had stopped)
Figure 4.13 - Questionnaire case history data Magnitude of internal erosion leakage flow at various stages in incident (Q24, 27b)
0.1
1
10
100
1000
100000% 10% 20% 30% 40% 50% 60% 70% 80% 90% 100%
% of flow less than this
Flow
at w
hich
leak
age
was
det
ecte
d lit
re/s
ec
when the event was detected
at its maximum
when the incident was controlled?
the leakage rate when the situation wouldhave become uncontrollable?
Figure 4.14 - Questionnaire case history data Relationship of estimated time to failure (Q27a) to Gradient across impervious element at original
ground level (Q34)
0.1
1
101 10 100 1000
Estimated Time from detection to failure, if no intervention (days)
Gra
dien
t (he
ad /
with
of i
mpe
rvio
us e
lem
ent);
at o
rigin
al
grou
nd le
vel
Interface with structurePuddle clayHomogenousOther
Figure 4.15 - Questionnaire case history data Relationship of estimated time to failure (Q27a) to dam height (Q11)
0
5
10
15
20
251 10 100 1000
Estimated Time from detection to failure, if no intervention (days)
Hei
ght o
f dam
(m)
Puddle clayHomogenousOtherInterface with structure
Figure 4.16 - Questionnaire case history data Relationship of estimated time to failure (Q27a) to Plasticity Index of the watertight element (Q31c)
0
10
20
30
40
50
60
70
801 10 100 1000
Estimated Time from detection to failure, if no intervention (days)
Plas
ticity
Inde
x of
wat
ertig
ht e
lem
nt %
Puddle clay dams
Homogenous dams
Judgement from Elicitation; relative to base of10 days for CH materialInterface with structure
Figure 4.17 - Leakage rates: average ongoing and minium detectable
Figure C2 shows leakage rates for Questionnaire case history data (Q24 first detected, maximum, when controlled)
Figure 4.18 - Average erosion rate, for dams with ongoing internal erosion
0.1
1
10
100
1000
10000QE28 Puddle Clay QE29 Homogenous
Eros
ion
rate
gra
m/d
ay
Lower bound (5%) Best estimateUpper bound (95%)
Figure 4.19 - Distribution of Dam Critical flow for population of all UK embankment dams
0.001
0.01
0.1
1
10
1000% 10% 20% 30% 40% 50% 60% 70% 80% 90% 100%
% of flow less than this
Dam
crit
ical
flow
(m3 /s
) - fl
ow a
t whi
ch c
ontr
ol o
f the
rese
rvoi
r has
be
en lo
st a
nd fa
ilure
is in
evita
ble
Lower bound (5%) Best estimateUpper bound (95%)Questionnaire Q27b
Elicitation whole population Q34-36
Figure 4.20 - Estimated time from detection to failure of puddle core dams, if no intervention
0.01
0.1
1
10
100
1000
100000% 10% 20% 30% 40% 50% 60% 70% 80% 90% 100%
% of incidents slower than this
Estim
ated
tim
e fr
om d
etec
tion
to fa
ilure
(day
s)
Lower bound (5%) Best estimateUpper bound (95%)Questionnaire Q27a
Elicitation whole population Q37-41)
Questionnaire Q27a is data from responses to the questionnaire, and thus represents the opinion of the respondents to the questionnaire
The best estimate andlower and upper bounds are obtained from the expert elicitation, for the whole population of UK puddle clay dams (Q37-41)
Figure 4.21 - Time from detection to failure of homogenous dams, if no intervention
0.010
0.100
1.000
10.000
100.000
1000.000
10000.000
0% 10% 20% 30% 40% 50% 60% 70% 80% 90% 100%
% of incidents slower than this
Tim
e fr
om d
etec
tion
to fa
ilure
(day
s)
Lower bound (5%) Best estimateUpper bound (95%)Questionnaire Q27a
Elicitation Q42=46
Figure 4.22 - Effect of characteristics of core material on time to failure (puddle clay dam)
0.01
0.1
1
10
100 CV (Q E51) Base case CH CL (Q E49) ML (Q E50) SC (Q E52) GW (Q E53)
Tim
e to
failu
re re
lativ
e to
cor
e of
CH
pud
dle
clay
(>1
mea
ns d
am w
ould
fail
quic
ker)
Lower bound (5%) Best estimateUpper bound (95%)
Characteristics of core material in Questionnaire case histories given in Q13 of Table C 1
Figure 4.23 - Effect of compaction and hydraulic gradient on time to failure (for puddle clay dam)
0.1
1
10
100
Gradient 2.5 (rather than1.0) Q E47
Gradient 5.0 (rather than1.0) Q E48
Compaction 90% MDD(rather than 98%) Q E54
Compaction 80% MDD(rather than 98%) Q E55
Tim
e to
failu
re re
lativ
e to
cor
e of
CH
pud
dle
clay
(>1
mea
ns d
am w
ould
fail
quic
ker)
Lower bound (5%) Best estimateUpper bound (95%)
Figure 4.24 - Effect of characteristics of dam shoulders on time to failure (for puddle clay dam)
0.1
1
10
100
Upstreamshoulder SC,
rather than CLQ E56
Upstreamshoulder
rockfill, ratherthan CL Q E57
DownstreamshoulderGlacial till
rather than CLQ73
Downstreamshoulder SC
rather than CLQ72
Downstreamshoulder
Coarse gravel(London
embankments)rather than CL
Q74
Tim
e to
failu
re re
lativ
e to
cor
e of
CH
pud
dle
clay
(>
1 m
eans
dam
wou
ld fa
il qu
icke
r)
Lower bound (5%) Best estimateUpper bound (95%)
Figure 4.25 - For concentred leaks at puddle clay dams, percentage of dams that would behave in particular way
0%
10%
20%
30%
40%
50%
60%
70%
80%
90%
100%
Q E70 % of dams where downstream fill would actas filter to puddle clay
Q E71 % of dams where hole in puddle clay corewould remain open, rather than migrating upwards
% o
f UK
pud
dle
clay
dam
s
Lower bound (5%) Best estimateUpper bound (95%)
TASK B EARLY DETECTION OF INTERNAL EROSION RESERVOIR SAFETY ADVICE FEASIBILITY REPORT DEFRA RESEARCH CONTRACT
02/11/2004 2:20 PM 46 of 70 L:\EWE_Operations\UK_D&W\XU0248 - Defra research\201 Task B Internal eroison\Stage 1 - Feasibility Report\Task B FINAL- on Defra web site\Vol 1\Task B Main text 05 Website.doc
5 STRATEGY FOR EARLY DETECTION OF INTERNAL EROSION
5.1 Introduction This section of the report addresses the requirement of the terms of reference Stage 1 - The development of a strategy for the early detection of internal erosion in embankment dams.
• The starting point will be to assess overall feasibility and the respective roles of surveillance and real time remote monitoring of instrumentation and warning systems.
• Techniques for remote monitoring of instrumentation located in or on the dam to detect internal erosion will be identified and evaluated.
In terms of early detection of internal erosion practical difficulties include
• differentiating leakage from internal erosion • differentiating �steady� internal erosion from �progressive� internal erosion • is there a threshold level of leakage (and internal erosion) below which there is
very low risk. As discussed in Section 1.2.1 it is considered that monitoring should be considered as having a wider remit, such that it includes physical investigations to quantify the vulnerability of a particular dam to internal erosion, which in turn may lead to physical works. Thus parameters which may provide means of early detection of internal erosion are broadly in two groups:- Indicators Outcome from the process of internal erosion (i.e. internal erosion must
already be occurring) Intrinsic condition
This provides a measure of vulnerability to internal erosion, but does not actually provide information on whether internal erosion is occurring
This section deals with a) defining the strategy for early detection of progressive internal erosion b) the use of �indicators� for �early detection of progressive internal erosion�; in
particular how to prioritise parameters and instrumentation to provide early detection
c) the role for surveillance and continuous monitoring of instrumentation (whether downloaded periodically, or transferred in real time to a central control room)
d) the role of intrinsic condition It is noted that this project is limited to indicators relating to internal threats, and does not cover threats remote from the dam.
TASK B EARLY DETECTION OF INTERNAL EROSION RESERVOIR SAFETY ADVICE FEASIBILITY REPORT DEFRA RESEARCH CONTRACT
02/11/2004 2:20 PM 47 of 70 L:\EWE_Operations\UK_D&W\XU0248 - Defra research\201 Task B Internal eroison\Stage 1 - Feasibility Report\Task B FINAL- on Defra web site\Vol 1\Task B Main text 05 Website.doc
5.2 Strategy
5.2.1 Long term objective The overall purpose of a strategy for early detection of internal erosion is to obtain time
• in which mitigation actions can be taken to avert failure (which could include physical upgrading works)
• if failure cannot be prevented, to warn and evacuate people from the dam break inundation zone
An important point is that no detection system can be 100% reliable, so an important part of defining any monitoring system is to consider how reliable it is likely to be, and what measures could be taken to improve the reliability. It is therefore implicit that the importance of early warning is greater where the risk of loss of life and/ or damage resulting from a failure is high; namely that the amount of advance warning time and reliability of the detection should be greatest where the risk is greatest. Other important points are that a) early detection is of no value unless action can then be taken promptly to terminate,
or at least manage, the internal erosion b) for very high hazard dams the probability of progressive internal erosion may be
unreasonably high, and physical measures to make the dam less vulnerable to internal erosion may be justified
This suggests that the strategy for early detection of internal erosion should be risk based. This is illustrated in Figure 5.1, where both what constitutes the inherent vulnerability of the dam and the frequency of monitoring depend on the risk posed by the dam. The long term objective should be to be able to quantify the various elements of the figure, in order to allow ALARP analysis of the degree to which the three risk control measures to manage risk are justified.
5.2.2 Interim strategy In considering how the concept in Figure 5.1 may be applied now, the significant uncertainties in estimating the annual probability of failure due to progressive (rapid) internal erosion should be noted. It is therefore considered that it is more appropriate at present to link the risk control measures to the consequences of failure, rather than risk, albeit with provision for adjustment on the basis of an assessment of the vulnerability of a dam to failure. The suggested consequence class diagram is that to be included in the Interim Engineering Guide to Quantitative risk assessment, as shown on Figure 5.2. The proposed current strategy for early detection of internal erosion is given in Table 5.1, the basis of this strategy being discussed in the remainder of this section.
TASK B EARLY DETECTION OF INTERNAL EROSION RESERVOIR SAFETY ADVICE FEASIBILITY REPORT DEFRA RESEARCH CONTRACT
02/11/2004 2:20 PM 48 of 70 L:\EWE_Operations\UK_D&W\XU0248 - Defra research\201 Task B Internal eroison\Stage 1 - Feasibility Report\Task B FINAL- on Defra web site\Vol 1\Task B Main text 05 Website.doc
Table 5.1 : Proposed Outline Strategy for early detection of internal erosion
1 The strategy for early detection of internal erosion should consider detection as one of the suite of three risk control measures to reduce risk from progressive internal erosion, namely • monitoring (detection) • planning of measures to be taken in the event internal erosion is detected • reduction of vulnerability
2 A risk based approach should be used to define the extent to which these risk control measures should be applied. Separate consideration should be given to the risks posed by the dam embankment, and associated with any appurtenant works through the embankment.
3 In the medium term, pending increasing quantitative understanding of the probability of failure due to progressive internal erosion, a) dam consequence class may be used in lieu of quantitative estimates of risk
to define the frequency and type of monitoring b) this may be modified by carrying out a screening level assessment of
vulnerability and failure modes. This will result in assigning a preliminary vulnerability classification (based on core erodibility, properties of the dam shoulders and form of construction of appurtenant works)
4 Although surveillance remains the primary mechanism for detection of internal erosion, for high consequence dams and those vulnerable to rapid deterioration it is likely to be appropriate to install real time monitoring systems, with these identified on the basis of the most likely failure modes
5 Preferred methods of detection are shown in Tables 5.3 and 5.4 6 Frequency of monitoring are shown in Tables 5.7 and 5.8 7 Upgrades are shown in Table 5.6
TASK B EARLY DETECTION OF INTERNAL EROSION RESERVOIR SAFETY ADVICE FEASIBILITY REPORT DEFRA RESEARCH CONTRACT
02/11/2004 2:20 PM 49 of 70 L:\EWE_Operations\UK_D&W\XU0248 - Defra research\201 Task B Internal eroison\Stage 1 - Feasibility Report\Task B FINAL- on Defra web site\Vol 1\Task B Main text 05 Website.doc
5.3 Prioritisation of Indicators The choice of which indicators best provide for early detection is based on the results of the questionnaire (e.g. Table 3.1) and a ranking by KBR of the value of the candidate indicators in terms of value to �early detection of progressive internal erosion�. The criteria, and basis of scoring, for determining whether the indicators are viable for use in early detection are shown in Table 5.2; whilst candidate indicators together with their score are summarised in Tables 5.3 and 5.4. This shows that indicators are preferred in the following ranking
Rank from Indicator Instrument Body of dam (Table 5.3)
Appurtenant works (Table 5.4)
1= 1= Turbidity Turbidity meter 1= 1= Flow rate Visual 3 3 Flow rate V notch 4 4 Extent of wet area Visual 5 5 Crest settlement Levels, or settlement gauges
Not app. 6 Voids on outside of culvert
Ground probing radar
6 7 Temperature GTC probes 7 8 Acoustic 8 9= 3D deformation
Not app. 9= Cracks in culvert 9= 11 Self potential 9= Not app. Electrical
resistivity
TASK B EARLY DETECTION OF INTERNAL EROSION RESERVOIR SAFETY ADVICE FEASIBILITY REPORT DEFRA RESEARCH CONTRACT
02/11/2004 2:20 PM 50 of 70 L:\EWE_Operations\UK_D&W\XU0248 - Defra research\201 Task B Internal eroison\Stage 1 - Feasibility Report\Task B FINAL- on Defra web site\Vol 1\Task B Main text 05 Website.doc
Table 5.2 : Criteria for determining the priority of Indicators for use in early detection of internal erosion
Issue (may need to be assessed separately for each of different types of
internal erosion � Table 4.2)
Remarks Basis of scoring
1 How the parameter relates to potential failure modes e.g. • does indicator relate to leakage, or internal erosion • is the parameter symptomatic of �progressive�, or �steady�
internal erosion?
Statler (2003) describes the US BOR performance parameter process in which the monitoring programme is devised on the basis of monitoring indicators which are related to the most likely failure modes. Similar approach described by Pattel & Knoop, 1999
3 is the maximum if the parameter only measures leakage
2 Radius of influence of the zone in which a change in the parameter occurs, and whether the instrument reads only a point value, or is a zonal technique e.g. • how likely is a �normal� number of instruments likely to
identify internal erosion
3 Ease of sampling e.g. • location : where is internal erosion occurring (upper part of
dam, lower part, along interface with structure) • method; is sample required for parameter to be quantified,
and if so is pump required to take sample?
5 is the maximum score for a surface expression which is likely to be indicative of internal changes 3 is the maximum score where the instrument has to be installed inside the dam, but the reading is simple
4 The magnitude of the change in parameter that would occur representative of a Level 2 incident, relative to a) The accuracy to which the parameter can be measured, b) The magnitude of the change in the parameter that occurs
naturally due to • changes in reservoir level • rainfall • other seasonal change
c) Thus the uncertainty in setting trigger levels for alarms
Preferably it would also be possible to a) Differentiate leakage from internal erosion b) Identify how far internal erosion had progressed from initiation
to the dam critical flow rate
5 Timing of measurable change in the parameter: a) Sufficiently in advance of failure to allow preventative action
to be taken? b) Detectable by instrumentation before any change could be
detected by surveillance (visual inspection); either because the change is within the ground or because the initial change is too small to be seen by the naked eye?
a) In clays the response time of piezometers may also be significant, such that a response in the instrument would occur a significant time after the initiation of a erosion pathway
b) �b� would justify installing instruments which were read (or downloaded) only as part of a surveillance visit, even if readings were not sent remotely to some control room
6 Long term reliability of equipment, if a permanent installation, including • ease of installation (and replacement)? • who will maintain (owner, or specialist under subcontract)? • suitable for long term use in partially saturated soil?
a) Cost is covered separately in Section 5.7 b) e.g. can it be recalibrated insitu?
3 is the maximum score for Instruments installed in dam; 5 is the maximum score for instruments exterior to dam
Table 5.3 : Candidate Parameters (Indicators) for early detection of internal erosion in body of dam
Indicator of internal Location (sampling point) Measurable parameter Instruments Indicative estimate of Scoring against criteria in Table 5.2 Total Ranking Remarks erosion Ref Description Value
indiative of dam failure
Minimum detectable
value
Units 1 2 3 4 5 6 Score
Note 1CF Concentrated flow Exit point on downstream 1 Flow rate V notch weir 400 l/s 3 3 5 5 4 4 81 3
side of dam 2 Flow rate and turbidity Visual (surveillance) 400 0.04 l/s 3 3 5 5 4 5 84 1 Q32, 35 of elicitation3 Turbidity Turbidity meter 5 2 4 5 5 3 84 14 Water chemistry 1 2 2 3 3 2 435 Extent of wet area on ds face Visual (surveillance, or TV
(settlement, or Crest 14 Level 1000 1 mm 2 4 5 3 2 5 71 5
horizontal movement) Upstream/ downstream faces 15 3D deformation 1000 2 mm 1 3 4 2 2 4 53 8ID Internal deformation Internal (dam/ foundation) 16 3D deformation 100 1 mm 2 1 3 2 2 2 41
maximum possible 5 5 5 5 5 5 105Weighting 5 4 3 3 3 3
Notes1 At Dam critical flow; defined as the concentrated flow when control of the reservoir has been lost and failure is inevitable 2 Scoring is for any form of Internal erosion; i.e. concentrated leak, suffusion, piping; but not leakage alone3 Score is 5 for high value, 0 for low value
L:\EWE_Operations\UK_D&W\XU0248 - Defra research\201 Task B Internal eroison\Stage 1 - Feasibility Report\Task B FINAL- on Defra web site\Vol 1\task B tables & figs 09 Nov.xls 02/11/2004 15:20
Table 5.4 : Candidate Parameters (Indicators) for early detection of internal erosion asociated with appurtenant works
Indicator of internal Location (sampling point) Measurable parameter Instruments Indicative estimate of Scoring against criteria in Table 5.2 Total Ranking Remarks erosion Ref Description Value
indiative of dam failure
Minimum detectable
value
Units 1 2 3 4 5 6 Score
Note 1CF Concentrated flow Exit point inside, or on 1 Flow rate V notch weir 400 l/s 3 3 5 5 4 4 81 3
downstream side of 2 Flow rate and turbidity Visual (surveillance) 400 0.04 l/s 3 3 5 5 4 5 84 1 Q32, 35 of elicitationappurtenant works 3 Turbidity Turbidity meter 5 2 4 5 5 3 84 1
4 Water chemistry 1 2 2 3 3 2 435 Extent of wet area on ds face Visual (surveillance, or TV
camera)na 0.1 m2 2 3 5 5 4 5 79 4
Along interafce between 6 Temperature 10 0.1 oC 2 4 3 3 2 2 56 7 appurtenant works 7 Not used 0 and body of embanekmnt 8 Voltage generated by flow self potential 2 3 3 2 3 2 52 11
9 Noise Acoustic dB 2 3 3 3 3 2 55 8PP Change in pore pressure In vciinty of appurtenant works 10 Piezometer readings kPa 1 1 4 2 3 3 45IS Change in Internal Stresses In vciinty of appurtenant works 11 Total stress kPa 1 1 3 2 3 2 39
17 Level 100 1 mm 1 2 4 2 2 5 52maximum possible 5 5 5 5 5 5 105
Weighting 5 4 3 3 3 3
Notes1 At Dam critical flow; defined as the concentrated flow when control of the reservoir has been lost and failure is inevitable 2 Scoring is for any form of Internal erosion; i.e. concentrated leak, suffusion, piping; but not leakage alone3 Score is 5 for high value, 0 for low value
L:\EWE_Operations\UK_D&W\XU0248 - Defra research\201 Task B Internal eroison\Stage 1 - Feasibility Report\Task B FINAL- on Defra web site\Vol 1\task B tables & figs 09 Nov.xls 02/11/2004 15:21
TASK B EARLY DETECTION OF INTERNAL EROSION RESERVOIR SAFETY ADVICE FEASIBILITY REPORT DEFRA RESEARCH CONTRACT
02/11/2004 2:20 PM 52 of 70 L:\EWE_Operations\UK_D&W\XU0248 - Defra research\201 Task B Internal eroison\Stage 1 - Feasibility Report\Task B FINAL- on Defra web site\Vol 1\Task B Main text 05 Website.doc
5.4 Role for Surveillance and for real time monitoring
5.4.1 Comparison of features Table 5.5 summarises and contrasts some of the main features of surveillance and real time monitoring of indicators. An intermediate solution, which is a compromise between the two extremes is that instruments are read continually by a data logger on site, but that readings are downloaded manually at the time of the surveillance visits. This has the advantage that more precise readings are being taken (criterion 4), which may detect changes not discernible to the human eye, but that the additional costs of data transmission to a remote station are avoided.
Table 5.5 : Comparison of features of surveillance and real time monitoring
Criterion1 Surveillance Real time monitoring 1 Relation to
failure mode Only downstream area can be inspected
Depending on location of instrumentation may be possible to monitor development of erosion in core
2 Zone of influence
Whole of visible dam surface can be inspected
Depends on type; although only the points at which monitoring is installed are monitored Adoption of a zonal technique (e.g. temperature, resistivity) could provide scanning of significant sections of the dam (although depth and edge limitations exist)
3 Ease of sampling
Hand held equipment (e.g. crack gauges, thermometer) can be used to sample/ measure whole of visible external surface
Sampling locations limited to positions where instruments are installed
4 Magnitude of change in parameter
Only changes sufficient to be detectable by the human eye
Precision of instrument (which is likely to be much higher than the human eye)
5 Timing of measurable change
Only detected at visits, so there would be a delay up to the time interval between visits
Should be instantaneous; only limits being precision of instrument and any lag in change of parameter being measured relative to onset of internal erosion
6 Reliability a) Limited by potential for human error; although can be improved by careful selection of personnel and training
b) Whole of visible dam surface can be inspected, so should provide early detection when internal erosion is occurring at an unexpected location
Limited by equipment reliability
7 Management of alarm
Would need to raise by telephone Automatically triggered in control room (although would need to check that this is not a false alarm)
Notes. 1. Criterion as Table 5.2; except that additional criterion (No 7) added
TASK B EARLY DETECTION OF INTERNAL EROSION RESERVOIR SAFETY ADVICE FEASIBILITY REPORT DEFRA RESEARCH CONTRACT
02/11/2004 2:20 PM 53 of 70 L:\EWE_Operations\UK_D&W\XU0248 - Defra research\201 Task B Internal eroison\Stage 1 - Feasibility Report\Task B FINAL- on Defra web site\Vol 1\Task B Main text 05 Website.doc
5.4.2 Response to detection of internal erosion Important issues in deciding the respective roles of these two methods of detection are
a) whether the dam owner has any form of 24 hour control, or incident, room to which the real time monitoring could be transmitted, and where action would immediately be taken in the event of an alarm being raised. Where the owner does not have such a facility the value of real time monitoring would be significantly reduced. In theory it is possible that commercial companies could provide a control room as a commercial service to owners of a small number of dams, but this seems unlikely to be cost effective at the present time.
b) The extent to which the base station computer in the control room can • obtain values for variables such as reservoir level, rainfall and temperature • adjust the trigger levels for these variables, before screening the �internal erosion parameter� against the adjusted trigger level (if this is not done then either the trigger levels will be set too low, resulting in an unreasonable number of false alarms, or set too high such that any alarm is not given in good time)
c) If there is a 24 hour control room, how far from the dam site is it, and how long would it take the dam owner to get personnel on site to implement the emergency on-site plan?
d) How fast the reservoir could be lowered, in the event that progressive internal erosion was detected? If it could not be lowered or other remedial action taken, the value of early detection is in providing increased time for warning and evacuating the downstream population)
Where the dam is owned by an individual then real time monitoring is likely to be disproportional costly.
5.4.3 Conclusion In principle the three groups of monitoring each have significant advantages compared to each other;
a) for surveillance that the whole visible surface of the dam can be monitored, b) for instrumentation that in general it would be more precise than visual
observation, c) for real time monitoring that any change in conditions could be automatically
relayed to a control room. The advantages of �c� is unlikely to be realised unless the dam owner has a control room which is manned 24 hours a day. Although in principle dam owners without this facility could obtain the service through some form of service provider, this is likely to be disproportionately costly. It is considered that the advantages of the three groups of monitoring are such that any monitoring programme should consider some form of combination of the three, the choice depending on the failure modes of the dam, consequences of failure, the availability of staff for surveillance and cost.
TASK B EARLY DETECTION OF INTERNAL EROSION RESERVOIR SAFETY ADVICE FEASIBILITY REPORT DEFRA RESEARCH CONTRACT
02/11/2004 2:20 PM 54 of 70 L:\EWE_Operations\UK_D&W\XU0248 - Defra research\201 Task B Internal eroison\Stage 1 - Feasibility Report\Task B FINAL- on Defra web site\Vol 1\Task B Main text 05 Website.doc
5.5 Intrinsic condition At some dams which are extremely high risk, or which are particularly vulnerable to internal erosion it may be appropriate to carry out some form of investigations and/or physical works to reduce the probability of internal erosion occurring. This approach was adopted in Northern Ireland (Cooper, 1987; Posskit, 1974). Table 5.6 lists aspects of intrinsic condition which are likely to affect the vulnerability to progressive internal erosion. At this stage it is not possible to prioritise these.
5.6 Special issues at unprotected pipes and culverts The comments above in relation to the body of the dam are also applicable here. The main differences are a) detection is in principle simpler, as any flows into the culvert can be collected at
the end and measured b) upgrading works are significantly more complex, as it is almost impossible to treat
the contact of the pipe and watertight barrier (core), other than by grouting. The option of adding filters at the downstream face is less effective, because of concerns that any internal erosion along the contact with the core may not then continue to the downstream end of the pipe, but instead be diverted into the downstream shoulder and/ or foundation
5.7 Assessment of proportionate approach
The terms of reference call for a �cost-effective� approach, and for the need to avoid �disproportionate cost�. The issue of what constitutes proportionate cost may be evaluated by the �as low as reasonably practicable� (ALARP) approach. Table 5.7 shows the annual expenditure that would be justified, based on a cost to save a statistical life of £10M. This suggests that an annual cost of about £22k/annum would be justified for a typical Category A1 dam, but reducing to £330/annum for a Category B dam. Table 5.8 gives indicative costs of possible alternative options for increased monitoring in relation to early detection of internal erosion. It can be seen that for a Category A1 dam both increased surveillance and some real time monitoring would be justified, but that for a Category B dam an increase in visit frequency of say one a month would only just be justified. It is emphasised that these estimates are only indicative, and the results would change significantly depending on the assumptions made.
Table 5.6 : Candidate Parameters relating to Intrinsic Condition (vulnerability or change resulting from internal erosion)
Aspect of Intrinsic Measurable parameter Technique for measuring RemarksCondition affecting vulnerability to internal erosion
Units BS test number
1 Internal geometry Gradient across watertight element
Field
2 Materials forming embankmenta) watertight element Plasticity Index Laboratoryb) upstream shoulder Gradationc) filter Durabilityd) downstream shoulder Soil chemistry e.g. Dispersivee) foundation
3 Condition of materials forming embankmenta) watertight element Density (Compaction)b) upstream shoulder Moisture contentc) filter Permeabilityd) downstream shoulder Resistivitye) foundation Total stress (3 dimensions)
Pore pressure
4 Materials forming appurtenant works through embankmenta) structural element through dam Porosityb) joints in structural element Strengthc) location of "water retaining surface" Elasticityd) original excavations for construction of appurtenant works
"Backfill, Filter" as embankment
e) (special) backfill local to appurtenant works Corrosiveness to cast iron etc (resistivity, pH, redox potential, sulphides)
f) filter
5 Condition of materials forming appurtenant works through embankmenta) structural element through dam Cracks/ deformationb) joints in structural element Erosion/ removalc) location of "water retaining surface" "Backfill, Filter" as embankmentd) original excavations for construction of appurtenant works
Voids behind structural element
e) (special) backfill local to appurtenant worksf) filter
6 ReservoirChemistry of reservoir water (relative to embankment materials)Operation of reservoir level
7 Other
Table 5.7 : Indicative ALARP calculation of proportionate cost for early detection of progressive internal erosion
1 2 3 4 5 6 7 8 9 10Dam Consequence Category
Median likely loss of life
Median physical damage
Annual probability of failure Annual risk
Proportionate cost for early
detection
Cost for preventing a
fatality
Remarks
No warning in dam failure £M
Current Reduction by early
detection
With early detection in place
(current) £/annum
£/annum £M
3 x 5
A1 200 200 UK median 2.0E-05 2 1.0E-05 4,000 22,000 10,000,000A2 30 30 UK median 2.0E-05 2 1.0E-05 600 3,300 10,000,000B 3 3 UK median 2.0E-05 2 1.0E-05 60 330 10,000,000C 0.05 0.5 10 x median 2.0E-04 2 1.0E-04 100 100 10,000,000D 0.005 0.1 20 x median 4.0E-04 2 2.0E-04 40 30 10,000,000
Table 5.8 Indicative incremental annual costs of options for increased monitoring in relation to "early detection of internal erosion"
Surveillance Instrumentation (flow, turbidity, water level) Extra over for real time monitoringExtra visits/ week 1 No Capital cost £3,500 Data transmission - GPRS £1,000Visit duration; incl travelling 2 hours
Installation £1,000 Computer + software in control room (split over say 10 dams)
£1,000
Labour £15 hour £1,560 Data logger £5,000Mileage 10 miles Capital £9,500 Capital £2,000Travel 0.45 p/mile £234 Annualised £633 Annualised £133
Data interpretation (2 days@ £60/hr) 900£2,254 £23
02/11/2004 15:23L:\EWE_Operations\UK_D&W\XU0248 - Defra research\201 Task B Internal eroison\Stage 1 - Feasibility Report\Task B FINAL- on Defra web site\Vol 1\task B tables & figs 09 Nov.xls
TASK B EARLY DETECTION OF INTERNAL EROSION RESERVOIR SAFETY ADVICE FEASIBILITY REPORT DEFRA RESEARCH CONTRACT
02/11/2004 2:20 PM 56 of 70 L:\EWE_Operations\UK_D&W\XU0248 - Defra research\201 Task B Internal eroison\Stage 1 - Feasibility Report\Task B FINAL- on Defra web site\Vol 1\Task B Main text 05 Website.doc
5.8 Frequency of monitoring As suggested in Section 5.2 monitoring should be risk based, depending on both the probability of failure of the dam and consequences if the dam failed. The proposed approach is shown as follows
Table 5.9 � suggested base frequency of monitoring (including when real time monitoring would be appropriate) Table 5.10 � adjustment to this, for dam specific vulnerability
Table 5.9 is based on the ANCOLD Guidelines for dam safety management, with some adjustment for the ALARP analysis above. Table 5.9 is derived by KBR. Other possible factors considered but not included in Table 5.9 are the rate of refilling a dam (higher rates would make it more vulnerable to hydraulic fracture)
Table 5.10 Preliminary adjustment to base frequency for dam specific vulnerability
Element of dam Less vulnerable Median More vulnerable Downstream shoulder
Satisfies filter rules against core
Will inhibit leakage, although not satisfying filter rules against core
Clean rockfill
Core Low erosion potential Medium erosion potential High erosion potential Upstream shoulder
Sand fines which would act as a crack filler
Non-cohesive Cohesive material which could sustain a crack and allow a pipe to migrate to the reservoir
Appurtenant works
No pipe or culvert through embankment
Pipe or culvert through embankment
Pipe or culvert has open joints or cracks within the watertight element
Note 1. Vulnerability score is obtained by adding -1 for a less vulnerable feature, and +1 for a more
vulnerable feature. Where the score is ≥ 1 then the monitoring frequency should be increased by one consequence class; where the score is ≤ -2 then the monitoring frequency may be reduced by one consequence class.
2. It is preferable that a dam specific risk assessment should be carried out for the subject dam to assess its vulnerability and probability of failure, but this table may be used as a preliminary adjustment to the values in Table 5.9.
Table 5.9 Suggested Guide for "in service " dam monitoring
Parameter Consequence categoryA1 A2 B C D
Visual surveillanceExterior Daily Daily to Tri-
WeeklyTwice Weekly
to WeeklyMonthly Monthly4
Exterior of culverts/ shafts (and interior where no confined space)
Daily Daily to Tri-Weekly
Twice Weekly to Weekly
Monthly Monthly4
Interior of culverts/ shafts, where confined space
Weekly to monthly
Monthly to 3 monthly
3-Monthly to 6-Monthly
InstrumentationSeepage incl turbidity Daily
(TR)2Daily to Tri-
Weekly (TR)2
Twice Weekly to Weekly
(TC)2
Monthly Monthly4
Surface Movement Yearly 2-Yearly Consider ConsiderZonal technique (e.g. resistivity, thermal) 5-Yearly 5-Yearly to
10 YearlyParameters required to adjust trigger levelRainfall Daily
(TR)2Daily to Tri-
Weekly (TR)2
Twice Weekly to Weekly
(TC)2
Monthly Monthly4
Reservoir level Daily (TR)2
Daily to Tri-Weekly (TR)2
Twice Weekly to Weekly
(TC)2
Monthly Monthly4
Note1 These frequencies may need to be varied according to the conditions at, and the type, and size of
the dam, and applies to instrumentation already installed at the dam.
2 The frequencies quoted assume manual reading of the instrumentation. Where automated readings are available more frequent reading would be appropriate.
TR - telemetry recommendedTC - telemetry considered
3 The frequency of reading and location of the monitoring instruments to be at the discretion of the dams engineer.
4 The frequencies listed for very low Hazard Category dams are suggestions, the dam owner and his Supervising and Inspecting Engineers should determine appropriate monitoring.
Figure 5.1 Process diagram illustrating strategy for early detection of internal erosion
Risk analysisCould dam fail rapidly (say faster than 1 week)
due to progressive internal erosion?
Failure modes e.g. Figure 4.3
Vulnerability of subject dam to rapid failure
Annual probability of rapid failure Consequences of failure
a) Body of damb) Associated with appurtenant works
Risk posed by dama) Body of dam
b) Associated with appurtenant works
Risk Control (actions to reduce risk)
Need to reduce vulnerability
Frequency and form of monitoring
Scope and provision of emergency plan
a) Body of damb) Associated with appurtenant works
Figure 5.2 Consequence diagram for UK dams
0.001
0.01
0.1
1
10
100
10000.001 0.01 0.1 1 10 100 1000
Likely loss of life
Third
par
ty d
irect
floo
d da
mag
e du
e to
dam
failu
re £
M
A2
BC
CD
A1
A1
B
TASK B EARLY DETECTION OF INTERNAL EROSION RESERVOIR SAFETY ADVICE FEASIBILITY REPORT DEFRA RESEARCH CONTRACT
02/11/2004 2:20 PM 58 of 70 L:\EWE_Operations\UK_D&W\XU0248 - Defra research\201 Task B Internal eroison\Stage 1 - Feasibility Report\Task B FINAL- on Defra web site\Vol 1\Task B Main text 05 Website.doc
6 ACTIONS TO PROGRESS AN EFFECTIVE SOLUTION TO MONITORING INTERNAL EROSION
6.1 Future research It is clear that there are a number of significant uncertainties in relation to the current understanding of internal erosion which can only be resolved by a long term (10 year) programme. Issues which would be on such a shortlist are shown on Table 6.1
Table 6.1 : Issues for future research
1 The expert elicitation which has been carried out to date could be probed and extended by a further workshop session where the arguments for and against the range of values estimated are explored by appointing protagonists to argue the case for each of the extreme values (one for the 5% limit, and another for the 95% limit)
2 Laboratory testing of threshold, and rate of internal erosion, of sides of pathway through core, similar to that in Australia (this would be an extension of the pinhole test, covered under BS1377:part 5: 1990 Section 6.2; including changes such as that a 6mm is used instead of a 1mm hole, and the rate of erosion is measured)
3 Field investigation (with associated laboratory testing including erosion tests with core and shoulder) to better understand the range of properties of shoulder materials for typical UK dams; followed by identification and analysis of the credible failure mechanisms for the system of dam core and supporting shoulders
4 Ditto for construction details of pipes and culverts through dams 5 Risk assessment, using Monte Carlo analysis to look at the probability of internal
erosion, for credible ranges of core and shoulder parameters 6 Field techniques to investigate suspected internal erosion should be improved,
through development and trials of alternative systems including a) Temperature measurement b) Acoustic c) Self potential d) Resistivity
7 Investigation of the viability of the use of gamma ray activity as a measure of the erosion of fines
TASK B EARLY DETECTION OF INTERNAL EROSION RESERVOIR SAFETY ADVICE FEASIBILITY REPORT DEFRA RESEARCH CONTRACT
02/11/2004 2:20 PM 59 of 70 L:\EWE_Operations\UK_D&W\XU0248 - Defra research\201 Task B Internal eroison\Stage 1 - Feasibility Report\Task B FINAL- on Defra web site\Vol 1\Task B Main text 05 Website.doc
6.2 Field trials The terms of reference (TOR) call for Stage 2 – In the light of feedback at the review meeting, the strategy will be refined. Appropriate instrumentation and monitoring systems, which can provide immediate warning of changes to normal leakage levels, will be developed and tested on appropriate dams. Further development of the strategy may then be required. The KBR Inception report suggested that a sum of £200k be allowed for �a contract for development, supply, installation and demonstration of any instrumentation�. Defra have indicated that the sum being requested for the financial year 2004-2005 is only £50k. There are a number of important points regarding the terms of reference
a) the TOR refer to �normal leakage levels�; it could be argued that �and/ or onset of internal erosion� should be added after this text.
b) the TOR refer to �instrumentation� to �provide immediate warning�; it could be argued that a more effective means of reducing the probability of failure due to internal erosion is to identify the most vulnerable dams and carry out upgrading works
On this basis we have therefore identified four options for field trials, as shown in Table 6.2 (two with sub-options). Ideally all of Options A to C would be adopted (budget cost £75-150k). However, if the funds are limited then the priority would appear to be appurtenant works, when Options A1, B and C1 could be adopted (budget cost £40-70k).
TASK B EARLY DETECTION OF INTERNAL EROSION RESERVOIR SAFETY ADVICE FEASIBILITY REPORT DEFRA RESEARCH CONTRACT
02/11/2004 2:20 PM 60 of 70 L:\EWE_Operations\UK_D&W\XU0248 - Defra research\201 Task B Internal eroison\Stage 1 - Feasibility Report\Task B FINAL- on Defra web site\Vol 1\Task B Main text 05 Website.doc
Table 6.2 : Options for field trials
Option Indicative cost Objective Argument for Argument against (£k) Remarks
A1 Trial of package of �off the shelf� equipment for real time monitoring, comprising measurement of all or some of flow, turbidity, temperature, rainfall and reservoir level; with readings transmitted to remote station
15-30
Cost will depend to the extent to which the dam owner would contribute in terms of costs of installation and monitoring
Better understanding of issues and difficulties in real time monitoring
This is closest to what the TOR envisaged
A2 As A1, plus include development of software package to test data against trigger levels and sound alarm when exceeded (this would include development of methodology for defining trigger levels)
E/O 15-40
Would need to identify a company interested in developing the software defining trigger levels
As A1, plus issues in determining trigger levels and software to determine if readings exceed these levels
c) really �pilot� with off the shelf equipment (it is debatable whether an instrumentation manufacturer could justify development of special equipment, if market was only say 200 units)
d) �development� rather than research i.e. better value may be obtained in choosing other options first
B Extend Expert Elicitation workshop, but limited to the top six experts and appointing protagonist to review questions, and argue for/ against the 5% and 95% values of say 20 of the 60 questions
10 Either 2 days at KBR offices, or more intense session of one evening and following day at hotel
Better understanding of issues affecting vulnerability
Cheap, improve information from elicitation at little cost
Money better spent on other issues
C1 Laboratory testing of erosion rate on samples taken from existing dams, following technique in Fell; for say minimum 10 different clay core types
15-30 Cost will depend on whether commercial laboratory, or whether laboratory testing could be a PhD at an appropriate university
Identify which dam cores most vulnerable to erosion, and potential rate of erosion
Change from terms of reference
C2 As C1, but also carry out field investigation at say 2 of these dams to establish range of properties of shoulders, followed by assessment of credible failure modes by internal erosion
E/O 20-40
Improve understanding of issues affecting vulnerability
This would inform which dams required more frequent monitoring, and possibly upgrades
D Field trial of temperature sensing and resistivity, with a variety of test positions etc
50- 100 Improve reliability of these techniques, as means of identification of leakage (and possibly internal erosion)
Provide additional tools for detection of internal erosion
This would duplicate work by BC Hydro and under the IMPACT programme (see Appendix F6.2and Table 3.1 of this report respectively). Collaboratively funded research with the EU, or other organisations may achieve better value for money in this subject area
1. Costs are only indicative for identifying preferred option(s). Once the preferred option(s) are identified then budget prices for funding purposes will be provided after consultation with potential suppliers
TASK B EARLY DETECTION OF INTERNAL EROSION RESERVOIR SAFETY ADVICE FEASIBILITY REPORT DEFRA RESEARCH CONTRACT
02/11/2004 2:20 PM 61 of 70 L:\EWE_Operations\UK_D&W\XU0248 - Defra research\201 Task B Internal eroison\Stage 1 - Feasibility Report\Task B FINAL- on Defra web site\Vol 1\Task B Main text 05 Website.doc
7 GLOSSARY 7.1 Acronyms
ALARP As Low as is Reasonably Practicable ANCOLD Australian National Committee on large Dams www.ancold.org.au ASDSO USA : Association of State Dam Safety Officials. Set up in 1983, has
annual conference e.g. see Kalkani, 1998. www.damsafety.org BDS British Dam Society www.britishdams.org BHS British Hydrological Society. Chronology of British Hydrological
events on www.dundee.ac.uk/geography/cbhe BOR United States Bureau of Reclamation. www.usbr.gov. Dam safety
office Website borworld.usbr.gov/dsi. Responsible for dams in 17 western states of USA
CBA Cost Benefit Analysis CDA Canadian Dam association. website www.cda.ca/cda/main CEH Centre for Ecology and hydrology
http://www.nerc-wallingford.ac.uk/ih/ COSHH Control of Substances Hazardous to Health Regulations COMAH Control of Major Accident Hazards Regulations (SI 1999/743) �
implementing Council Directive 96/82/EC (the COMAH Directive) DCF Dam Critical Flood DEFRA Department for Environment, Food and Rural Affairs.
Website defra.gov.uk/environment EA Environment Agency (England). Flood warnings now available 24
hours/ day at www.environment-agency.gov.uk/floodwarning EC European Commission FEMA Federal Emergency Management Agency, USA
www.fema.gov/mit/damsafe FMEA Failure Modes and effect analysis (defined in terminology) FMECA Failure Modes, effect and criticality analysis FEH Flood Estimation handbook (IH, 1999) 5 volumes
http://www.nwl.ac.uk/feh/index.html FERC Federal Energy Regulatory Commission, USA FRS Floods and Reservoir safety. (ICE, 3rd Edition, 1996) FSR Flood Studies Report (NERC, 1975), and associated Supplementary
reports (1978-1988); also Guide (IH, 1978) HSC Health and Safety Commission HSE Health and Safety Executive Website www.hse.gov.uk/hse.board HSW Health and Safety at Work ICE Institution of Civil Engineers Website www.ice.org.uk ICODS US Inter-agency committee on dam safety (described on FEMA
website; ad-hoc committee set up in 1977; by 1998 had become �Federal Guidelines Development Subcommittee�)
ICOLD International Commission on Large Dams. website www.icold-cigb.org
IFF Imminent failure flood LCI Location, cause, indicator diagram, as described in RMUKR (CIRIA,
2000, Section 5.4.1) LLOL Likely loss of life, following dam failure PAR Population at risk, in event of dam failure
TASK B EARLY DETECTION OF INTERNAL EROSION RESERVOIR SAFETY ADVICE FEASIBILITY REPORT DEFRA RESEARCH CONTRACT
02/11/2004 2:20 PM 62 of 70 L:\EWE_Operations\UK_D&W\XU0248 - Defra research\201 Task B Internal eroison\Stage 1 - Feasibility Report\Task B FINAL- on Defra web site\Vol 1\Task B Main text 05 Website.doc
PMF/ PMP Probable maximum flood/ probable maximum precipitation QRA Quantitative Risk Assessment R2P2 Reducing Risk, protecting people (HSE, 2001) USACE United States Army Corps of Engineers. Website
www.usace.army.mil/inet/usace-docs. Responsible for dams in eastern USA
USSD United States Society on Dams (previously USCOLD). Website www2.privatei.com/~uscold/
7.2 Definitions and Terminology ALARP (As low as reasonably practicable)
A societal risk criterion in the F/N chart. Tolerable only if risk reduction is impracticable or if its cost is grossly disproportionate to the improvement gained.
Assessing Engineer The engineer carrying out the safety assessment using the Integrated System. Although this would often be the Inspecting Engineer carrying out a periodical inspection, this is not a pre-requisite for application of the system.
Cause Consequence diagram
This is constructed by defining a critical event and then developing the causes and consequences of this event. The forward development is similar to an event tree and the backward development is similar to a fault tree (Lees 1996, section 9/34)
Consequence The outcome or result of a risk being realised e.g. the impact on the downstream areas resulting from a dam failure as well as the impacton the dam itself.
Criticality Likelihood that the particular mechanism of deterioration could occur x Consequence for dam safety if it did occur
Dam critical external threat e.g. Critical Flood, Critical earthquake
The magnitude of the external threat that represents the integration of the conditional probability of failure (system response) over the range of potential load. (At this stage taken as equal to the Imminent failure event)
Dam-break analysis An analysis which provides an estimation of downstream flooding effects resulting from dam failure. The analysis includes a dam breach analysis and the routing of the dambreak hydrograph through the downstream channel.
Dam break affected zone That zone of flooding where the changes in depth and velocity of flooding due to dam break are such that there is a potential for incremental loss of life. The dambreak affected zone is sometimes limited to those areas where dambreak causes a rise in level of floodwaters greater than 300mm (this definition as ANCOLD, 2001; note that in 1998 FEMA in the US suggested greater than 600mm (Graham, 2000, page 955).
TASK B EARLY DETECTION OF INTERNAL EROSION RESERVOIR SAFETY ADVICE FEASIBILITY REPORT DEFRA RESEARCH CONTRACT
02/11/2004 2:20 PM 63 of 70 L:\EWE_Operations\UK_D&W\XU0248 - Defra research\201 Task B Internal eroison\Stage 1 - Feasibility Report\Task B FINAL- on Defra web site\Vol 1\Task B Main text 05 Website.doc
Deterministic approach Leading to reasonably clear cut solutions based on prescriptive rules without considering the uncertainties in the analytical process. A typical result of a deterministic safety approach is the factor of safety (Kreuzer, 2000)
Event tree analysis A technique which describes the possible range and sequence of outcomes which may arise from an initiating event
Emergency plans
The procedures to be followed in the event of predicted likely failure of a dam, including the actions to be taken by the dam owner/operator and the emergency services.
Engineering judgement The professional opinion of an appropriately qualified engineer (different from Expert Judgement)
Event Train The sequence of events starting with an initiating event and ending with its consequences. How could xxxx have happened? The number of intermediate events is dependent on the failure mechanism being considered, e.g. leakage of a dam, an escalation of the leakage, leading to failure of the dam, a release of water, with the consequence of potential fatalities. It varies from logic diagrams which quantify the probability of events, as event train are purely qualitative.
Event Tree An event tree is used to develop the consequences of an event, i.e. what happens if xxxx happens?. The event tree is both a qualitative and a quantitative technique. Qualitatively it is used to identify the individual outcomes of the initial event, while quantitatively it is used to estimate the frequency or probability of each outcome. An event tree is constructed by defining an initial event e.g. overtopping and the possible consequences which flow from this. The main elements of the tree are event definitions and branch points or logic vertices; these points being precisely defined as TRUE / FALSE (see Section 9.6 of Lees, 1996)
Expert Judgement Opinion of quantitative likelihood of an event elicited by a trained elicitor under controlled conditions, and which satisfies axioms of probability theory (see Skipp & Woo, 1993)
External threats External loads such as floods and earthquake are random natural events which can be measured and extrapolations made to estimate the magnitude of extreme events that could cause failure of the dam. They are different from the specific mechanisms that can cause degradation of the dam, which are termed mechanism(s) of deterioration.
Failure (of a dam) A uncontrolled sudden large release of retained water (large is in relation to the downstream channel and is taken to be greater than the lesser of the mean annual flood or bank full flow)
TASK B EARLY DETECTION OF INTERNAL EROSION RESERVOIR SAFETY ADVICE FEASIBILITY REPORT DEFRA RESEARCH CONTRACT
02/11/2004 2:20 PM 64 of 70 L:\EWE_Operations\UK_D&W\XU0248 - Defra research\201 Task B Internal eroison\Stage 1 - Feasibility Report\Task B FINAL- on Defra web site\Vol 1\Task B Main text 05 Website.doc
Failure mode(s) Means by which a failure (uncontrolled sudden large release of water) may occur. Four failure modes are differentiated in this contract, namely external erosion (including overtopping), internal erosion (through body of dam, or at contact with a structure), sliding and appurtenant works.
Fault tree A logic diagram is used to develop the causes of an event. It starts with the event of interest, the top event, such as a dam failure, and is developed from the top down. The fault tree is both a qualitative and a quantitative technique. Qualitatively it is used to identify individual paths which led to the top event, while quantitatively it is used to estimate the frequency or overall probability of that event, e.g. failure of complete system through the use of AND/OR TESTS at each branch point (see Section 9.5 of Lees, 1996)
F-N curve A graph showing the relationship between the frequency of an event (F) causing N or more fatalities plotted on a log-log plot and the number of fatalities (N). They may be plotted on a �non-cumulative� basis and are referred to as fN curves, or on a �cumulative � basis and referred to as FN curves (where F is the likelihood of N or morefatalities). Examples of these and other forms of presentation are given in Annex 1 of Ball & Floyd (1998).
FMEA Tabular approach using columns to define function e.g. separate columns for • how function fails, • the failure mode that causes functional failure • assessing the effects of that failure both locally and globally. Description given in BS 5760-5:1991 and ANCOLD (2001).
FMECA As FMEA but also assesses both the likelihood of the event occurring and the consequences (the last two columns of FMEA). Description given in BS 5760-5:1991.
Frequency A measure of likelihood expressed as the number of occurrences of an event in a given time or in a given number of trials. See also Likelihood and Probability.
Hazard A situation with a potential for human injury, property damage or other undesirable outcome.
Imminent failure load External load of a magnitude such that the dam would just fail e.g. Imminent failure flood
Incident Detectable change in Indicator causing sufficient concern to lead to some action (three levels are used in NDD; Levels 2 to 4 as shown in Table C.2)
Indicator Measurable outcome from the application of a mechanism of deterioration e.g. deformation, seepage, instrumentation results (see Table 2.3).
TASK B EARLY DETECTION OF INTERNAL EROSION RESERVOIR SAFETY ADVICE FEASIBILITY REPORT DEFRA RESEARCH CONTRACT
02/11/2004 2:20 PM 65 of 70 L:\EWE_Operations\UK_D&W\XU0248 - Defra research\201 Task B Internal eroison\Stage 1 - Feasibility Report\Task B FINAL- on Defra web site\Vol 1\Task B Main text 05 Website.doc
Inspecting Engineer A qualified civil engineer employed by the undertakers to inspect a reservoir in accordance with Section 10 of the Reservoirs Act 1975.
Integrated system A system for carrying out a Risk assessment on a single dam, that quantifies the overall probability of failure from all the various threats to the safety of a dam, evaluates the consequences of failure and thus the risk posed by the dam and provides some measure of whether this risk is tolerable.
Internal threat Internal threats relate to mechanisms of deterioration that occur within the body of the dam. These are • not necessarily random natural events (and thus amenable to
statistical analysis), • often difficult to measure (and thus not amenable to analysis of
trend or other time or dose related analysis of measured parameters)
• much less well understood in terms of mechanism of behaviour
Intrinsic condition Current physical property or dimension of the dam which can be measured and which affects the outcome of the application of a mechanism of deterioration. Although initially determined by design and construction details; this may change with time due to ageing, neglect, maintenance or upgrading.
Joint probability The probability that two or more variables will assume certain values simultaneously or within particular time intervals.
Large dam That listed on the World Register of Large Dams published by ICOLD. To qualify for the ICOLD register of large dams the dam must be 15m above the lowest foundation level. However, dams between 10 and 15m in height may be included if they also exceed one of the following criteria: length of crest 500m, reservoir capacity 1 Mm3, maximum flood discharge of 2000m3/s or if the dam had difficult foundation problems or is of unusual design.
Large raised reservoir As defined in the Reservoirs Act 1975, namely designed to hold, or capable of holding more than 25,000m3 above the lowest natural ground level adjoining the reservoir
Likelihood Used as a qualitative description of probability and frequency.
Logic diagrams Diagrams such as event tree, fault tree and cause consequence diagrams which quantify the probability of events through logic gates at the intersection points (i.e. have GO/NO-GO or AND/OR gates) and probabilities on each branch.
Mechanism(s) of deterioration
Process by which the integrity of the dam is undermined. The mechanism can have a quantitative threshold above which deterioration is likely to occur e.g. slope protection designed to withstand waves due to 100 year wind
TASK B EARLY DETECTION OF INTERNAL EROSION RESERVOIR SAFETY ADVICE FEASIBILITY REPORT DEFRA RESEARCH CONTRACT
02/11/2004 2:20 PM 66 of 70 L:\EWE_Operations\UK_D&W\XU0248 - Defra research\201 Task B Internal eroison\Stage 1 - Feasibility Report\Task B FINAL- on Defra web site\Vol 1\Task B Main text 05 Website.doc
Monte Carlo Simulation Determination of the probabilities or annual probabilities of events for complex systems, where the system configuration and the failure and repair characteristics of the dam�s components (input data) are known or can be estimated. The time period is divided into small increments and simulation of operation of the system repeated until the output probability distribution stabilises.
Overtopping Water flowing over the top of the dam, other than over spillweirs or other overflow devices.
Panel engineer A civil engineer appointed to panels by the Secretary of State under the Reservoirs Act 1975, who can be appointed by an undertaker to inspect, design or supervise a reservoir.
Portfolio risk analysis Assessment of risk for a group of dams within a defined responsibility
Probability (type) It may appear intuitively obvious what is meant by probability, but the word in fact has several meanings. Moreover, the distinctions are of some practical importance. They are relevant, for example, to the question of the relative weight which should be attached to field data and to other information available to individuals. The following is reproduced from Lees (1996, Section 7.4)
�a) Equal likelihood - One definition of probability derives from the principle of equal likelihood. If a situation has n equally likely and mutually exclusive outcomes, and if nA of these out-comes are event A, then the probability P(A) of event A is: P(A)=
This probability can be calculated a priori and without doing experiments. The example usually given is the throw of an unbiased die, which has six equally likely outcomes: the probability of throwing a one is 1/6. This definition of probability is often of limited usefulness in engineering because of the difficulty of defining situations with equally likely and mutually exclusive outcomes.
b) Relative Frequency - The second definition of probability is based on the concept of relative frequency. If an experiment is performed ntimes and if the event A occurs on nA of these occasions, then the probability P(A) of event A is: P(A)= This probability can only be determined by experiment. This definition of reliability is the one which is most widely used in engineering. In particular, it is this definition which is implied in the estimation of probability from field failure data.
nA n
Lim n ∞
nA n
nAn
TASK B EARLY DETECTION OF INTERNAL EROSION RESERVOIR SAFETY ADVICE FEASIBILITY REPORT DEFRA RESEARCH CONTRACT
02/11/2004 2:20 PM 67 of 70 L:\EWE_Operations\UK_D&W\XU0248 - Defra research\201 Task B Internal eroison\Stage 1 - Feasibility Report\Task B FINAL- on Defra web site\Vol 1\Task B Main text 05 Website.doc
c) Personal Probability (Expert judgement) - A third definition of probability is degree of belief. It is the numerical measure of the belief which a person has that the event will occur. Often this corresponds to the relative frequency of the event. But this is not always so, for several reasons. One is that the relative frequency data available to the individual may be limited or non-existent. Another is that even if he has such data, he may have other information which causes him to think that the data are not the whole truth. There are many possible reasons for this. The individual may doubt the applicability of the data to the case under consideration, or he may have information which suggests that the situation has changed since these data were collected.
It is entirely legitimate to take into account such personal probabilities. There are several branches of probability theory which attempt to accommodate personal probability. These include ranking techniques (e.g. Siegel, 1956), which give the numerical encoding of judgements on the probability of ranking of items, and Bayesian methods (e.g. Breipohl, 1970), which allow probabilities to be modified in the light of additional information. Further discussions of personal probability are given by Savage (1962) and by Tribus (1969).�
It should be noted that ANCOLD also distinguish three different types of probability, where �a� and �b� above are included in one type (statistical) with a separate type as follows: Mathematical - a probability based on axioms (self evident truth). A probability curve being a mathematical abstraction where the mathematician is interested in the formal properties of such curves independent of their interpretation.
Probability (terms)
Care should also be taken in differentiating whole life probability from annual rate (termed annual probability in this report); as there are important constraints on the way they may be combined. Although annual probability are strictly rates the distinction becomes negligible when they are small. If events are occurring at rate λ, then the probability of one of more of these events occurring in unit time is 1-eλ. And when λ is small, this is almost exactly the same as λ. So a rate of λ per annum equates almost exactly to an annual probability of λ, provided λ is small. How small does it need to be? Well, 10-3 is certainly small enough, and even 10-1 is not bad. It is emphasised that since they are small within the context of this project we can also think of them as mean rates per annum.
TASK B EARLY DETECTION OF INTERNAL EROSION RESERVOIR SAFETY ADVICE FEASIBILITY REPORT DEFRA RESEARCH CONTRACT
02/11/2004 2:20 PM 68 of 70 L:\EWE_Operations\UK_D&W\XU0248 - Defra research\201 Task B Internal eroison\Stage 1 - Feasibility Report\Task B FINAL- on Defra web site\Vol 1\Task B Main text 05 Website.doc
It is also important to understand the difference between annual probability (AP) and annual exceedance probability (AEP). The latter tends to be used when defining design loading, where all events in excess of the design threshold are of interest. Both annual probabilities and annual exceedance probabilities technically refer to the probability of one or more events occurring in a year. This is unimportant as when the probabilities are small, the chance of two or more occurring in a year is extremely small, so (to the same order of approximation as approximating annual probabilities by rates) the probability of one or more event in a year is almost exactly equal to the probability of just one.
Probability density function
A function describing the relative likelihood that a random variable will assume a particular value in contrast to taking on other values.
Qualitative risk assessment
A risk assessment process conducted purely on a qualitative basis with no numerical data.
Quantitative risk assessment
A risk assessment process involving the use of numerical data. This is normally undertaken when a facility or operation has a major hazard potential for either the workforce, fixed assets or the public.
Reliability Likelihood of successful performance of a given project element. It may be measured on an annualised basis or for some specified time period of interest. Mathematically, Reliability = 1 � Probability of failure.
Return period The average expected time (in terms of probability) between floods equal to or greater than a stated magnitude.
Risk The probability or frequency of an event occurring with a measurement of the event�s consequences (Lees 1996, Section 9/97). (NB: There are a number of alternate definitions for risk as described in Section A1 of RMUKR. From a recommendation of Prof. T. O�Hagan and the E&P Forum 1996 (from the oil and gas industry) the above definition is the preferred definition for this study.)
Risk Analysis
The quantitative evaluation of the likelihood of undesired events and the likelihood of harm or damage being caused. It involves identification of the hazard, assessment of the probability of its occurrence and the magnitude of its consequences.
Risk assessment
Combines risk analysis with evaluation of the acceptable risk (as Figure E.1 and 6.1 of the report on Intergation of Floods and refervoid safty, derived from Figure 1 of Kreuzer, 2000)
TASK B EARLY DETECTION OF INTERNAL EROSION RESERVOIR SAFETY ADVICE FEASIBILITY REPORT DEFRA RESEARCH CONTRACT
02/11/2004 2:20 PM 69 of 70 L:\EWE_Operations\UK_D&W\XU0248 - Defra research\201 Task B Internal eroison\Stage 1 - Feasibility Report\Task B FINAL- on Defra web site\Vol 1\Task B Main text 05 Website.doc
Risk aversion A phrase that indicates the inherent aversion to "high risk", or more correctly high consequence, events. It is accepted that events resulting in multiple fatalities should occur at a lower frequency than events that cause a single fatality, usually at a rate proportional to the number of fatalities (i.e. an event causing ten fatalities should occur at a frequency at least ten times lower than events causing single fatalities).
Risk control Actions to avert risk by alternative solutions and to reduce risk by surveillance.
Risk evaluation Evaluation of what constitutes tolerable risk (risk acceptance criteria)
Risk management Combination of risk assessment and risk control to manage risk to a tolerable level along with normal commercial risks.
Section 105 survey A survey undertaken by the Environment Agency to identify areas at risk of flooding, undertaken in accordance with Section 105 of the Water Resources Act, 1991.
Societal concern Societal concerns arise when the realisation of a risk impacts on society as a whole i.e. a large number of people may be killed at one time, where potential victims are particularly vulnerable (such as children) or where the nature of the risk inspire dread (such as long term or irreversible effects) (taken from par. 31 to 32 of HSE Guidelines (Dec 2001) on whether dutyholders have reduced risk to ALARP level)
Supervising engineer A qualified civil engineer employed by the undertakers to supervise a reservoir in accordance with Section 12 of the Reservoirs Act 1975.
Threat Random Event (External threat) or Potential Internal Instability (Internal threat) that poses a threat to the integrity of the dam. The latter is subdivided as shown on Table 2.2.
Tolerable A willingness to live with a risk so as to secure certain benefits and in the confidence that the risk is one that is worth taking and that it is being properly controlled (HSE, 2000, page 3)
Uncertainty Previously used to refer to situations where the likelihood of potential outcomes could not be described by objectively known probability density functions. Now used to describe any situations without sureness, whether or not described by a probability distribution. In the context of dam safety, uncertainty can be attributed to (i) inherent variability in natural properties and events, and (ii) incomplete knowledge of parameters and the relationships between input and output values.
Vulnerability The extent that people, property etc could be impacted by a dam failure
Wear-in Failures in the first five years of the life of a dam


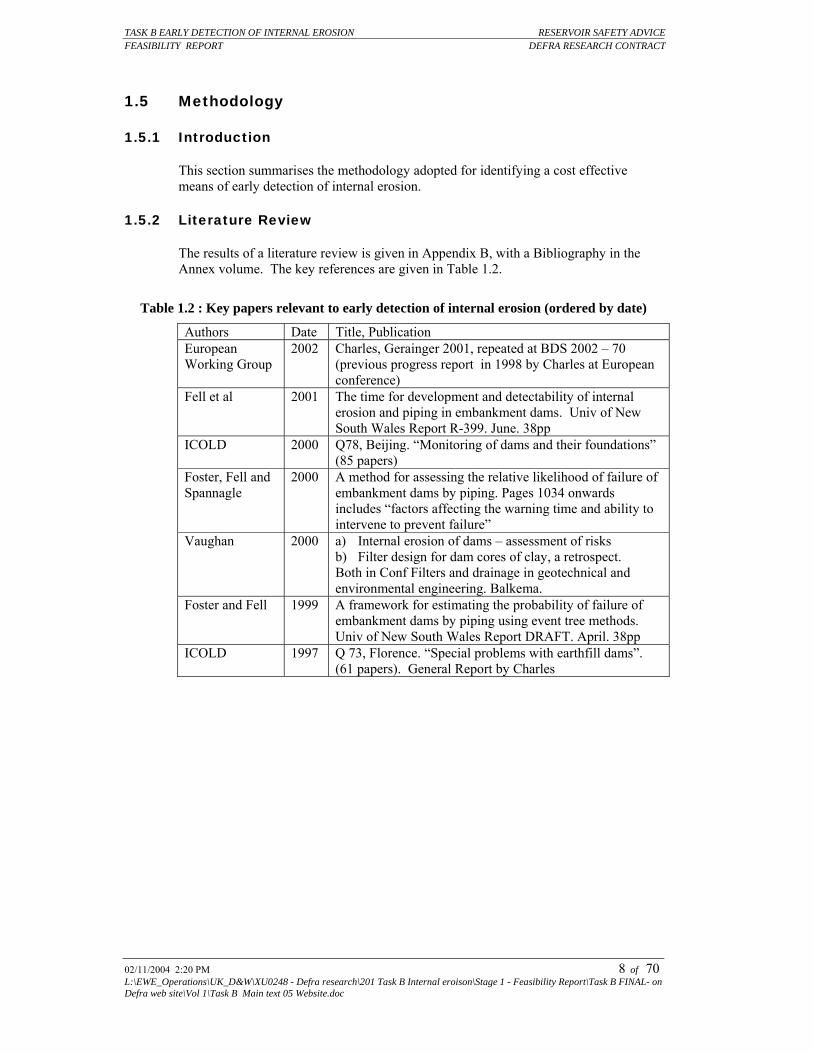


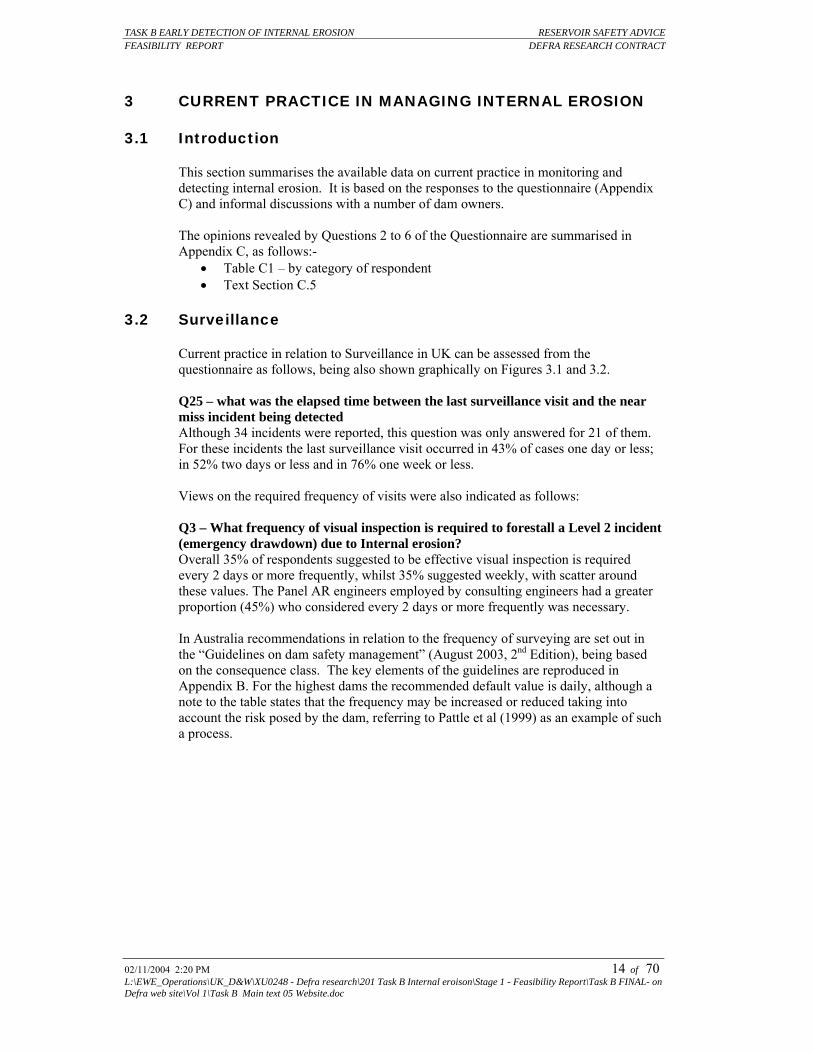


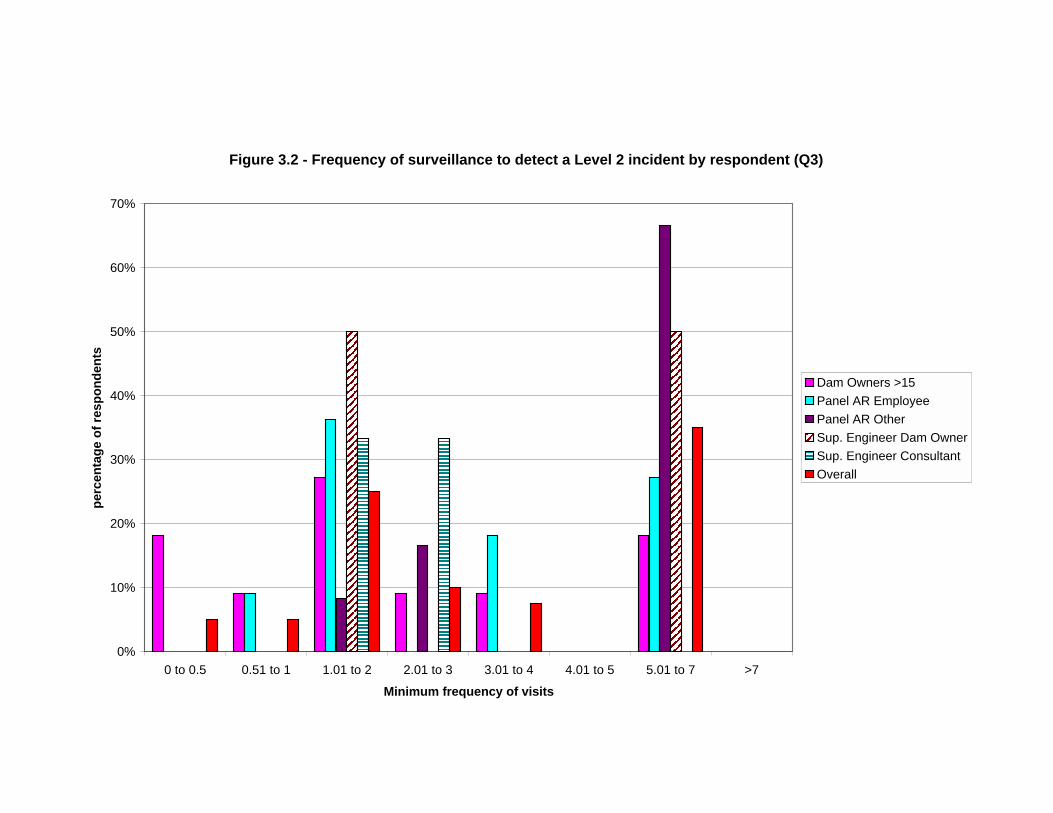


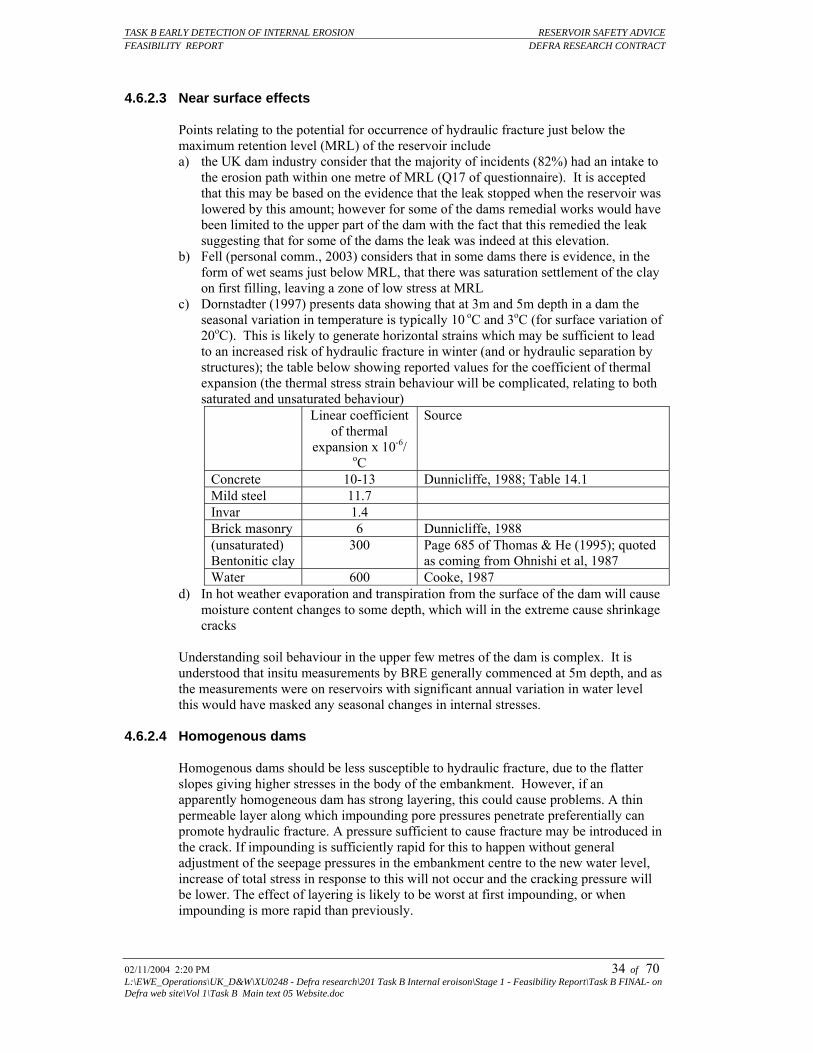


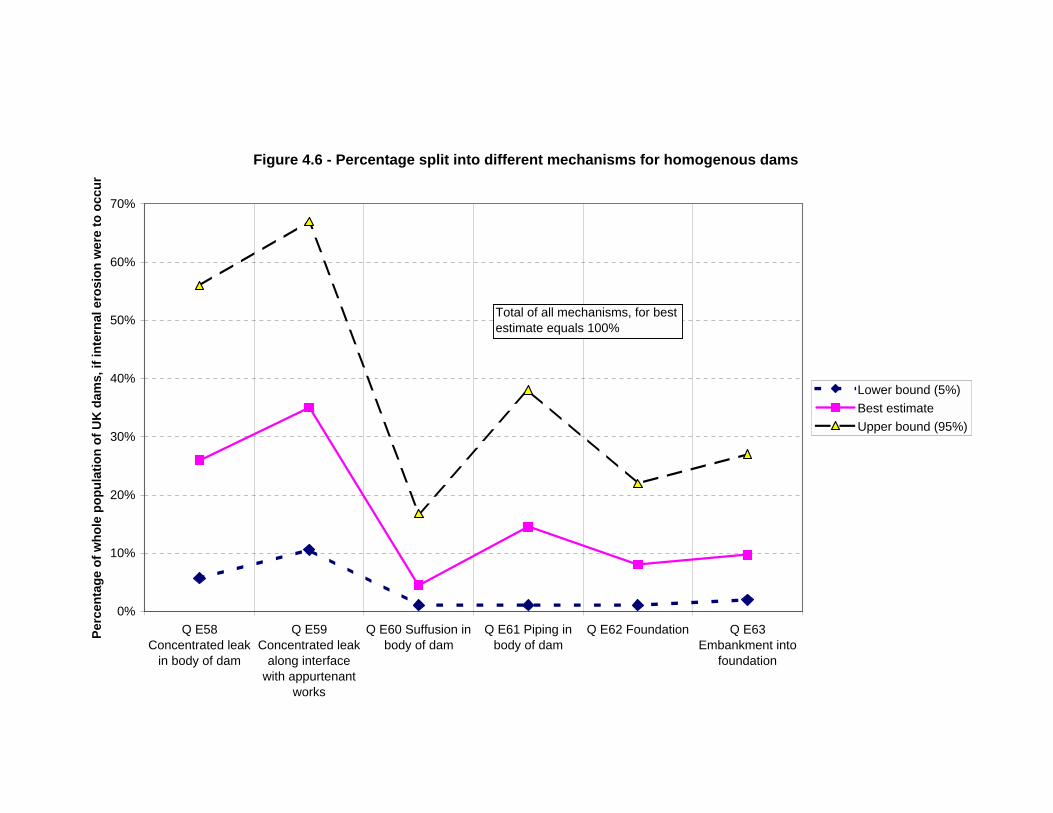


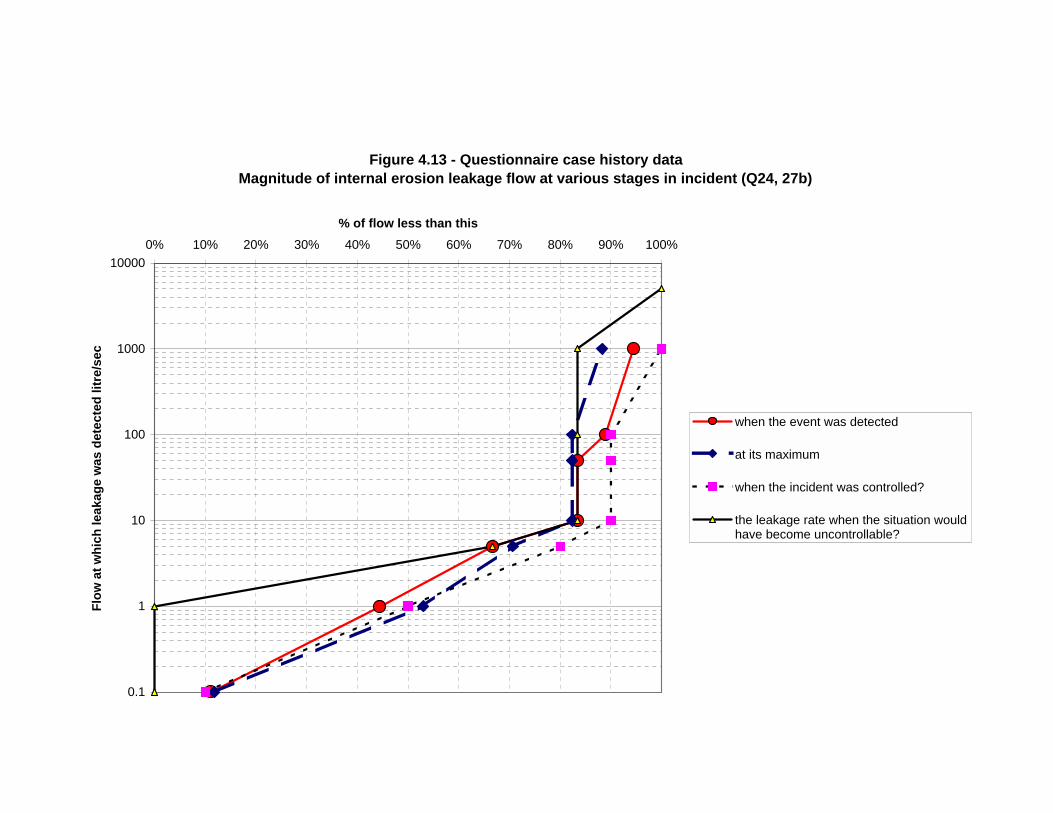

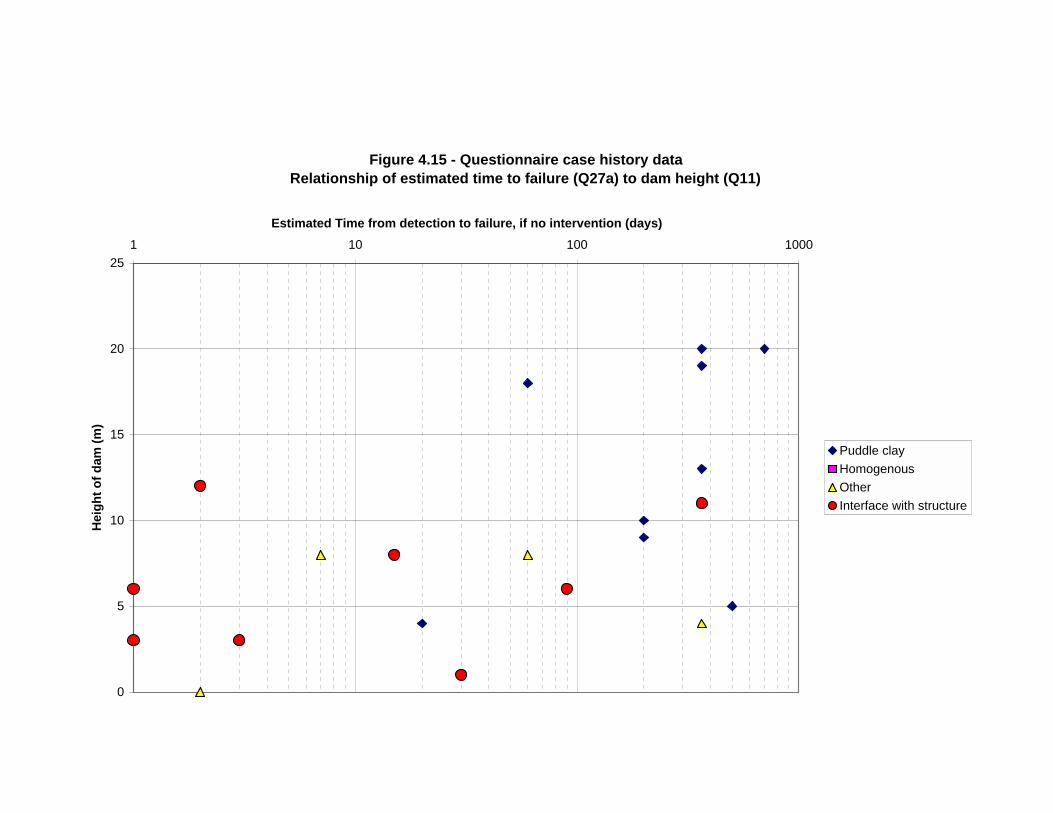


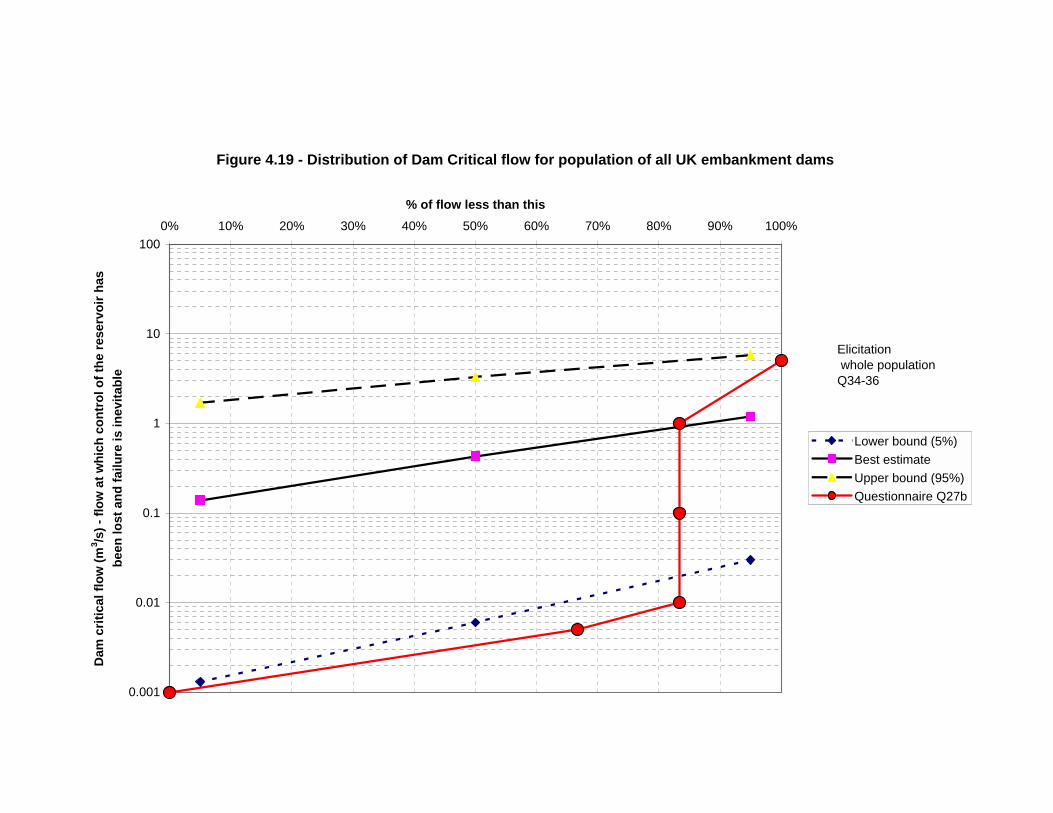


![Corrosion detection of reinforced concrete beams with ... · advances and applications of wavelet analysis for damage detection. Kijewski and Kareem [9] evaluated the feasibility](https://static.documents.pub/doc/80x56/6019d0d99778dd31d7478495/corrosion-detection-of-reinforced-concrete-beams-with-advances-and-applications.jpg)


