41
Early Learning Coalition of Duval Report 2005-06

Early Learning Coalition of Duval
Report2005-06

THE EARLY LEARNING COALITION OF DUVAL 2005-2006 REPORT
Table of Contents
2005-2006 PARTICIPATING CHILDREN AND SITES ............................................................................2
THE EARLY LEARNING COALITION ASSESSMENT PLAN ......................................................................... 4
MEASUREMENT INSTRUMENTS .........................................................................................................5
Test of Early Reading Achievement - Third Edition (TERA-3)...........................................5
Alphabet Letter Recognition Inventory (ALRI) ..................................................................7
The BRIGANCE Screens ......................................................................................................8
ASSESSING PARTICIPATING CHILDREN .............................................................................................8
ATTRITION OF CHILDREN..................................................................................................................9
EVALUATION QUESTIONS ...............................................................................................................10
EVALUATION RESULTS ...................................................................................................................11
Question 1: What preschool children formed the population for the 2005-2006 evaluation?.....................................................................................................................................11
Question 2: Were services sponsored by the ELC, with joint funding and collaboration from the JELP, effective in improving the emergent literacy ability of preschool children based on the TERA-3 Reading Quotient and scale scores?...........................................................13 Question 3: How did the participating preschool children's year-end ability to recognize the upper- and lowercase letters of the alphabet compare to national performance benchmarks in letter recognition? .................................................................................................17 Question 4: Were services sponsored by the ELC, with joint funding and collaboration from the JELP, effective in improving the school readiness of preschool children based on scores from the BRIGANCE Screens? .....................................................................................19
CONCLUSIONS.................................................................................................................................22
Prepared by the Florida Institute of Education at the University of North Florida – October 2006 i

PART II: A QUASI-EXPERIMENTAL STUDY OF THE SCHOOL READINESS OF KINDERGARTEN CHILDREN WHO EXPERIENCED LITERACY-FOCUSED PRESCHOOL CURRICULA SPONSORED BY THE
EARLY LEARNING COALITION OF DUVAL COUNTY, INC. AND THE JACKSONVILLE EARLY LEARNING PARTNERSHIP
DATA ..............................................................................................................................................25
METHODOLOGY ..............................................................................................................................26
Propensity Score Strata ......................................................................................................27
RESULTS .........................................................................................................................................29
Outcome Measures.............................................................................................................29
Statistical Tests ..................................................................................................................30
Early Screening Inventory – Kindergarten (ESI-K) ..............................................31
DIBELS Letter Naming Fluency (LNF).................................................................33
DIBELS Initial Sounds Fluency (ISF)....................................................................34
Summary of the Results ..........................................................................................36
CONCLUSIONS/DISCUSSION ............................................................................................................37
Prepared by the Florida Institute of Education at the University of North Florida – October 2006 ii

THE EARLY LEARNING COALITION OF DUVAL 2005-2006 REPORT
School readiness begins long before children enter kindergarten—in fact, it is a
continuous process that begins at birth. Research findings support the benefits of programs aimed
at preparing young children for school, and show that high-quality early education is particularly
beneficial for economically disadvantaged children, many of whom begin formal schooling
under-prepared for the challenges they will face. In 1999, the Florida Legislature recognized the
economic and social importance of preparing our youngest children for kindergarten and passed
the School Readiness Act, which sought an integrated, seamless delivery system for early
education and care programs through county or regional school readiness coalitions. In Duval
County, the Early Learning Coalition of Duval, Inc. (the ELC) filled this role, with a goal of
ensuring the school readiness of children as they enter kindergarten.
The ELC (formerly known as the Duval County Ready Child Coalition) understood that
to accomplish its goal, a system of services supported by local government and community
agencies was required. With an explicit focus on economically disadvantaged children, the ELC
developed and coordinated an integrated system of health, education, and support services.
Families, working in concert with local organizations, have access to resources to help their
children develop cognitively, affectively, socially, and physically, thereby better preparing these
children for entry into kindergarten.
In addition to meeting a child's basic needs, the ELC recognized early literacy as an
important key to future academic success. Children who do not learn to read early and read well
will not easily master other important skills as they progress through school. Consequently,
beginning with the 2002-2003 academic year, the ELC funded a three-year initiative designed to
Prepared by the Florida Institute of Education at the University of North Florida – October 2006 Page 1
improve the early literacy achievement of economically disadvantaged children. In the first two
years, the Duval County Professional Development Consortium (using multiple funding streams)
worked with approximately 250 preschool teachers and 3,700 preschool children.
In the third year of the project (the 2004-2005 academic year), the Duval County
Professional Development Consortium and the ELC joined the newly convened Jacksonville
Early Literacy Partnership (JELP), led by Jacksonville Mayor John Peyton. The additional
funding available through JELP increased the number of centers served and expanded technical
assistance and coaching beyond preschool classes to infant and toddler classrooms in the
partnership centers, creating a more seamless system of school readiness services in centers
located in low-income neighborhoods. This report reflects the combined efforts of the ELC and
the JELP.
2005-2006 PARTICIPATING CHILDREN AND SITES
In 2005-2006, the ELC continued its leadership role in improving the quality of early
care and learning services for Jacksonville’s school readiness children and children attending
child care centers in low-income neighborhoods. As a function of the JELP collaboration and
blended funding, the ELC provided services to 366 preschool and 296 infant/toddler classrooms
in 165 child care settings serving 7,851 children (2,493 infant/toddlers and 5,358 preschoolers).
Table 1 lists the number of centers, classrooms, and children served by partner organizations.
Prepared by the Florida Institute of Education at the University of North Florida – October 2006 Page 2

Table 1 The Number of Sites, Teachers, and Children Served by Affiliated Partners (as of March 2006)
Number of Collaborative Partner Sites Classes Children
Duval County Public Schools 11 14 Preschoo1 11 Infant/Toddler
179 74
Episcopal Children’s Services 69 142 Preschoo1 140 Infant/Toddler
1962 1229
Florida Institute of Education at the University of North Florida 4 10 Preschool 172
Jacksonville Children’s Commission 56 113 Preschool 145 Infant/Toddler
1578 1190
Jacksonville Urban League Head Start Program 25 87 Preschool 1468
For the participating preschool classrooms, the blended funding was used in part to
purchase the materials needed to craft a rich environment. To ensure that children were exposed
to learning and literacy experiences, the participating classrooms needed to be language- and
print-rich—in fact, learning-rich. In a learning-rich classroom, posters and materials are affixed
to the walls at the child's eye-level. The upper- and lowercase letters of the alphabet are
prominently displayed, as are the names and photographs of the children in the class and
picture/word cards. Activity centers are created to provide opportunities for frequent, purposeful
early literacy and learning experiences.
In addition, the funding provided coaches for the preschool teachers. Coaches were
available to assist the teachers as they created and sustained their learning-rich environments and
began to implement one of two research-based and literacy-focused curricula developed by either
Episcopal Children's Services or the Florida Institute of Education (FIE). The knowledge and
pedagogical skills of preschool teachers grew through continual job-imbedded, literacy-focused
training.
Prepared by the Florida Institute of Education at the University of North Florida – October 2006 Page 3

The infant/toddler classrooms served by ELC and JELP also received visually stimulating
materials to facilitate child learning. Coaches in these classrooms focused their efforts on helping
participating infant/toddler teachers create learning-rich environments, establish warm and caring
relationships with the children in their care, and engage in literacy-focused experiences that
provide a strong foundation for later learning.
THE EARLY LEARNING COALITION ASSESSMENT PLAN
Each year the ELC develops a work plan to submit to the Florida Agency for Workforce
Innovation (AWI). The work plan includes an assessment plan that lists the measurement
instruments used to satisfy the legislative mandates and statutory regulations governing the
administration and operation of school readiness programs in Florida. FIE provided technical
assistance in guiding the choice of sound measures for use with preschool children, measures
that would also provide reliable and useful data to answer questions raised by coalition
stakeholders. Therefore, the two needs addressed by the choice of instruments were to provide:
a pretest to assess children when they enter a program and a posttest to assess children when they leave the program; and
valid data from standardized measures that can be used by the ELC to answer questions about program effectiveness and progress toward meeting ELC goals.
To address these needs, FIE, in collaboration with ELC staff and the Quality Rating
System (QRS) Work Team, reviewed available instruments that can be used for assessing young
children. They then developed an assessment plan to meet the legislative mandates and the
assessment standards. After selecting instruments, assessments were carried out in child-
sensitive, time-conscious, and unobtrusive ways. FIE-trained assessors administered the
Prepared by the Florida Institute of Education at the University of North Florida – October 2006 Page 4

standardized measures in one-on-one settings, and classroom teachers, trained by preschool
coaches, administered the Alphabet Letter Recognition Inventory (ALRI).
MEASUREMENT INSTRUMENTS
Three instruments were selected to measure the children’s achievement. The Test of
Early Reading Ability-Third Edition (TERA-3) and the Alphabet Letter Recognition Inventory
(ALRI) assess important components of children’s reading readiness. Results of the ALRI, a
measure of letter recognition, were reported in ways that allow teachers to more effectively meet
the individual needs of children. The BRIGANCE Screens (Preschool Screen-II and K&1 Screen-
II) were used to inform instruction as well as to serve as a pretest and posttest assessment of
children enrolled in the ELC school readiness program. Responses to all three assessments were
recorded on scannable forms and computer scored.
Test of Early Reading Achievement - Third Edition (TERA-3)
The TERA-3 is a norm-referenced test that assesses components of early reading skills,
including familiarity with the letters of the alphabet and numerals, discovery of the arbitrary
conventions used in reading and writing English, and recognition that print conveys information,
ideas, and thought. The test is composed of three scales: Alphabet, Conventions of Print, and
Meaning, each measuring one of the three components. In addition, a composite score, called the
Reading Quotient, is the standardized sum of the three standardized scale scores.
The Alphabet scale includes measures of whether children can recognize different forms of printed letters; recognize the names of letters; and distinguish beginning, middle, and ending sounds in words.
The Conventions of Print scale includes measures of whether children are familiar with the ways that books are organized (front to back) and how text on a page is read (left to right and top to bottom).
Prepared by the Florida Institute of Education at the University of North Florida – October 2006 Page 5

The Meaning scale includes measures of whether children can understand the meanings of printed words.
TERA-3 can be administered to children as young as three years, six months and as old
as eight years, six months. Because children undergo rapid development over the age span
covered by the TERA-3, raw scores are normed relative to fourteen different groups of children
covering the age range of the test. Depending on the time between pretest and posttest and the
age of the child at pretest, a posttest score may be interpreted relative to a different age group
than the pretest. This process adjusts standardized scores for natural maturation and allows
detection of gains that result from programs.
The TERA-3 Reading Quotient scores are reported as norm-referenced, standardized
scores with a mean of 100 and a standard deviation of 15. The TERA-3 scale scores are reported
as norm-referenced, standardized scores with a mean of 10 and a standard deviation of three.
Because reported scores are norm-referenced, a change in scores represents a change in the
rankings of scores relative to the normative populations and does not represent an absolute gain
in knowledge. Based on the normative populations, the performance of children assessed with
the TERA-3 can be displayed in seven categories ranging from Very Poor to Very Superior.
Table 2 shows the ranges of the TERA-3 Reading Quotient and the scales scores relative to the
national normative population. These scores and categories are used in this report to indicate the
participating children’s emergent literacy ability.
Prepared by the Florida Institute of Education at the University of North Florida – October 2006 Page 6

Table 2 TERA-3 Reading Quotient and Scale Scores by Ability Categories
Score Categories
Very Poor
Poor Below Average Average Above
Average Superior Very Superior
Reading Quotient Score Intervals
Below 70
70-79 80-89 90-110 111-120 121-130 Above 130
Scale Score Intervals
Below 4
4-5 6-7 8-12 13-14 15-16 17-20
Percentiles 2nd or lower
3rd to 9th
10th to 25th
26th to 75th 76th to 90th 91st to 97th 98th or higher
Alphabet Letter Recognition Inventory (ALRI)
The ALRI is a locally developed inventory measuring children’s ability to recognize and
name the upper- and lowercase letters of the alphabet when presented in non-alphabetic order.
The test is given by the classroom teacher and is used, in part, to guide classroom instruction.
Teachers use alphabet letter flashcards to administer the ALRI in one-on-one settings.
The uppercase letters are presented first, followed by the lowercase letters. The score represents
the number of correctly identified letters. ALRI scores are reported in four recognition
categories: 0 to 13 letters, 14 to 26 letters, 27 to 39 letters, and 40 to 52 letters.
The Early Childhood Longitudinal Study-Kindergarten (ECLS-K) provides a national
benchmark for alphabet letter recognition. In this study, a random sample of upper- and
lowercase letters were presented to children. ECLS-K researchers classified letter recognition as
proficient if children named at least 75% of the sampled letters.1 Reports using ECLS-K data
1 U.S. Department of Education, National Center for Education Statistics. Early childhood longitudinal study, kindergarten class of 1998-1999: Data files and electronic codebook. NCES2001-028 {CD ROM} On-line ordering at http://www.ed.gov?pbus/edpubs.html
Prepared by the Florida Institute of Education at the University of North Florida – October 2006 Page 7

indicate that 66% of children entering kindergarten for the first time were proficient in letter
recognition.2
The BRIGANCE Screens
The BRIGANCE Screens (BRIGANCE Screens) include a series of four instruments
(Infant & Toddler Screen, Early Preschool Screen-II, Preschool-II, and K & 1 Screen-II) that are
intended to quickly and accurately identify those children who may have developmental
problems, including language impairments, learning disabilities, or cognitive delays. Because the
BRIGANCE Screens sample all developmental domains, they can be used to refer children for
services as well as to measure learning over time.
The BRIGANCE Screens were administered to all school readiness children (who were
four years old on or before September 1, 2005) in Jacksonville child care centers; to a sample of
eligible ELC school readiness children cared for in Family Child Care Homes; and to
participating children enrolled in Quality Rating System (QRS) centers who had informed
parental consent. The scores from the BRIGANCE Screens can be used in three ways:
to inform instruction,
to compare the performance of individual children to the mastery of the content, and
to compare the scores of children to the performance of a national sample of similarly aged children.
ASSESSING PARTICIPATING CHILDREN
Data for this report are drawn from three populations: a sample of preschool children
enrolled in approximately 100 centers receiving intensive support to prepare the centers for the
2 U.S. Department of Education, National Center for Education Statistics. Entering kindergarten: A portrait of American children when they begin school: Findings from the condition of education, Nickolas Zill and Jerry West, NCES2001-035, Washington DC: U.S. Government Print Office, 2001. Available at http://nces.ed.gov/pubs2001/2001023.pdf
Prepared by the Florida Institute of Education at the University of North Florida – October 2006 Page 8

ELC Quality Rating System (QRS); a sample of preschool children enrolled in the Jacksonville
Urban League Head Start program; and all school readiness children served by the ELC in
centers plus a random sample of 10% of school readiness children served in Family Child Care
Homes (FCCH). Children who were four years old by September 1, 2005 were eligible for
assessment. The 2005-2006 assessment plan, depicted in Table 3, used three strategies:
a random sample of children from partner agencies with informed parental consent was administered the TERA-3;
all children enrolled in QRS centers who had informed parental consent, all eligible ELC school readiness children enrolled in partnership centers, and a 10% sample of school readiness children enrolled in FCCH were administered the BRIGANCE; and
all eligible children were administered the ALRI.
Table 3 2005-2006 ELC Sampling Plan
2005-2006 Assessment Sample Assessment Children
TERA-3 (a proportionate random sample of 4-year-old children with informed consent from DCPS, ECS, FIE/UNF, JCC, and JULHS)
949
BRIGANCE (all eligible 4-year-old school readiness children enrolled in centers, a 10% sample of school readiness children enrolled in FCCH; and all children with informed consent enrolled in QRS centers)
1662
ALRI (all eligible 4-year-old children at participating sites) 2948
ATTRITION OF CHILDREN
Attrition of children was due to both child and site factors, because some locations closed
during the school year. The study of the attrition of the participating children is based on the
TERA-3 scores, as they are the best indication of the initial achievement of the children and data
were collected by trained assessors. The discrepancy between the number of TERA-3 pretest and
posttest scores represents the attrition of 20% of the children. This percentage was due in part to
Prepared by the Florida Institute of Education at the University of North Florida – October 2006 Page 9

the closing of three sites whose children were part of the stratified, random sample used for
TERA-3 testing, and the closings accounted for the attrition of 28 children. To determine if
attrition occurred at random, the TERA-3 pretest scores of the participating children who were
not administered the TERA-3 posttest were compared to pretest scores of children who were
administered the TERA-3 posttest. Table 4 presents the results of the comparison.
Table 4 Summary Statistics and ANOVA Results: TERA-3 Reading Quotient and TERA-3 Scale Pretest Scores by Attrition Category
Incomplete Scores (n=191)
Complete Scores (n=758)
TERA-3 Test Pretest Mean Pretest Mean ProbabilityReading Quotient 88.1 89.4 .0002 Alphabet Scale 8.5 9.0 <.0001 Conventions Scale 7.6 7.7 .0043 Meaning Scale 8.3 8.4 .1012
With the exception of the TERA-3 Meaning scale, children not completing the preschool
year in their original classes had lower initial emergent literacy achievement than children who
did complete the year. This finding limits the generalizibility of the evaluation results to children
with low initial status as they were not necessarily represented in their true proportion in the
study.
EVALUATION QUESTIONS
Question 1: What preschool children formed the population for the 2005-2006 evaluation?
Question 2: Were services sponsored by the ELC, with joint funding and collaboration from the JELP, effective in improving the emergent literacy ability of preschool children based on the TERA-3 Reading Quotient and scale scores?
Question 3: How did the participating preschool children's year-end ability to recognize the upper- and lowercase letters of the alphabet compare to national performance benchmarks in letter recognition?
Prepared by the Florida Institute of Education at the University of North Florida – October 2006 Page 10

Question 4: Were services sponsored by the ELC, with joint funding and collaboration from the JELP, effective in improving the school readiness of preschool children based on scores from the BRIGANCE Screens?
The answers to these questions come from data obtained in the fall and spring using the
TERA-3, BRIGANCE, and ALRI. Both summary statistics and statistical testing of pretest and
posttest mean differences provide the answers. Data from all scales were analyzed as repeated
measures ANOVA models. To determine the importance of all statistically significant
differences, effect sizes are reported. Cohen classified effect sizes of 20 to 49 percent of a
standard deviation as small, between 50 and 79 percent of a standard deviation as medium, and
80 percent or more of a standard deviation as large.3 Small, medium, and large effect sizes
represent meaningful differences.
EVALUATION RESULTS
Question 1: What preschool children formed the population for the 2005-2006 evaluation?
The answer to this evaluation question involves a description of the children by gender,
ethnicity, and age and comes from the ALRI data as it is most representative of the participating
children.
Gender
There were 1,139 boys and 1,161 girls with complete ALRI scores.
Ethnicity
Ethnicity of the children was reported in five categories: Black, White, Hispanic, Asian,
and Other. Of the children with complete ALRI scores, 57.7% were Black, 31.3% were White,
5.4% were Hispanic, 1.5% were Asian, and 5.0% were Other. 3 Cohen, J. (1988). Statistical power analysis for behavioral sciences (2nd ed.). Hillside, NJ: Lawrence Erlbaum Associates.
Prepared by the Florida Institute of Education at the University of North Florida – October 2006 Page 11

Age
The categorization of the children as four years old does not indicate the distribution of the
age of the children. Because of the birthday cut-off for children attending public school
kindergarten in Florida, the typical 4-year-old child is between 48 and 60 months old on
September 1 of the school year. Figure 1 displays participating children's ages in months on the
cut-off date.
0.03
8.39
7.43
8.09 8.17
8.09
7.74
7.57
9.22
9.78
8.17
8.78
7.52
0.22
0.09
0.09
0.09
0.09
0.04 0.09
0.04
0
2
4
6
8
10
12
48 49 50 51 52 53 54 55 56 57 58 59 60 61 62 63 64 65 66 67 68
Age of Participating Children in Months on September 1, 2005
Perc
ent o
f Chi
ldre
n
Figure 1. Age on September 1, 2005 of the 2,300 participating children with complete ALRI scores.
The age of the participating children with complete ALRI scores was evenly distributed
across the expected span of months. Forty-eight percent of the children were 54 or fewer months
old, the median age of the typical age distribution. However, there were 17 children who were
older than the typical age of preschool children.
Prepared by the Florida Institute of Education at the University of North Florida – October 2006 Page 12

Question 2: Were services sponsored by the ELC, with joint funding and collaboration from the JELP, effective in improving the emergent literacy ablility of preschool children based on the TERA-3 Reading Quotient and scale scores? Table 5 presents summary statistics and results from the analyses of the TERA-3 pretest
and posttest scale scores of the participating children.
Table 5 Summary Statistics and ANOVA Results: Participating Children’s TERA-3 Scores
Pretest Posttest Scale Mean Mean p-value Effect Size
Reading Quotient 94.22 96.46 <.0001 0.15
Alphabet 10.60 11.48 <.0001 0.30 Conventions of Print 8.18 8.16 .8563 Meaning 8.53 8.70 .0329 0.07
Denotes a statistically significant difference between the pretest and posttest mean scores (n=758).
The positive gains in the abilities measured on the TERA-3 Reading Quotient, Alphabet,
and Meaning scales were statistically significant (α ≤ .05). The small, but meaningful, gain on
the Alphabet scale was almost one third of a standard deviation, and the mean Alphabet posttest
score (11.5) ranks above the mean of the TERA-3 normative population (10.0).
Another way to look at the ELC children’s year-end achievement in emergent literacy
ability is by looking at the differences in the percentage of scores ranked in the top, middle, and
bottom quartiles from the beginning to the end of the school year. Figure 2 shows the percentage
of scores in these categories at the beginning and end of the school year across the TERA-3
scales.
Prepared by the Florida Institute of Education at the University of North Florida – October 2006 Page 13

43
43
15
32
55
13
26
38
36
18
34
48
39
58
2
40
57
4
27
72
1
21
77
2
0%
10%
20%
30%
40%
50%
60%
70%
80%
90%
100%
Perc
ent o
f Sco
res
Pretest Posttest Pretest Posttest Pretest Posttest Pretest Posttest
Reading Quotient Alphabet Conventions of Print MeaningTERA-3 Scores
Bottom Quartile Average Quartiles Top Quartile
Figure 2. The percentage of TERA-3 scale scores ranked in the bottom, middle, and top quartiles at the beginning and end of the school year (n=758).
Reading Quotient The predominant change in the percentage of Reading Quotient scores
in the quartiles results from scores ranked in the bottom quartile (green portion) at pretest
moving to the middle quartiles at posttest. The percentage of Reading Quotient scores ranked in
the top quartile (lavender) was basically unchanged from the beginning to the end of the school
year.
Alphabet Scale The changes in the percentage of scores in the quartiles for the Alphabet
scale results from scores moving across all three categories, and the percentage of Alphabet scale
posttest scores ranked in the bottom quartile, 18 percent, is well under the expected 25 percent.
Additionally, there was a higher percentage of Alphabet scale pretest and posttest scores ranked
in the top quartile, 36 and 48 percent, respectively, than the 25 percent expected.
Prepared by the Florida Institute of Education at the University of North Florida – October 2006 Page 14
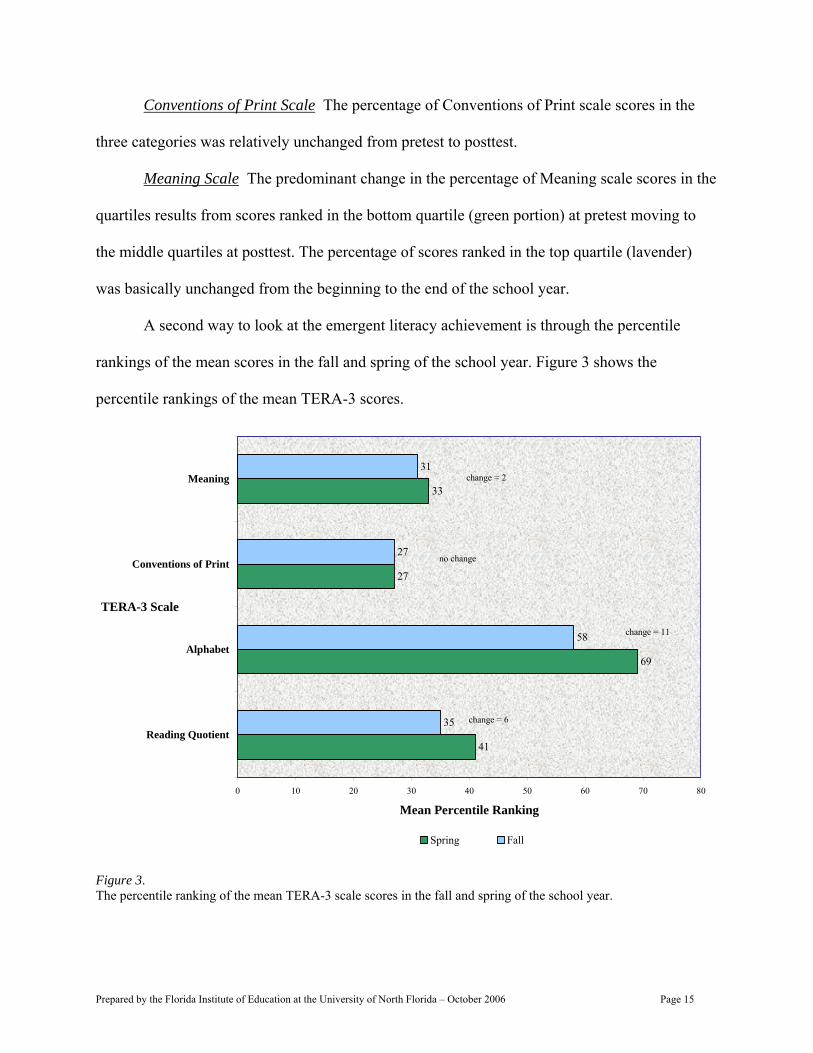
Conventions of Print Scale The percentage of Conventions of Print scale scores in the
three categories was relatively unchanged from pretest to posttest.
Meaning Scale The predominant change in the percentage of Meaning scale scores in the
quartiles results from scores ranked in the bottom quartile (green portion) at pretest moving to
the middle quartiles at posttest. The percentage of scores ranked in the top quartile (lavender)
was basically unchanged from the beginning to the end of the school year.
A second way to look at the emergent literacy achievement is through the percentile
rankings of the mean scores in the fall and spring of the school year. Figure 3 shows the
percentile rankings of the mean TERA-3 scores.
41
69
27
33
35
58
27
31
0 10 20 30 40 50 60 70
Reading Quotient
Alphabet
Conventions of Print
Meaning
TERA-3 Scale
Mean Percentile Ranking80
Spring Fall
change = 2
no change
change = 11
change = 6
Figure 3. The percentile ranking of the mean TERA-3 scale scores in the fall and spring of the school year.
Prepared by the Florida Institute of Education at the University of North Florida – October 2006 Page 15

The two greatest increases in percentile rankings from fall to spring occurred in the
achievement measured by the Reading Quotient and the Alphabet scale. Moreover, at year’s end
the mean ranking of all TERA-3 scales was above the bottom quartile (25th percentile), and the
mean Alphabet scale score ranked almost 20 percentiles above the national average.
To enable a closer look at the improvement on the TERA-3 Alphabet scale, scores are
displayed in Figure 4 in seven ability categories: three categories representing the lowest 25
percentiles, one category representing the middle 50 percentiles, and three categories
representing the highest 25 percentiles. (See Table 2 on page 7 of this report.)
0.0
7.4
18.6
38.1
14.1 15
.8
5.9
0.1
5.5
11.9
34.2
26.4
18.7
3.2
2.3
6.9
16.1
49.5
16.1
6.9
2.3
0
10
20
30
40
50
60
Very Poor Poor Below Average Average Above Average Superior Very Superior
Categories of the TERA-3 Alphabet Scale Scores
Perc
ent o
f Sco
res
Pretest Posttest National
Bottom Quartile 26.0% of the Pretest Scores 17.5% of the Posttest Scores 25.3% of the National Scores Top Quartile
35.9% of the Pretest Scores 48.2% of the Posttest Scores 25.3% of the National Scores
Bottom Quartile Top Quartile
Figure 4. The percentage of TERA-3 Alphabet scale pretest, posttest, and national normative population scores in the seven categories of the ability scale (n=758).
Prepared by the Florida Institute of Education at the University of North Florida – October 2006 Page 16

The percentage of posttest scores (blue bars) ranked in the bottom quartile (three bars at
the left of the figure) is 8% less than in the national normative population (light green bars), and
there were 9% fewer participating children’s posttest scores ranked in the bottom quartile than at
pretest (dark green bars). Additionally, 6% of the participating children's posttest scores ranked
below the 9th percentile (the Very Poor and Poor categories combined). This is fewer than the
percentage in the national normative population. Twelve percent more of the children's posttest
scores ranked in the top quartile than at pretest, and the percentage of posttest scores (blue bars)
ranked in the top quartile (three bars at the right of the figure) was 23% more than in the
normative population. Additionally, 22% of the participating children’s posttest scores ranked
above the 90th percentile (the Superior and Very Superior categories combined). As can be seen,
the distribution of posttest scores shifted further toward the top quartile than the distribution of
the national normative population.
Question 3: How did the participating preschool children's year-end ability to recognize the upper- and lowercase letters of the alphabet compare to national performance benchmarks in letter recognition?
In 2005-2006, 2,300 participating children had complete Alphabet Letter Recognition
Inventory (ALRI) scores. The ALRI mean fall score indicates the typical participating child
recognized 53% of the letters (28 letters), and the mean spring score indicates the typical child
recognized 82% of the letters (43 letters). The Early Childhood Longitudinal Study-Kindergarten
(ECLS-K) describes recognizing 75% of the sampled letters as proficient; therefore, the typical
participating child was proficient in letter recognition at the end of the school year. Additionally,
at the end of the school year, 4% of the children recognized seven or fewer letters, 52% of the
children recognized 50 or more letters, and 35% of the children recognized all 52 letters.
Prepared by the Florida Institute of Education at the University of North Florida – October 2006 Page 17
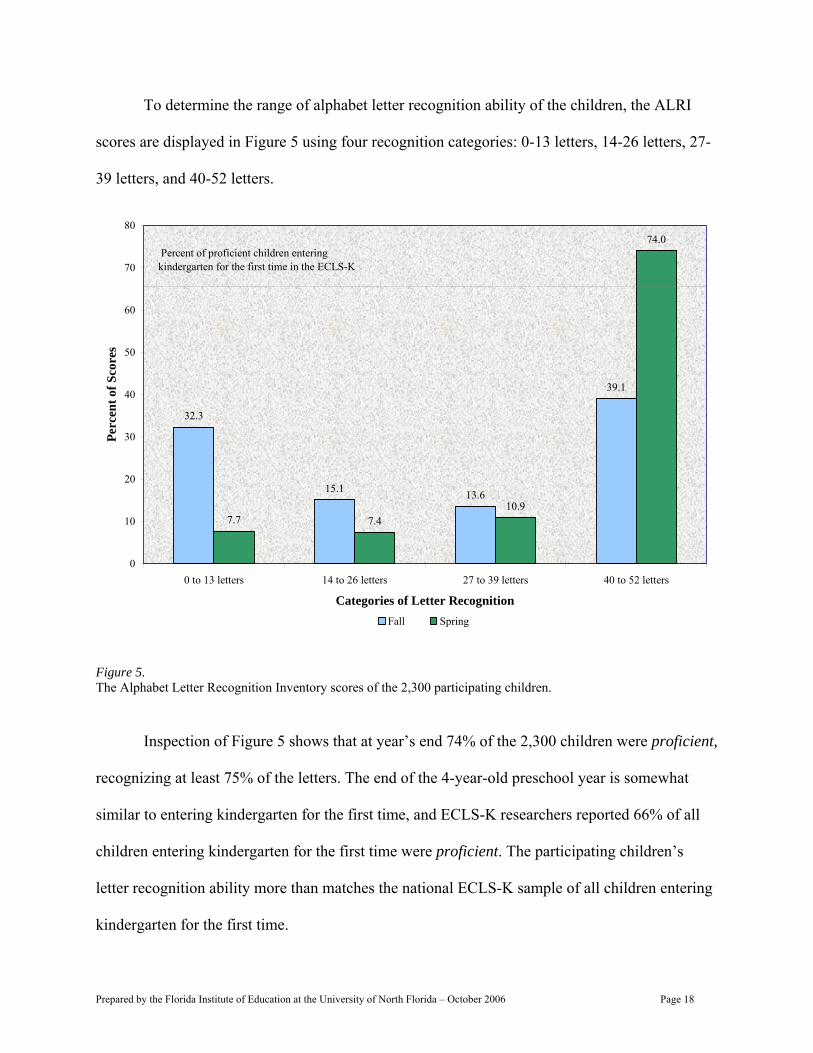
To determine the range of alphabet letter recognition ability of the children, the ALRI
scores are displayed in Figure 5 using four recognition categories: 0-13 letters, 14-26 letters, 27-
39 letters, and 40-52 letters.
32.3
15.1 13.6
39.1
7.7 7.410.9
74.0
0
10
20
30
40
50
60
70
80
0 to 13 letters 14 to 26 letters 27 to 39 letters 40 to 52 letters
Categories of Letter Recognition
Perc
ent o
f Sco
res
Fall Spring
Percent of proficient children entering kindergarten for the first time in the ECLS-K
Figure 5. The Alphabet Letter Recognition Inventory scores of the 2,300 participating children.
Inspection of Figure 5 shows that at year’s end 74% of the 2,300 children were proficient,
recognizing at least 75% of the letters. The end of the 4-year-old preschool year is somewhat
similar to entering kindergarten for the first time, and ECLS-K researchers reported 66% of all
children entering kindergarten for the first time were proficient. The participating children’s
letter recognition ability more than matches the national ECLS-K sample of all children entering
kindergarten for the first time.
Prepared by the Florida Institute of Education at the University of North Florida – October 2006 Page 18

Question 4: Were services sponsored by the ELC, with joint funding and collaboration from the JELP, effective in improving the school readiness of preschool children based on scores from the BRIGANCE Screens?
The answer to this evaluation question requires that the raw scores from the BRIGANCE
Screens be placed on a common scale. All fall data were obtained using the BRIGANCE
Preschool Screen-II, Four-Year-Old Child Basic Assessments which is designed for use with
children between 48 and 60 months old at the time of testing. Spring data were obtained using
both the BRIGANCE Preschool Screen-II, Four-Year-Old Child Basic Assessments and the
BRIGANCE Preschool Screen-II, Kindergarten Basic Assessments which is designed for use
with children between 60 and 72 months old at the time of assessment. Scores from the two
different instruments were placed on a common norm-referenced scale, thereby forming the
BRIGANCE Quotient, which is a standardized scale with mean 100 and standard deviation 15.
There were 1,305 children with both pretest and posttest BRIGANCE Screens scores;
however, some of the pretest raw scores would not form valid standardized scores because at the
time of fall assessments the children were considerably older than the upper age range for the
test’s use. The standardization process resulted in 1,260 reasonably valid BRIGANCE Quotients.
Of these 1,260 scores, 1,165 were obtained from participating partnership children and 95 were
from the non-participating school readiness children. These 95 school readiness children
participated in settings not funded by the ELC or JELP. These 1,165 scores were used to
determine the ELC program’s effectiveness in improving the school readiness of participating
children. Table 6 shows the results of the analysis.
Table 6 Summary Statistics and ANOVA Results: Participating Children’s BRIGANCE Quotient Scores
Scale Pretest Mean Posttest Mean p -value Effect SizeBRIGANCE Quotient 88.40 97.88 <.0001 0.63
Denotes a statistically significant difference between the pretest and posttest mean scores (n=1195).
Prepared by the Florida Institute of Education at the University of North Florida – October 2006 Page 19

The participating children’s school readiness achievement significantly improved by
almost two-thirds of a standard deviation.
The BRIGANCE Screens also allow the identification of children who may need
additional services and the identification of children who are possibly gifted or talented. A
decrease in the number of children referred for additional services or an increase in the number
of children identified as possibly gifted or talented is also an indication of improved school
readiness. Table 7 shows these numbers of children and the results of the Fisher’s Exact Test
which indicated whether the distributions of pretest and posttest scores are different.
Table 7 BRIGANCE Screens Results for Children Referred for Additional Services and Children Identified as Possibly Gifted or Talented
Pretest Percentage
Posttest Percentage
Fisher’s Exact Test ChiSq p-value
Referral 38.7 13.8 <.0001 Gifted & Talented 1.9 3.3 <.0001
Denotes a statistically significant difference between the distributions of the pretest and posttest scores
(n=1195).
The percentage of participating children referred for additional services significantly
decreased over the school year and the percentage of children identified as possibly gifted and
talented significantly increased over the school year.
Furthermore, the sampling plan allows a comparison of the developmental gains made by
school readiness children in participating and non-participating settings. All school readiness
children in preschool centers and a sample of 10% of the school readiness children in Family
Child Care Homes who could be assessed were assessed. Furthermore, there was 30% attrition
(77 children) of the assessed school readiness children, and the children who were not available
Prepared by the Florida Institute of Education at the University of North Florida – October 2006 Page 20

at the time of the posttest assessment had significantly lower pretest scores than the children who
were available for the posttest. Moreover, the children who were not available at the time of the
posttest were equally divided between participating and non-participating settings.
There were 85 school readiness children in participating sites (5 in DCPS, 26 in ECS, 11
in FIE/UNF, and 43 in JCC sites) and 95 children in the non-participating settings who have
valid BRIGANCE Quotient scores. Table 8 shows the mean pretest and posttest scores of these
two groups of school readiness children and the results of the ANCOVA analysis of the scores.
Table 8 Summary Statistics and ANCOVA Results of BRIGANCE Quotient Scores of School Readiness Children in Participating and Non-Participating Settings
Categorization
Mean Participating
Sites N=85
Mean Non-Participating
Sites N=95
p-value EffectSize
Fall BRIGANCE Quotient 82.04 82.83 Spring BRIGANCE Quotient 95.22 91.36 <.0001 0.22
Denotes a statistically significant difference between the adjusted posttest mean scores of the two
groups of school readiness children (n=180).
The children served in participating sites had greater year-end mean school readiness
achievement after adjusting for beginning of the year achievement than the children served in the
non-participating settings. The advantage represent between one-fifth and one-fourth of a
standard deviation.
Prepared by the Florida Institute of Education at the University of North Florida – October 2006 Page 21

CONCLUSIONS
Question 1: What preschool children formed the population for the 2005-2006 evaluation?
Slightly less than 60% of the participating children were Black and slightly less than one third were White. Additionally, 49.5% were boys. Their ages were evenly spaced across the expected span for 4-year-old preschool children in Florida.
TERA-3 data for participating children indicated 20% attrition that resulted from attrition of both children and sites, and there was evidence suggesting the attrition did not occur at random. Children with lower initial emergent literacy ability were not included in the study proportional to their enrollment in the participating preschool classes.
Question 2: Were services sponsored the ELC, with joint funding and collaboration from
the JELP, effective in improving the emergent literacy ability of preschool children based on the TERA-3 Reading Quotient and scale scores?
All TERA-3 mean pretest and posttest mean scores ranked in the broad Average ability category.
The TERA-3 Reading Quotient, Alphabet, and Meaning mean posttest scores of the participating children were significantly higher than their respective mean pretest scores. The gain on the Alphabet scale represents a small, but meaningful gain.
The Alphabet scale mean posttest score ranked almost 20 percentiles above the national average ranking at the 50th percentile.
At the end of the school year, almost 48% of the participating children’s Alphabet scale posttest scores ranked at the 75th percentile or higher (25% expected), and 22% of the children’s scores ranked at or above the 90th percentile (10% expected).
Question 3: How did the participating preschool children's year-end ability to recognize the
upper- and lowercase letters of the alphabet compare to national performance benchmarks in letter recognition?
At the end of the school year, 74% of the participating children recognized at least 75% of the upper- and lowercase letters (categorized as proficient by ECLS-K), which exceeds the 66% of all children in the ECLS-K national sample of children entering kindergarten for the first time.
At the end of the school year, 35% of the participating children recognized all upper- and lowercase letters of the alphabet, and 52% of the children recognized 50 or more letters.
Prepared by the Florida Institute of Education at the University of North Florida – October 2006 Page 22

Question 4: Were services sponsored by the ELC, with joint funding and collaboration from the JELP, effective in improving the school readiness of preschool children based on scores from the BRIGANCE Screens?
The mean school readiness achievement of the 1,165 participating children with BRIGANCE Quotient scores increased by two thirds of a standard deviation over the school year.
There were fewer participating children referred for additional services and more participating children identified as gifted and talented at the spring assessment than at the fall assessment.
The mean school readiness of school readiness children served in participating centers was greater than that of school readiness children served in non-participating settings.
During the 2005-2006 school year, the ELC, in partnership with the JELP, was successful
in significantly increasing participating children’s mastery of emergent literacy achievement in
the area of alphabet letter knowledge. The three areas of alphabet letter knowledge include
knowing the names of letters, recognizing upper- and lowercase letters arranged in non-
alphabetic order, and understanding the function of the letters of the alphabet. This achievement
is documented through posttest TERA-3 and ALRI results. The ELC, in partnership with the
JELP, was also successful in significantly increasing the level of school readiness of
participating children as measured by the BRIGANCE Screens BRIGANCE Quotient mean
scores.
Prepared by the Florida Institute of Education at the University of North Florida – October 2006 Page 23

PART II
A QUASI-EXPERIMENTAL STUDY OF THE SCHOOL READINESS OF KINDERGARTEN
CHILDREN WHO EXPERIENCED LITERACY-FOCUSED PRESCHOOL CURRICULA
SPONSORED BY THE EARLY LEARNING COALITION OF DUVAL COUNTY, INC. AND
THE JACKSONVILLE EARLY LEARNING PARTNERSHIP
By
Stephanie Wehry, Ph.D.
Assistant Director for Research Florida Institute Education
at the University of North Florida
&
James Algina, Ph.D. Professor, Educational Psychology
University of Florida
Prepared by the Florida Institute of Education at the University of North Florida – October 2006 Page 24

A QUASI-EXPERIMENTAL STUDY OF THE SCHOOL READINESS OF KINDERGARTEN CHILDREN WHO EXPERIENCED LITERACY-FOCUSED PRESCHOOL CURRICULA SPONSORED BY THE EARLY LEARNING COALITION OF DUVAL COUNTY, INC. AND
THE JACKSONVILLE EARLY LEARNING PARTNERSHIP
During the 2004-2005 school year, the Early Learning Coalition of Duval County, Inc.
(ELC) and the Jacksonville Early Learning Partnership (JELP) provided 5,100 children
attending child care programs in low-income neighborhoods high-quality preschool experiences.
The initiative provided literacy-focused curricula with job-embedded training for the children’s
376 teachers. The ELC/JELP initiative continues with preschool centers; however, the question
of the children’s school readiness cannot be answered solely with ELC/JELP evaluation data.
School readiness is determined by state-mandated testing during the beginning weeks of
kindergarten. Thus, the specific research question addressed in this study is:
Were children who participated in ELC/JELP preschool classes more ready for
kindergarten than similar children who did not participate in ELC/JELP preschool
classes?
Outcome variables in the study, obtained from the 2005-2006 Florida school readiness
data, include the Early Screening Inventory – Kindergarten (ESI-K) and two measures from the
Dynamic Indicators of Basic Early Literacy Skills (DIBELS), Letter Naming Fluency (LNF) and
Initial Sounds Fluency (ISF).
DATA
ELC/JELP researchers combined their 2004-2005 evaluation data (EVALD), the 2005-
2006 Duval County Public School kindergarten data (DCKD), and the 2005-2006 Florida school
readiness data (FSRD). The initial task involved forming a treatment variable by locating the
2004-2005 ELC/JELP 4-year-old preschool children in the 2005-2006 DCKD. The only
Prepared by the Florida Institute of Education at the University of North Florida – October 2006 Page 25

information available to facilitate tracking children from preschool to public school was
information common to the EVALD and the DCKD and included gender, name, and date of
birth. The second task involved combining the DCKD and FSRD. The EVALD observations
with complete assessments (indicating participation in ELC/JELP preschool classes for the entire
school year) and DCKD observations with scores in the FSRD were used to form the final data
(FD), which includes observations from 1,581 ELC/JELP and 6,166 comparison children. These
numbers were further reduced in the analyses of each school readiness outcome because the state
did not consider all scored assessments valid; therefore, the categorical readiness results were not
reported.
METHODOLOGY
Propensity Score Methods (Subclassification)
Paraphrased from Rubin, D. B. (1997). Estimating causal effects from large data sets using propensity scores. Annals of Internal Medicine, Part 2, 127, 757-763:
Observational studies based on large databases often attempt to estimate the causal effects of an intervention relative to a control condition; however, it is necessary to control for naturally occurring systematic differences in background characteristics between the treatment and control groups that would not occur in the context of a randomized experiment. Propensity score methods address this situation by reducing the collection of background characteristics to a single characteristic that summarizes the entire collection. Thus, the propensity score adjusts for differences in all observed background characteristics. Furthermore, a straightforward method to adjust for a single continuous background characteristic is to divide the entire sampled population into equal-sized strata of the specific characteristic; compare mean outcomes within each stratum, and then average the background characteristic-adjusted mean outcomes across strata to obtain an overall estimate of the outcome variable. Unfortunately, this subclassification method becomes more difficult when there is more than one background characteristic, and there usually are many characteristics available. However, subclassification techniques can be applied with many background characteristics by using propensity score methods. The basic idea is to replace the collection of confounding characteristics with one, the propensity score. Each
Prepared by the Florida Institute of Education at the University of North Florida – October 2006 Page 26

child in the data has an estimated propensity score, which is the estimated probability of being exposed to treatment 1 rather than treatment 2.4 Subclassification on the basis of the propensity score then has the property of adjusting for all of the background characteristics that went into its estimation, no matter how many there are. Moreover, if two children, one exposed to treatment 1 and the other exposed to treatment 2, have the same value of the propensity score, these two children would have the same predicted probability of being assigned to treatment 1 or treatment 2. So, as far as the collection of background characteristics goes, a coin was tossed to decide who received treatment 1 and who received treatment 2.
Propensity Score Strata
In the longitudinal study of the school readiness-related effectiveness of the ELC/JELP
preschool initiative, propensity scores that represent the propensity to have participated in a
ELC/JELP preschool class the year prior to kindergarten were assigned to children in the FD.
Gender, ethnicity (defined as Black or non-Black), free/reduced lunch status, language minority
status (ESOL), age on September 1 of the kindergarten year, living within a Reading First school
attendance boundary, and the public elementary school attended were used to estimate the
propensity scores. The observations were ranked by propensity score, and the ranked data were
divided into 10 equally-sized strata. Using the DIBELS Letter Naming Fluency (LNF) data,
Table 1 provides the ELC/JELP participants’ mean scores on the background characteristics
disaggregated by stratum. Stratum 1 represents the 625 Duval County Public School
kindergarten children in the DIBELS LNF data who were most likely to have participated in a
ELC/JELP preschool class the previous year.
4 In this case, treatment 1 is participation in a ELC/JELP preschool class and treatment 2 is participation in a non-ELC/JELP preschool class or no preschool participation.
Prepared by the Florida Institute of Education at the University of North Florida – October 2006 Page 27

Prepared by the Florida Institute of Education at the University of North Florida – October 2006 Page 28
Table 1 ELC/JELP Participants’ Summary Statistics Disaggregated by Stratum for Some of the Variables Used to Form the Propensity Scores
Stratum n Percent ESOL
Percent Free
Lunch
Percent Paid
Lunch
Percent Reading First
School
Percent Black
Percent Boys
Mean Age*
Mean Propensity Score
1 374 0.00 73.11 19.19 63.81 99.56 48.69 67.01 .54 2 301 0.00 71.70 21.48 22.79 100.00 52.83 67.28 .43 3 255 0.00 54.94 34.16 19.33 88.52 51.45 67.45 .35 4 166 0.29 44.12 46.44 12.77 54.43 50.80 67.11 .25 5 141 0.29 29.80 62.21 8.28 11.92 47.38 66.85 .19 6 111 0.00 27.00 65.60 3.05 9.72 52.25 67.32 .15 7 89 1.45 24.09 66.47 4.21 8.56 54.86 67.43 .12 8 59 1.16 23.40 69.91 0.87 5.23 49.27 67.35 .09 9 45 6.38 24.53 67.20 4.64 6.24 46.88 67.45 .06
10 20 27.03 24.27 65.84 1.50 5.52 46.37 67.69 .03 Note: Age (in months) at the 2005-2006 state public school kindergarten eligibility cut-off date of September 1.
The mean scores of the background characteristics used to estimate the propensity scores
of the ELC/JELP children disaggregated by probability stratum indicate that ELC/JELP children
were more likely than comparison children to be economically disadvantaged, Black, attend
Reading First schools, and not classified as ESOL. However, 70% of the observations of the
ELC/JELP children are located in the first four strata. Therefore, for ease of interpretation, the
summary statistics for the ten strata are further collapsed into three groups. Table 2 provides the
ELC/JELP participants’ mean scores on the background characteristics disaggregated by group
rather than stratum.
Table 2 ELC/JELP Participants’ Summary Statistics Disaggregated by Group for Some of the Variables Used to Form the DIBELS LNF Propensity Scores
Group Strata n
Percent of
ELC/JELP Children
Percent Free
Lunch
Percent Reading
First School
Percent Black
P t ercenESOL
1 1-4 1096 70.2 64.3 34.5 90.3 0.0 2 5-8 400 25.6 26.8 4.8 9.6 0.6 3 9-10 65 4.2 24.5 3.7 6.0 12.7

Group 1 represents 70% of the ELC/JELP children in the DIBELS LNF data. Most of the
children are English-speaking, Black, and economically disadvantaged, and one third of them
attend Reading First schools. Group 2 represents 25% of the ELC/JELP children, and one fourth
of them are economically disadvantaged. The children are English-speaking, not Black, and do
not attend Reading First schools. Group 3 represents 4% of the ELC/JELP children and differs
from Group 2 primarily in the percentage of language minority children (ESOL).
RESULTS
Outcome Measures
The three measures of school readiness obtained from Florida school readiness data
(FSRD) are the Early Screening Inventory – Kindergarten (ESI-K) and two scales from the
and Ini
ge,
.
y
nd, if the problems identified by the ESI-K are confirmed, a definitive plan
should be designed. The FD includes 7,004 ESI-K observations from ELC/JELP and
Dynamic Indicators of Basic Early Literacy Skills (DIBELS), the Letter Naming Fluency (LNF)
tial Sounds Fluency (ISF).
The ESI-K is a brief assessment intended to identify children who have a condition that
may place them at risk for school failure. The broad focus of the instrument is speech, langua
cognition, perception, and fine and gross motor coordination. However, the items sample
domains of development rather than specific accomplishments that indicate academic readiness
The total score is used to determine the screening outcome. Ready indicates the child is
presumed to be developing normally, and Refer indicates the child should be further evaluated b
an assessment team a
of action
comparison children.
Prepared by the Florida Institute of Education at the University of North Florida – October 2006 Page 29

The DIBELS measures were designed to measure three of the five big ideas of early
literacy – phonological awareness, alphabetic principle, and fluency with connected text. The
DIBELS Letter Naming Fluency (LNF) measure is designed for use with children from the
beginning of kindergarten through the first grade. In the LNF me , children are presented a
age of randomly ordered upper- and lowercase letters and asked to name as many letters as they
s
s
areness that
measures the children’s ability to recognize and produce the initial sound in an orally presented
word. The DIBELS Initial Sounds Fluency ure is designed for use with children from
the beginning of preschool to mid-kin cal score represents the number of
6
asure
p
can in one minute. The score represents the number of letters correctly named. A benchmark
goal is not established for LNF as it does not directly correspond with one of the three big idea
assessed by DIBELS; however, the numerical scores are categorized as Above Average, Low
Risk, Medium Risk, and High Risk based on percentages of the local population. The FD include
6,965 LNF scores from the ELC/JELP and comparison children.
The DIBELS Initial Sounds Fluency (ISF) is a measure of phonological aw
(ISF) meas
dergarten. The numeri
onsets (initial sounds) the child correctly produces in one minute. The numerical scores are
categorized as Above Average, Low Risk, Medium Risk, and High Risk. The FD includes 6,55
ISF observations from ELC/JELP and comparison children.
Statistical Tests
A t-test was used to determine whether the observed differences between the ELC/JELP
and comparison children’s mean outcome scores occurred by chance or represent true
differences. A statistically significant p-value (p ≤ .05) indicates there is a true difference in the
mean scores of the two populations for the particular stratum.
Prepared by the Florida Institute of Education at the University of North Florida – October 2006 Page 30

A chi-squared test was used to determine whether or the distributions of the percentage of
scores in the readiness categories depend on the treatment (participation in ELC/JELP preschoo
classes). A significant
l
chi-squared p-value (α ≤ .05) means the distributions of scores across
n ELC/JELP and comparison children in the particular stratum are truly different and depend o
ELC/JELP participation.
Early Screening Inventory – Kindergarten (ESI-K)
Valid ESI-K scores were available for 1,563 ELC/JELP and 5,441 comparison children.
Table 3 provides the comparisons across treatment levels for the ESI-K mean scores and the
distributions of the percentage of scores in each readiness category disaggregated by propensity
score stratum.
Prepared by the Florida Institute of Education at the University of North Florida – October 2006 Page 31

Table 3Comparisons Across Treatment Levels for the ESI-K Scores by Propensity Score Stratum
Stratum Numerical Scores Categorical Scores
Status n Mean
Score t test
p-value %
Ready
% Getting Ready
(Rescreen)
% Not Yet ChiSq Ready test (Refer) p-value
Trt 379 22.41 83.1 13.7 3.2 1 Com 321 21.96 .1275 78.5 16.5 3.0 .2473
Trt 306 22.34 84.0 12.4 3.6 2 Com 394 21.58 .0118* 77.4 15.7 6.9 .0601**
Trt 240 22.83 84.2 14.6 1.3 3 Com 461 22.19 .0245* 79.8 15.6 4.6 .0635**
Trt 159 22.19 82.4 13.2 4.4 4 Com 541 21.98 .5402 79.9 12.9 7.2 .4543
Trt 147 23.22 89.1 10.2 0.7 5 Com 554 22.83 .2139 85.9 10.8 3.3 .2222
Trt 119 23.50 94.1 4.2 1.7 6 Com 581 22.65 .0092* 84.9 11.5 .0265* 3.6 Trt 87 23.86 93.1 5.8 1.2 7 Com 614 22.86 .0018* 86.2 11.1 .1942 2.8 Trt 63 23.38 88.9 9.5 1.6 8 Com 637 22.89 .2490 86.5 10.4 3.1 .7644
Trt 45 22.48 82.2 13.3 4.4 9 Com 656 22.58 .8744 84.6 11.0 4.4 .8875
Trt 18 22.06 88.9 0.0 11.1 10 Com 682 21.66 .6503 76.0 17.2 6.9 .1409
Trt 1563 22.71 85.6 11.7 2.7 All Com 5441 22.34
.0095* 82.3 13.0 4.7
.0009*
* Indicates a statistically significant difference at α ≤ .05.
In all strata except s
** Indicates a statistically significant difference at α ≤ .10.
trata 1 and 9, a smaller percentage of the ELC/JELP than comparison
children was referred for further evaluation to design a definitive plan of action. This is the most
important ESI-K result, as the purpose of the ESI-K is to identify children who have a condition
that may place them at risk for school failure. Furthermore, with the exception of stratum 9, a
greater percentage of the scores of ELC/JELP than comparison children were classified as
Ready, and the true differences in the distributions of the percentages of scores in the readiness
categories in strata 2, 3, and 6 depend on the children’s participation in ELC/JELP preschool
classes (α ≤ .10). When strata are collapsed (All), there are true differences in the mean scores
and in the distributions of percentage of scores in the readiness categories.
Prepared by the Florida Institute of Education at the University of North Florida – October 2006 Page 32

Prepared by the Florida Institute of Education at the University of North Florida – October 2006 Page 33
DIBELS Letter Naming Fluency (LNF)
Valid DIBELS LNF scores were available for 1,561 ELC/JELP and 5,404 comparison
children. Table 4 provides the com arisons across treatment levels for the LNF mean scores and
the distributions of the percentage of scores in each readiness category disaggregated by
propensity score stratum.
Table 4 Comparisons Across Treatment Levels for the DIBELS Letter Naming Fluency Scores by Propensity Score Stratum
p
Stratum Numerical Scores Categorical Scores
Status n Mean Score
t test p-value
% Above Average
% Low Risk
% Medium Risk
% High Risk
ChiSq test
p-value Trt 374 26.66 73.8 13.6 7.8 4.1 1 Com 314 17.82 >.0001* 45.9 12.7 16.9 24.5 >.0001*
Trt 301 24.08 68.8 16.9 7.6 6.6 2 Com 388 17.10 >.0001* 48.2 14.4 16.0 21.4 >.0001*
Trt 255 24.67 68.4 16.9 9.8 4.9 3 Com 463 18.64 >.0001* 49.5 15.6 14.0 21.0 >.0001*
Trt 166 27.28 77.1 6.6 10.8 5.4 4 Com 573 19.56 >.0001* 51.4 14.9 14.7 18.9 >.0001*
Trt 141 25.21 70.9 13.5 7.1 8.5 5 Com 547 20.29 .0008* 51.7 16.3 15.7 16.3 .0003*
Trt 111 27.02 77.5 11.7 7.2 3.6 6 Com 578 21.76 .0006* 55.5 14.2 14.7 15.6 >.0001*
Trt 89 30.37 84.3 10.1 2.3 3.4 7 Com 600 20.61
>.0001* 54.5 14.0 15.7 15.8
>.0001*
Trt 59 28.47 74.6 11.9 6.8 6.8 8 Com 629 21.85 .0035* 56.9 12.6 14.6 15.9 .0412*
Trt 45 29.18 77.8 6.7 8.9 6.7 9 Com 644 20.67 .0010* 53.6 15.8 14.4 16.2 .0174*
Trt 20 20.20 65.0 25.0 0.0 10.0 10 Com 668 19.47 .7818 49.9 13.2 15.0 22.0 .0663**
Trt 1561 26.06 73.0 13.5 7.8 5.4 All Com 5404 20.02
>.0001* 52.2 14.4 15.1 18.4
>.0001*
* Indicates a statistically significant difference at α ≤ .05. ** Indicates a statistically significant difference at α ≤ .10.
The mean letter naming fluency of the ELC/JELP children in all strata except stratum 10
was significantly greater than the comparison children’s fluency. The true differences in mean
scores represent the naming of between five (stratum 5) and ten (stratum 7) additional letters in

the allotted time (one minute). When strata are collapsed (All), the true difference represents the
naming of six additional letters. The chi-squared test of whether the distributions of the
percentage of DIBELS LNF scores in the readiness categories depend on treatment mirrors the
numerical results; however, unlike the numerical scores, the distributions of scores in stratum 10
do depend on treatment (α ≤ .07). Additionally, across all strata, there are approximately 20%
more ELC/JELP than comparison children’s scores categorized as Above Average.
DIBELS Initial Sounds Fluency (ISF)
Valid DIBELS ISF scores were available for 1,472 ELC/JELP and 5,084 comparison
children. Table 5 provides the comparisons across treatment levels for the DIBELS ISF mean
scores and the distributions of the percentage of scores in each readiness category disaggregated
by propensity score stratum.
Prepared by the Florida Institute of Education at the University of North Florida – October 2006 Page 34

Prepared by the Florida Institute of Education at the University of North Florida – October 2006 Page 35
Table 5 Comparison Across Treatment Levels for the DIBELS Initial Sounds Fluency Scores by Propensity Score Stratum
Stratum Numerical Scores Categorical Scores
Status n Mean Score
t test p-value
% Above Average
% Low Risk
% Medium Risk
% High Risk
ChiSq test
p-value Trt 363 12.06 44.6 21.8 19.3 14.3 1 Com 292 10.91 .1249 38.7 16.8 20.2 24.5 .0071*
Trt 283 10.86 43.8 16.6 22.3 17.3 2 Com 373 10.29 .4151 34.3 18.8 24.9 22.0 .0920**
Trt 221 12.30 42.5 19.0 25.3 13.1 3 Com 435 10.55
.0390* 34.9 20.2 25.3 19.5
.1198
Trt 155 14.46 54.8 11.6 15.5 18.1 4 Com 500 11.89 .0128* 42.2 19.0 22.0 16.8 .0148*
Trt 133 13.35 52.6 19.6 19.6 8.3 5 Com 523 11.99 .1475 45.5 18.9 18.2 17.4 .0731**
Trt 111 14.81 55.9 19.8 9.9 14.4 6 Com 545 13.23
.2065 49.9 17.4 17.6 15.1
.2292
Trt 82 14.61 66.2 20.7 13.4 3.7 7 Com 573 12.32 .0181* 45.9 21.5 19.9 12.7 .0137*
Trt 61 13.25 45.9 26.2 18.0 9.8 8 Com 595 13.36 .9319 48.9 19.5 16.3 15.3 .4637
Trt 41 15.54 61.0 12.2 12.2 14.6 9 Com 615 11.94 .0326* 45.4 19.2 19.5 15.9 .2463
Trt 22 11.32 27.3 36.4 13.6 22.7 10 Com 633 11.59 .8988 41.9 16.3 18.8 23.1 .0911**
Trt 1472 12.70 48.0 19.0 19.0 14.0 All Com 5084 11.95
.0094* 43.5 18.8 19.9 17.7
.0018*
* Indicates a statistically significant difference at α ≤ .05. ** Indicates a statistically significant difference at α ≤ .10.
The mean initial sounds fluency of the ELC/JELP children in all strata except strata 8 and
10 was greater than the comparison children’s fluency, and the differences were statistically
significant in strata 3, 4, 7, and 9. When strata are collapsed (All), the true difference across
treatment levels represents the ELC/JELP children’s ability to correctly produce approximately
one more onset than the comparison children. The comparisons of the distributions of the
percentage of DIBELS INF scores in each readiness category across treatment levels do not
mirror the numerical results. The distributions of readiness scores in strata 1, 2, 4, 5, 7, and 10
depend on the children’s participation in ELC/JELP preschool classes (α ≤ .10 for strata 2, 5, and
10). A closer look at Group 2 (strata 5-8) shows that the 387 children who represent middle-

class, predominately non-Black children benefited as much from ELC/JELP participation
relative to their comparison children as the ELC/JELP children in Group 1 who represent
Note: Indicates a significant difference at α ≤.05. Indicates a significant
nificant
Additionally, six of the chi-squared tests across the ten DIBELS ISF
icate the distributions of the scores in the readiness categories are truly different and
umber of true differences occurs in strata 2, 3, and 7, indicating the ELC/JELP initiative was
often effective among non-Black, middle-class, English-speaking children as well as Black,
economically disadvantaged, English-speaking children.
economically disadvantaged, Black children.
Summary of the Results
Table 6 summarizes the results presented in Tables 3, 4, and 5.
Table 6 Summary of the Results Across Readiness Measures by Stratum
+
Strata Test Statistical Test 1 2 3 4 5 6 7 8 9 10 All t-test + + + + +
ESI-K Chi-Sq + +
t-test + + + + + + + + + +LSF Chi-Sq + + + + + + + + + +
t-test + + + + +ISF Chi-Sq + + +
difference at α ≤.10.
True differences in the mean scores and in the distributions of readiness categories are
found across all measures when the strata are collapsed (far right column). All but one of the t-
and chi-squared tests of differences across the ten DIBELS LNF strata are statistically sig
at either α ≤.05 or α ≤.10.
strata ind
depend on the children’s ELC/JELP participation. Across all strata and measures, the greatest
n
+
Prepared by the Florida Institute of Education at the University of North Florida – October 2006 Page 36

CONCLUSIONS/DISCUSSION
Results indicate that:
Children who participated in 2004-2005 ELC/JELP preschool classes and were attending Duval County Public School kindergarten in 2005-2006 were likely to be English speakers, economically disadvantaged, Black, and attend kindergarten classes in Duval County Reading First elementary schools.
Across all probability strata except strata 1 , a smaller percentage of ELC/JELP than
comparison children were referred for further evaluation based on their ESI-K scores, and across all strata except stratum 9 a greater percentage of ELC/JELP children’s scores of were categorized as Ready.
and 9
Across all probability strata, ELC/JELP chi n scored higher on the DIBELS Letter Naming Fluency measure than comparison ren with similar background characteristics, and the differences for all strata except strata 10 were statistically higher.
ldre child
Across all probability strata except stratum 8, ELC/JELP children scored higher on the DIBELS Initial Sounds Fluency measure than comparison children with similar background characteristics, and the differen for strata 3, 4, 7, and 9 were statistically higher.
Table 7 allows a closer look at the achievement of the Group 1 ELC/JELP children
relative to the comparison children who have simil ckground characteristics. Group
represents 70% of the 1,561 ELC/JELP children w alid DIBELS LNF scores, and th
children were mostly Black, economically disadvantaged, and English-speaking.
Table 7 Summary of the Results Across the Readiness Measures for Group 1
ces
ar ba 1
ith v e
Measure Statistic Trt Comp Mean 22.45 21.94ESI-K % at High Risk 3.07 5.65Mean 25.58 18.45LNF % at High Risk 5.17 21.03Mean 12.14 10.95ISF % at High Risk 15.45 20.15
Prepared by the Florida Institute of Education at the University of North Florida – October 2006 Page 37

When the four strata are collapsed to form Group
1:
2.6% fewer of the ELC/JELP than comparison children who have valid ESI-K scores were Referred for further evaluation.
15.9% fewer of the ELC/JELP than c arison children who have valid DIBELS
LNF scores were categorized as at High Risk ic failure.
omp of future academ
4.7% fewer of the ELC/JELP than comparison children who have valid DIBELS ISF scores were categorized as at High Risk of future academic failure.
ELC/JELP children named seven more letters in one minute on the DIBELS LNF
measure than comparison children with sim ackground characteristics.
ilar b
ELC/JELP children produced one more onset in one minute on the DIBELS ISF measure than comparison children with similar background characteristics.
ELC/JELP children in Group 1 were better prepared for kindergarten than comparison children
on all three measures of school readiness used by Florida to assess school readiness. Furthermore, the
achievement of ELC/JELP children in Group 2, esp ally strata 6 and 7, indicates that
predominately non-Black, middle-class children who participated in the ELC/JELP preschool initiative
were often better prepared for kindergarten than comparison children with similar background
eci the
characteristics.
Prepared by the Florida Institute of Education at the University of North Florida – October 2006 Page 38


