Early Learning Study at Harvard: Household Survey Full Report November 2018 Stephanie M. Jones, Nonie K. Lesaux, Emily C. Hanno, Kathryn E. Gonzalez, and Rosa Guzman Graduate School of Education Harvard University In collaboration with: Barbara Goodson, Amy Checkoway, Austin Nichols, Brian Freeman, and Sarah Ballinger Abt Associates Suggested citation: Jones, S.M., Lesaux, N.K., Hanno, E.C., Gonzalez, K.E., Guzman, R., Goodson, B., Checkoway, A., Nichols, A., Freeman, B., & Ballinger, S. (2018). Early Learning Study at Harvard: Household Survey Report. Saul Zaentz Early Education Initiative Report #1.
Transcript
Early Learning Study at Harvard: Household Survey Full Report
November 2018
Stephanie M. Jones, Nonie K. Lesaux, Emily C. Hanno, Kathryn E. Gonzalez, and Rosa Guzman
Graduate School of Education
Harvard University
In collaboration with: Barbara Goodson, Amy Checkoway, Austin Nichols, Brian Freeman, and Sarah
Checkoway, A., Nichols, A., Freeman, B., & Ballinger, S. (2018). Early Learning Study at Harvard:
Household Survey Report. Saul Zaentz Early Education Initiative Report #1.
November 2018 2
Table of Contents
Overview 4
Household Survey Procedures 6 Sampling and Survey Administration 6
Figure 1. Stratification of Census Block Groups by Region and Poverty Levels 6 Survey Instrument 8 Sampling Weights 8
Findings 10 Unweighted Results 10
Type of Education and Care 10 Figure 2. Taxonomy of Education and Care Types 11 Figure 3. Percent of Children Enrolled in Formal and Informal Settings 11 Figure 4. Percent of Children Enrolled in Different Types of Education and Care 12
Differences in Type of Education and Care by Region and Community Poverty 12 Figure 5. Percent of Children in Formal and Informal Settings, by Region 13 Figure 6. Percent of Children in Formal and Informal Settings, by Community Poverty 13
Differences in Type of Education and Care by Child Age 14 Figure 7. Percent of Children in Formal and Informal Settings, by Child Age 14 Table 1. Percent of Children Using Formal and/or Informal Education and Care in the Study Sample 15
Confidence in Care 15 Figure 8. Parents’ Confidence in their Child’s Early Education and Care 15
Differences in Confidence by Education and Care Type 16 Figure 9. Percent of Parents who are Confident or Very Confident in their Child’s Early Education and Care,
by Type 16 Differences in Confidence by Region and Community Poverty 16
Figure 10. Parents’ Confidence in their Child’s Early Education and Care, by Region 17 Figure 11. Parents’ Confidence in their Child’s Early Education and Care, by Community Poverty 17
Differences in Confidence by Age 18 Figure 12. Parents’ Confidence in their Child’s Early Education and Care, by Child Age 18
Confidence in Early Education and Care vs. Confidence in Medical Care 18 Figure 13. Parents’ Confidence in their Child’s Early Education and Care Compared to Confidence in their
Child’s Medical Care 19 Parents’ Concerns about their Children’s Future 19
Figure 14. Parents’ Biggest Worries about their Children’s Future 20 Parents’ Descriptions of their Children in Three Words 20
Figure 15. Words Commonly Used by Parents to Describe their Children 21 Weighted Results 22
Type of Education and Care 22 Figure 16. Percent of Children in the Commonwealth Enrolled in Formal and Informal Settings 22 Figure 17. Percent of Children in the Commonwealth Enrolled in Different Types of Education and Care 23
Differences in Type of Education and Care by Region and Community Poverty 23 Figure 18. Percent of Children in the Commonwealth in Formal and Informal Settings, by Region 24 Figure 19. Percent of Children in the Commonwealth in Formal and Informal Settings, by Community
Poverty 24 Differences in Type of Education and Care by Child Age 25
November 2018 3
Figure 20. Percent of Children in the Commonwealth in Formal and Informal Settings, by Child Age 25 Table 2. Percent of Children in the Commonwealth using Formal and/or Informal Care 26
Confidence in Care 26 Figure 21. Parents’ Confidence in their Child’s Early Education and Care 26
Differences in Confidence by Care Type 27 Figure 22. Percent of Parents in the Commonwealth who are Confident or Very Confident in their Child’s
Early Education and Care, by Care Type 27 Differences in Confidence by Region and Community Poverty 27
Figure 23. Parents’ Confidence in their Child’s Early Education and Care, Across the Commonwealth by
Region 28 Figure 24. Parents’ Confidence in their Child’s Early Education and Care, Across the Commonwealth by
Community Poverty 28 Differences in Confidence by Age 29
Figure 25. Parents’ Confidence in their Child’s Early Education and Care, Across the Commonwealth by
Child Age 29 Confidence in Early Education and Care vs. Confidence in Medical Care 29
Figure 26. Parents’ Confidence in their Child’s Early Education and Care vs. Confidence in their Child’s
Medical Care, Across the Commonwealth 30 Parents’ Concerns about their Children’s Future 30
Figure 27. Parents’ Biggest Worries about the Children’s Future, Across the Commonwealth 31
Implications 32
References 33
November 2018 4
Overview
Led by Professors Stephanie Jones and Nonie Lesaux, the Early Learning Study at Harvard (ELS@H),
a cornerstone of the Zaentz Early Education Initiative (https://zaentz.gse.harvard.edu/), is a first-of-
its-kind, statewide study designed to examine children's learning and development in the context of
their early education and care experiences. ELS@H’s large-scale, longitudinal design and its
population-based, representative sample enables the study to address key questions that face
today’s policymakers and practitioners, focusing in particular on questions about scaling effective
models and practices, and about the characteristics of settings and communities that are essential
for children’s long-term health and well-being.
ELS@H draws on successes in the design of medical and public health research to examine the
relationship between children’s development in several domains—language, cognition, social-
emotional, neuro-physiology—and the nature and quality of their early learning environments (e.g.,
degree of stress, language-learning opportunities) across the Commonwealth of Massachusetts.
Importantly, ELS@H focuses on all types of early education and care settings including both formal
and informal settings. The study addresses primarily descriptive questions that existing research,
which is typically focused on only one domain of early development, often located in just one site or
community, and typically only one type of care or education setting, has not.
ELS@H is designed to tackle key high-impact questions, including:
Which child outcomes are particularly sensitive to high-quality early learning environments (e.g., vocabulary, higher-order thinking, self-regulation)?
What features of early schooling (e.g., types of instruction) maintain and/or multiply the benefits of early education and care—or undermine it?
Why are some models of early learning and care highly and some are not, and importantly, what are those “key ingredients” that can be scaled more broadly?
We know that families rely on a variety of settings to meet the education and care needs of their
young children. Among these settings are both formal providers, which includes classroom-based
settings providing care to groups of children (e.g., community-based centers, public
prekindergarten, and Head Start programs), licensed home-based family child care providing care to
smaller groups with more heterogeneous ages, and informal providers, which include other types of
non-relative and relative care in the child’s own home or the provider’s home (e.g., grandparent
care and family child care programs). Whereas much of the research to date on early learning and
care focuses on those children spending time in formal classroom-based settings, a truly
representative sample of three- and four-year-old children should include those enrolled in formal
classroom and family child care programs and those in informal settings, either in the care of
relatives or other unlicensed providers. In addition, a representative sample should include children
who are exclusively in the care of parents or guardians. Traditional methods of study recruitment,
which often involve collaborating with state and local educational agencies, are typically unable to
identify those who rely exclusively on informal or parental care. To address this challenge, we
launched a statewide household survey during which 96 trained field workers visited 90,544
households. This effort resulted in the initial recruitment of 841 three- and four-year-olds and their
families to the Early Learning Study.
Additional participants for the study were identified via network sampling and sampling of licensed
and license exempt settings from administrative data provided by the Massachusetts Department
of Early Education and Care and Massachusetts Department of Elementary and Secondary
Education. Network sampling resulted in the recruitment of 482 children who were in the same
settings as children identified through the household survey. Third, we randomly sampled 5,740
licensed settings (e.g., community-based centers, family child care programs, public school
preschools) and recruited 1,579 children from 1,038 of those settings. Less common early education
and care settings in MA (i.e., Head Start and public school-based prekindergarten programs) were
over-sampled via both network and licensed setting sampling to ensure that the study has sufficient
statistical power to make cross-setting comparisons. An additional 319 children were identified
through the network sampling and recruited from randomly sampled licensed settings for a total of
3,228 children as of October 20181.
As part of the household survey, families responded to a series of questions about their three- or
four-year-old child’s current education and care. These data provide an initial snapshot of the
landscape of early education and care in Massachusetts. This report presents the procedures
employed in the household survey and an overview of its findings. The findings from the household
survey are discussed in relation to the broader goals of ELS@H.
1 There are seven children that are yet to be categorized by their sampling type and thus the counts in the
paragraph add up to 3,221.
November 2018 6
Household Survey Procedures
Sampling and Survey Administration
The Commonwealth of Massachusetts has an overall population of 6.8 million people and roughly
5% of those are under the age of five (Office of Special Analytic Projects, 2016). Residents of the
state live in 1,478 census tracts, which are divided into 4,985 block groups that each contain
between 600 and 3,000 people (U.S. Census, 2010). The ELS@H household survey was conducted in
a stratified, random sample of 168 block groups across the state (~3% of the state’s total block
groups). These 168 block groups were randomly selected from six strata, each containing an
approximately equivalent number of households. To generate the strata, the state was first divided
into three geographic regions of equal population that we refer to as Eastern Massachusetts,
Western Massachusetts, and Greater Boston. The Greater Boston region includes block groups
within approximately 12 miles of Boston’s center. Each of these three geographic regions was then
divided into two groups based on poverty levels reported in the 2010 Census. Specifically, block
groups were identified as having either a higher poverty level than the geographic region’s median
(the point at which 50% of the relevant population falls above or below) poverty level or a lower
poverty level than the region’s median (meaning poverty level in this case is relative to the income
of block group overall). From each of these six strata, 28 block groups were randomly selected
resulting in a total of 168 sampled block groups for the household survey. The shading in Figure 1
shows the three geographic regions while the colors distinguish the two poverty-level categories.
Figure 1. Stratification of Census Block Groups by Region and Poverty Levels
Note: Three geographic regions are indicated by shading; Blue census blocks are lower poverty
regions, whereas orange block groups represent higher poverty regions.
November 2018 7
A primary aim of the household survey was to identify children eligible for participation in ELS@H.
Eligible children included those who were three or four years old as of September 1, 2017 who
reside within the 168 sampled block groups. An additional aim of the household survey was to
determine broad population-level trends in early education and care. To meet both aims, trained
field workers went door-to-door from April through November 2017, visiting all households in the
sampled block groups to determine whether three- or four-year-old children lived in each home and
if so, to administer a brief survey with a parent/guardian of the child about the child’s early
education and care experiences and attempt to recruit the household to participate in the study.
During this period, field workers visited 90,544 households across Massachusetts.
The decision to use in-person visits as opposed to phone- or mail-based survey approaches was
made based on results from a pilot of the household survey conducted in early 2017. The three
survey approaches were simultaneously used in the pilot, with the highest contact and participation
rates coming from in-person visits as compared to either phone- or mail-based approaches.
Field workers were recruited from the communities in which the survey took place and all field
workers had experience with research fieldwork, interviewing, and/or early childhood education.
Several in-person trainings were held with the field staff to ensure appropriate and standardized
application of the household survey and recruitment procedures. The trainings provided detailed
information on the household survey instrument, the ELS@H study, tracking and recording of data
collected in the field, strategies for gaining cooperation from participants, and guidance on handling
adverse events. During trainings, field workers also practiced implementing the survey script and
overcoming doorstep objections. At the end of the training, field workers completed a brief quiz to
assess their knowledge of the study and data collection procedures. In addition, only field workers
who were able to successfully complete a one-on-one role-play that involved approaching a
potential respondent, introducing the study, responding to questions, and administering the
household survey, were allowed to conduct fieldwork.
Prior to the field workers’ in-person visits, every sampled household received a letter in the mail
describing the broader ELS@H study and household survey procedures. Field workers were also
required to provide local law enforcement with a letter about the study before conducting visits.
Such collaboration was important for addressing any potential respondent concerns about the
study or the field workers’ legitimacy.
In-person visits were purposely conducted on different days (both weekdays and weekends) and at
varying times (morning, afternoon, and evening) to maximize the likelihood of finding a member of
the household at home. Field staff visited all households in the selected block groups at least once
and, in the cases in which there was no one at home on the first attempt, visited some households
multiple times. Some individuals who were at home at the time of the household visit declined
participation prior to the survey and we were thus unable to determine whether three- or four-
year-old children lived in the households. Of the households where the adult indicated they had an
age-eligible child, 85% responded to the household survey and 75% agreed to become on-going
participants in ELS@H.
November 2018 8
With regard to details about the household visit itself, after identifying themselves and providing a
brief overview of the study, the field workers asked participating respondents whether there was
an age-eligible child living in the home. If there was no child living there, then the field worker
thanked the respondent for his or her time and marked the home as being ineligible to participate.
If there was a potentially age-eligible child living in the home, then the field worker confirmed that
the respondent was a parent/guardian of the child and could both answer questions about current
education and care arrangements and make the decision to have the child participate in the study.
If the respondent indicated he or she was not the parent/guardian of the child, then the field
worker scheduled a time to return to the home when they could speak with the parent/guardian. If
the respondent was the parent/guardian, then the field worker proceeded to ask the adult
questions about the child and his or her current education and care arrangement and then asked
the parent/guardian if he/she was willing to be part of the study. Field workers tracked all
information on households and responses to household survey items using a tablet-based
application that sent data in real time to a centralized database.
Some respondents required that the household survey be administered by field workers in a
language other than English. If the respondent required the survey to be administered in Spanish
and the field worker was bilingual in Spanish and English, then the survey was administered on the
spot in Spanish. The tablet application had the household survey programmed in both English and
Spanish so that either language could be administered in real time. In the case that the field worker
was not bilingual in Spanish and English, the field worker marked the household in the tracking
system as requiring a bilingual field worker to return to conduct the survey. If the respondent
required a language other than Spanish or English, then the field worker used a study-provided cell
phone to call an interpretation service and conducted the survey in real time with the service’s
assistance.
Survey Instrument
The household survey instrument was designed to capture detailed information on children’s
current early education and care arrangements. It included items on the type of education and care
used, the number of hours of education and care used, and the adult caregiver’s confidence in his
or her child’s education and care. Caregivers were similarly asked to rate their confidence in the
child’s doctors or medical care. The survey also contained items asking caregivers to share their
greatest worry for their child’s future and to name several words that describe their child.
Sampling Weights
Sampling weights are necessary to account for survey nonresponse and yield population-level
estimates from the household survey. Composite weights for each child in the household survey
were created in two phases to account for failure to screen the household address (i.e., the
probability that a given household was surveyed), and to account for failure to obtain parental
consent in cases where the screener established that the household had an age-eligible child (i.e.,
the probability that a given household would provide parental consent).
For each phase, the following procedure was used: First, a collection of variables potentially
relevant to nonresponse were collected from different sources; these data primarily included
November 2018 9
variables for the household screener interview and zip-code level data from the 2012-2016
American Community Survey (ACS) and 2010 Census. Second, missing values of these predictor
variables were imputed. Third, a reduced set of covariates used to predict nonresponse were
selected using a recently-developed technique (LASSO with 10-fold cross-validation). Fourth, logistic
models for nonresponse were fit using the reduced set of covariates to obtain predicted response
propensities in each phase.
Preliminary nonresponse weights were calculated by dividing the base weight by the predicted
response propensities in each phase; these preliminary weights are used in the present analysis. To
form the final composite weights, a small number of large weights will be trimmed, and the
trimmed weights will be redistributed such that the weights will yield a consistent estimate of the
number of three- and four-year-old children in the state. The weighted analyses presented in this
report are generated using these preliminary weights, however, use of the finalized weights is
expected to have minimal effects on the results.
November 2018 10
Findings
Over the ten-month survey administration period, field workers collected household survey
responses from the caregivers of 841 children whose parent or guardian agreed to ELS@H
participation. Responses came from across the state, with 24% of respondents living in the Greater
Boston area, 35% living in Eastern Massachusetts, and 40% living in Western Massachusetts.
Approximately 55% of respondents resided in communities considered “higher poverty” as
compared to the median of their block group of residence.
If response rates were equivalent within each stratum, then we could consider unweighted results
from the household survey representative at the state-level. However, given that the household
survey sample does not have equivalent proportions of respondents from each stratum (e.g., there
were more respondents from Western Massachusetts than from the Greater Boston area), we rely
on sample weights to produce estimates that are representative at the state level. In this memo, we
present both the unweighted and weighted results. Whereas the weighted results are
representative of the state’s population, the unweighted results provide information about the
actual families who opted to participate in the survey.
Unweighted Results
Type of Education and Care Household survey respondents were asked to report the various types of education and care they used with their age-eligible child. Across the state (and nation), families rely on a diverse constellation of education and care that is often challenging to categorize given settings’ reliance on complex blends of funding. In this study, education and care types were divided into two broader categories of education and care – formal and informal – and we consider parent/guardian care as a type unto itself. Figure 2 presents the taxonomy of early education care types represented in the study. Formal education and care includes community-based providers, Head Start centers, and public prekindergarten centers, whereas informal includes licensed family child care centers, unlicensed non-relative care, and unlicensed non-parental relative care. As shown in the Figure 2, the two broad types of education and care exist in the context of parent/guardian care. We counted children as participating in each education and care type if they typically received at
least eight hours a week of education or care in that type. The one exception was parent/guardian
care since, of course, children receive far greater than eight hours a week of this type. We counted
children as receiving parent/guardian care only if the child spent less than eight hours in any other
type of education and care.
November 2018 11
Figure 2. Taxonomy of Education and Care Types
Unweighted results indicate that the families relied on a wide variety of early education and care
arrangements for their children (Figure 3). Of the 841 families who agreed to participate in the
household survey, approximately 52% were enrolled in formal settings and 12% were enrolled in
informal settings, while an additional 13% were enrolled in both formal and informal care settings.
In this sample, roughly a quarter of children were categorized as being in parental care only.
Figure 3. Percent of Children Enrolled in Formal and Informal Settings
A closer look at families’ use of education and care indicates that within the informal and formal
education and care categories, children and families used many distinct types of providers (Figure
4). Of children in formal settings, community-based center providers comprised the most frequently
used type of early education and care: 28% of three- and four-year-olds were enrolled with
community-based providers, and 18% were enrolled in public prekindergarten programs. The most
frequently used type of informal care was unlicensed relative care, used by 15% of three- and four-
51.5
11.7 13.0
23.9
0.0
10.0
20.0
30.0
40.0
50.0
60.0
Formal Only Informal Only Both Parent/Guardian Care
November 2018 12
year-olds, while 6% of children were in unlicensed non-relative care, and 3% were enrolled in family
child care programs. These figures were calculated using mutually exclusive care categories,
meaning that children using multiple care types were assigned to only the type of care that is being
considered for the broader ELS@H study. For this small subset of children, we prioritized whether
the child used the following care type as follows: Head Start, unlicensed non-relative care,
unlicensed relative care, public school preschool, family child care, community-based center
providers, and (if no other care type was used) parental care.
Figure 4. Percent of Children Enrolled in Different Types of Education and Care
Note: Children enrolled in multiple care types (e.g., spent more than 8 hours a week in multiple settings) were counted under only one education and care type. Specifically, these children were assigned to the type of care that is the type being considered for ELS@H. The proportion of children belonging to each education and care type sums to 100%. Differences in Type of Education and Care by Region and Community Poverty Patterns of formal and informal education and care use were generally similar in households across
Western MA, Eastern MA, and the Boston Area (Figure 5). The percent of three- and four-year-old
children in informal settings only, formal settings only, and both formal and informal settings are
similar across the three regions. However, a larger share of children in the Western MA region rely
exclusively on parental care, relative to those living in the Eastern MA or Boston Area regions (29%
vs. 20% and 21%, respectively), and these differences are statistically significant at the p < .05 level.
Families in higher-poverty communities were more likely to use parent only care, and less likely to
have their children enrolled in formal care settings (Figure 6). Of families in lower-poverty
communities, 56% used formal care only and 16% used both formal and informal care. In contrast,
in higher-poverty communities, 48% of families used formal care only and 10% used both formal
17.6
28.3
6.2
3.1
6.3
14.6
23.9
0.0
5.0
10.0
15.0
20.0
25.0
30.0
Public School(PreK)
Community-BasedCenter
Head Start Family Child CareCenter
UnlicensedNon-Relative
UnlicensedRelative
Parent/GuardianCare
November 2018 13
and informal care. Both differences are statistically significant at the p < .05 level. Only 19% of
families in lower-poverty communities relied on parent care only relative to 28% of families in
higher-poverty communities, and this difference is statistically significant at the p < .01 level.
Figure 5. Percent of Children in Formal and Informal Settings, by Region
Note: Stars indicate statistical significance from 𝜒2tests with * p < .05, ** p < .01, *** p < .001
Figure 6. Percent of Children in Formal and Informal Settings, by Community Poverty
Note: Stars indicate statistical significance from 𝜒2tests with * p < .05, ** p < .01, *** p < .001
48.8
10.4 11.5
29.3
51.7
13.4 15.1 19.8
55.6
11.2 12.2
21.0
0.0
10.0
20.0
30.0
40.0
50.0
60.0
Formal Only Informal Only Both Parent/Guardian Care
Western MA Eastern MA Boston Area
*
56.1
9.2
16.1 18.7
47.7
13.7 10.4
28.2
0.0
10.0
20.0
30.0
40.0
50.0
60.0
Formal Only Informal Only Both Parent/Guardian Care
Low Poverty High Poverty
*
*
**
*
November 2018 14
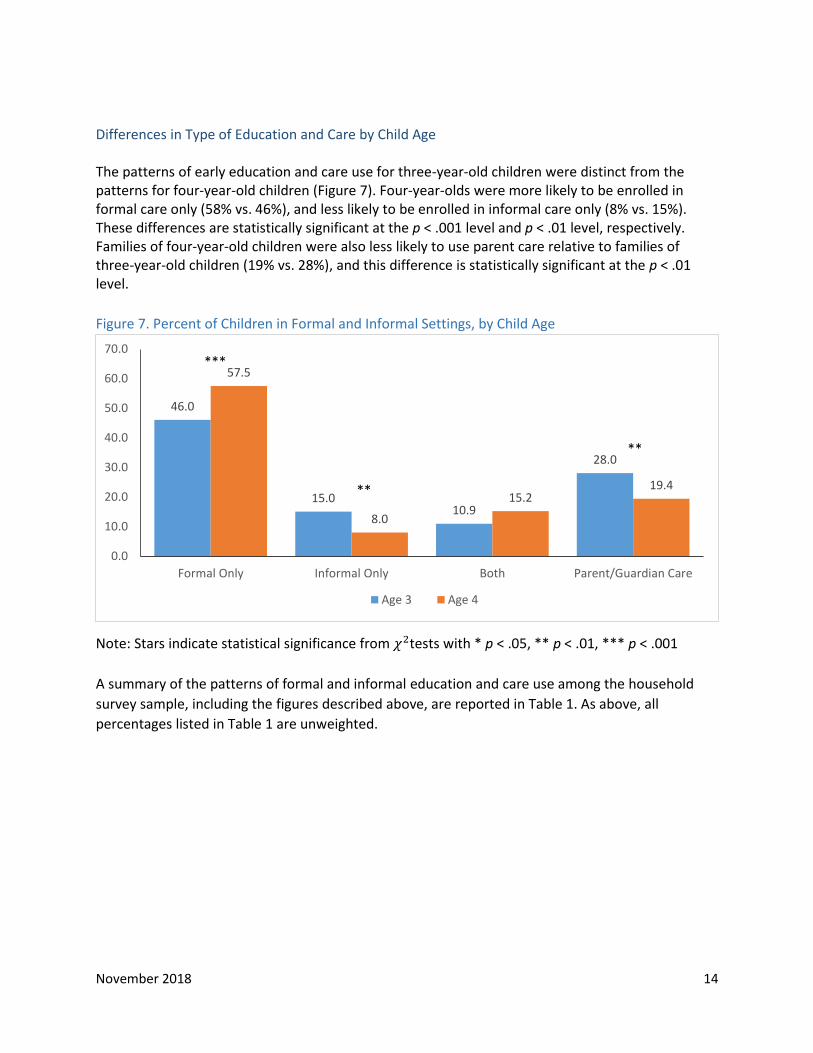
Differences in Type of Education and Care by Child Age The patterns of early education and care use for three-year-old children were distinct from the patterns for four-year-old children (Figure 7). Four-year-olds were more likely to be enrolled in formal care only (58% vs. 46%), and less likely to be enrolled in informal care only (8% vs. 15%). These differences are statistically significant at the p < .001 level and p < .01 level, respectively. Families of four-year-old children were also less likely to use parent care relative to families of three-year-old children (19% vs. 28%), and this difference is statistically significant at the p < .01 level.
Figure 7. Percent of Children in Formal and Informal Settings, by Child Age
Note: Stars indicate statistical significance from 𝜒2tests with * p < .05, ** p < .01, *** p < .001
A summary of the patterns of formal and informal education and care use among the household
survey sample, including the figures described above, are reported in Table 1. As above, all
percentages listed in Table 1 are unweighted.
46.0
15.0 10.9
28.0
57.5
8.0
15.2 19.4
0.0
10.0
20.0
30.0
40.0
50.0
60.0
70.0
Formal Only Informal Only Both Parent/Guardian Care
Age 3 Age 4
***
**
**
November 2018 15
Table 1. Percent of Children Using Formal and/or Informal Education and Care in the Study Sample
All Age 3 Age 4 High poverty
Low poverty
Western MA
Eastern MA
Boston Area
Type of education and care Formal only 51.5
46.0*** 57.5***
47.6* 55.9*
48.8 51.7 55.6
Informal only 11.7
15.0** 8.0**
13.7* 9.2*
10.4 13.4 11.2
Both formal & informal 13.0
10.9 15.2
10.4* 16.1*
11.5 15.1 12.2 Parent care only 23.9
28.0** 19.4**
28.3** 18.7**
29.3* 19.8* 21.0*
Note: On all figures stars indicate statistical significance from 𝜒2tests with * p < .05, ** p <.01, *** p <.001
Confidence in Care In the household survey, we asked parents about their confidence in their child’s early education and care (i.e., “How confident are you that your child’s schools will be able to help him or her reach his or hers and your goals”). Overall, parents in the sample reported being confident in their child’s early education and care (Figure 8). More than half of parents (52%) reported being very confident in their child’s education and care and an additional 32% of parents reported being confident. 11% of parents reported being somewhat confident, and less than 5% report being only slightly confident or not confident at all. Figure 8. Parents’ Confidence in their Child’s Early Education and Care
51.6
32.4
11.2
3.3 1.4
0.0
10.0
20.0
30.0
40.0
50.0
60.0
Very confident Confident Somewhat confident Slightly confident Not confident at all
November 2018 16
Differences in Confidence by Education and Care Type Parents reported similar levels of confidence regardless of whether their child was in formal, informal, both formal and informal education and care, or neither (Figure 9). 86% of parents whose child was enrolled in formal care or both formal and informal care reported being confident or very confident in their child’s care. However, parents reported similar levels of confidence when their child was in informal care (83%) or parental care only (80%). None of these differences are statistically significant. Figure 9. Percent of Parents who are Confident or Very Confident in their Child’s Early Education and Care, by Type
Note: Stars indicate statistical significance from 𝜒2tests with * p < .05, ** p < .01, *** p < .001
Differences in Confidence by Region and Community Poverty
Parents consistently reported high levels of confidence in their child’s education and care across
geographic regions (Figure 10). Over 80% of parents in Western MA, Eastern MA, and the Greater
Boston Area reported being confident or very confident in their child’s education and care. The
percent of parents who reported being only slightly confident or not confident at all is similarly low
across the three regions (4% to 6%).
Despite the higher rates of informal and parental care only use among families in lower-income
communities relative to those in higher income communities, we observed few differences in
parents’ confidence in their child’s early education and care based on community poverty (Figure
11). Parents in higher-poverty communities were somewhat less likely to report being very
confident in their child’s care relative to parents in lower-poverty communities (56% vs. 48%), and
85.6 82.8
86.2 79.9
0.0
10.0
20.0
30.0
40.0
50.0
60.0
70.0
80.0
90.0
100.0
Formal Only Informal Only Both Parent/Guardian Care
November 2018 17
this difference is statistically significant at the p < .05 level. However, there are otherwise few
differences in parents’ confidence between high- and low-poverty areas.
Figure 10. Parents’ Confidence in their Child’s Early Education and Care, by Region
Note: Stars indicate statistical significance from 𝜒2tests with * p < .05, ** p < .01, *** p < .001
Figure 11. Parents’ Confidence in their Child’s Early Education and Care, by Community Poverty
Note: Stars indicate statistical significance from 𝜒2tests with * p < .05, ** p < .01, *** p < .001
54.6
29.2
12.7
1.6 1.9
48.2
36.9
9.6
3.9 1.4
51.8
31.3
11.3
5.1 0.5
0.0
10.0
20.0
30.0
40.0
50.0
60.0
Very confident Confident Somewhat confident Slightly confident Not confident at all
Western MA Eastern MA Boston Area
55.7
29.7
10.0
3.0 1.6
48.1
34.8
12.3
3.6 1.2
0.0
10.0
20.0
30.0
40.0
50.0
60.0
Very confident Confident Somewhat confident Slightly confident Not confident at all
Low Poverty High Poverty
*
November 2018 18
Differences in Confidence by Age
Parents reported similar levels of confidence in their education and care for three- and four-year-old children (Figure 12). 86% of parents of four-year-old children and 83% of three-year-old children reported being very confident or confident in their children’s care; this difference is not statistically significant. Less than 5% of parents reported being only slightly confident or not confident at all in their children’s care, across both child age groups. Figure 12. Parents’ Confidence in their Child’s Early Education and Care, by Child Age
Note: Stars indicate statistical significance from 𝜒2tests with * p < .05, ** p < .01, *** p < .001 Confidence in Early Education and Care vs. Confidence in Medical Care In the household survey, we also asked parents about their confidence in their child’s medical care (i.e., “How confident are you that your child’s doctors or medical care will help him or her stay healthy”). Although parents’ confidence in their child’s early education and care was high, parents were more confident in their child’s medical care (Figure 13). Among parents who reported their level of confidence in both their children’s early education care and their children’s medical care, 68% of parents reported being very confident in their child’s medical care, whereas 52% of parents reported being very confident in their child’s early education and care. This difference is statistically significant at the p < .001 level.
48.5
34.2
12.4
3.6 1.2
55.0
30.5
10.0
2.9 1.6
0.0
10.0
20.0
30.0
40.0
50.0
60.0
Very confident Confident Somewhat confident Slightly confident Not confident at all
Age 3 Age 4
November 2018 19
Figure 13. Parents’ Confidence in their Child’s Early Education and Care Compared to Confidence in
their Child’s Medical Care
Note: Based on sample of households that reported both confidence in their children’s early education and care and confidence in their children’s medical care. Stars indicate statistical significance from McNemar tests with * p < .05, ** p <.01, *** p <.001 Parents’ Concerns about their Children’s Future No one would be surprised to hear that parents have a lot of concerns, but through the household survey, ELS@H can tell us which “biggest worry” is the most common among Massachusetts parents of three- and four-year-old children. We asked parents to describe their biggest worry for their child’s future (i.e., “What is your biggest worry for your child’s future”). We coded parents’ responses and created categories to describe those responses: Academic Skills and Quality Education (ASQE); Culture and Country (CC); Focus on the Positive (FP); Negative Peer Influences (NPI); Physical Well-Being (PWB); Presence for Child (PC); Resources and Opportunities (RO); Self-actualization and Moral Character (SAMC); Social-Emotional Well-Being (SEWB); and State of the World (SW). Parents’ concerns about their children’s future ranged from concerns about the quality of their
children’s immediate educational opportunities to broader concerns about national and global
issues (Figure 14). Concern about children’s education and learning as broadly defined by the
category Academic Skills and Education was by far the most common focus for parents and
guardians, and was present in 28% of responses. This category encompassed concerns about access
to education at any level, the quality of education available to children, and children’s ability to
acquire important skills for academic success. Not surprisingly, Social-Emotional Well-Being and
Physical Well-Being—in that order—were both prominent worries as well, and were present in 19%
and 16% of responses, respectively. Whereas Social-Emotional Well-Being focused on worry over
the child’s happiness, relationships, and ability to deal with negative situations and emotions,
Physical Well-Being constituted fear of the child’s physical health and safety being compromised.
51.8
32.5
11.0
3.3 1.4
67.9
24.4
6.0 1.1 0.6
0.0
10.0
20.0
30.0
40.0
50.0
60.0
70.0
80.0
Very confident Confident Somewhat confident Slightly confident Not confident at all
Early education and care Medical care
***
***
***
**
November 2018 20
Though not as common as responses relating to education and well-being, State of the World and
Self-Actualization described a large share of responses—12% for the former and 11% for the
latter—reflecting that many parents worry about broader issues affecting entire groups or counties
as well as their children’s ability to succeed and develop into a caring person.
Figure 14. Parents’ Biggest Worries about their Children’s Future
Note: ASQE = Academic Skills and Quality Education; CC = Culture and Country; FP = Focus on the Positive; NPI = Negative Peer Influences; PWB = Physical Well-Being; PC = Presence for Child; RO = Resources and Opportunities; SAMC = Self-actualization and Moral Character; SEWB = Social-Emotional Well-Being; and SW = State of the World. Parents’ Descriptions of their Children in Three Words We additionally asked parents to describe their child in three words (i.e., “Describe your child using three words”). In analyzing parents’ responses, we first removed the following words that did not relate meaningfully to the question: “very,” “kid,” “boy,” and “girl.” For example, if a parent responded “very smart kid” we extracted only the word “smart.” We then examined only words that appeared a minimum of 10 times in the data, and excluded words that appeared only infrequently (e.g., “alert,” “angelic,” and “anxious”). The most common words parents used to describe their children are presented in the word cloud below (Figure 15). The words most often used by parents to describe their children were largely positive. Parents most frequently used the word “smart” to describe their children; “energetic,” “funny,” and “happy,” were also common responses.
27.9
18.6
16.3
12.3 11.0
3.6 2.9 2.2 1.9 1.0
0.0
5.0
10.0
15.0
20.0
25.0
30.0
ASQE SEWB PWB SW SAMC NPI RO PC FP CC
November 2018 21
Figure 15. Words Commonly Used by Parents to Describe their Children
Note: The most frequent words are in larger font in the word cloud and the least frequent words
are in smaller font.
November 2018 22
Weighted Results
The following results come from analyses using sample weights to account for non-response rates,
yielding results that are representative of the state’s population of three- and four-year-old
children. They largely paint the same picture of early education and care as the unweighted results2.
Type of Education and Care
Similar to the unweighted estimates described above, weighted estimates indicate that 55% of
three- and four-year-old children across the Commonwealth were in formal education and care only
and 14% were in informal education and care only (Figure 16). An additional 14% of children were
in a combination of formal and informal education and care. Across the Commonwealth, 17% of
children relied on parent care only.
Figure 16. Percent of Children in the Commonwealth Enrolled in Formal and Informal Settings
Three- and four-year-old children in the state who use formal or informal education and care
received care in a variety of settings (Figure 17). Among children who use formal care, community-
based providers comprise the most frequently used care type (32%), followed by public preschool
programs (19%). Among children receiving care in informal settings, the most frequently used type
of care is unlicensed relative care (17%), followed by unlicensed non-relative care (8%). As with the
unweighted estimates, these figures were calculated using mutually exclusive care categories with
children using multiple care types assigned to only the type of care that is being considered for the
broader ELS@H study.
2 As mentioned previously in the sampling weights section, the sampling weights used in this memo are
preliminary and further adjustments will be made to trim the current weights. We do not expect these weights to have a significant impact on the current weighted findings.
54.5
14.3 13.8 17.4
0.0
10.0
20.0
30.0
40.0
50.0
60.0
Formal Only Informal Only Both Parent/Guardian Care
November 2018 23
Figure 17. Percent of Children in the Commonwealth Enrolled in Different Types of Education and
Care
Differences in Type of Education and Care by Region and Community Poverty
As in the unweighted estimates, the patterns of formal and informal education and care use were
generally similar in households across the study’s three regions (Figure 18). Across Western MA,
Eastern MA, and the Boston Area, between 52% and 60% of children used formal education and
care only. Between 13% and 17% used informal education and care only, while 12% to 15% used a
combination of formal and informal education and care. However, a larger share of children in
Western MA used parent only care (23%) relative to Eastern MA (15%) and the Boston Area (14%),
these region-based differences in parent only care are statistically significant at the p < .05 level.
Patterns of education and care use among three- and four-year-old children differed across high-
and low-income communities (Figure 19). Among three- and four-year-olds in Massachusetts,
children in higher-poverty communities across were less likely to use formal education and care
only relative to children lower-poverty communities (50% vs. 59%) and similarly less likely to use a
combination of formal and informal education and care (11% vs. 17%). Children in higher poverty
communities were also more likely to rely on informal education care only (18% vs. 10%) and more
likely to use parent care only (21% vs. 14%). The community poverty level-related differences in
education and care use across all types are statistically significant at the p < .05 or p < .01 levels.
18.5
31.8
4.6 2.4
7.9
17.4 17.4
0.0
5.0
10.0
15.0
20.0
25.0
30.0
35.0
Public School(PreK)
Community-BasedCenter
Head Start Family Child CareCenter
UnlicensedNon-Relative
UnlicensedRelative
Parent/GuardianCare
November 2018 24
Figure 18. Percent of Children in the Commonwealth in Formal and Informal Settings, by Region
Note: Stars indicate statistical significance from 𝜒2tests with * p < .05, ** p < .01, *** p < .001
Figure 19. Percent of Children in the Commonwealth in Formal and Informal Settings, by
Community Poverty
Note: Stars indicate statistical significance from 𝜒2tests with * p < .05, ** p < .01, *** p < .001
51.9
13.0 12.4
22.8
52.6
16.6 15.4 15.4
59.9
12.5 13.2 14.4
0.0
10.0
20.0
30.0
40.0
50.0
60.0
70.0
Formal Only Informal Only Both Parent/Guardian Care
Western MA Eastern MA Boston Area
59.3
10.3
17.0 13.5
50.4
17.7
11.2
20.7
0.0
10.0
20.0
30.0
40.0
50.0
60.0
70.0
Formal Only Informal Only Both Parent/Guardian Care
Low Poverty High Poverty
*
** ** *
*
November 2018 25
Differences in Type of Education and Care by Child Age
The patterns of early education and care use for three-year-old children were distinct from the
patterns of education and care use for four-year-old children across the Commonwealth (Figure 20).
Four-year-old children were more likely to be enrolled in formal education and care only (60% vs.
50%), and less likely to be enrolled in informal care only (10% vs. 18%). Both differences are
statistically significant at the p < .01 level. Families of four-year-old children were also less likely to
use parent care only care relative to families of three-year-olds (14% vs. 20%), and this difference is
statistically significant at the p < .05 level.
Figure 20. Percent of Children in the Commonwealth in Formal and Informal Settings, by Child Age
Note: Stars indicate statistical significance from 𝜒2tests with * p < .05, ** p < .01, *** p < .001
49.6
18.2
11.9
20.3
59.6
10.2
15.9 14.3
0.0
10.0
20.0
30.0
40.0
50.0
60.0
Formal Only Informal Only Both Parent/Guardian Care
Age 3 Age 4
**
** *
November 2018 26
Table 2 summarizes the overall, age-related, and geography-related proportions of children across
the Commonwealth in different education and care arrangements.
Table 2. Percent of Children in the Commonwealth using Formal and/or Informal Care
All Age 3 Age 4 High poverty
Low poverty
Western MA
Eastern MA
Boston Area
Type of education and care Formal only 54.5
49.6** 59.6**
59.3* 50.4*
51.9 52.6 59.9
Informal only 14.3
18.2** 10.2**
10.3** 17.7**
13.0 16.6 12.5
Both formal & informal 13.8
11.9 15.9
17.0* 11.2*
12.4 15.4 13.2 Parent care only 17.4
20.3* 14.4*
13.5** 20.7**
22.8* 15.4* 14.3*
Notes: Asterisks indicate statistically significant difference based on 𝜒2 tests.
Confidence in Care
As noted above, we asked parents to report their confidence in their children’s early education and
care (i.e., “How confident are you that your child’s schools will be able to help him or her reach his
or hers and your goals”). Parents across the Commonwealth reported being confident in their
child’s early education and care (Figure 21). More than half of parents (52%) reported being very
confident in their child’s care, while an additional 33% of parents reported being confident. 11% of
parents report being somewhat confident, and less than 5% report being only slightly confident or
not confident at all.
Figure 21. Parents’ Confidence in their Child’s Early Education and Care
51.8
32.6
10.7
3.7 1.2
0.0
10.0
20.0
30.0
40.0
50.0
60.0
Very confident Confident Somewhatconfident
Slightly confident Not confident at all
November 2018 27
Differences in Confidence by Care Type
Parents in the Commonwealth report similar levels of confidence regardless of whether their child
used formal, informal, both formal and informal education and care, or neither (Figure 22). 86% of
parents who enrolled their children in formal education and care or and 85% of parents who
enrolled their children in both formal and informal education and care report being confident or
very confident in their child’s education and care. However, parents report similar levels of
confidence in children’s use of informal education care (84%) and parental care only (80%). None of
these type-related differences are statistically significant.
Figure 22. Percent of Parents in the Commonwealth who are Confident or Very Confident in their
Child’s Early Education and Care, by Care Type
Note: Stars indicate statistical significance from 𝜒2tests with * p < .05, ** p < .01, *** p < .001
Differences in Confidence by Region and Community Poverty
Parents reported similar levels of confidence in their child’s education care across the state’s three
geographic regions (Figure 23). As in the unweighted estimates, over 80% of parents in Western
MA, Eastern MA, and the Greater Boston Area reported being confident or very confident in their
child’s care (Figure 20). The percent of parents who reported being only slightly confident or not
confident at all was similarly low across the three regions (3% to 6%).
85.7 83.5 85.3 79.8
0.0
10.0
20.0
30.0
40.0
50.0
60.0
70.0
80.0
90.0
100.0
Formal Only Informal Only Both Parent/Guardian Care
November 2018 28
Figure 23. Parents’ Confidence in their Child’s Early Education and Care, Across the Commonwealth
by Region
Note: Stars indicate statistical significance from 𝜒2tests with * p < .05, ** p < .01, *** p < .001
Despite significant differences in the use of different care types across low and high poverty
communities, we observed few differences in parents’ confidence in their child’s early education
and care based on community poverty (Figure 24). Although parents in higher-income communities
were more likely to report being very confident in their children’s care relative to parents in lower-
poverty communities (57% vs. 47%), there were few differences in the share of parents who report
being confident (29% vs. 36%), somewhat confident (10% vs. 12%), and slightly confident or not
confident at all (5% vs. 6%). Only the community-poverty related difference in parents reporting
being very confident in their child’s care are statistically significant at p < .05.
Figure 24. Parents’ Confidence in their Child’s Early Education and Care, Across the Commonwealth
by Community Poverty
Note: Stars indicate statistical significance from 𝜒2tests with * p < .05, ** p < .01, *** p < .001
54.5
29.7
12.6
1.6 1.6
48.4
37.2
9.1 4.0
1.3
53.7
29.2
11.0 5.6
0.6 0.0
10.0
20.0
30.0
40.0
50.0
60.0
Very confident Confident Somewhat confident Slightly confident Not confident at all
Western MA Eastern MA Boston Area
56.8
29.1
9.5
3.3 1.3
47.4
35.7
11.8
4.1 1.1
0.0
10.0
20.0
30.0
40.0
50.0
60.0
Very confident Confident Somewhatconfident
Slightly confident Not confident at all
Low Poverty High Poverty
*
November 2018 29
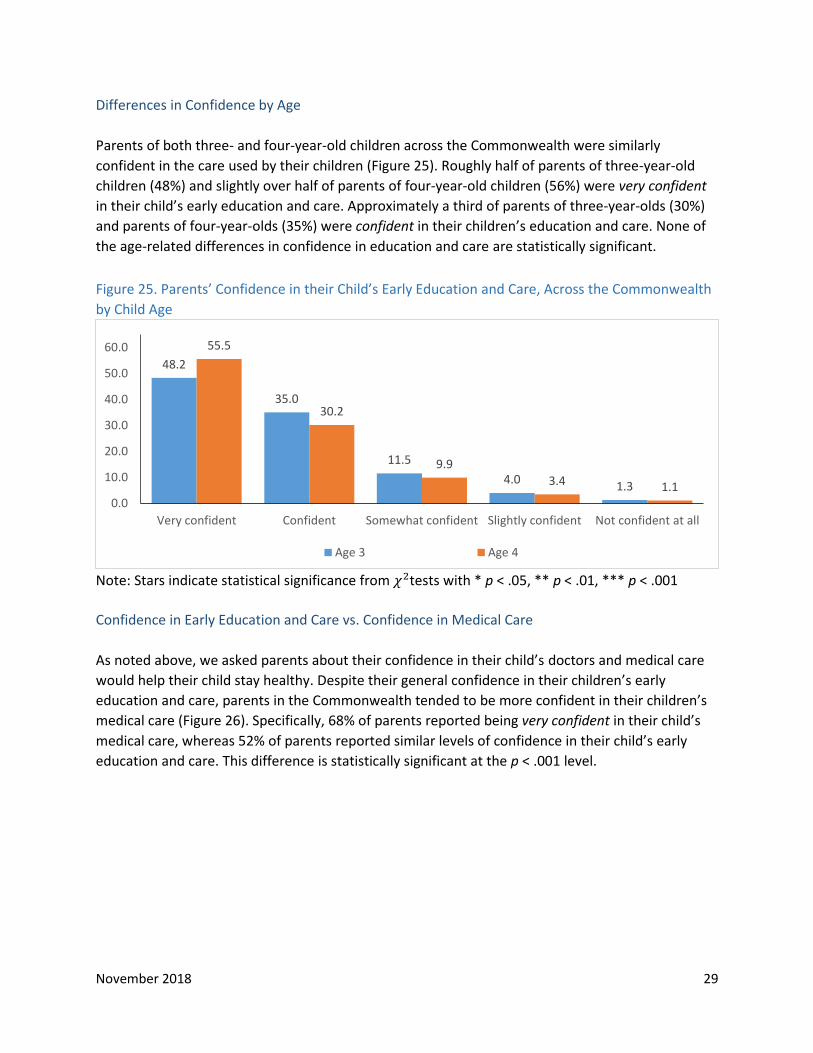
Differences in Confidence by Age
Parents of both three- and four-year-old children across the Commonwealth were similarly
confident in the care used by their children (Figure 25). Roughly half of parents of three-year-old
children (48%) and slightly over half of parents of four-year-old children (56%) were very confident
in their child’s early education and care. Approximately a third of parents of three-year-olds (30%)
and parents of four-year-olds (35%) were confident in their children’s education and care. None of
the age-related differences in confidence in education and care are statistically significant.
Figure 25. Parents’ Confidence in their Child’s Early Education and Care, Across the Commonwealth
by Child Age
Note: Stars indicate statistical significance from 𝜒2tests with * p < .05, ** p < .01, *** p < .001
Confidence in Early Education and Care vs. Confidence in Medical Care
As noted above, we asked parents about their confidence in their child’s doctors and medical care
would help their child stay healthy. Despite their general confidence in their children’s early
education and care, parents in the Commonwealth tended to be more confident in their children’s
medical care (Figure 26). Specifically, 68% of parents reported being very confident in their child’s
medical care, whereas 52% of parents reported similar levels of confidence in their child’s early
education and care. This difference is statistically significant at the p < .001 level.
48.2
35.0
11.5
4.0 1.3
55.5
30.2
9.9
3.4 1.1 0.0
10.0
20.0
30.0
40.0
50.0
60.0
Very confident Confident Somewhat confident Slightly confident Not confident at all
Age 3 Age 4
November 2018 30
Figure 26. Parents’ Confidence in their Child’s Early Education and Care vs. Confidence in their
Child’s Medical Care, Across the Commonwealth
Note: Based on sample of households that reported both confidence in their children’s early education and care and confidence in their children’s medical care. Stars indicate statistical significance from McNemar tests with * p < .05, ** p <.01, *** p <.001 Parents’ Concerns about their Children’s Future As described above, the survey asked parents about their “biggest worry” with regards to their children’s futures. As with the unweighted estimates, concern over children’s education and learning as broadly defined by the category Academic Skills and Education was by far the most common focus for parents of three- and four-year-old children in Massachusetts, present in 28% of responses (Figure 27). Social-Emotional Well-Being (19%) and Physical Well-Being (16%) were similarly prominent concerns for parents in the state. Finally, many parents worried about larger issues (State of the World; 13%) and their children’s ability to succeed and develop into a caring person (Self-Actualization; 11%).
52.0
32.7
10.5 3.7 1.2
67.9
24.0
6.3 1.2 0.7
0.0
10.0
20.0
30.0
40.0
50.0
60.0
70.0
80.0
Very confident Confident Somewhat confident Slightly confident Not confident at all
Early education and care Medical care
***
***
** **
November 2018 31
Figure 27. Parents’ Biggest Worries about the Children’s Future, Across the Commonwealth
Note: ASQE = Academic Skills and Quality Education; CC = Culture and Country; FP = Focus on the
Positive; NPI = Negative Peer Influences; PWB = Physical Well-Being; PC = Presence for Child; RO =
Resources and Opportunities; SAMC = Self-actualization and Moral Character; SEWB = Social-
Emotional Well-Being; and SW = State of the World.
28.1
18.9
15.9
12.5 11.2
3.5 3.0 1.9 1.8
0.8
0.0
5.0
10.0
15.0
20.0
25.0
30.0
ASQE SEWB PWB SW SAMC NPI RO PC FP CC
November 2018 32
Implications
Findings from the household survey provide a descriptive picture of the types of education and care
used by parents of three- and four-year-old children throughout the Commonwealth of
Massachusetts. Although more than half of children primarily use some type of formal education
and care, there are clear differences in the types of education and care used between three-year-
olds and four-year-olds, and across relatively high- and low-income communities.
These findings raise important policy-relevant questions. These questions include but are not
limited to: How do parents make decisions about the types of education and care they currently
use? What are the implications of these decisions for the quality of children’s day-to-day
experiences and children’s outcomes over time? Do parental preferences and/or access to
education and care account for the observed differences in types by child age and community
poverty level? Detailed data collected on families, children, and settings through ELS@H will allow
us to address these questions and others to ultimately inform early education policies, practices,
and investments that help meet the diverse needs of families across the nation today.
November 2018 33
References
Office of Special Analytic Projects. (2016). Population information. Retrieved August 24, 2018, from
US Census Bureau. (2010). 2010 Census Tallies of Census Tracts, Block Groups and Blocks. Retrieved August 24, 2018, from https://www.census.gov/geo/maps-data/data/tallies/tractblock.html