Page 1
ERFEvaluationReport2010 Page1of23
EarlyReadingFirstAnnualEvaluationReportEnhancedLanguageandLiteracySuccessProject
Year2:2009‐2010SchoolYear
SandraJoWilson,Ph.D.PeabodyResearchInstitute,VanderbiltUniversity
IntroductionTheMetropolitanNashvillePublicSchools/VanderbiltUniversityEarlyReadingFirstproject,EnhancedLanguageandLiteracySuccess(ELLS),contractswithSandraWilson,AssociateDirectorofthePeabodyResearchInstituteatVanderbiltUniversity,toconductanindependentevaluationoftheprogram.Theevaluationhasfocusedontwoaspectsoftheprogram:(1)anevaluationofcurriculumimplementation,and(2)detailedassessmentsofchildoutcomes.Thisaddendumtotheannualreportfor2009‐2010willprovideinformationaboutbothoftheseaspectsoftheevaluation.EvaluationofCurriculumImplementationTheEnhancedLanguageandLiteracySuccess(ELLS)projectwaslaunchedinNovember,2008intenprekindergartenclassroomshousedinfiveelementaryschoolsintheMetropolitanNashvillearea.InYear2(2009‐2010)oftheproject,twoteacherslefttheirschoolswhilefivenewteachersjoinedtheproject.TheresultsforYear2thusrepresent13classroomsin7schools.ThethirteenERFclassroomswereeachformallyvisitedforobservationtwiceduringtheschoolyear.ThefirstobservationoccurredbetweenSeptemberandNovember,2009.TheSpringobservationoccurredbetweenFebruaryandMarch,2010.Weobservedtheclassroomsusingthreeinstruments.ThefirstinstrumentwasamodifiedversionoftheOWLCurriculumImplementationChecklistsuppliedwiththeOWLcurriculum.Second,weusedanobservationalsystemcalledtheNarrativeRecord,whichrecordsthetypesandtimingofclassroom“episodes.”Theepisodesarecodedfortheamountoftimeeachoccurred,scoredforOWLcurriculumcontent,andratedforclassinvolvementandteacherinstructionalquality.Third,weusedtheEarlyLanguageandLiteracyObservation(ELLCO)PreKToolandtheLiteracyEnvironmentChecklistfromtheEarlyLanguageandLiteracyClassroomObservationToolkit.OWLCurriculumImplementationChecklistAnimplementationchecklistisprovidedwiththeOWLcurriculum,whichwemodifiedintwowaysforthecurrentproject:(1)toincludemorespecificdetailaboutsomeaspectsofthecurriculumthatwerenotincludedintheoriginalversion;and,(2)toincludeitemsaboutsomeoftheadditionalwritingactivitiesthatwereimplementedassupplementstotheOWLcurriculum.Thechecklisthas10sections,eachcoveringanaspectoftheOWLcurriculumoracomponentoftheELLSprogram.Theteacherswereratedonwhethertheydeliveredthecomponentornot,andonthequalityofthedelivery.Followingisashortdescriptionofthecriticalfeaturesofeachcurriculumcomponent.
Page 2
ERFEvaluationReport2010 Page2of23
MorningMeeting:teachersareexpectedtodemonstratetheactivitiesplannedforCentersTimethatday,makeconnectionstothecurriculumunit,anddefineandusethecurriculumvocabulary.
Interactivewriting,groupsettings:theELLSprojectsupplementstheOWLCurriculumbyaddingactivitiesthatfocusonchildren’sdevelopingwritingskills.Teachersareexpectedtowriteduringlargegroupactivities,todrawattentiontowriting,andencouragechildrentoparticipateininteractivewriting.
CentersTime:observerslookforopencentersthatarestockedwithappropriatematerials;childrenshouldbeallowedtomovebetweencenters,andteachersshouldhaveasystemformanagingthechildren’smovementbetweencenters.Inaddition,teachersareexpectedtohavesustainedinteractionswithchildrenandusecurriculumvocabulary.
WritinginCenters:thisisanELLSprojectsupplementtotheOWLCurriculum;teachersareexpectedtoincorporatewritingintocenteractivities,invitechildrentoparticipateinwriting,anddemonstratethepurposesandmeaningofwriting.
StoryTime:teachersareexpectedtoreadprescribedOWLCurriculumbooksasrecommendedinthecurriculummanual;teachersshoulddefineandusevocabulary,respondtoquestions,andencouragethoughtfuldiscussion.
Songs,WordPlay,&Letters(SWPL):thiscomponentofthecurriculumisfocusedonphonologicalawarenessskills.Teachersareexpectedtohavematerialspreparedandmonitorandmanagechildren’sattentionduringthissegment.Observersalsolookforteacherstoencouragechildparticipationandfollowthetasksprescribedinthecurriculummanual.
SmallGroups:teachersandaidesareexpectedtocreateaseriesofrotatingsmallgroupseachdaythatencouragelearningandindividualdevelopment;observerslookforfunctional,orderlygroups,connectionsbetweensmallgroupactivitiesandthecurrenttheme,hands‐onactivitiesforallstudents,andanenvironmentthatencourageschildren’squestionsandexpressiveness.
Let’sFindOutAboutIt/Let’sTalkAboutIt:thissegmentofthecurriculumfocusesoninquiryandsocialskillsdevelopment.Observerslookforconnectionstothecurrenttheme,andforteacherstohelpchildrenmakeobservationsandexpressideas.
AdaptationsforELLsorSpecialNeedsChildren:forteacherswithEnglish‐languagelearnersorspecialneedschildren,observersdetermineifteachersareawareofstudentswhomightrequireadaptationsandgaugeteachers’skillinmakingnecessaryadaptations.
Transitions:transitionsshouldbewellorganizedandharmonious,andusedforeducationalpurposeswhenpossible.
Table1showstheaveragefidelityscoresforthefirstandsecondprojectyears.Thetableshowseachofthethreeobservationsaveragedacrosstheparticipatingteachers,alongwiththenumberofpointspossibleforeachsection.Inthesecondyear,allcurriculumcomponentswereobservedinatleastoneclassroom,butnotallteacherswereabletosuccessfullyimplementallcomponentsofthecurriculum.Increasesinfidelitywereobservedinallcurriculumareasfromthefirstprojectyear.IncreasesinfidelitywerealsonotedbetweenFallandSpringinYear2onthefollowingcurriculumareas:Morning
Page 3
ERFEvaluationReport2010 Page3of23
Meeting,WritinginGroupSettings,CentersTime,StoryTime,Songs,WordPlay&Letters,SmallGroups,andTransitions.Table1.AverageCurriculumImplementationScoresforEachCurriculumArea
Y1:Mean
(n=10)
Y2:Fall
Mean(n=13)
Y2:Spring
Mean(n=13)
Points
Possible
MorningMeeting 7.1 7.2 8.1 11Writing:GroupSettings 4.7 7.2 8.7 9CentersTime 18.3 21.0 22.0 24WritinginCenters 10.9 12.8 12.8 18StoryTime 23.3 26.8 28.9 30Songs,WordPlay&Letters 14.6 16.3 17.5 19SmallGroups 19.1 31.8 32.2 42Let’sTalk/FindOutAboutIt 6.4 8.6 8.2 12Support&AdaptationsforELLs* 3.0 3.7 3.7 4Transitions 3.8 4.5 5.6 6
*InYear1only6of10teachershadELLstudents.InYear2,onlysevenofthe13teachershadELLstudents.TheremainingteacherswerenotratedontheELLitems.
Summary/Conclusions:ImplementationRatingsThefollowingstrengthswerenoted:
ImplementationfidelityincreasedfromYear1toYear2inallcurriculumareas. ImplementationfidelityincreasedfromFalltoSpringinYear2onMorningMeeting,
WritinginGroupSettings,CentersTime,StoryTime,Songs,WordPlay&Letters,SmallGroups,andTransitions.
WritinginGroupSettings,CentersTime,StoryTime,SWPL,andTransitionssegmentswereimplementedwiththehighestfidelityofallthecurriculumcomponents.
Thefollowingareaswerenotedasareasforimprovement:
TeachershadthemostdifficultywiththeLet’sTalkAboutIt/Let’sFindOutAboutIt,MorningMeeting,andWritinginCenterssegments.
o Let’sTalkAboutIt/Let’sFindOutAboutItwasalsofoundtobeanareaforimprovementfromYear1.
o MorningMeetingfidelitywasimprovedfromYear1,butthereisstillroomforimprovement.
o WritinginCentersisaplannedfocusforYear3.
Page 4
ERFEvaluationReport2010 Page4of23
NarrativeRecordEachteacherwasobservedonceduring2008‐2009andtwiceduring2009‐2010usingthenarrativerecord.Thenarrativerecordisadescriptiveobservationtoolthatdocumentstheactivitiesoccurringinaclassroomthroughouttheschoolday.TheversionusedfortheELLSprojectincludesinformationaboutthestructureandcontentofactivities,theOWLschedule,andtheamountoftimespentineachsegment.Observersalsoratethelevelofteacherinstructionandtheamountofstudentengagementduringeachsegment.Theschooldaycanbedividedintoninedistinctactivities.Thesearecategorizedasinstructionalornon‐instructional,asfollows:InstructionalActivities
WholeGroup–Teacherisleadinginstructionofentireclass. SmallGroups–Teacher‐ledcollectiveinstructionoftwoormorechildren. Centers–Childrenareworkingindependentlyinorganizedcenters. Seatwork–Childrenareworkingindependently,usuallyseatedatatable,onan
assigned,structuredactivity(forexample,aworksheet). OWLTransitions–Transitionsthatincludeacademiccontent.
Non‐InstructionalActivities
Transitions–Timebetweenactivities,orwhenteacherstopsactivityforbehaviormanagement.
TV/MorningAnnouncements–TheclassiswatchingTVorlisteningtomorningannouncements.
Routines–Nap,snack,andlunch. OutofRoom–Childrenareoutoftheroomengagedinanactivity,suchasrecessor
anassembly.
Figures1‐3belowshowtheproportionoftheschooldayspentineachtypeofactivity,averagedacrossteachersforeachofthethreeobservations(FallYear1,FallYear2,SpringYear2).NotethatthefigureforYear1includesonly10teachers.ThefiguresforYear2include13teachers,8ofwhomalsoparticipatedinYear1.Significantportionsofthe6hourschooldaywerespentinrequiredroutines,suchasmealsandnaps,andoutdoorplay.Inaddition,teachersspentlargeportionsoftheschooldayintransition.Acrossthethreeobservations,abouthalfoftheschooldaywasspentinnon‐instructionalactivities;thatis,about3hoursinatypical6hourschoolday.BytheSpringof2009‐2010,teachershadincreasedWholeGroupinstructionaltimeandhadconvertedsometransitiontimetoinstructionalOWLTransitions.Bothofthesechangesareencouraging.OWLincludesalargeamountofWholeGroupinstructionandteachershavebeenincorporatingmoreofthatinstructionintotheirschoolday.Thereductionsintransitiontimeoverthethreeobservationshavegiventeachersanadditional30minutesofinstructionaltime.
Page 5
ERFEvaluationReport2010 Page5of23
Figure1
Figure2
WholeGroup18%
Centers12%
SmallGroup8%
Seatwork5%Transitions
22%
OWLTransitions2%
Routines25%
OutofRoom8%
SchoolDayOrganization:Fall2008‐2009
WholeGroup20%
Centers12%
SmallGroup6%
Seatwork3%
Transitions19%
OWLTransitions
2%
TV/Announce‐ments2%
Routines27%
OutofRoom9%
SchoolDayOrganization:Fall2009‐2010
Page 6
ERFEvaluationReport2010 Page6of23
Figure3
Figure4belowshowstheaverageproportionoftheschooldayspentdeliveringtheOWLcurriculumcomponentsacrosstheteachers.Eachdifferentcoloredbarrepresentsoneofthethreeobservationsconductedoverthetwoprojectyears.TheFigureillustratesthatteachershaveincreasedtheproportionoftimeinCenters,StoryTime,SWPL,andLet’sFindOutAboutItastheyhavebecomemoreexperiencedimplementingthecurriculum.Inaddition,theyhavereducednon‐instructionaltransitionsandhaveaddedmoreOWLtransitionstotheirinstructionalday.SmallGrouptimewasreducedintheSpringofthe2009‐2010schoolyearandremainsanareawhereimprovementsarepossibleandencouraged.
Figure4
WholeGroup24%
Centers12%
SmallGroup7%Seatwork
4%Transitions
14%
OWLTransitions
8%
Routines23%
OutofRoom8%
SchoolDayOrganization:Spring2009‐2010
0%5%10%15%20%25%30%
ProportionofSchoolDay
ProportionoftheSchoolDayineachOWLComponent
2008‐2009‐1
2009‐2010‐1
2009‐2010‐2
Page 7
ERFEvaluationReport2010 Page7of23
Non‐OWLinstructionaltimewasconsiderablyreducedinYear2andreplacedwithgreatertimeonOWLcurriculumactivities.Non‐OWLactivitieswereconsideredinstructionaltimeandweregenerallyseasonal,orwereactivitiesthattheteachershadutilizedpriortousingOWL.Figure5showstheaveragelevelofclassroominvolvementfortheSpring2009‐2010observationacrossthevariousclassroomactivities,andtheaveragelevelofteacherinstructionduringthoseactivities.Bothclassroominvolvementandteacherinstructionallevelareratedona5‐pointscale,withhigherscoresindicatingmoreinvolvementorinstruction.Theanchorsforthe5‐pointscalesareshownbelowthefigure.
ClassroomInvolvement0=Low
Noinvolvementortotaldisorder. Routines,outofroom,and
transitionswithoutinstructionalcontentareautomaticallyscoredlow.
1=Mediumlow Childrenshowlackofinterestand
littleengagement,lookdistractedorbored.
2=Medium Averageinvolvement,childrenare
listeningorparticipating,interestcanwane,butcomesbacktotask
3=Mediumhigh Consistentengagementandinterest,
eagerexpressions.4=High
Intenseconcentration,consistentactiveengagementandinterestfromalloralmostallchildren.
TeacherInstructionalLevel0=Non‐AcademicInstruction
Non‐academicvideos,transitions,behaviorcorrection;noinstructionoccuring.
Meals,recess,nap,&transitionsw/oinstructionalcontentareautomaticallyscored0.
1=Low: Monitorsactivitieswithoutengagingchildren;no
specificlearning/academicskillbeingtaught;asksrhetoricalquestionswithoutwaitingfortheanswer.
2=Basic Instructionisfocusedonbasicacademiccontentor
skills.Readsw/oaskingquestionsoraskingquestionswithpre‐setanswers.
3=SomeInference Instructioninbasicskillswithsomeinference.Asks
someopen‐ended&someclose‐endedquestions.4=HighInference
Instructionw/sustainedlevelofreflection.Teacherhelpschildrenmakeconnectionsb/wconcepts;fourormoreopen‐endedquestions.
.00
.50
1.00
1.50
2.00
2.50
3.00
3.50
WholeGroup Centers SmallGroups Seatwork OWLTransitions
Figure5.AverageClassroomInvolvementandTeacherInstructionLevelbyActivityType:Spring2009‐2010
ClassroomInvolvementTeacherInstructionLevel
Page 8
ERFEvaluationReport2010 Page8of23
Ingeneral,childrenweremoderatelyengagedthroughouttheschoolday,andweremostengagedduringinstructionalsegmentssuchasWholeGroup,Centers,andSmallGroups.Theywereleastengagedduringseatworkandtransitions,aswouldbeexpected.ThehighestclassroominvolvementwasnotedduringCenterstime,whenchildrenareallowedtochooseactivitiesmoreindependently.Teacherinstructionallevelsweremodestoverall,buthighestwherewewouldexpectthemostintenseinstructiontooccur,duringsmallgroupactivities.Summary/Conclusions:NarrativeRecordThefollowingstrengthswerenoted:
WholeGroupinstructionisasignificantcomponentoftheOWLcurriculumandteachershaveincreasedthetimespentinwholegroupactivitiesoverthetwoprojectyears.
Transitiontimesweresignificantlyreducedoverthethreeobservations.Teachersspentabout80minutesperdayintransitioninYear1.InYear2,averagetransitiontimewas68minutesperdayintheFalland50minutesperdayintheSpring.
CentersTimeandSmallGroupsreceivedrecommendedamountsoftimeontheobservationdays.
ClassroomInvolvementwashighestduringCentersTimeandTeacherInstructionalLevelswerehighestduringSmallGrouptime.
Thefollowingareaswerenotedasareasforimprovement:
AlthoughTeacherInstructionalLevelswereadequate,therearemanyopportunitiesforteacherstoincorporatehigherlevelsofinstructionintotheiractivities,byaskingmoreopen‐endedandinferentialquestions.Higherlevelsofinstructionwouldbeexpectedtoincreasestudentengagementandstudentlearning.
EarlyLanguageandLiteracyClassroomObservation
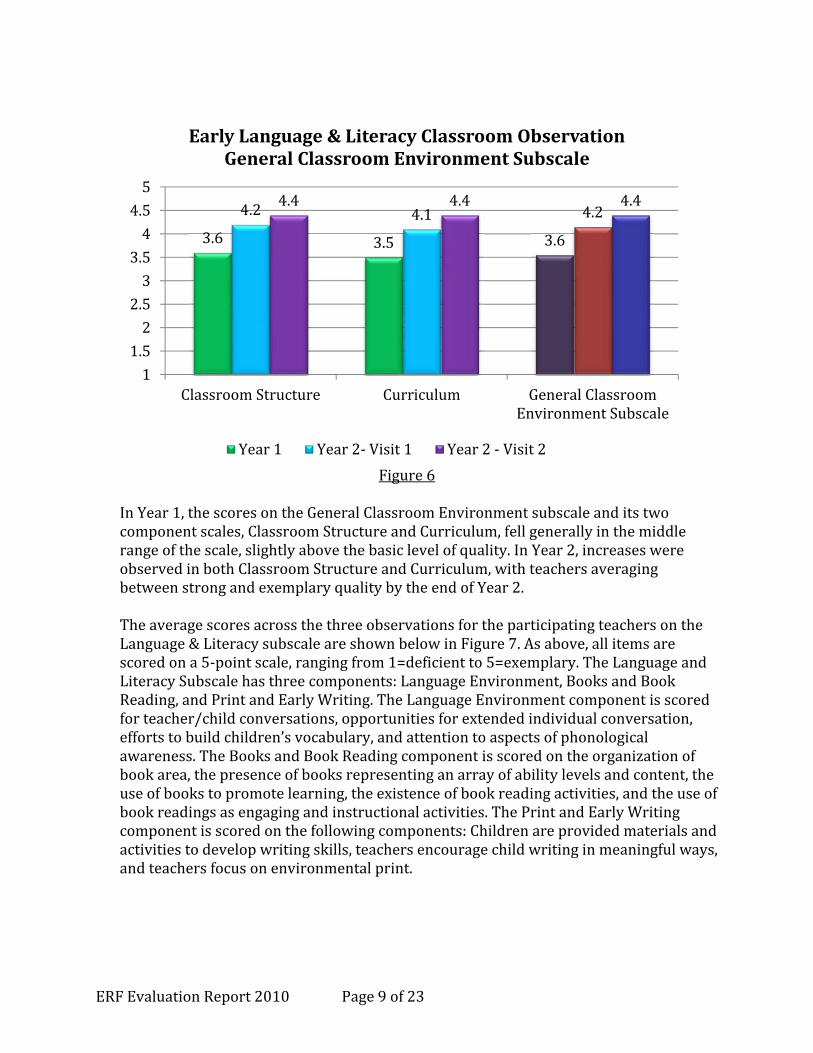
InadditiontotheELLCOPreKTOOLthatwasrequiredforERFevaluations,weelectedtocontinuetousetheLiteracyEnvironmentChecklist(LEC)portionfromthepreviousversionoftheELLCOaswell.BecausetheLiteracyEnvironmentChecklisthasbeenusedinERFprogramsinthepast,wedecidedtocontinuetousetheinstrumenttoretainsomecomparabilitywithotherprojects.Wepresentresultsforbothobservationsinthissection.Theaveragescoresoverthethreeobservationsfortheteachers(outof5totalpoints)ontheELLCOPreKToolGeneralClassroomEnvironmentScaleareshowninFigure6.Eachitemisscoredona5‐pointscale,rangingfromdeficient(1)toexemplary(5).Themiddleofthescaleisconsideredbasic(3).TheGeneralClassroomEnvironmentScaleiscomprisedoftwocomponents,ClassroomStructureandCurriculum.ClassroomStructurereferstothephysicalorganizationofclassroom,qualityanddisplayoflearningmaterialsintheroom,existenceandenforcementofmanagementstrategies,andappropriatenessofstaff/childratioandstaff/childinteractions.TheCurriculumcomponentfocusesonevidenceofacohesivecurriculum,opportunitiesforchildchoiceandinitiative,andrecognitionofandattentiontodiversity.
Page 9
ERFEvaluationReport2010 Page9of23
Figure6
InYear1,thescoresontheGeneralClassroomEnvironmentsubscaleanditstwocomponentscales,ClassroomStructureandCurriculum,fellgenerallyinthemiddlerangeofthescale,slightlyabovethebasiclevelofquality.InYear2,increaseswereobservedinbothClassroomStructureandCurriculum,withteachersaveragingbetweenstrongandexemplaryqualitybytheendofYear2. TheaveragescoresacrossthethreeobservationsfortheparticipatingteachersontheLanguage&LiteracysubscaleareshownbelowinFigure7.Asabove,allitemsarescoredona5‐pointscale,rangingfrom1=deficientto5=exemplary.TheLanguageandLiteracySubscalehasthreecomponents:LanguageEnvironment,BooksandBookReading,andPrintandEarlyWriting.TheLanguageEnvironmentcomponentisscoredforteacher/childconversations,opportunitiesforextendedindividualconversation,effortstobuildchildren’svocabulary,andattentiontoaspectsofphonologicalawareness.TheBooksandBookReadingcomponentisscoredontheorganizationofbookarea,thepresenceofbooksrepresentinganarrayofabilitylevelsandcontent,theuseofbookstopromotelearning,theexistenceofbookreadingactivities,andtheuseofbookreadingsasengagingandinstructionalactivities.ThePrintandEarlyWritingcomponentisscoredonthefollowingcomponents:Childrenareprovidedmaterialsandactivitiestodevelopwritingskills,teachersencouragechildwritinginmeaningfulways,andteachersfocusonenvironmentalprint.
3.6 3.5 3.6
4.2 4.1 4.24.4 4.4 4.4
1
1.5
2
2.5
3
3.5
4
4.5
5
ClassroomStructure Curriculum GeneralClassroomEnvironmentSubscale
EarlyLanguage&LiteracyClassroomObservationGeneralClassroomEnvironmentSubscale
Year1 Year2‐Visit1 Year2‐Visit2
Page 10
ERFEvaluationReport2010 Page10of23
Figure7
InYear1,thescoresontheLanguageandLiteracysubscale,anditscomponentparts,weresimilartothosefortheGeneralClassroomEnvironmentsubscaleandfellslightlyabovethebasiclevelofimplementation.InYear2,increaseswereobservedinallthreeareas,withthelargestgainsevidentintheLanguageEnvironmentarea.BytheendofYear2,teacherswereatthebasiclevelwithregardtoBooksandBookReadingandPrintandEarlyWriting,butexhibitedstrongqualitywithregardtotheLanguageEnvironment.ELLCO:LiteracyEnvironmentChecklistTheLiteracyEnvironmentChecklistcontainsfivecomponents: BookArea:bookareaisdistinct,orderly,andincludessoftmaterials. BookSelection:Booksrepresentarangeofdifficultylevels. BookUse:Booksarepresentinthescience,dramaticplay,blocks,andbookcenters,
andbookrecordingsareused. WritingMaterials:Alphabetisvisible,wordcardsusedtosupportnamewriting,
writingtemplatesandtoolsareavailable(includingvarietyofpaperandwritingutensils),adistinctwritingareaexistsandisavailableduringcentertime.
WritingAroundtheRoom:Evidenceofteacherdictation,bigbookuse,full‐groupliteracyactivities,writingdisplays,writingtoolsindramaticplay(asbothtoolsandprops),alphabetpuzzlesandwordpuzzlesarepresent.
TheresultsfortheLiteracyEnvironmentChecklistareshowninFigure8.Becausethesubscalesareeachscaleddifferently,theresultsarepresentedinpercentageform.The
3.6
3.1
2.6
3.1
4.1
3.6
2.9
3.5
4.3
3.53.2
3.7
1
1.5
2
2.5
3
3.5
4
4.5
5
LanguageEnvironment
Books&BookReading
Print&EarlyWriting
Language&LiteracySubscale
EarlyLanguage&LiteracyClassroomObservationLanguage&LiteracySubscale
Year1 Year2‐Visit1 Year2‐Visit2
Page 11
ERFEvaluationReport2010 Page11of23
figureshowsthepercentofpossiblepointsachievedoneachsubscale,averagedacrosstheteachers.Overall,teachersexhibitedgainsfromYear1toYear2ineverycomponentoftheLiteracyEnvironment.TheyachievedhighscoresontheBookArea,BookSelection,andWritingMaterialssubscales,buthaveroomforimprovementintheotherareas,especiallyintermsofBookUseandWritingAroundtheRoom.
Figure8
Summary/Conclusions:EarlyLanguageandLiteracyClassroomObservationThefollowingstrengthswerenoted:
TeachersmadenoteworthygainsonallaspectsoftheELLCOandLiteracyEnvironmentChecklist.
Teachers’classroomsweregenerallyhighestintermsmaterials;i.e.,teachershavecreatedclassroomsthathavethenecessaryhighqualityrawmaterials.
Overallcomponents,noteacherhadapoorclassroomenvironmentonanyscale.Thefollowingareaswerenotedasareasforimprovement:
TeachershavethemostroomforimprovementontheBookUseandWritingAroundtheRoomsubscalesoftheLECandtheBooksandBookReadingandPrintandEarlyWritingsubscalesoftheELLCO.
Classroomsarewellstructuredandhavealltherightrawmaterials,butteacherscancontinuetofindwaystoapplythoserawmaterialstohelpingchildrenlearn.
80
91
49
73
35
97
73
97
62
80
94
70
0
10
20
30
40
50
60
70
80
90
100
BookArea BookSelection
BookUse WritingMaterials
WritingAroundtheRoom
PercentofTotalPossiblePoints
LiteracyEnvironmentChecklistPercentofTotalPossiblePoints
Year1
Year2‐Visit1
Year2‐Visit2
Page 12
ERFEvaluationReport2010 Page12of23
EvaluationofChildOutcomesWenowturntoanexaminationofthechildachievementoutcomesfortheELLSproject.Table2belowshowsthenumberofparticipatingchildrenineachofthetwoprojectyears.InYear2,therewere219childrenwithcompleteassessmentdatainthethirteenpreschoolclassrooms.Atthepretest,wetested249children.AttheposttestintheSpringof2010,229childrenweretested.WeexcludedthechildrenfromoutcomeanalyseswhostartedschoolaftertheendofOctober,2009becausetheydidnotreceiveatleast6monthsoftheprogram.Wealsoexcludedthechildrenwhowithdrewfromtheprogrambeforecompletingaposttest.
Table2.Numberofschools,classroomsandchildrenintheELLSProject
2008‐2009 2009‐2010
Numberofpreschoolclassrooms 10 13
Numberofschools 5 7
Numberofchildrenassessedatpretest 187 249
Numberofchildrenassessedatposttest 181 229
Numberofchildrenwithbothassessments 179 219
InstrumentationSeveralstandardizedtestswereusedtoassessthelanguageandliteracyskillsofthechildren.ReceptivevocabularywasassessedusingthePeabodyPictureVocabularyTestIV.Inaddition,foursubtestsoftheWoodcock‐JohnsonAchievementBatterywereused:(1)Letter‐Word,whichassessesletterandwordrecognition;(2)PictureVocabulary,ameasureofexpressivevocabulary;(3)OralComprehension,whichmeasureschildren’sabilitytounderstandorallanguage;and(4)Spelling,ameasureofearlywriting,inwhichchildrencopysimpleshapesandletters,andwriteselectedlettersandwords.ThePhonologicalAwarenessLiteracyScreening(PALS)instrumentwasalsogiventoassessupperandlowercaseletterrecognition,beginningsoundawareness,rhymeawareness,andconceptsofprint.Finally,theWriteStart!Assessmentwasalsogiven;thisisameasureofearlywritingdevelopedbyDeborahRoweandCarinNeitzel,twooftheinvestigatorsontheELLSproject.Finally,fortheSpanishspeakingchildren,wecollectedtheExpressiveOneWordPictureVocabularyTestinSpanish.ThisisatestofSpanishexpressivevocabularyandwasintendedtoexaminewhetherchildren’sSpanishproficiencydecreasedastheylearnedEnglish.Inthefirstprojectyear,thepretestassessmentsonthechildrenwerecollectedassoonaspossibleafteragreementsweremadewiththelocalschooldistrict,beginninginNovember,2008.Allpretestswerecompletedbymid‐December,2008.Posttestsweregiveninthespring,betweenMarch30,2009andMay5,2009.Inthesecondprojectyear,wewereable
Page 13
ERFEvaluationReport2010 Page13of23
tobeginpretestassessmentsearlierintheFall.Allbut10childrenweretestedbetweenSeptember2andOctober28,2009.Theadditional10childrenwerelateenrolleesandweretestedassoonastheyenteredpreschool.TheSpringposttestsfortheYear2childrenwerecollectedbetweenMarch23andMay15,2010.DemographicinformationforallchildrenfrombothprojectyearsissummarizedinTable3.InYear2,thesamplewasaboutfouryears,3monthsofageatthepretest,andwasnearlyequallyproportionedwithboysandgirls.ThelargestethnicgroupwasAfricanAmerican,comprisingabout45%ofthesample.About35%ofthestudentswereHispanic.Asmallgroupofchildrenwerefromrecentimmigrantfamilies,frompartsoftheMiddleEastandAfrica.About45%ofthestudentswereEnglish‐languagelearners.
Table3.Demographics
Variable 2008‐2009 2009‐2010
n % n %
Male 85 47% 127 51%
Female 96 53% 122 49%
ELL 43 24% 111 45%
NotELL 138 76% 138 55%
Black/AfricanAmerican 119 66% 119 48%
Hispanic/Latino 27 15% 87 35%
Caucasian 13 7% 17 7%
Arabic 10 6% 19 8%
African 9 5% 3 1%
Asian/AsianAmerican 3 2% 1 .004%
Other ‐ ‐ 3 1%
Ageatpretest 4.7years 56m 4.4years 53m
Ageatposttest 5.3years 63m 5.0years 60m
Page 14
ERFEvaluationReport2010 Page14of23
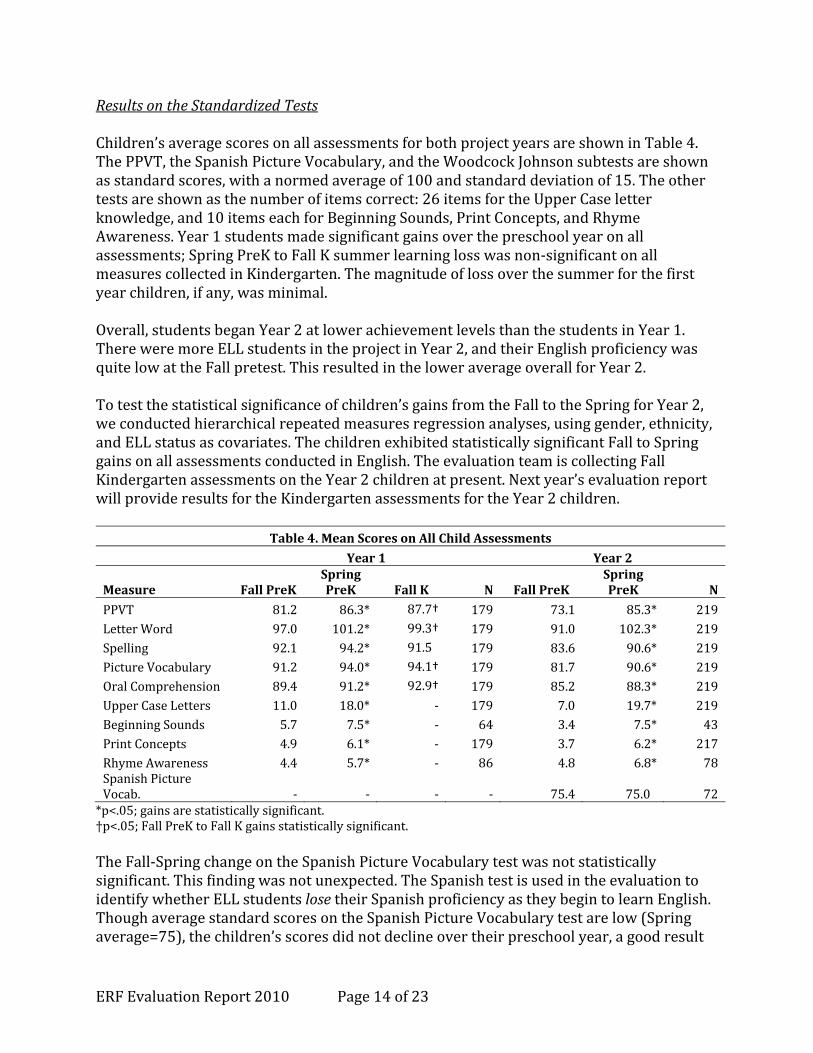
ResultsontheStandardizedTestsChildren’saveragescoresonallassessmentsforbothprojectyearsareshowninTable4.ThePPVT,theSpanishPictureVocabulary,andtheWoodcockJohnsonsubtestsareshownasstandardscores,withanormedaverageof100andstandarddeviationof15.Theothertestsareshownasthenumberofitemscorrect:26itemsfortheUpperCaseletterknowledge,and10itemseachforBeginningSounds,PrintConcepts,andRhymeAwareness.Year1studentsmadesignificantgainsoverthepreschoolyearonallassessments;SpringPreKtoFallKsummerlearninglosswasnon‐significantonallmeasurescollectedinKindergarten.Themagnitudeoflossoverthesummerforthefirstyearchildren,ifany,wasminimal.Overall,studentsbeganYear2atlowerachievementlevelsthanthestudentsinYear1.ThereweremoreELLstudentsintheprojectinYear2,andtheirEnglishproficiencywasquitelowattheFallpretest.ThisresultedintheloweraverageoverallforYear2.Totestthestatisticalsignificanceofchildren’sgainsfromtheFalltotheSpringforYear2,weconductedhierarchicalrepeatedmeasuresregressionanalyses,usinggender,ethnicity,andELLstatusascovariates.ThechildrenexhibitedstatisticallysignificantFalltoSpringgainsonallassessmentsconductedinEnglish.TheevaluationteamiscollectingFallKindergartenassessmentsontheYear2childrenatpresent.Nextyear’sevaluationreportwillprovideresultsfortheKindergartenassessmentsfortheYear2children.
Table4.MeanScoresonAllChildAssessments
Year1 Year2
Measure FallPreKSpringPreK FallK N FallPreK
SpringPreK N
PPVT 81.2 86.3* 87.7† 179 73.1 85.3* 219LetterWord 97.0 101.2* 99.3† 179 91.0 102.3* 219Spelling 92.1 94.2* 91.5† 179 83.6 90.6* 219PictureVocabulary 91.2 94.0* 94.1† 179 81.7 90.6* 219OralComprehension 89.4 91.2* 92.9† 179 85.2 88.3* 219UpperCaseLetters 11.0 18.0* ‐ 179 7.0 19.7* 219BeginningSounds 5.7 7.5* ‐ 64 3.4 7.5* 43PrintConcepts 4.9 6.1* ‐ 179 3.7 6.2* 217RhymeAwareness 4.4 5.7* ‐ 86 4.8 6.8* 78SpanishPictureVocab. ‐ ‐ ‐ ‐ 75.4 75.0x 72*p<.05;gainsarestatisticallysignificant.†p<.05;FallPreKtoFallKgainsstatisticallysigni icant. TheFall‐SpringchangeontheSpanishPictureVocabularytestwasnotstatisticallysignificant.Thisfindingwasnotunexpected.TheSpanishtestisusedintheevaluationtoidentifywhetherELLstudentslosetheirSpanishproficiencyastheybegintolearnEnglish.ThoughaveragestandardscoresontheSpanishPictureVocabularytestarelow(Springaverage=75),thechildren’sscoresdidnotdeclineovertheirpreschoolyear,agoodresult
Page 15
ERFEvaluationReport2010 Page15of23
giventhattheyarenotgivenanyinstructioninSpanishinpreschoolandarefocusedonacquiringEnglish. TherelationshipofethnicityandELLstatustochildren’slanguageandliteracygainswascomplex.Overall,onallassessments,minoritychildrenandEnglish‐languagelearningchildrenachievedlowerscoresthantheirCaucasianorEnglish‐speakingpeers.However,ifweexaminechildren’sgainsbyethnicity,weseethattheminoritystudentsmadesubstantialgainsoverthepreschoolyear.Figure9belowshowsthatwhiletheHispanicandotherminoritystudents(primarilynewimmigrantgroupsfromtheMiddleEastandAfrica)begantheyearperformingconsiderablylowerthantheAfricanAmericanandCaucasianstudentsonthePPVT,theymadelargegainsinreceptivevocabularyovertheschoolyear.TheAfricanAmericanstudentsalsomadegainsonthePPVTovertheyear,whilethefewCaucasianstudentsstayedaboutthesame.Figure10showsthegainsbyethnicgroupontheWoodcock‐JohnsonLetter‐Wordtest.Onthistest,theHispanicandotherminoritygroupswereaboutequivalenttotheCaucasianandAfricanAmericanstudentsbytheendofpreschool,puttingthemonparwiththeirpeerswhentheybeganKindergarten.
Figure9
40
50
60
70
80
90
100
110
Pretest Posttest
PPVTStandardScore
PPVTGainsbyEthnicity
AfricanAmerican(n=103)
Hispanic(n=77)
OtherMinority(n=24)
Caucasian(n=15)
Page 16
ERFEvaluationReport2010 Page16of23
Figure10
Inaddition,thegainsachievedbyEnglish‐languagelearnersweregenerallygreaterthanthegainsachievedbythenativeEnglish‐speakingstudents,thoughalmostallstudentsgainedovertheyear.ThisisillustratedgraphicallyinFigure11forthePPVTandFigure12fortheWoodcock‐JohnsonLetter‐Wordtest.GainsachievedbytheELLstudentsonthePPVTweresubstantial,yettheystillfinishedpreschoolbehindtheirnativespeakingpeers.However,ontheLetter‐Wordtest,theELLstudentsfinishedpreschoolachievingatthesamelevelasthenativeEnglishspeakers.
Figure11
75
80
85
90
95
100
105
110
115
Pretest Posttest
Letter‐WordStandardScore
Letter‐WordGainsbyEthnicity
AfricanAmerican(n=103)
Hispanic(n=77)
OtherMinority(n=24)
Caucasian(n=15)
40
50
60
70
80
90
100
110
Pretest Posttest
PPVTStandardScore
PPVTGainsbyELLStatus
ELL
non‐ELL
Page 17
ERFEvaluationReport2010 Page17of23
Figure12
EnhancedLanguageandLiteracySuccessBenchmarksTheprojectteamandtheevaluatorsetbenchmarkgoalsforeachassessmentforeachprojectyear.TheseareshowninTable5.Eachtesthasatargetscore,whichisshowninthesecondcolumn.Theprojectgoalsareshownastargetpercentagesofchildren.Thatis,foreachassessment,theprojectgoalindicatesthepercentageofchildrenexpectedtomeetthetargetscore.ThetargetscoresaresetrelativelylowforthissampleandthepercentagesaresetlowerfortheELLstudents.Thus,achievingabenchmarkgoaldoesnotnecessarilyindicatethatchildrenareperformingatlevelsachievedbyU.S.childrenonaverage.ThetargetscoresforthePPVTandthePALSuppercaselettersaresetbytheDepartmentofEducationandaresimilarlysetwellbelowthenationalaverage.
Table5.BenchmarksforEnhancedLanguageandLiteracySuccess
TargetScore Y1Goal
Y2Goal
Y3Goal
Y1ELLGoal
Y2ELLGoal
Y3ELLGoal
PPVT 85 80% 90% 95% 60% 75% 85%
WJPictureVocabulary 85 80% 90% 95% 60% 75% 85%
WJLetter‐Word 85 85% 90% 95% 75% 85% 90%
PALSUpperCaseLetters 19of26 85% 90% 95% 75% 85% 90%
WJOralComprehension 85 75% 85% 90% 60% 75% 85%
PALSBeginningSounds 1.5of10 80% 90% 95% 75% 85% 90%
PALSRhymeAwareness 2.2of10 80% 90% 95% 75% 85% 90%
PALSPrintAwareness 2.6of10 80% 90% 95% 75% 85% 90%
WJSpelling 85 75% 85% 90% 60% 75% 85%
75
80
85
90
95
100
105
110
115
Pretest Posttest
Letter‐WordStandardScore
Letter‐WordGainsbyELLStatus
ELL
non‐ELL
Page 18
ERFEvaluationReport2010 Page18of23
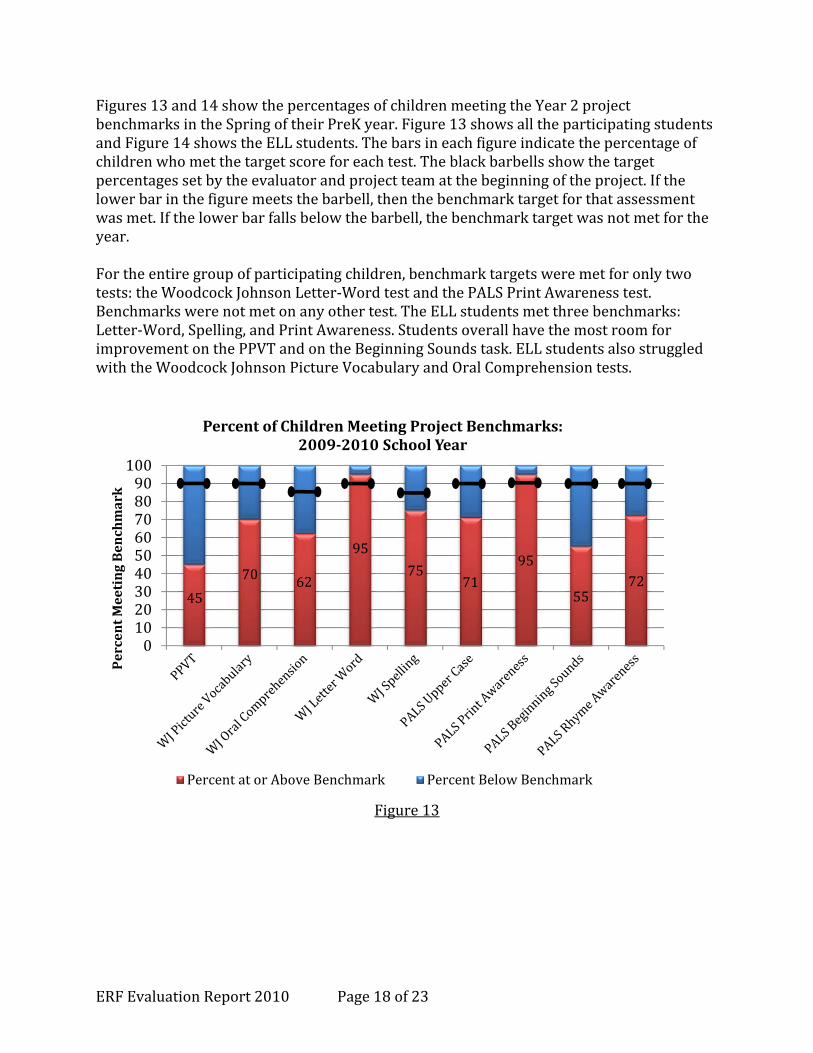
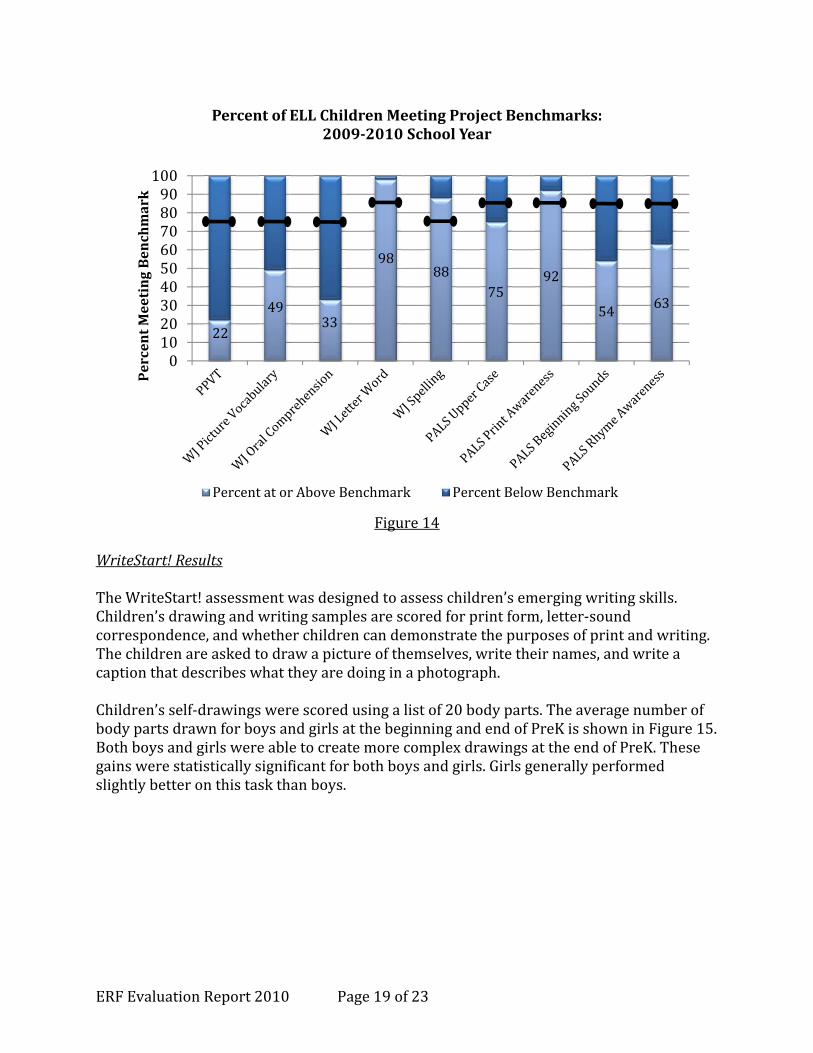
Figures13and14showthepercentagesofchildrenmeetingtheYear2projectbenchmarksintheSpringoftheirPreKyear.Figure13showsalltheparticipatingstudentsandFigure14showstheELLstudents.Thebarsineachfigureindicatethepercentageofchildrenwhometthetargetscoreforeachtest.Theblackbarbellsshowthetargetpercentagessetbytheevaluatorandprojectteamatthebeginningoftheproject.Ifthelowerbarinthefiguremeetsthebarbell,thenthebenchmarktargetforthatassessmentwasmet.Ifthelowerbarfallsbelowthebarbell,thebenchmarktargetwasnotmetfortheyear.Fortheentiregroupofparticipatingchildren,benchmarktargetsweremetforonlytwotests:theWoodcockJohnsonLetter‐WordtestandthePALSPrintAwarenesstest.Benchmarkswerenotmetonanyothertest.TheELLstudentsmetthreebenchmarks:Letter‐Word,Spelling,andPrintAwareness.StudentsoverallhavethemostroomforimprovementonthePPVTandontheBeginningSoundstask.ELLstudentsalsostruggledwiththeWoodcockJohnsonPictureVocabularyandOralComprehensiontests.
Figure13
45
70 62
95
7571
95
5572
0102030405060708090100
PercentM
eetingBenchmark
PercentofChildrenMeetingProjectBenchmarks:2009‐2010SchoolYear
PercentatorAboveBenchmark PercentBelowBenchmark
Page 19
ERFEvaluationReport2010 Page19of23
Figure14
WriteStart!ResultsTheWriteStart!assessmentwasdesignedtoassesschildren’semergingwritingskills.Children’sdrawingandwritingsamplesarescoredforprintform,letter‐soundcorrespondence,andwhetherchildrencandemonstratethepurposesofprintandwriting.Thechildrenareaskedtodrawapictureofthemselves,writetheirnames,andwriteacaptionthatdescribeswhattheyaredoinginaphotograph.Children’sself‐drawingswerescoredusingalistof20bodyparts.TheaveragenumberofbodypartsdrawnforboysandgirlsatthebeginningandendofPreKisshowninFigure15.BothboysandgirlswereabletocreatemorecomplexdrawingsattheendofPreK.Thesegainswerestatisticallysignificantforbothboysandgirls.Girlsgenerallyperformedslightlybetteronthistaskthanboys.
22
4933
9888
7592
54 63
0102030405060708090100
PercentMeetingBenchmark
PercentofELLChildrenMeetingProjectBenchmarks:2009‐2010SchoolYear
PercentatorAboveBenchmark PercentBelowBenchmark
Page 20
ERFEvaluationReport2010 Page20of23
Figure15
ChildrenwerealsoaskedtowritetheirnamesaspartoftheWriteStart!task.Thewrittenproductswerescoredforavarietyofcomponents.Below,wepresenttheresultsfornamewritingcompleteness,whichwasscoredintermsofthenumberoffirstnamelettersthatthechildrenwereabletoproduce.Figures16aand16bshowtheproportionsofchildrenateachlevelofnamewritingcompletenessforthefallandspringassessments.Inthefallofpreschool,about24%ofthechildrenwereabletoproduceallofthelettersintheirfirstname.But,30%ofthechildrenwereunabletoproduceanylettersatall.Bytheendofpreschool,only1%ofthechildrenproducednoletters,and79%ofthechildrencouldproducealloftheirnameletters,asubstantialimprovement.
56
910
02468101214161820
Boys Girls
NumberofBodyPartsDrawn
FallandSpringSelf‐DrawingResults
Fall Spring
Page 21
ERFEvaluationReport2010 Page21of23
Figure16a
Figure16b
NoLettersPresent30%
HalforFewerLettersPresent
34%
MorethanHalfLettersPresent
12%
AllLettersPresent24%
NameWritingCompletenessPretest
NoLettersPresent1%
HalforFewerLettersPresent7%
MorethanHalfLettersPresent13%
AllLettersPresent79%
NameWritingCompletenessPosttest
Page 22
ERFEvaluationReport2010 Page22of23
Inadditiontothenamewritingtask,thechildrenalsowrotecaptionsdescribingwhattheyweredoinginaphotographthatwastakenduringtheschoolday.Thesecaptionswerescoredonavarietyofelements.Onescoringareafocusedonprintform(i.e.,thevisualcharacteristicsoftheirmarks).Figure17illustratesthechangesoverthepreschoolyearforprintform.Somechildrenwereunabletomakeanylettersorletter‐likeformsandgenerallyscribbledormadedrawings.Otherswereabletocreateinventedletters.Themostadvancedchildrenproducedatleastsomeconventionallettersand,inafewcases,letter‐soundcorrespondence.Thefirsttwogroupsofbarshavefewerchildrenattheposttestthanatthepretest,whilethelasttwosetsofbarshasmorechildrenattheposttestthanatthepretest.Thisindicatesthatchildren’swrittenmessageswereincreasinginsophisticationoverthepreschoolyear.Theincreasefrom5%ofchildrenabletocreatesomeletter‐soundcorrespondenceto22%ofchildrenwithletter‐soundcorrespondenceattheposttestisnoteworthy.
Figure17
19
33
43
5
18
8
52
22
Drawings&Scribbles Inventedletters&letter‐likeforms
Atleastsomeconventionalletters
Letter‐SoundCorrespondence
0
10
20
30
40
50
60
70
80
90
100
PercentofChildren
PhotoLabelingForm
Pretest Posttest
Page 23
ERFEvaluationReport2010 Page23of23
ConclusionsOverall,thesecondyearoftheEnhancedLanguageandLiteracySuccessprojectmettheexpectationsoftheprojectteam,especiallywithregardtoincreasedperformancebytheteachers.Allteacherswereimplementingmostaspectsofthecurriculum,andclassroomenvironmentsweregenerallyexemplary.Overthetwoprojectyears,theteachershavemadesubstantialchangesintheirclassroomsandtheirteachingpractices.Implementationfidelityimprovedfromthefirstprojectyearinallareasofthecurriculum.TheNarrativeRecordresultsshowedthatteachershaveconsiderablyreducedtransitiontimesthroughouttheday,oneareathatwasnotedforimprovementlastyear.Theteachershavebeenremarkablyresponsivetothedata‐drivenfeedbackgeneratedbytheevaluation.Areasnotedforimprovementforyear3involveutilizingthehighqualityclassroommaterialstofurtherincreaselearningopportunitiesforthestudents.Thestudentparticipantsmadelargeandstatisticallysignificantgainsoverthepreschoolyearonallassessments,thoughprojectbenchmarkswereonlyachievedontheLetter‐WordandPrintAwarenesstests.ChildrengenerallyperformedbetterontheassessmentsofbasicliteracyskillssuchastheLetter‐WordandSpellingtestsoftheWoodcockJohnsonthantheydidonthemoreadvancedlanguagemeasureslikethevocabularyandoralcomprehensiontests.ThechildrenreceivedthelowestscoresoverallonthePPVT,andtheWoodcockJohnsonPictureVocabularyandOralComprehensiontests.ChildrenalsohaddifficultywiththetwophonologicalawarenesstasksonthePALSassessment,theRhymeAwarenessandBeginningSoundstasks.Morethanhalfofthestudentswerenotabletoprogresspastthepracticeitemsonthistaskandthuscouldnotbescored.Nevertheless,thestudentsmadesubstantialprogressovertheirpreschoolyearinallaspectsoflanguageandliteracy.TheELLstudentsachievedlargegainsoverthepreschoolyearonallassessments.Onthebasicskillstests,suchasLetter‐WordandSpelling,theyfinishedpreschoolataboutthesamelevelastheirnativeEnglishspeakingpeers.Astheteachersbecomemoreaccomplishedwiththecurriculum,theevaluationteamwillexaminewhetherthistranslatesintogreatergainsforthechildren.Currently,pretestassessmentsarebeingconductedwiththethirdcohortofstudentsandteacherobservationsareunderway.


![for Vision-Language Tasks arXiv:2004.06165v3 [cs.CV] 17 ... · Oscar: Object-Semantics Aligned Pre-training for Vision-Language Tasks Xiujun Li~ , Xi Yin~, Chunyuan Li~, Pengchuan](https://static.documents.pub/doc/80x56/5f3ffbc2ea749859760646fa/for-vision-language-tasks-arxiv200406165v3-cscv-17-oscar-object-semantics.jpg)


