Early Reading Intervention: A Preliminary Analysis of a State Initiative’s Impact on Special Education Outcomes Jose’ Castillo George Batsche Larry Porter J.C. Smith School Psychology Program University of South Florida NASP Annual Convention March, 2006
Transcript
Early Reading Intervention: A Preliminary Analysis of a State Initiative’s Impact on Special Education OutcomesJose’ CastilloGeorge BatscheLarry PorterJ.C. SmithSchool Psychology ProgramUniversity of South Florida
NASP Annual ConventionMarch, 2006
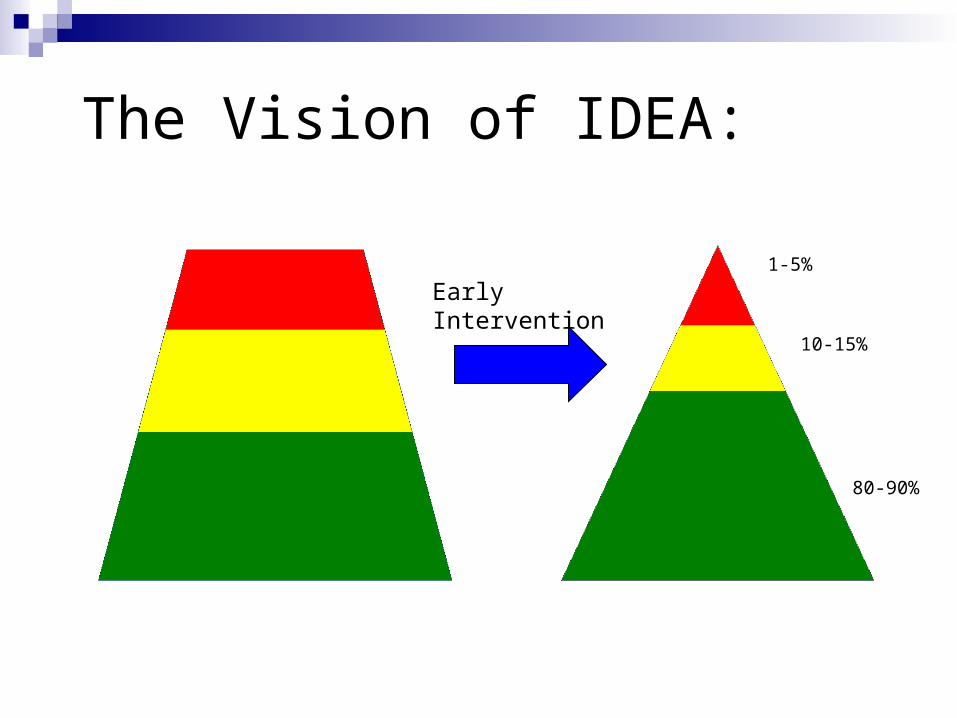
Current Special Education Practices The Vision of IDEA was to provide effective
services to students with disabilities
Unfortunately, special education too often becomes an endpoint rather than a means for providing effective services (PCESE, 2002)
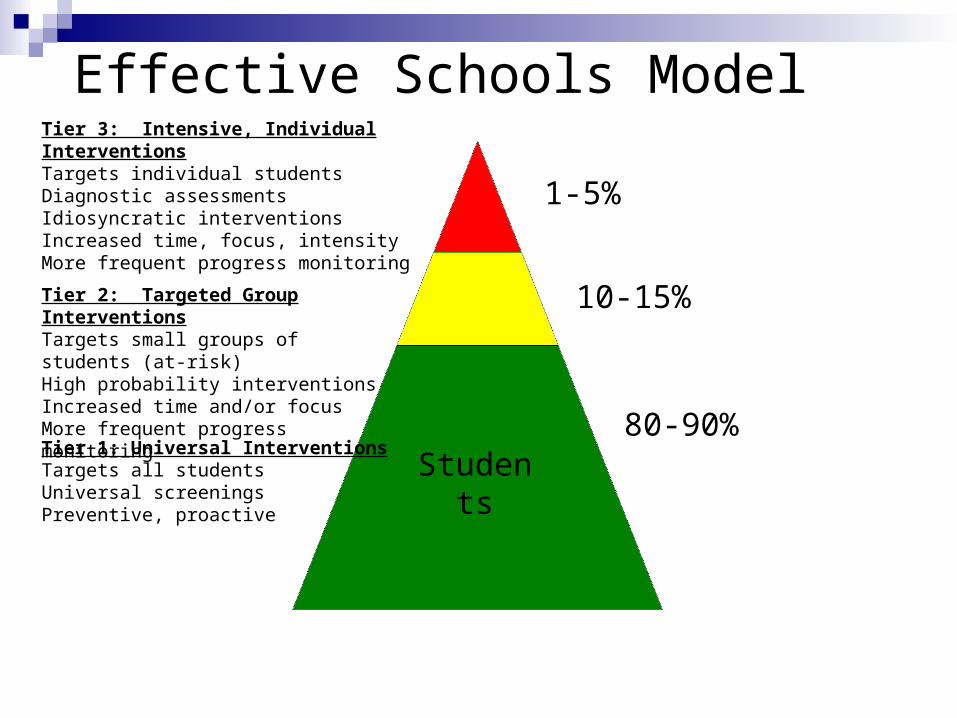
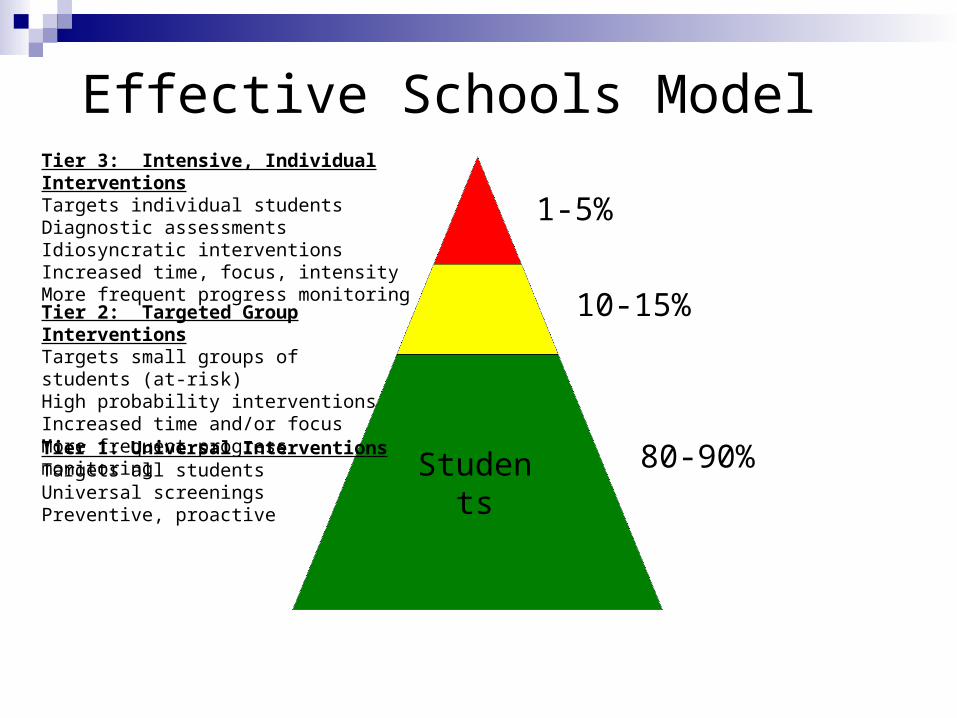
Tier 2: Targeted Group InterventionsTargets small groups of students (at-risk)High probability interventionsIncreased time and/or focusMore frequent progress monitoring
Tier 1: Universal InterventionsTargets all studentsUniversal screeningsPreventive, proactive
Students
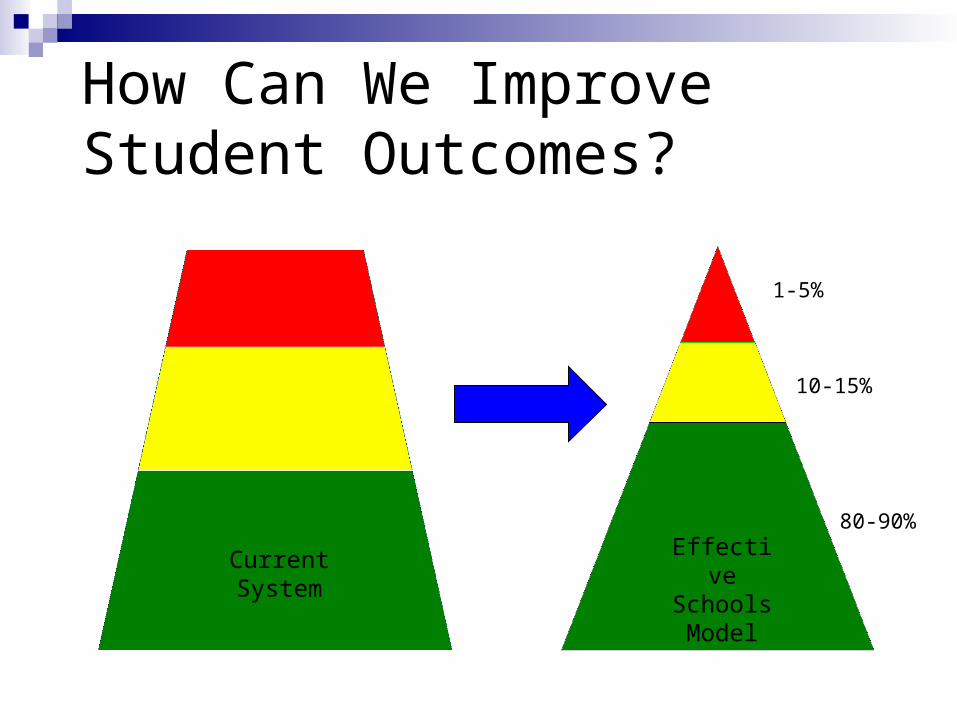
How Can We Improve Student Outcomes?
1-5%
10-15%
80-90%
Current System
Effective Schools Model
It’s All About Reading
Reading and Learning Disabilities: 52% of IDEA $$ go to LD Programs 70% +/- of special education “activities” (e.g.,
evaluations, staffings, IEPs) related to LD cases 85% of students identified as LD referred for reading
difficulties 44% of IDEA $$ allocated for students with reading
difficulties 61.2% of children with ED score in the bottom
quartile in reading
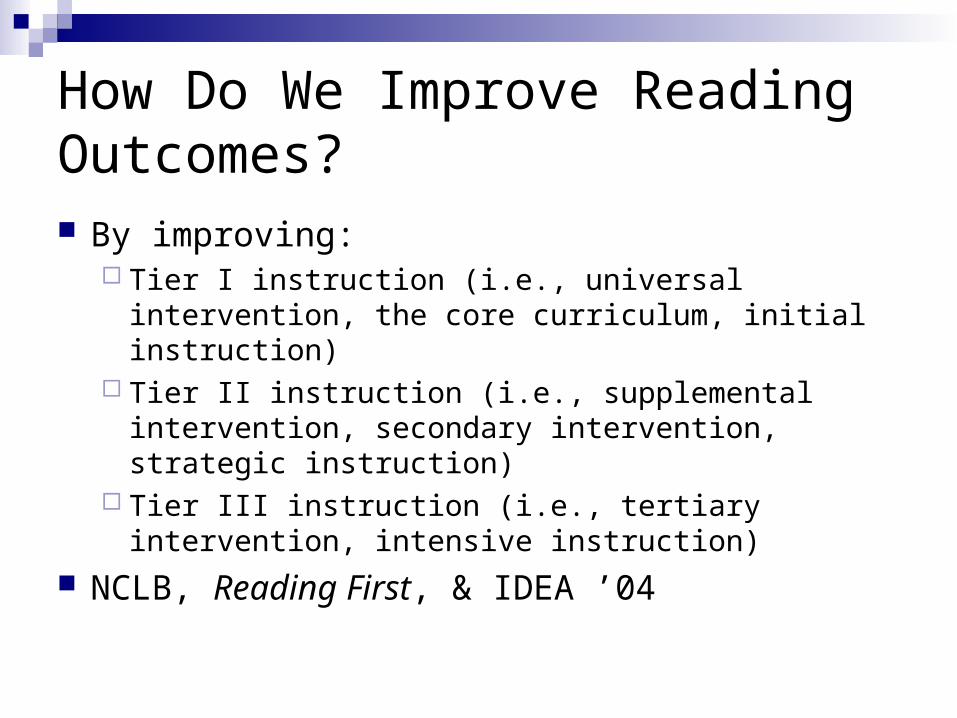
How Do We Improve Reading Outcomes? By improving:
Tier I instruction (i.e., universal intervention, the core curriculum, initial instruction)
Tier II instruction (i.e., supplemental intervention, secondary intervention, strategic instruction)
Tier III instruction (i.e., tertiary intervention, intensive instruction)
Tier 2: Targeted Group InterventionsTargets small groups of students (at-risk)High probability interventionsIncreased time and/or focusMore frequent progress monitoring
Tier 1: Universal InterventionsTargets all studentsUniversal screeningsPreventive, proactive
Students
Example of Tiered Reading Interventions
Time
Curricular Breadth
Core+
Supplemental+
Intensive
Curricular Focus
Frequency of Progress Monitoring
Tier I
90
5 areas
Core
Yearly or greater
Tier 2
120
Less than 5
Core+
Supplemental
Monthly or
greater
Tier 3
180
2 or less
Weekly
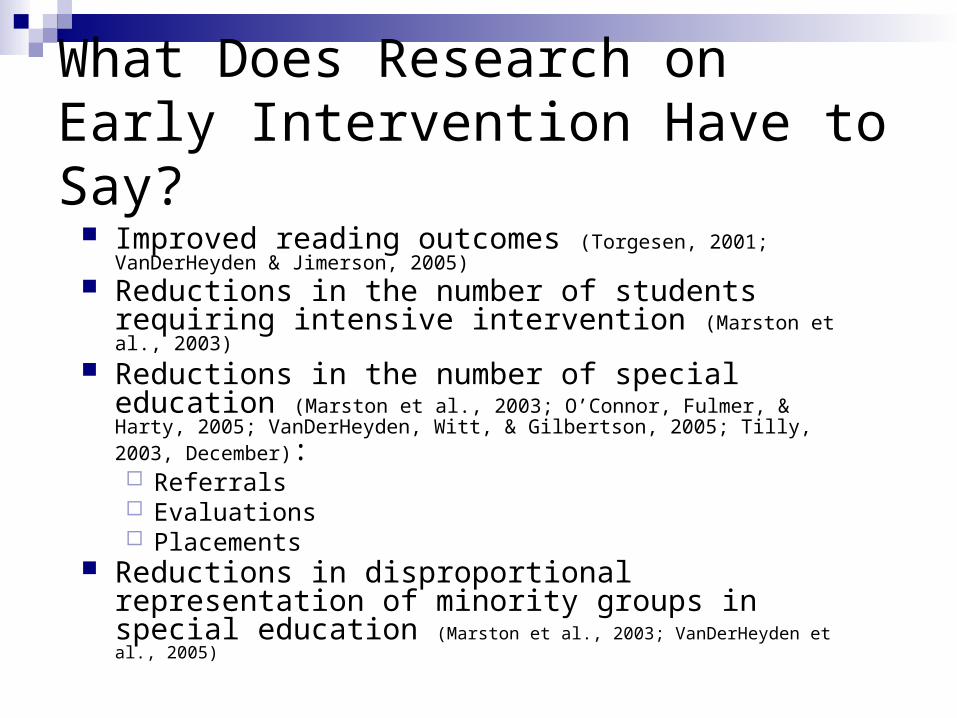
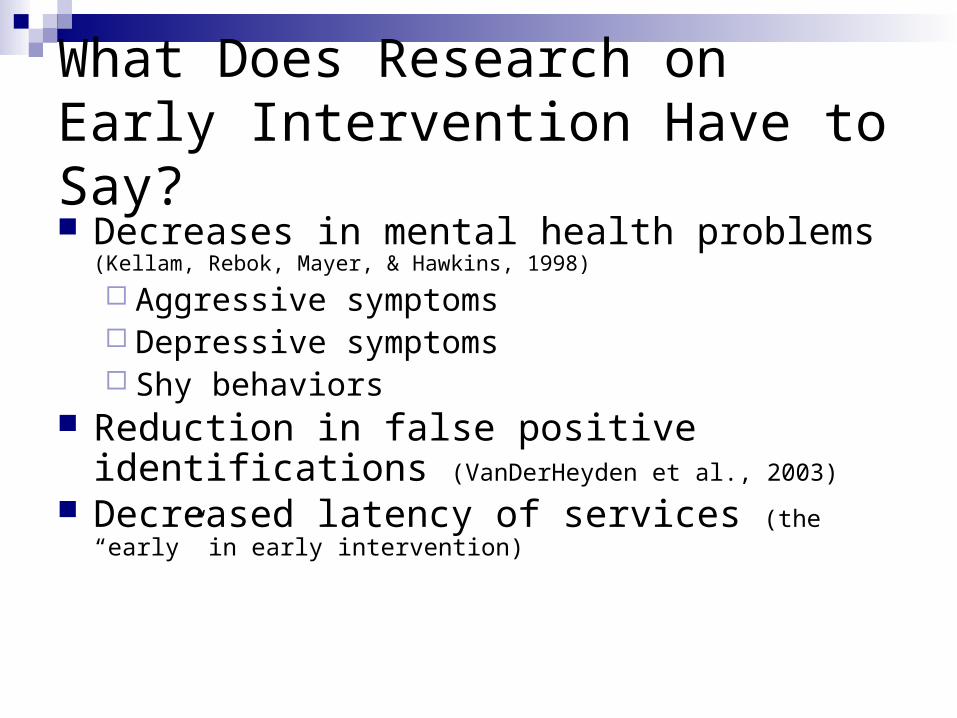
What Does Research on Early Intervention Have to Say?
Reductions in the number of students requiring intensive intervention (Marston et al., 2003)
Reductions in the number of special education (Marston et al., 2003; O’Connor, Fulmer, & Harty, 2005; VanDerHeyden, Witt, & Gilbertson, 2005; Tilly, 2003, December): Referrals Evaluations Placements
Reductions in disproportional representation of minority groups in special education (Marston et al., 2003; VanDerHeyden et al., 2005)
What Does Research on Early Intervention Have to Say? Decreases in mental health problems (Kellam, Rebok,
What about outcomes when early intervention is implemented on a larger scale?
Research Questions How does implementing a state-level early
intervention initiative affect the risk of being referred for special education services? By:
Race/ethnicity? Gender? SES?
How does implementing a state-level early intervention initiative affect the risk of being placed in special education? By:
Race/ethnicity? Gender? SES?
Method
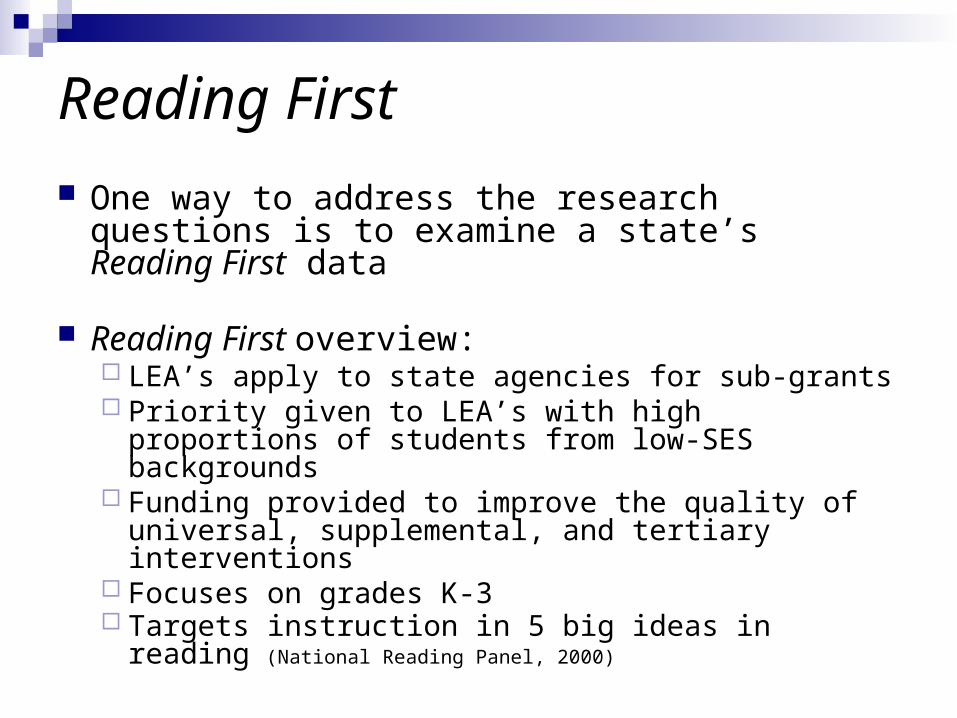
Reading First
One way to address the research questions is to examine a state’s Reading First data
Reading First overview: LEA’s apply to state agencies for sub-grants Priority given to LEA’s with high proportions of
students from low-SES backgrounds Funding provided to improve the quality of universal,
supplemental, and tertiary interventions Focuses on grades K-3 Targets instruction in 5 big ideas in reading (National
Reading Panel, 2000)
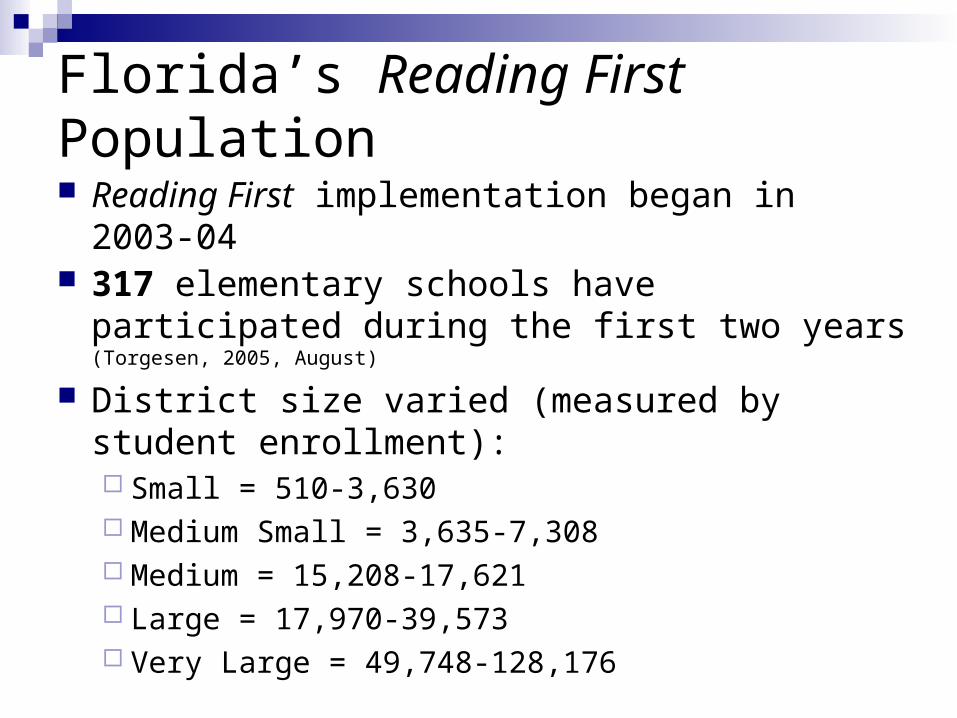
Florida’s Reading First Population
Reading First implementation began in 2003-04 317 elementary schools have participated during
the first two years (Torgesen, 2005, August)
District size varied (measured by student enrollment): Small = 510-3,630 Medium Small = 3,635-7,308 Medium = 15,208-17,621 Large = 17,970-39,573 Very Large = 49,748-128,176
Study Sample Random sample stratified by condition and
district size Condition:
Reading First schools Comparison schools
District Size Small Medium Small Medium Large Very Large
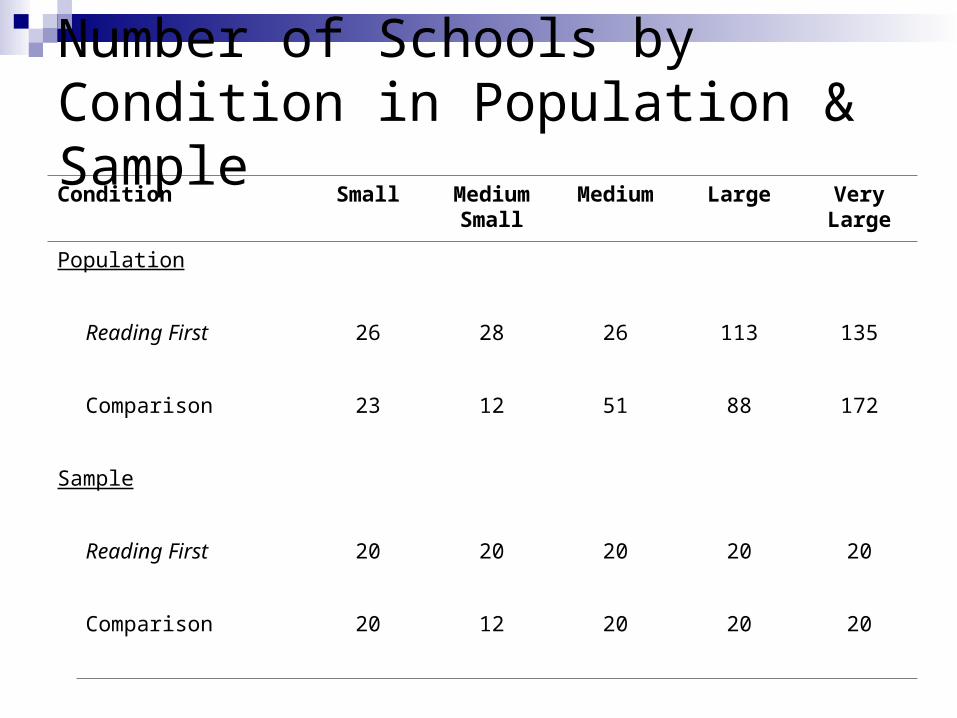
Number of Schools by Condition in Population & SampleCondition Small Medium
SmallMedium Large Very
Large
Population
Reading First 26 28 26 113 135
Comparison 23 12 51 88 172
Sample
Reading First 20 20 20 20 20
Comparison 20 12 20 20 20
Measures Survey administered by the Florida DOE at the
end of each school year Entered into a state management information
system electronically by schools Data reported at the individual student level Relevant elements reported include:
Demographics Special education status Primary exceptionality Referral reason
Procedure Requested permission to access data from the
management information system
Data set was provided with student level information including: Year District School Demographic information Special education status Primary exceptionality Other exceptionality Referral reason Promotion status
What Outcomes Were Examined
4 years of data received2 baseline (2001-02 & 2002-03)2 implementation (2003-04 & 2004-05)
3 years examined (2001-02 data excluded)
Wanted to investigate referrals initially
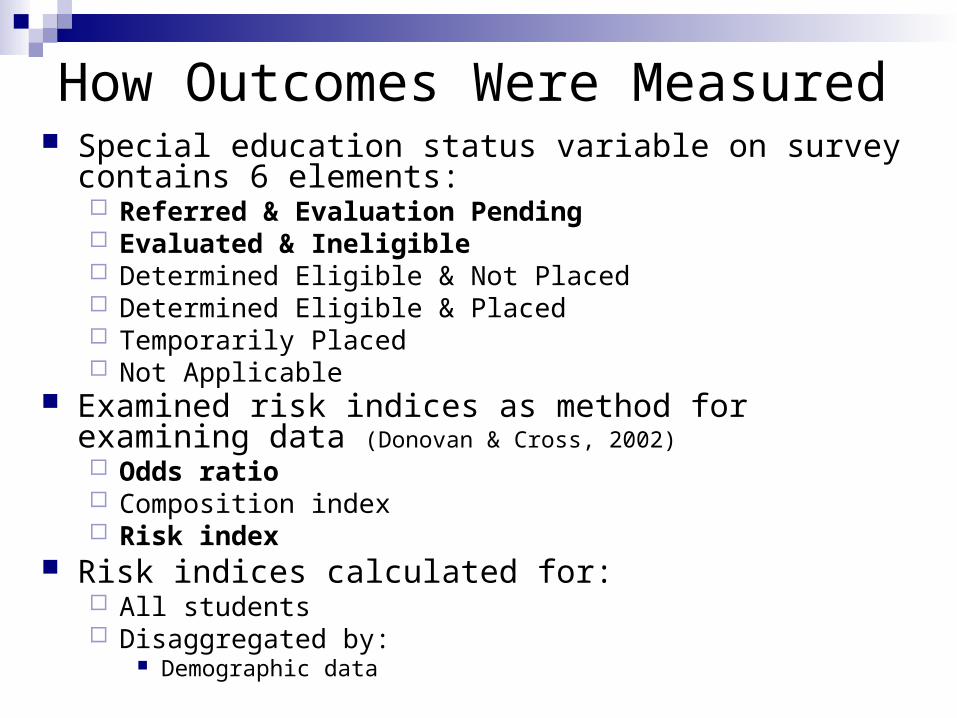
How Outcomes Were Measured Special education status variable on survey contains 6
elements: Referred & Evaluation Pending Evaluated & Ineligible Determined Eligible & Not Placed Determined Eligible & Placed Temporarily Placed Not Applicable
Examined risk indices as method for examining data (Donovan & Cross, 2002) Odds ratio Composition index Risk index
Risk indices calculated for: All students Disaggregated by:
Demographic data
Results
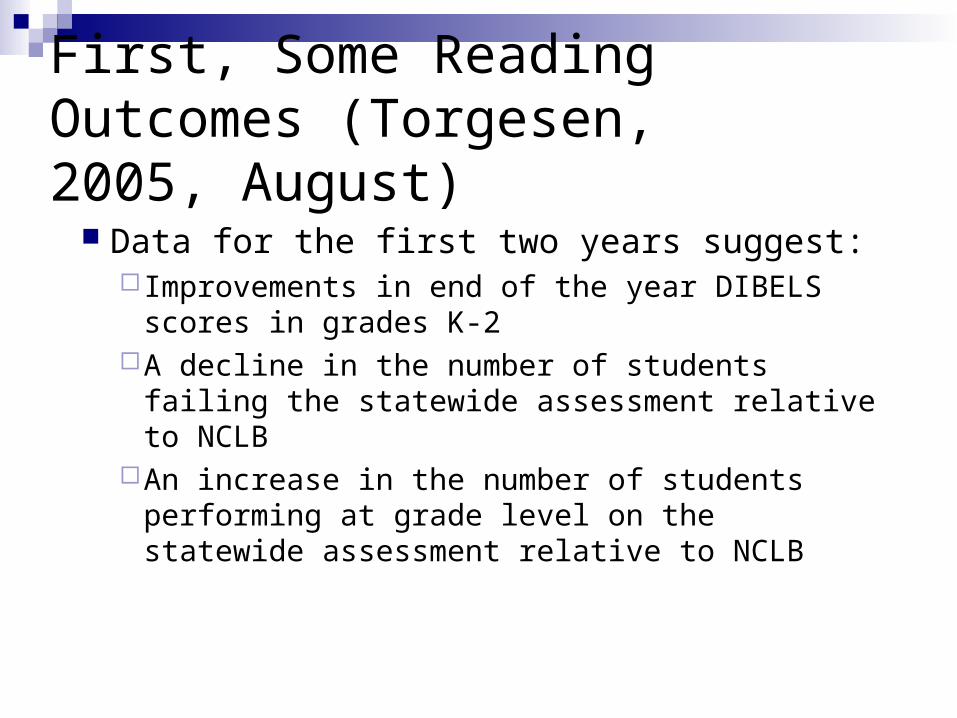
First, Some Reading Outcomes (Torgesen, 2005, August)
Data for the first two years suggest: Improvements in end of the year DIBELS
scores in grades K-2A decline in the number of students failing the
statewide assessment relative to NCLBAn increase in the number of students
performing at grade level on the statewide assessment relative to NCLB
Instructional Effectiveness Data (Torgesen, 2005, August)
Core curriculum Over 80% of students meeting grade level
objectives in grades K and 3 Improvements in percentage of students in grades
1 and 2 meeting grade level objectives
Intervention 45-55% responded to intervention in K Only 5-16% responded in grades 1-3
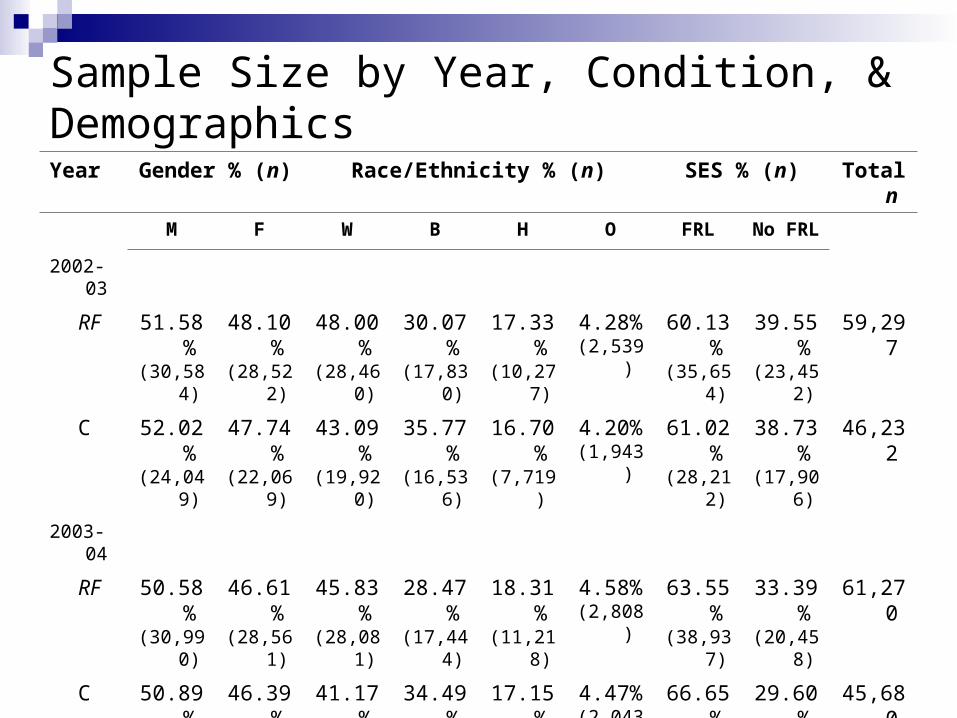
Sample Size by Year, Condition, & DemographicsYear Gender % (n) Race/Ethnicity % (n) SES % (n) Total n
M F W B H O FRL No FRL
2002-03
RF 51.58%(30,584)
48.10%(28,522)
48.00%(28,460)
30.07%(17,830)
17.33%(10,277)
4.28%(2,539)
60.13%(35,654)
39.55%(23,452)
59,297
C 52.02%(24,049)
47.74%(22,069)
43.09%(19,920)
35.77%(16,536)
16.70%(7,719)
4.20%(1,943)
61.02%(28,212)
38.73%(17,906)
46,232
2003-04
RF 50.58%(30,990)
46.61%(28,561)
45.83%(28,081)
28.47%(17,444)
18.31%(11,218)
4.58%(2,808)
63.55%(38,937)
33.39%(20,458)
61,270
C 50.89%(23,248)
46.39%(21,189)
41.17%(18,806)
34.49%(15,754)
17.15%(7,834)
4.47%(2,043)
66.65%(30,444)
29.60%(13,521)
45,680
2004-05
RF 51.94%(30,549)
47.76%(28,093)
45.91%(27,004)
28.67%(16,864)
19.91%(11,710)
5.21%(3,064)
66.63%(39,191)
32.72%(19,246)
58,816
C 52.40%(22,978)
47.39%(20,781)
41.72%(18,293)
34.74%(15,235)
18.53%(8,125)
4.80%(2,106)
64.15%(28,130)
32.29%(14,162)
43,852
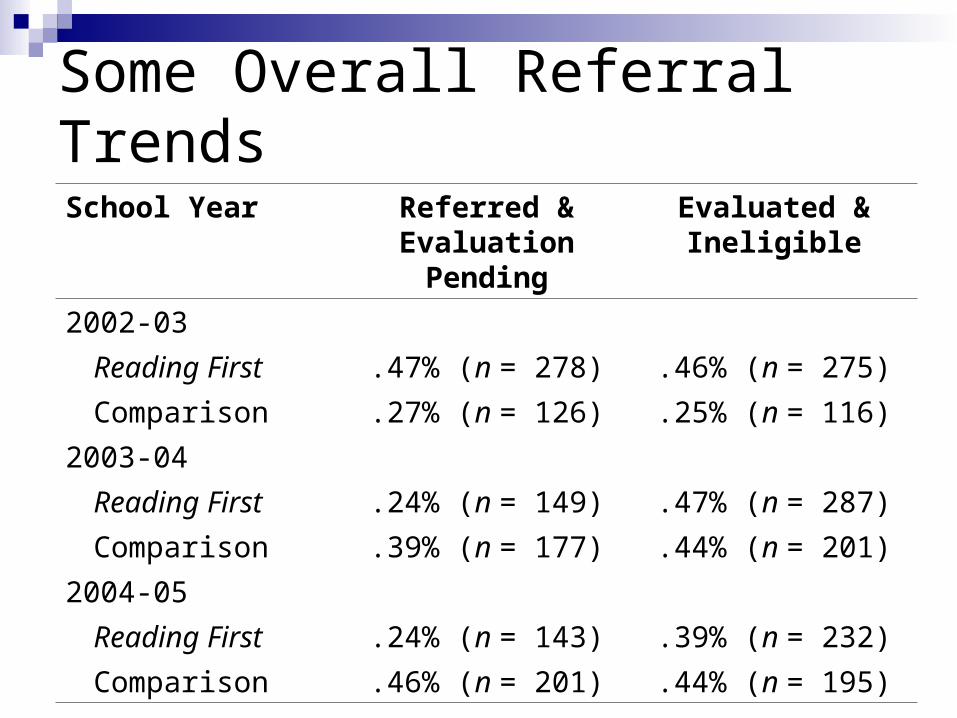
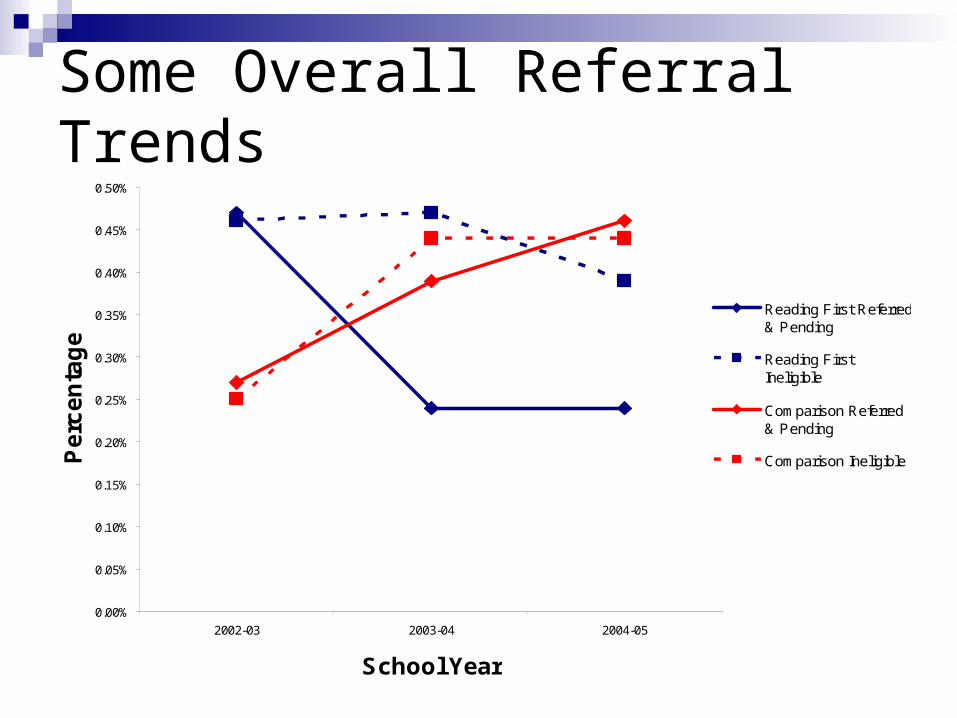
Some Initial Findings for Referrals Across Years:
Referred & PendingReading First: 49% decrease Comparison: 70% increase
Some Initial Findings for Demographic Variables Referred & Pending
Reading First: decreased across gender and racial groups as well as low-SES students
Comparison: increased across gender, racial, and SES groups
Evaluated & Ineligible Reading First: decreased across gender as well as for
some racial groups and low-SES students Comparison: increased across gender and SES as
well as most racial groups
Risk Indices for Referred & Pending Category by Year & Demographics
Year Gender Race SES
M F W B H O FRL No-FRL
2002-03
RF .60% (n=185)
.33% (n=93)
.31% (n=88)
.73% (n=131)
.51% (n=52)
.28% (n=7)
.65% (n=231)
.20% (n=47)
C .34% (n=81)
.20%(n=45)
.24% (n=47)
.27%(n=45)
.35%(n=27)
.36% (n=7)
.38%(n=108)
.10% (n=18)
2003-04
RF .26% (n=81)
.24%(n=68)
.22%(n=63)
.31%(n=54)
.24%(n=27)
.18%(n=5)
.26%(n=101)
.20%(n=41)
C .50% (n=116)
.29% (n=61)
.31% (n=58)
.36% (n=56)
.69% (n=54)
.44% (n=5)
.49%(n=150)
.14%(n=19)
2004-05
RF .29% (n=88)
.20% (n=55)
.21%(n=56)
.36% (n=61)
.17% (n=20)
.20% (n=6)
.23%(n=92)
.25%(n=48)
C .53% (n=121)
.38% (n=80)
.43% (n=79)
.44% (n=67)
.55% (n=45)
.47% (n=10)
.43% (n=121)
.50%(n=71)
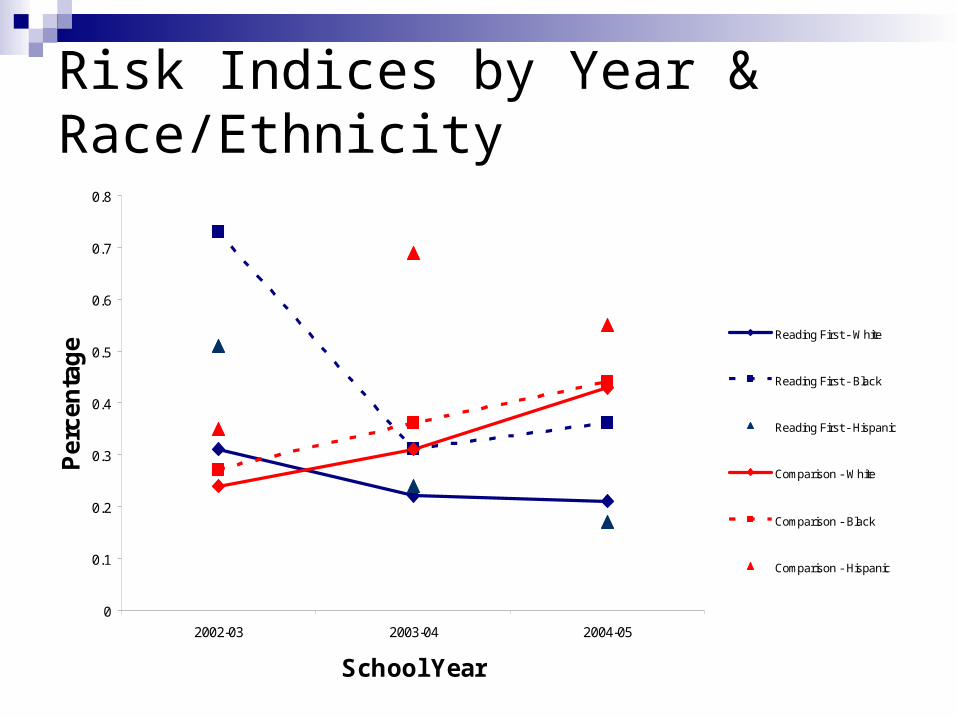
Risk Indices by Year & Race/Ethnicity
0
0.1
0.2
0.3
0.4
0.5
0.6
0.7
0.8
2002-03 2003-04 2004-05
School Year
Per
cen
tag
e
Reading First - White
Reading First - Black
Reading First - Hispanic
Comparison - White
Comparison - Black
Comparison - Hispanic
Odds Ratios for Black & Hispanic Students vs. White Students by Year
0
0.5
1
1.5
2
2.5
2002-03 2003-04 2004-05
School Year
Od
ds
Ra
tio
Reading First - Blackvs. White
Reading First -Hispanic vs. White
Comparison - Blackvs. White
Comparison -Hispanic vs. White
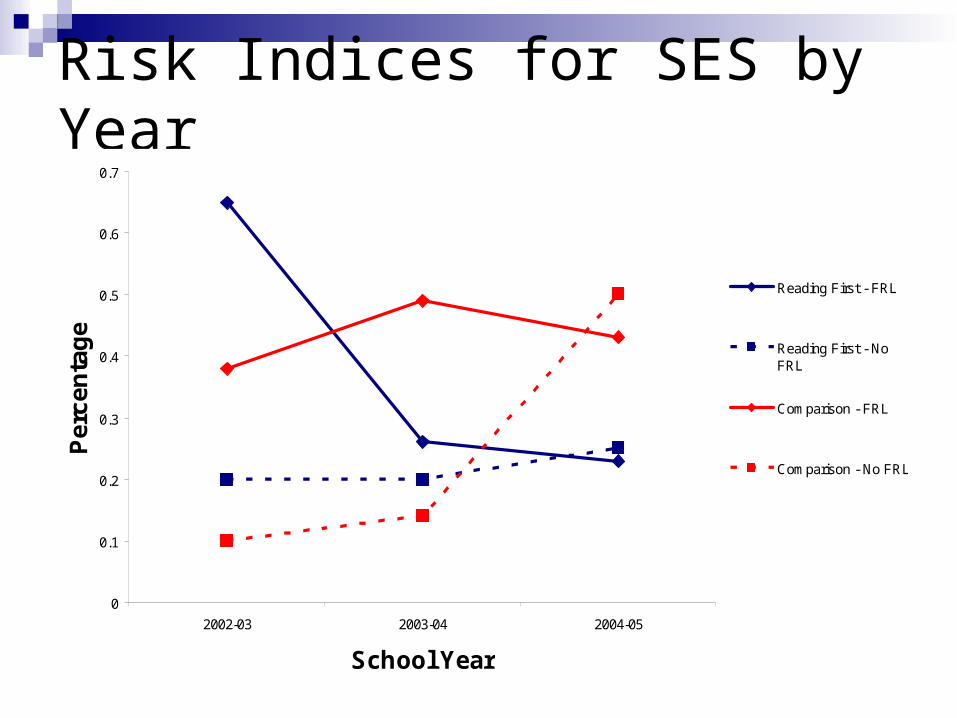
Risk Indices for SES by Year
0
0.1
0.2
0.3
0.4
0.5
0.6
0.7
2002-03 2003-04 2004-05
School Year
Per
cen
tag
e
Reading First - FRL
Reading First - NoFRL
Comparison - FRL
Comparison - No FRL
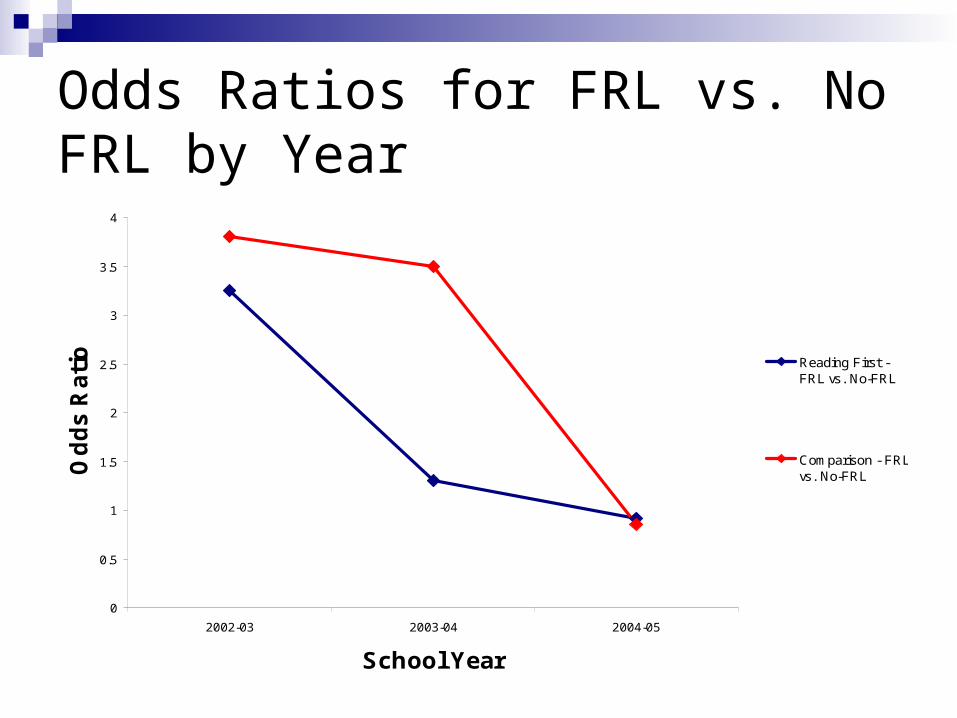
Odds Ratios for FRL vs. No FRL by Year
0
0.5
1
1.5
2
2.5
3
3.5
4
2002-03 2003-04 2004-05
School Year
Od
ds
Ra
tio Reading First -
FRL vs. No-FRL
Comparison - FRLvs. No-FRL
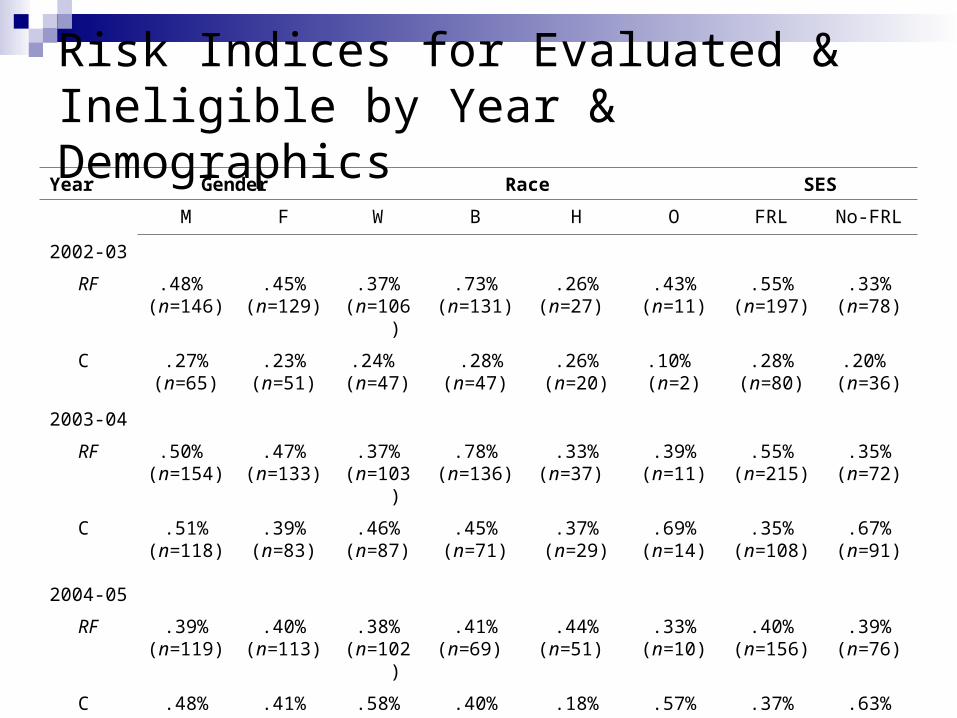
Risk Indices for Evaluated & Ineligible by Year & Demographics
Year Gender Race SES
M F W B H O FRL No-FRL
2002-03
RF .48% (n=146)
.45%(n=129)
.37%(n=106)
.73%(n=131)
.26%(n=27)
.43%(n=11)
.55%(n=197)
.33%(n=78)
C .27%(n=65)
.23%(n=51)
.24% (n=47)
.28%(n=47)
.26%(n=20)
.10% (n=2)
.28%(n=80)
.20% (n=36)
2003-04
RF .50% (n=154)
.47%(n=133)
.37%(n=103)
.78%(n=136)
.33%(n=37)
.39%(n=11)
.55%(n=215)
.35%(n=72)
C .51%(n=118)
.39%(n=83)
.46%(n=87)
.45%(n=71)
.37%(n=29)
.69%(n=14)
.35%(n=108)
.67%(n=91)
2004-05
RF .39%(n=119)
.40%(n=113)
.38%(n=102)
.41%(n=69)
.44%(n=51)
.33%(n=10)
.40%(n=156)
.39%(n=76)
C .48%(n=110)
.41%(n=85)
.58%(n=107)
.40%(n=61)
.18%(n=15)
.57%(n=12)
.37%(n=105)
.63%(n=89)
Discussion
Summary
Preliminary data analysis suggests improved referral outcomes for Reading First schools over first 2 years of implementation
Students in Reading First schools demonstrated reductions in:Risk across demographic variablesDisproportional representationMiss rate for evaluated students
Previous Research Initial outcomes are consistent with
previous research at the building & district levels demonstrating:Reductions in referralsReductions in disproportional representation Increased referral accuracy
Child-count percentages for students with high-incidence disabilities (1990-2001):Minneapolis Public Schools
Percentage of African-American students at each stage of referral process at 41 schools
44.33
64.4
69 68.9
45
5957.7
55.4
0
20
40
60
80
Student Popoulation Referred to Support Team Evaluated for Sp. Ed. Placed in Sp. Ed.
Perc
en
tag
e
1997-98 2000-01
N=
9643
N=
9170
N=
348
N=
416
N=
200
N=
154
N=
184
N=
124
Vail School District Data
RtI and Traditional Discrepancy Comparison
Amanda VanDerHeyden (2005)
QUALIFY
Yes No PendingTotal
Poor RtI-Refer 15 2 4 21
Good RtI-Do Not Refer 9 15 1 25
Total 24 17 5 46
Implications for Research & Practice Data suggest that early intervention leads to a
reduction in students referred for reasons other than a disability
Reductions in referrals allow schools to use their limited resources (i.e., time, money, personnel) more efficiently to improve student outcomes
Early intervention is needed for schools, districts, & states to meet the requirements set forth by NCLB & IDEA ’04
Examples of Early Intervention
Reading First Peer Assisted Learning Strategies Positive Behavior Support Project ACHIEVE Problem-Solving Method/RtI
Conclusions
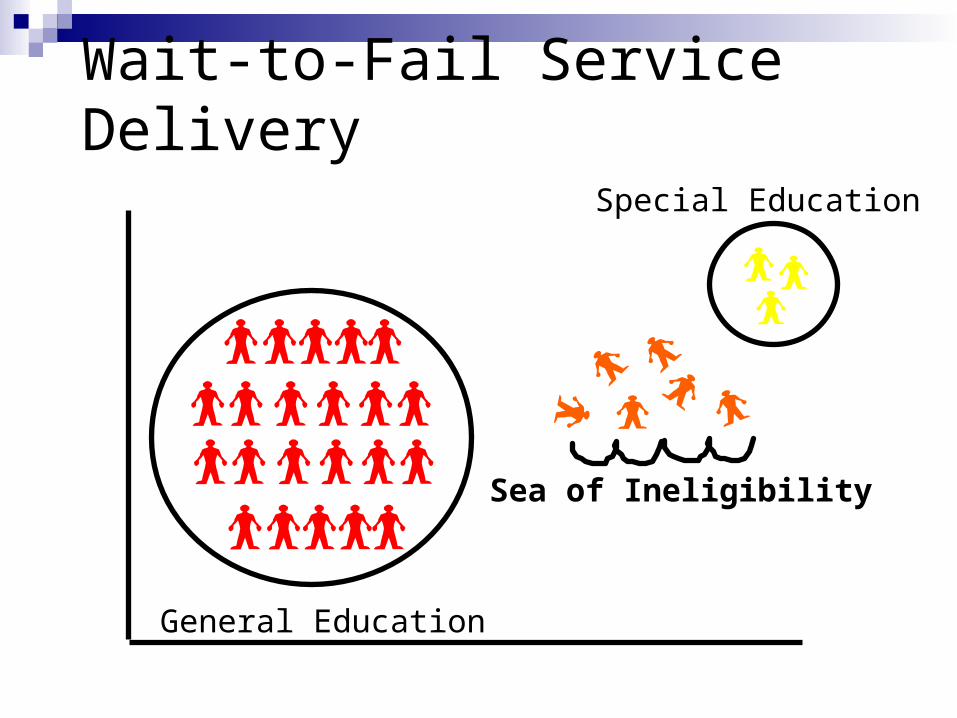
The discrepancy model has resulted in a wait-to-fail service delivery system
Data suggest that early academic, behavioral, & social-emotional interventions improve student outcomes
Recent federal legislation and initiatives provide schools, districts, & states with greater opportunity to adopt early intervention procedures to improve their students’ outcomes