*Kristin K. Jerger, *†Theoden I. Netoff, *†Joseph T. Francis,‡Timothy Sauer,§Louis Pecora,|Steven L. Weinstein, and *†¶Steven J. Schiff
*Krasnow Institute for Advanced Study,‡Department of Mathematics,¶Department of Psychology, George Mason University,Fairfax, Virginia; †Program in Neuroscience, George Washington University Medical Center, Washington, DC;§Naval Research
Laboratories, Washington, DC; and|Children’s National Medical Center, Washington, DC, U.S.A.
Summary: For patients with medically intractable epilepsy, there have been feweffective alternatives to resective surgery, a destructive, irreversible treatment. Astrategy receiving increased attention is using interictal spike patterns and continuousEEG measurements from epileptic patients to predict and ultimately control seizureactivity via chemical or electrical control systems. This work compares results of sevenlinear and nonlinear methods (analysis of power spectra, cross-correlation, principalcomponents, phase, wavelets, correlation integral, and mutual prediction) in detectingthe earliest dynamical changes preceding 12 intracranially-recorded seizures from 4patients. A method of counting standard deviations was used to compare acrossmethods, and the earliest departures from thresholds determined from non-seizure EEGwere compared to a neurologist’s judgement. For these data, the nonlinear methodsoffered no predictive advantage over the linear methods. All the methods describedhere were successful in detecting changes leading to a seizure between one and twominutes before the first changes noted by the neurologist, although analysis of phasecorrelation proved the most robust. The success of phase analysis may be due in partto its complete insensitivity to amplitude, which may provide a significant source oferror. Key Words: Prediction—Epilepsy—Nonlinear—Power spectrum—Correla-tion—Dimension.
Whether epileptic seizures can be predicted by quan-titative analysis methods applied to EEG has been afocus of much recent interest (Lehnertz and Elger, 1998;Le Van Quyen et al., 1999; Schiff, 1998). This resur-gence of interest has been motivated by several factors,including the proliferation of powerful new methods foranalyzing nonlinear system dynamics, as well as interestin developing epilepsy control devices. Nevertheless,attempts to detect seizures automatically from EEG arenot new, and older linear analysis methods showedpromise nearly 20 years ago (Lange et al., 1983; Ro-gowski et al., 1981).
Rather than referring to a declaration in advance of
the time and location of a seizure, the termpredictionhas frequently been used to refer to the process ofidentifying a state from the EEG that precedes aclinical seizure that is known to have occurred. Usingthis meaning, the period of prediction refers to thetime between identification of a preseizure state andeither the onset of the clinical seizure or the time atwhich a well-trained clinician can pick up evidence ofchanges by visual inspection of the EEG. From thepoint of view of designing a control device, the dis-tinction between clinical and neurologist-determinedonset may be meaningless—the device simply needsto detect the seizure dynamics early enough to permiteffective intervention. From a clinical perspective,what is meaningful is whether the fact that a seizure isabout to occur can be determined reliably when thefuture is unknown. Successful completion of this goal,
Address correspondence and reprint requests to Dr. Kristin K. Jerger,Krasnow Institute for Advanced Study, MSZAI, George Mason Uni-versity, Fairfax, VA 22030-4444, U.S.A.
which entails “prediction” in a slightly but cruciallydifferent sense from that just described, can only beshown by validating the method on out-of-sampledata, in which the location or even the presence ofseizures is unknown to the tester, and false-positive/false-negative detection rates can be established todetermine sensitivity and specificity.
To facilitate meaningful comparisons between EEGanalysis techniques reported commonly in the seizureprediction literature, we performed a set of analyseson a common dataset of 12 intracranially recordedseizures from four children undergoing presurgicalevaluation for intractable epilepsy, chosen to representa range of spatial extent, location, and type of under-lying pathology. A battery of both linear and nonlinearmethods (power spectral density, cross-correlation,principal component analysis, phase synchronization,wavelet packet analysis, correlation dimension, and mutualnonlinear prediction) was applied to the same set of 12seizures to characterize the earliest dynamic changes lead-ing up to the clear onset of an epileptic seizure.
Clinical EEG interpretation and time series analysis ofseizure EEG have traditionally been conducted sepa-rately, by specialists with very different training andwithout awareness of each other’s techniques and con-clusions. This division has contributed to a fragmentedknowledge base and has limited the practical applicationof results to relieving patient suffering. Seeking to avoidsuch fragmentation, close consultation with a clinicianwas maintained throughout these investigations, and thefinal results were compared with judgments made by aneurologist who is board certified in electroencephalog-raphy (S.W.)—still the “gold standard” in seizureidentification.
Inspection of the raw ictal EEG suggests that anincrease in coherent neuronal behavior occurs duringseizures. Each of the seven methods presented has beenapplied previously with variable success to characteriz-ing this coherent behavior, although the theoretical basesof their approaches differ dramatically. In our opinion,the extreme complexities involved in developing anunderstanding of seizure dynamics warrant addressingthis problem from a variety of viewpoints.
POWER SPECTRUM
Power spectral analysis has been applied to EEGmore frequently than any of the other techniquesapplied here, and it provides the basis for all analysesin the frequency domain. Almost two decades ago,spectral analysis was used to distinguish betweenepochs not associated with seizures and those preced-
ing the spike–wave bursts of absence seizures with ashigh as 80% accuracy (Siegel et al., 1982). Siegel et al.(1982) pointed out, however, that each subject’s pre-burst EEG seemed to be characterized by a uniquepattern of changes, and that no common prodromalpattern was found that could be applied uniformlyacross patients. However, when a nonstationary powerspectral analysis was applied that computed the instan-taneous power spectrum every 0.1 second for 10seconds preceding a spike and wave complex, theresults reflected a relative increase in arrhythmic slowactivity leading up to spike and wave complexes in all10 subjects (Inouye et al., 1994). Increased spectralpower athigh frequencies (40 to 150 Hz) has beennoted at the start of seizures beginning with a well-defined pattern of low-amplitude signal, referred to asthe electrodecremental event(Fisher et al., 1992).
The mechanisms of the electrodecremental EEG patternremain obscure, despite having been recognized for decades(Jasper, 1964). One central question is whether this periodreflects an overall decrease in activity. Fisher et al. (1992)suggested that the electrodecremental period does not indi-cate a lack of signal, but rather a shift of the spectral energyfrom lower to higher frequencies. In a study correlatingcharacteristics extracted from the power spectrum of pa-tients with partial epilepsy to surgical outcome (Alarcon etal., 1995), one of the most common early ictal manifesta-tions noted was the generalized electrodecremental event,present in 12 of 15 patients. That study suggested, based onsurgical outcome, that these events may not be part of theictal process itself. Instead, they may reflect generalizedcerebral changes that enhance the likelihood of seizureformation in susceptible tissue—consistent with the “two-hit” hypothesis of seizure initiation and propagation.
Application of spectral methods to interictal EEG hasrevealed increased power in lower frequencies (0.25 to 8Hz) relative to higher frequencies (8.25 to 30 Hz) whenEEGs from epileptic subjects were compared with EEGsfrom normal subjects and headache patients with normalEEGs (Drake et al., 1998). Spectral analysis of bilateralinterictal recordings taken over several days from themesiobasotemporal lobes showed a striking asymmetryin the variability of the power spectrum that persisted forhours, with what Wang and Wieser (1994) termed therelatively “rigid” side showing 80% coincidence withlateralization of the seizure based on positron emissiontomography (Wang and Wieser, 1994).
CROSS-CORRELATION
To our knowledge, autocorrelation was first appliedto EEG by Norbert Weiner and his colleagues in 1968
260 K. K. JERGER ET AL.
J Clin Neurophysiol, Vol. 18, No. 3, 2001
(Wiener, 1969). More recently, autocorrelation wasused to assess the likelihood of future neuronal bursts(Colder et al., 1996). Colder et al. (1996) reporteddecreased likelihood of bursting near the site of sei-zure onset from sites located within the hippocampusor entorhinal cortex. Shortly after the seizure predic-tions of Rogowski et al. (1981) of several secondsbased on an autoregressive model, cross-correlationsbetween interictal spikes from homologous brainstructures were used to demonstrate changes in theEEG up to tens of minutes before the clinical onset ofsome epileptic seizures (Lange et al., 1983). Duringthe past 20 years, the cross-correlation technique hasbeen applied to EEG in countless studies as one of themore conventional analysis tools against which newertools are compared. A few of these applications in-clude using cross-correlation for determining the lo-cation of epileptogenic foci (Mars and Lopes da Silva,1983), investigating interdependence of EEG signals(Lopes da Silva et al., 1989), estimating time delaysbetween channels (Harris et al., 1994), and character-izing dynamic properties of sleep EEG (Mann et al.,1993).
PRINCIPAL COMPONENTS ANALYSIS (PCA)
PCA is a linear method that has been used in EEGresearch to combine information across channels and toreduce the dimensionality of the original multichannelEEG to a smaller set of theoretically meaningful com-ponent variables. Accomplishing this involves construct-ing a linear composite of the original variables by select-ing a set of weights that maximizes the variance of theoriginal data. In this case, the number of variables equalsthe number of electrodes or amplifier channels. To ex-plain 100% of the variance expressed by the originaldata, the number of principal components extracted fromthe correlation matrix would be equal to the number ofchannels, and no reduction in dimensionality would oc-cur. Thus, one must choose an acceptable percentage ofthe overall variance that one seeks to preserve by calcu-lating its principal components. In 1987, when Maier etal. (1987) used PCA for source localization of humanvisual evoked potentials, they chose a level of 95%,assuming a noise level of 5% “after prolonged averag-ing.” In the same year, Freeman and van Dijk (1987)reported that using only the first principal componentwas sufficient for their comparison between spatial pat-terns in the visual cortex and the olfactory bulb of arhesus monkey. Nine years later, Barrie et al. (1996)compared results obtained from applying PCA, a modi-fied fast Fourier transform method, and calculation of
root mean square amplitudes to extraction of the broad-spectrum waveform common to all channels of an 83 8electrode array placed on the cortical surface of a rabbit,and found the three methods to yield equivalent spatialpatterns. In that same study, they reported the firstprincipal component to account for 90 to 99% of theirdata variance (Barrie et al., 1996). Jobert et al. (1994)found that after performing PCA on the results of theirspectral analysis, the first two principal componentsretained 89.0 to 99.4% of the initial variance for their 16subjects, a sufficient amount for their automatic analysisof sleep EEG. A sophisticated algorithm for choosing thenumber of principal components to extract can be foundin the paper by Arruda et al. (1996).
WAVELETS
Originating from the field of seismology (Goupillaudet al., 1984), during the last 15 years wavelet transformshave been applied to a number of problems includingdata compression (Coifman, 1986; DeVore et al., 1992),turbulence (Argoul et al., 1989), and speech processing(Kadambe and Boudreaux–Bartels, 1992). After the orig-inal work by Gotman (1982) using decomposition of theEEG into half waves for automatic seizure detection,there followed a number of applications of wavelettransforms to EEG analysis and seizure detection (Eber-hart et al., 1989; Gabor and Seyal, 1992; Gabor et al.,1996; Jando et al., 1993; Ozdamar et al., 1991; Schiff etal., 1994a, b; Webber et al., 1994). Seizure prediction bya mean of 15.5 seconds in 92% of 125 seizures has beenreported (Osorio et al., 1998), using a method based onDanbechies’ PAUB4 wavelet (Danbechies, 1992).
PHASE CORRELATION
Methods of measuring phase synchrony include thosebased on spectral coherence (Bressler et al., 1993; Me-non et al., 1996), which incorporates both amplitude andphase information, detection of maximal values afterfiltering (Yordanova et al., 1997), and wavelet filtering(Rodriguez et al., 1999). In their 1996 investigation ofphase synchronization of chaotic oscillators, Rosenblumet al. (1996) pointed out that “the notion of synchroni-zation itself lacks a unique interpretation,” but settled onthe general description of synchronization by Blekhman(1988) as “an appearance of some relations betweenfunctionals of two processes due to interaction.” Theythen showed that for weakly coupled nonlinear equa-tions, a condition exists in which the phases are locked,but the amplitudes vary chaotically and are practicallyuncorrelated. Tass et al. (1998) developed a techniquebased on this work, which they applied to noisy nonsta-
261EARLY SEIZURE DETECTION
J Clin Neurophysiol, Vol. 18, No. 3, 2001
tionary bivariate data from magnetoencephalograms andmuscle activity in Parkinson’s disease. Stratonovich(1963) described synchronization of noisy systems as the“appearance of peaks in thedistribution of the cyclicrelative phase” that point to preferred phase differencevalues. To characterize the strength of synchronization,Tass et al. (1998) proposed two indices, one based onShannon entropy and one based on conditional probabil-ity that builds on the idea of Stratonovich (1963), aimingto quantify the degree of deviation of the relative phasedistribution from a uniform phase distribution.
CORRELATION DIMENSION
With the advent of nonlinear time series analysis toolsthat could be applied to experimental data, particularlythe correlation integral (Grassberger, 1983), much inter-est arose in investigating nonlinear dynamics of EEGactivity. There has been much discussion aimed at es-tablishing the appropriate and optimal application ofthese methods. It has been suggested that estimatingfractal dimension, a characteristic associated with cha-otic systems, may provide additional insight to define apreseizure state or the seizures themselves (Babloyantzand Destexhe, 1986). It has also been pointed out thatobtaining evidence of chaotic activity may not be trivial.Osborne and Provencale (1989) showed by obtaining afinite correlation dimension for colored noise that thesole observation of a finite fractal dimension from theanalysis of a time series is not sufficient to infer thepresence of chaos in the system dynamics. Along thesame lines, Theiler’s (1995) analysis of an EEG timeseries reported previously to be chaotic emphasized thatinterpreting a calculated dimension as the number ofdegrees of freedom of a system may be misleading. Inthat study, Theiler (1995) found that the estimated cor-relation dimension and Lyapunov exponent were essen-tially the same for the original data and the surrogatedatasets, created by shuffling the phases of the originaldataset and thereby ensuring that no dynamic correlationwas present from one spike-and-wave pattern to another.With these caveats in mind, Lehnertz and Elger (1995),in their study published the same year as Theiler’sanalysis, were careful to point out that they were inter-ested only in relative dimension changes over time, andwere not considering the dimension estimates to repre-sent absolute degrees of freedom of the system. In 1998,they reported a marked drop in estimated dimension aslong as several minutes before seizures that persisteduntil seizure offset (Lehnertz and Elger, 1998).
Another consideration regarding correlation dimen-sion is whether time series from individual electrodes
should be treated separately, reconstructing by time lagsalone, or with other channels, forming multichannelreconstructions based on time lag and spatial position.The majority of applications have used separate chan-nels, despite the conclusion of Lachaux et al. (1997),
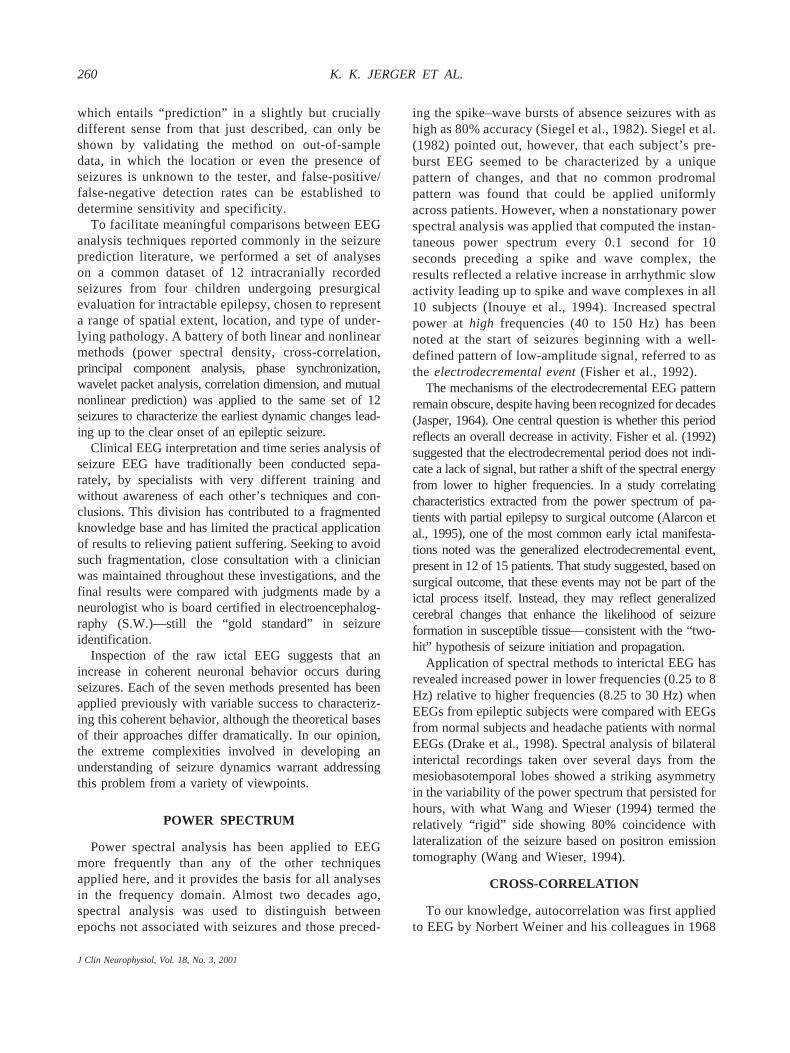
FIG. 1. (A–D) MR images of brain and lateral skull radiographs showingelectrode placement. (A) Patient A. MR image demonstrating left temporallobe cortical dysplasia extending into the parieto-occipital region, andelectrodes are shown by radiograph to overlie this region. (B) Patient B.Although MRI results were normal, scalp and subdural ictal mappingrevealed seizure generation from the left anterior–inferior frontal lobe, andradiography shows grid placement over this area. (C) Patient C. MRIshows a 23 2-cm densely calcified lesion on the surface of the left inferiorparietal lobe, eroding the inner table of the skull. (D) Patient D. MRI showsa dysgenetic right occipital lobe and a small cyst in the right choroid fissurenear the anterior atrophic hippocampus. Because of this apparent dualpathology, a single long-depth electrode was placed to record simulta-neously from both areas, running from the occipital lobe to the anteriorhippocampus.
262 K. K. JERGER ET AL.
J Clin Neurophysiol, Vol. 18, No. 3, 2001
based on simulated EEG data, that single channels didnot do as well as the multichannel method in quantifyingspatially extended dynamics. Lerner (1996) articulatedanother central issue of EEG analysis that transcendedestimation of dimension when he stated, “The fundamen-tal problem [leading to poor reproducibility of results]lies in the fact that the time series associated with theEEG are not stationary over periods of sufficient lengthto permit reliable estimation of the quantities of interest.Indeed, the most interesting feature of the EEG is itsnonstationary character.”
MUTUAL PREDICTION
Nonlinear systems may synchronize in complex waysthat require methods designed specifically for their de-tection (Pecora et al., 1995; Rulkov et al., 1995). To
characterize nonlinear dynamic interdependence be-tween two neuronal systems, Schiff et al. (1996) deriveda method based on mutual nonlinear prediction that theyapplied to spinal cord motoneurons. This method definesthe nonlinear predictability of each system based onknowledge about the other system, and it provides infor-mation on the directionality of the coupling. This is doneby using time-delay reconstructions of two simulta-neously sampled time series. Similar states found in asmall neighborhood in one reconstruction are checked todetermine whether they correspond to similar states inthe second reconstruction and to what degree. Thismethod of mutual prediction has been applied to intra-cranial EEGs of patients with medial temporal lobeepilepsy by Le Van Quyen et al. (1998), and their resultsindicated a marked difference between the degree of
FIG. 2. Samples of raw data from all four patients for three 10-second windows. Every other recording channel is plotted. Note the variability betweenpatients with respect to the number of channels involved in the seizure and the apparent “rhythmicity” of fully developed seizure activity. Thisheterogeneous set of patients was chosen for comparison of the methods when applied to a range of seizure types.
263EARLY SEIZURE DETECTION
J Clin Neurophysiol, Vol. 18, No. 3, 2001
linear interaction measured by the cross-correlation co-efficient (which was low) and the degree of nonlinearinteraction measured by mutual prediction (which washigh) at seizure onset.
These seven methods (power spectral density, cross-correlation, principal components analysis, waveletpacket analysis, phase analysis, correlation dimension,and mutual prediction) were applied as described else-where (Jerger et al., 2001) to EEG recordings fromsubdural and depth electrodes from four children withmedically intractable epilepsy during presurgical evalu-ation (Fig. 1). Three of the children had lesional epilepsyarising from neocortical or hippocampal structures asdefined by MRI and confirmed by pathology at the timeof resection. One showed glioses by pathology only(normal MRI). After surgical removal of the electro-graphic seizure focus, each patient either remained sei-zure free or experienced markedly reduced seizure fre-quency and severity.
Raw data were bandpass filtered between 0.5 to 30 Hzand referenced externally. The data were segmented into10-second half-overlapping blocks (2,000 data points perwindow). Samples of raw data from all four patients forthree 10-second windows are displayed in Fig. 2 to givea qualitative sense of how the heterogeneity of seizure
origin between patients was reflected in the EEG. Thestate of all patients before and during seizure onset wasconfirmed as awake and alert from videotapes recordedsimultaneously with the EEG. Note the variability be-tween patients with respect to the number of channelsinvolved in the seizure and the apparent “rhythmicity” ofseizure activity. One of the questions asked by the studyof Jerger et al. (2001) was whether these differenceswould be reflected in differential performance of each ofthe seven methods, and whether a particular methodcould be best suited to certain seizure characteristics.
For the purpose of comparison across methods, resultsfrom each of the seven methods are expressed in num-bers of standard deviations. The mean and standarddeviation of each method’s values during a baselineperiod with no evidence of seizure activity were calcu-lated for each seizure. Results from all methods werenormalized by these values to give the number of stan-dard deviations from the baseline mean for each channel.Results for channels with the top 10% of values wereaveraged. The maximum value of this average during thebaseline period was used as a threshold value, and thefirst time this value was exceeded was recorded for eachseizure.
The average number of standard deviations from the
FIG. 3. Average standard deviationsfrom baseline mean of phase analysisfor all 12 seizures using the top 10% ofchannels.
264 K. K. JERGER ET AL.
J Clin Neurophysiol, Vol. 18, No. 3, 2001
baseline mean over time for all seizures and all chan-nels is shown in Fig. 3. A neurologist (S.W.) identifiedthree times for each of the 12 seizures using only theelectrographic record: (1) initial ictal EEG changes,from here on referred to as the “time of seizure onset”;(2) the beginning of “rhythmic” ictal activity; and (3)seizure cessation. These times are indicated by thedashed vertical lines in Fig. 3. For these 12 seizures,the average amount of time by which the thresholdcrossing preceded the first vertical line (seizure onset)was 105 seconds.
Fig. 4 shows the differences between threshold cross-ing times and neurologist-determined seizure onset timesfor all methods and all seizures, with one color corre-
sponding to each patient. Addressing our earlier questionof whether particular methods are best suited to a par-ticular patient, there is a tendency for results from aparticular patient to be grouped together across methods(giving the appearance of longitudinal colored stripes),suggesting that factors specific to individual patientsplay an important role in determining how early a seizuremay be detected, and in many cases this variabilitybetween individuals may have more of an influence onthe predictability of seizures than the seizure detectionmethod chosen.
These seven methods were successful in detectingchanges leading to a seizure as long as 2.5 minutesbefore the first visual evidence of electrographic seizure
FIG. 4. Difference between threshold crossing time and the neurologist’s judgment of electrographic seizure onset. Results for all 12 seizures are shown foreach method, with one color corresponding to each patient, and one shape corresponding to the seizure number. One standard deviation is indicated by thehorizontal bar, with the vertical bar at its center indicating the mean result over all seizures for that method. The vertical gray line at 0 second correspondsto the time given by the neurologist as electrographic seizure onset. This time preceded clinical seizure onset by an average of 25 seconds.
265EARLY SEIZURE DETECTION
J Clin Neurophysiol, Vol. 18, No. 3, 2001
onset was noted by the neurologist. It should be empha-sized that the time most frequently reported in the liter-ature as that of seizure onset is the time rhythmic activityis evident in the EEG. Here we have used instead thetime the first epileptiform changes were noted by theneurologist, which always preceded rhythmic activity byan average of 25 seconds. Thus, the average lead timegiven by phase correlation, before clinical onset, is morethan 2 minutes.
Interestingly, the threshold crossing times given by thelinear methods often occurred earlier than or at the sametime as some of the nonlinear methods. We found thissurprising because many behaviors of neurons are knownto follow nonlinear dynamics, from all-or-none firing tocommunication through synaptic transmission. Thus, onemay expect that there is always underlying nonlinearbehavior in EEG that is not fully characterized by lineartools—activity that should be reflected in our nonlinearmeasures. It is likely that the EEG signals are so complexthat nonlinear reconstruction methods may not capturethe dynamics accurately. Nonlinear tools are often de-signed to reveal structure from low-dimensional nonlin-ear systems. Faced with a truly complex system (withmany degrees of freedom), they may fare worse than alinear analysis, as seen for correlation dimension andmutual prediction in these results. In addition, themethod of obtaining the initial measurement may ex-clude relevant information. Using higher than standardsample frequencies and electrode placement density aswell as using distant recording sites to improve theresolution and widen the spatial range of sampling maylead to reconstructions that better reflect the true systemdynamics.
Linear methods also have weaknesses. For example, alimitation of PCA is that it is restricted to definingdirections that are orthogonal to each other. In theiranalysis of functional MRI, McKeown et al. (1998)found that their method based on Bell and Sejnowski’s(1995) independent component analysis algorithm,which allows for nonorthogonal directions as well as arelated fourth-order decomposition technique (Comon,1994), was superior to PCA in determining the spatialand temporal extent of task-related activation. A methodfor performing a nonlinear form of PCA has recentlybeen proposed (Scholkopf et al., 1998) that involves theuse of integral operator kernel functions. An open ques-tion remains as to how to choose the ideal kernel for aparticular application.
The substantial differences between patients appearedto play a greater role in seizure predictability than the
method selected. This result may be due in part to ourchoice not to “individualize” parameters. Had we chosensettings most appropriate for a particular patient, we mayhave found particular methods to be patient specific. Inany case, it is likely that results could be improved byoptimizing parameters for a particular patient, and by“training” the algorithm on known seizures before pre-senting it with test data.
In conclusion, all seven methods were successful inindicating seizure onset before the neurologist for allbut a few seizures—most of them 1 to 3 minutes inadvance of electrographic onset. Because clinical sei-zure onset occurred an average of 25 seconds afterelectrographic onset, the lead time before clinicalonset given by these methods (atp , 0.05) was evenlonger and may prove to be sufficient for incorpora-tion into future control devices. Nevertheless, theseprocedures should be applied to recordings spanningmany minutes or hours to see how they fare whenblind to whether a seizure will occur. Only with suchvalidation can conclusions regarding their usefulnessfor true seizure prediction be reached. Finally, al-though we did not uncover significant differencesbetween linear and nonlinear methods, our analysis ofphase performed slightly better than the other meth-ods, which may reflect its sensitivity in detectingweakly coupled nonlinear systems.
REFERENCES
Alarcon G, Binnie CD, Elwes RD, Polkey CE. Power spectrum andintracranial EEG patterns at seizure onset in partial epilepsy.Electroencephalogr Clin Neurophysiol1995;94:326–37.
Argoul F, Arneodo A, Grasseau G, Gagne Y, Hopfinger EJ, Frisch U.Wavelet analysis of turbulence reveals the multifractal nature ofthe Richardson cascade.Nature1989;338:51–2.
Arruda JE, Weiler MD, Valentino D, et al. A guide for applyingprincipal-components analysis and confirmatory factor analysis toquantitative electroencephalogram data.Int J Psychophysiol1996;23:63–81.
Babloyantz A, Destexhe A. Low-dimensional chaos in an instance ofepilepsy.Proc Natl Acad Sci U S A 1986;83:3513–7.
Colder BW, Frysinger RC, Wilson CL, Harper RM, Engel J Jr.Decreased neuronal burst discharge near site of seizure onsetin epileptic human temporal lobes.Epilepsia 1996;37:113–21.
Comon P. Independent component analysis: a new concept?SignalProcessing1994;36:287–314.
Daubechies I.Ten lectures on wavelets. CBMS-NSF regional confer-ence series in applied mathematics. Philadelphia: Society forIndustrial and Applied Mathematics, 1992.
DeVore RA, Jawerth B, Lucier BJ. Image compression through wavelettransform coding.IEEE Trans Inf Theory1992;38:719–46.
Drake ME, Padamadan H, Newell SA. Interictal quantitative EEG inepilepsy.Seizure1998;7:39–42.
Fisher RS, Webber WR, Lesser RP, Arroyo S, Uematsu S. High-frequency EEG activity at the start of seizures.J Clin Neuro-physiol1992;9:441–8.
Freeman WJ, van Dijk BW. Spatial patterns of visual cortical fast EEGduring conditioned reflex in a rhesus monkey.Brain Res1987;422:267–76.
Gotman J. Automatic recognition of epileptic seizures in the EEG.Electroencephalogr Clin Neurophysiol1982;54:530–40.
Goupillaud PA, Grossmann P, Morlet J. Cycle-octave and relatedtransforms in seismic signal analysis.Geoexploration1984;23:85–102.
Grassberger P, Procaccia I. Characterization of strange attractors.PhysRev Letters1983;50:346–9.
Harris B, Gath I, Rondouin G, Feuerstein C. On time delay estimationof epileptic EEG.IEEE Trans Biomed Eng1994;41:820–9.
Inouye T, Matsumoto Y, Shinosaki K, Iyama A, Toi S. Increases in thepower spectral slope of background electroencephalogram justprior to asymmetric spike and wave complexes in epileptic pa-tients.Neurosci Lett1994;173:197–200.
Jando G, Siegel RM, Horvath Z, Buzsaki G. Pattern recognition of theelectroencephalogram by artificial neural networks.Electroen-cephalogr Clin Neurophysiol1993;86:100–9.
Jasper H. Some physiological mechanisms involved in epileptic au-tomatisms.Epilepsia1964;5:1–20.
Jerger KK, Netoff TI, Francis JT, et al. Seizure detection and predic-tion: a comparison of linear and nonlinear methods.Clin Neuro-physiolJan 2001. Submitted.
Jobert M, Escola H, Poiseau E, Gaillard P. Automatic analysis of sleepusing two parameters based on principal component analysis ofelectroencephalography spectral data.Biol Cybern1994;71:197–207.
Kadambe S, Boudreaux–Bartels GF. Application of the wavelet trans-form for pitched detection of speech signals.IEEE Trans InfTheory1992;38:917–24.
Lachaux J, Pezard L, Garnero L, et al. Spatial extension of brainactivity fools the single-channel reconstruction of EEG dynamics.Hum Brain Mapping1997;5:26–47.
Lange HH, Lieb JP, Engel J Jr, Crandall PH. Temporo-spatial patternsof pre-ictal spike activity in human temporal lobe epilepsy.Elec-troencephalogr Clin Neurophysiol1983;56:543–55.
Lehnertz K, Elger CE. Spatio-temporal dynamics of the primaryepileptogenic area in temporal lobe epilepsy characterized byneuronal complexity loss.Electroencephalogr Clin Neurophysiol1995;95:108–17.
Lehnertz K, Elger C. Can epileptic seizures be predicted? Evidencefrom nonlinear time series analysis of brain electrical activity.Phys Rev Lett1998;80:5019–26.
Lerner D. Monitoring changing dynamics with correlation integrals:case study of an epileptic seizure.Physica D1996;97:563–76.
Le Van Quyen M, Adam C, Baulac M, Martinerie J, Varela FJ.Nonlinear interdependencies of EEG signals in humanintracranially recorded temporal lobe seizures.Brain Res1998;792:24–40.
Le Van Quyen M, Martinerie J, Baulac M, Varela F. Anticipatingepileptic seizures in real time by a non-linear analysis of similaritybetween EEG recordings.Neuroreport1999;10:2149–55.
Lopes da Silva F, Pijn JP, Boeijinga P. Interdependence of EEGsignals: linear vs. nonlinear associations and the significance oftime delays and phase shifts.Brain Topogr1989;2:9–18.
Maier J, Dagnelie G, Spekreijse H, van Dijk BW. Principal componentsanalysis for source localization of VEPs in man.Vision Res1987;27:165–77.
Mann K, Backer P, Roschke J. Dynamical properties of the sleep EEGin different frequency bands.Int J Neurosci1993;73:161–9.
Mars NJ, Lopes da Silva FH. Propagation of seizure activity inkindled dogs.Electroencephalogr Clin Neurophysiol1983;56:194–209.
McKeown MJ, Makeig S, Brown GG, et al. Analysis of fMRI data byblind separation into independent spatial components.Hum BrainMapping1998;6:160–88.
Menon V, Freeman WJ, Cutillo BA, et al. Spatio-temporal correlationsin human gamma band electrocorticograms.ElectroencephalogrClin Neurophysiol1996;98:89–102. Erratum.ElectroencephalogrClin Neurophysiol1996;98:228.
Osborne AR, Provenzale A. Finite correlation dimension for sto-chastic systems with power-law spectra.Physica D1989;35:357– 81.
Osorio I, Frei MG, Wilkinson SB. Real-time automated detection andquantitative analysis of seizures and short-term prediction ofclinical onset.Epilepsia1998;39:615–27.
Ozdamar O, Yayali I, Jayakar P, Lopez CN. Multilevel neural networksystem for EEG spike detection. In: Bankman IN, Tsitlik JE, eds.Computer-based detection systems. Washington, DC: IEEE Com-puter Society Press, 1991:272–9.
Pecora LM, Carroll TL, Heagy JF. Statistics for mathematical proper-ties of maps between time series embeddings.Phys Rev E1995;52:3420–39.
Rodriguez E, George N, Lachaux JP, Martinerie J, Renault B, VarelaFJ. Perception’s shadow: long-distance synchronization of humanbrain activity [see comments].Nature1999;397:430–3.
Rogowski Z, Gath I, Bental E. On the prediction of epileptic seizures.Biol Cybern1981;42:9–15.
Rulkov NF, Sushchik MM, Tsimring LS, Abarbanel HDI. Generalizedsynchronization of chaos in directionally coupled chaotic systems.Phys Rev E1995;512:980–94.
Schiff SJ, Aldroubi A, Unser M, Sato S. Fast wavelet transformationof EEG. Electroencephalogr Clin Neurophysiol1994a;91:442–55.
Schiff SJ, Milton J, Heller J, Weinstein SL. Wavelet transforms andsurrogate data for electrographic spike and seizure localization.Optical Eng1994b;33:2162–9.
Schiff SJ, Chang T, Burke RE, Sauer T. Detecting dynamical interde-pendence and generalized synchrony through mutual prediction ina neural ensemble.Phys Rev E1996;54:6709–24.
Scholkopf B, Smola A, Muller K. Nonlinear component analysis as akernel Eigenvalue problem.Neural Computation1998;10:1299–319.
Siegel A, Grady CL, Mirsky AF. Prediction of spike–wave bursts inabsence epilepsy by EEG power-spectrum signals.Epilepsia1982;23:47–60.
267EARLY SEIZURE DETECTION
J Clin Neurophysiol, Vol. 18, No. 3, 2001
Stratonovich RL.Topics in the theory of random noise. New York:Gordon and Breach, 1963.
Tass P, Rosenblum MG, Weule J, et al. Detection of n:m phase lockingfrom noisy data: application to magnetoencephalography.PhysRev Lett1998;81:3291–4.
Theiler J. On the evidence for low-dimensional chaos in an epilepticelectroencephalogram.Phys Lett A1995;196:335–41.
Wang J, Wieser HG. Regional rigidity of background EEG activity inthe epileptogenic zone.Epilepsia1994;35:495–504.
Webber WRS, Litt B, Wilson K, Lesser RP. Practical detection ofepileptiform discharges (EDs) in the EEG using an artificialnetwork: a comparison of raw and parameterized EEG data.Electroencephalogr Clin Neurophysiol1994;91:194–204.
Wiener N. Cybernetics or control and communication in the animaland the machine. Cambridge, MA: MIT Press, 1969.
Yordanova J, Kolev V, Demiralp T. The phase-locking of auditorygamma band responses in humans is sensitive to task processing.Neuroreport1997;8:3999–4004.