Early visual deprivation from congenital cataracts disrupts activity and functional connectivity in the face network Cheryl L. Grady a,n , Catherine J. Mondloch b , Terri L. Lewis c,d , Daphne Maurer c,d a Rotman Research Institute at Baycrest, Departments of Psychiatry and Psychology, University of Toronto, Toronto, Ontario, Canada b Department of Psychology, Brock University, St. Catharines, Ontario, Canada c Department of Psychology, Neuroscience & Behaviour, McMaster University, Hamilton, Ontario, Canada d Department of Ophthalmology and Vision Sciences, The Hospital for Sick Children, Toronto, Ontario, Canada article info Article history: Received 9 July 2013 Received in revised form 9 March 2014 Accepted 13 March 2014 Available online 20 March 2014 Keywords: Face processing Development Functional magnetic resonance imaging Fusiform gyrus Visual deprivation abstract The development of the face-processing network has been examined with functional neuroimaging, but the effect of visual deprivation early in life on this network is not known. We examined this question in a group of young adults who had been born with dense, central cataracts in both eyes that blocked all visual input to the retina until the cataracts were removed during infancy. We used functional magnetic resonance imaging to examine regions in the “core” and “extended” face networks as participants viewed faces and other objects, and performed a face discrimination task. This task required matching faces on the basis of facial features or on the spacing between the facial features. The Cataract group (a) had reduced discrimination performance on the Spacing task relative to Controls; (b) used the same brain regions as Controls when passively viewing faces or making judgments about faces, but showed reduced activation during passive viewing of faces, especially in extended face-network regions; and (c) unlike Controls, showed activation in face-network regions for objects. In addition, the functional connections of the fusiform gyri with the rest of the face network were altered, and these brain changes were related to Cataract participants’ performance on the face discrimination task. These results provide evidence that early visual input is necessary to set up or preserve activity and functional connectivity in the face-processing network that will later mediate expert face processing. & 2014 Elsevier Ltd. All rights reserved. 1. Introduction Adults are experts at recognizing the identity of faces despite changes in viewpoint, lighting, or facial expression, while at the same time being adept at detecting age, race, emotional expres- sion and direction of gaze. This expertise appears to arise from processing faces, unlike objects, as holistic gestalts and from being exquisitely sensitive to the location of features within the face and to the shape of individual facial features (Maurer, Le Grand, & Mondloch, 2002). By adulthood, all these skills are better for upright than for inverted faces, a pattern suggesting that they are tuned by experience differentiating individuals in real world interactions (Hole, 1994; Mondloch, Le Grand, & Maurer, 2002, 2003b; Young, Hellawell, & Hay, 1987). Converging evidence for a role of experience comes from the findings that holistic processing is stronger for own-race and own-species faces than for the faces of other races or most other species (Michel, Rossion, Han, Chung, & Caldara, 2006; Tanaka, Kiefer, & Bukach, 2004; Taubert, 2009) and that sensitivity to feature spacing is better for human faces than for monkey faces, other-race faces and houses (Mondloch, Maurer, & Ahola, 2006; Mondloch et al., 2010a; Robbins, Shergill, Maurer, & Lewis, 2011). At birth, infants’ attention is drawn toward faces but that preference is mediated, at least in part, by general structural properties, such as top-heaviness and congruency, rather than an innate face module (Simion, Leo, Turati, Valenza, & Dalla Barba, 2007). Already at birth infants can discriminate two faces, likely making use of featural differences (Turati, Macchi Cassia, Simion, & Leo, 2006). During infancy, rudimentary versions of the skills underlying adult expertise emerge: holistic processing by 3 months of age (Turati, Valenza, Leo, & Simion, 2005) and sensitivity to large differences in feature spacing by 5 months of age (Bhatt, Bertin, Hayden, & Reed, 2005; Hayden, Bhatt, Reed, Corbly, & Joseph, 2007), the emergence of which has already been shaped by experience because it is manifest for human and monkey upright faces but not inverted faces or houses (Zieber et al., 2013). However, recognition of facial identity continues to improve into adolescence, with improvements in recognition of a face in a novel point of view or lighting (de Heering, Rossion, & Maurer, 2012; Contents lists available at ScienceDirect journal homepage: www.elsevier.com/locate/neuropsychologia Neuropsychologia http://dx.doi.org/10.1016/j.neuropsychologia.2014.03.005 0028-3932/& 2014 Elsevier Ltd. All rights reserved. n Correspondence to: Rotman Research Institute at Baycrest, 3560 Bathurst St., Toronto, Ontario M6A 2E1, Canada. Tel.: þ1 416 785 2500x3525. E-mail address: [email protected](C.L. Grady). Neuropsychologia 57 (2014) 122–139
Transcript
Early visual deprivation from congenital cataracts disrupts activity andfunctional connectivity in the face network
Cheryl L. Grady a,n, Catherine J. Mondloch b, Terri L. Lewis c,d, Daphne Maurer c,d
a Rotman Research Institute at Baycrest, Departments of Psychiatry and Psychology, University of Toronto, Toronto, Ontario, Canadab Department of Psychology, Brock University, St. Catharines, Ontario, Canadac Department of Psychology, Neuroscience & Behaviour, McMaster University, Hamilton, Ontario, Canadad Department of Ophthalmology and Vision Sciences, The Hospital for Sick Children, Toronto, Ontario, Canada
a r t i c l e i n f o
Article history:Received 9 July 2013Received in revised form9 March 2014Accepted 13 March 2014Available online 20 March 2014
Keywords:Face processingDevelopmentFunctional magnetic resonance imagingFusiform gyrusVisual deprivation
a b s t r a c t
The development of the face-processing network has been examined with functional neuroimaging, butthe effect of visual deprivation early in life on this network is not known. We examined this question in agroup of young adults who had been born with dense, central cataracts in both eyes that blocked allvisual input to the retina until the cataracts were removed during infancy. We used functional magneticresonance imaging to examine regions in the “core” and “extended” face networks as participantsviewed faces and other objects, and performed a face discrimination task. This task required matchingfaces on the basis of facial features or on the spacing between the facial features. The Cataract group(a) had reduced discrimination performance on the Spacing task relative to Controls; (b) used the samebrain regions as Controls when passively viewing faces or making judgments about faces, but showedreduced activation during passive viewing of faces, especially in extended face-network regions; and(c) unlike Controls, showed activation in face-network regions for objects. In addition, the functionalconnections of the fusiform gyri with the rest of the face network were altered, and these brain changeswere related to Cataract participants’ performance on the face discrimination task. These results provideevidence that early visual input is necessary to set up or preserve activity and functional connectivity inthe face-processing network that will later mediate expert face processing.
& 2014 Elsevier Ltd. All rights reserved.
1. Introduction
Adults are experts at recognizing the identity of faces despitechanges in viewpoint, lighting, or facial expression, while at thesame time being adept at detecting age, race, emotional expres-sion and direction of gaze. This expertise appears to arise fromprocessing faces, unlike objects, as holistic gestalts and from beingexquisitely sensitive to the location of features within the face andto the shape of individual facial features (Maurer, Le Grand, &Mondloch, 2002). By adulthood, all these skills are better forupright than for inverted faces, a pattern suggesting that theyare tuned by experience differentiating individuals in real worldinteractions (Hole, 1994; Mondloch, Le Grand, & Maurer, 2002,2003b; Young, Hellawell, & Hay, 1987). Converging evidence for arole of experience comes from the findings that holistic processingis stronger for own-race and own-species faces than for the facesof other races or most other species (Michel, Rossion, Han, Chung,
& Caldara, 2006; Tanaka, Kiefer, & Bukach, 2004; Taubert, 2009)and that sensitivity to feature spacing is better for human facesthan for monkey faces, other-race faces and houses (Mondloch,Maurer, & Ahola, 2006; Mondloch et al., 2010a; Robbins, Shergill,Maurer, & Lewis, 2011).
At birth, infants’ attention is drawn toward faces but thatpreference is mediated, at least in part, by general structuralproperties, such as top-heaviness and congruency, rather than aninnate face module (Simion, Leo, Turati, Valenza, & Dalla Barba,2007). Already at birth infants can discriminate two faces, likelymaking use of featural differences (Turati, Macchi Cassia, Simion, &Leo, 2006). During infancy, rudimentary versions of the skillsunderlying adult expertise emerge: holistic processing by 3monthsof age (Turati, Valenza, Leo, & Simion, 2005) and sensitivity tolarge differences in feature spacing by 5 months of age (Bhatt,Bertin, Hayden, & Reed, 2005; Hayden, Bhatt, Reed, Corbly, &Joseph, 2007), the emergence of which has already been shaped byexperience because it is manifest for human and monkey uprightfaces but not inverted faces or houses (Zieber et al., 2013).However, recognition of facial identity continues to improve intoadolescence, with improvements in recognition of a face in a novelpoint of view or lighting (de Heering, Rossion, & Maurer, 2012;
Mondloch, Geldart, Maurer, & Le Grand, 2003a), in sensitivity todifferences in feature spacing (Mondloch et al., 2003a), and in themagnitude of differential sensitivity to upright versus invertedfaces (de Heering et al., 2012; Robbins, Maurer, Hatry, Anzures, &Mondloch, 2012). The cause of the late changes may arise fromadditional experience individuating upright faces of one’s ownrace or from more general improvements in attention and cogni-tion that impact performance on the measurement tools (Crookes& McKone, 2009). The late maturation of the neural correlates ofadults’ expertise, e.g., the N170 in event-related potentials (Taylor,Batty, & Itier, 2004) and the face-specific activation in the fusiformgyrus in fMRI studies (see below) suggest that at least some of thebehavioral changes during adolescence are face-specific.
When visual input is missing during infancy because of bilateralcongenital cataracts, the adult pattern of expertise for face processingfails to emerge later in development. Such individuals are normal atdetecting the structure of a face (Mondloch et al., 2003b, 2013) anddiscriminate with normal accuracy between faces differing in theshape of their features (de Heering & Maurer, 2014; Le Grand,Mondloch, Maurer, & Brent, 2001; Mondloch, Robbins, & Maurer,2010b). However, they fail to show evidence of holistic processingduring childhood (Le Grand, Mondloch, Maurer, & Brent, 2004), andeven as adults have difficulty discriminating upright faces that differonly in feature spacing (de Heering & Maurer, 2014; Le Grand et al.,2001; Robbins, Nishimura, Mondloch, Lewis, & Maurer, 2010). Incontrast, they are normal at discriminating feature spacing ininverted faces, monkey faces, and houses (de Heering & Maurer,2014; Le Grand et al., 2001; Robbins et al., 2010). Perhaps as a resultof these perceptual deficits, even as adults they have difficultyrecognizing faces with an altered point of view (de Heering &Maurer, 2014; Geldart, Mondloch, Maurer, de Schonen, & Brent,2002) and are poor at recognizing famous faces or faces recentlylearned in the lab (de Heering & Maurer, 2014). Additional evidencecomes from the findings of less-than-normal shifts in perception inadaptation paradigms designed to test for norm-based coding(Nishimura, Maurer, Jeffery, & Rhodes, unpublished data) and fordifferential representation of upright and inverted faces (Robbinset al., 2012), and from evidence that normal face detection isaccompanied by abnormally large P1 and N170 responses(Mondloch et al., 2013; but see Roder, Ley, Shenoy, Kekunnaya, &Bottari, 2013, for evidence of an absence of a face-specific N170 in asample with much longer deprivation). This pattern of deficitssuggests that early visual input may be necessary to set up theneural architecture underlying adults’ face expertise. When that inputis missing, people may have to rely on alternate pathways not as wellsuited to face expertise or on the normal, but damaged, pathways.The purpose of the current experiment was to use functionalmagnetic resonance imaging (fMRI) to assess those alternatives whileadults with a history of early visual deprivation watched faces versusother categories and while they discriminated faces based on featureshape (a task on which they perform normally) or based on featurespacing (a task on which they have large deficits).
Previous fMRI studies of adults’ ability to process faces indicatethat this ability is mediated by activity in a variety of brain regions,particularly those in ventral occipito-temporal cortex. These stu-dies have identified a region in the fusiform gyrus that respondsmore robustly to faces than to other types of visual stimuli (e.g.,Downing, Chan, Peelen, Dodds, & Kanwisher, 2006; Grill-Spector,Knouf, & Kanwisher, 2004; Haxby et al., 1994; Kanwisher,McDermott, & Chun, 1997). This area has come to be known asthe fusiform face area, or FFA. The magnitude of activity in FFAdepends both on whether attention is directed to the faces(O'Craven, Downing, & Kanwisher, 1999; Wojciulik, Kanwisher, &Driver, 1998) and on the task demands involved in processingthem (Druzgal & D'Esposito, 2003; Ishai & Yago, 2006; Lee, Anaki,Grady, & Moscovitch, 2012; Nestor, Vettel, & Tarr, 2008).
Despite agreement that the FFA is especially sensitive to faces,there has been considerable debate as to its precise role in faceprocessing, including whether it is truly selective for faces, orrather mediates the differentiation of objects with which one hasdeveloped an expertise (Gauthier, Skudlarski, Gore, & Anderson,2000; Gauthier, Tarr, Anderson, Skudlarski, & Gore, 1999; Grill-Spector et al., 2004; Joseph & Gathers, 2002). There is evidence ofFFA involvement in both holistic (Schiltz, Dricot, Goebel, & Rossion,2010; Schiltz & Rossion, 2006) and part-based face processing(Yovel & Kanwisher, 2004). Although there is considerable evi-dence that the FFA is specialized for representing face identity(Grill-Spector et al., 2004; Mazard, Schiltz, & Rossion, 2006;Nestor, Plaut, & Behrmann, 2011; Nestor et al., 2008; Rhodes,Byatt, Michie, & Puce, 2004), some have argued that the FFA isinvolved in the individuation of non-face objects (Haist, Lee, &Stiles, 2010). There are also regions adjacent to FFA in the fusiformgyrus that appear to be involved in some aspects of face proces-sing (Maurer et al., 2007b; Schiltz et al., 2010).
Despite the focus on the FFA, face processing in the brain goesquite a way beyond this one region. In addition to the FFA, visualrepresentation of faces involves a region in posterior occipitalcortex (the occipital face area, or OFA), thought to provide input toFFA (Nichols, Betts, & Wilson, 2010; Rossion et al. 2003), and thesuperior temporal sulcus (STS), which is involved in the processingof eye gaze (Hoffman & Haxby, 2000; Itier & Batty, 2009). Otherregions that are thought to primarily represent non-face objects,such as the lateral occipital region (Grill-Spector, Kushnir,Edelman, Itzchak, & Malach, 1998; Malach et al. 1995), also showactivity related to face processing (Axelrod & Yovel, 2012; Haxby etal., 2001; Natu, Raboy, & O'Toole, 2011). Indeed, there is evidencethat distinct patterns of activity across the entire ventral occipito-temporal cortex can be used to predict when participants areviewing faces (Haxby et al., 2001). One recent model of faceprocessing (Gobbini & Haxby, 2007) proposes that there is a “core”system concerned with the visual analysis of faces, and an“extended” system for extracting person knowledge and proces-sing the emotional and reward aspects of faces. The core systemincludes the occipital and temporal areas that are sensitive to facestimuli (FFA, OFA, and STS), whereas the emotional part of theextended system includes the amygdala, insula, and striatum, all ofwhich have been implicated in emotion or reward (e.g., Adolphs,Tranel, Damasio, & Damasio, 1994; Haber & Knutson, 2010; Lane,Reiman, Ahern, Schwartz, & Davidson, 1997; Phillips et al., 1997).The person-knowledge segment of the extended system consistsof the anterior temporal cortex, medial prefrontal cortex, andmedial parietal/posterior cingulate cortex (PCC), regions involvedin personal semantics, self-reference and theory of mind (Graham,Lee, Brett, & Patterson, 2003; Grigg & Grady, 2010a; Northoff &Bermpohl, 2004; Spreng & Grady, 2010). In this model, the coresystem provides input to the two parts of the extended system,which in turn modulate the activation of the core system throughfeedback. Although this model does not include frontal regions,other work (Fairhall & Ishai, 2007; Ishai, Schmidt, & Boesiger,2005) has suggested that the inferior frontal gyrus (IFG) andorbitofrontal cortex (OFC) should be considered as a part of theextended face network. The IFG may be involved in the semanticprocessing of faces (Ishai, Haxby, & Ungerleider, 2002; Leveroni etal., 2000) whereas the OFC is involved in reward, decision makingand top down processing of faces (Fellows, 2007; Li et al., 2010;Rolls, 2000). Studies assessing functional connectivity of theseregions, including the frontal areas, have provided further evi-dence for the idea that face processing is supported by aninteracting network of regions (Fairhall & Ishai, 2007; Li et al.,2010; McIntosh et al., 1994).
Developmental neuroimaging studies have shown that theareas of ventral occipital cortex are responsive to faces even in
C.L. Grady et al. / Neuropsychologia 57 (2014) 122–139 123
infants (Tzourio-Mazoyer et al., 2002), although the response inthese areas is less specific during infancy than at older ages.Activity in core network regions increases during development,being lower and less extensive in children and adolescents,relative to young adults (Cohen Kadosh, Cohen Kadosh, Dick, &Johnson, 2011; Golarai, Liberman, Yoon, & Grill-Spector, 2010;Haist, Adamo, Han Wazny, Lee, & Stiles, 2013). Functional con-nectivity within the core system also changes during development(Haist et al., 2013; Joseph et al., 2012) and is less sensitive to taskmanipulations in children than in young adults (Cohen Kadosh etal., 2011), indicating that maturation of both mean activity andconnectivity parallels the development of face processing abilities.
In the current study, we examined the influence of congenitalcataracts on brain activity during face processing, with a particularfocus on regions previously described as core and extended faceprocessing areas. We used fMRI to study a group of young adultswho had been born with dense, central cataracts in both eyes thatblocked all visual input to the retina until the cataracts wereremoved during infancy and the eyes given compensatory contactlenses. Compared to age-matched Controls, we expected largergroup differences when faces were being viewed, relative to otherkinds of objects. Also since congenital cataracts have larger effectson face processing based on spacing among facial features ratherthan on the features themselves (Maurer, Mondloch, & Lewis,2007a; Mondloch et al., 2010b), we expected that the areasinvolved in processing the spacing of features should show largergroup differences than areas involved when face discriminationwas based on the features per se. In addition to this examination oftask-related activity, we also assessed functional connectivity inthe two groups to determine if face sensitive regions in thefusiform gyrus would show disrupted connectivity (i.e., correlatedactivity) with other areas in the face network. Given evidence thatdeprivation of the right hemisphere is critical for face processingdeficits after congenital cataracts (Le Grand, Mondloch, Maurer, &Brent, 2003), we predicted that the right fusiform gyrus wouldshow reduced functional connectivity with other face networkregions in individuals with congenital cataracts, which might beaccompanied by increased strength of connections involving theleft fusiform gyrus. We considered all of our results in the contextof the core and extended components of the face network todetermine if the influence of cataracts on face processing liesmainly in core regions, which would suggest a primary effect onface perception, or areas in the extended system, which mightindicate an effect on the transfer of information to, or feedbackfrom, these areas and the core.
2. Methods
2.1. Participants
Fourteen healthy Controls participated in the experiment. All (10 females, fourmales, mean age¼22.7 years) were Caucasian, right-handed (score 445 on theMcMaster Handedness Questionnaire, a modified version of the Edinburgh Hand-edness Questionnaire, Mondloch et al., 2002) and had an average of 16.6 years ofeducation. Each had normal or corrected-to-normal linear letter acuity tested withthe Lighthouse Visual Acuity chart and normal stereo-acuity as measured by theTitmus test. None of the participants took medications that might affect brainfunction, and none had overt brain abnormalities revealed by a structural MRI scanobtained during the same session.
Ten young adults with bilateral cataracts at birth (all removed within the firstyear) also participated. All were Caucasian and all but one were right-handed(four females, six males). The duration of the deprivation from birth untilcompensatory contact lens fitting after surgery ranged from 64 to 237 days(M¼143 days). At the time of the scan, the Cataract group had a mean age of22.4 years, and had an average of 14.2 years of education. The acuity in the bettereye ranged from 20/25 to 20/100. As with the Controls, none of the bilateral grouphad overt brain abnormalities revealed by a structural MRI scan.
The Ethics Committees of Baycrest, Sunnybrook Health Science Centre, TheHospital for Sick Children, and McMaster University approved this experiment andeach participant gave informed consent.
2.2. Stimuli and tasks
For the Localizer task, participants viewed 24-s blocks of gray-scale photo-graphs from each of three categories: faces, houses, and common householdobjects. Viewing was passive, and no response to the stimuli was required.
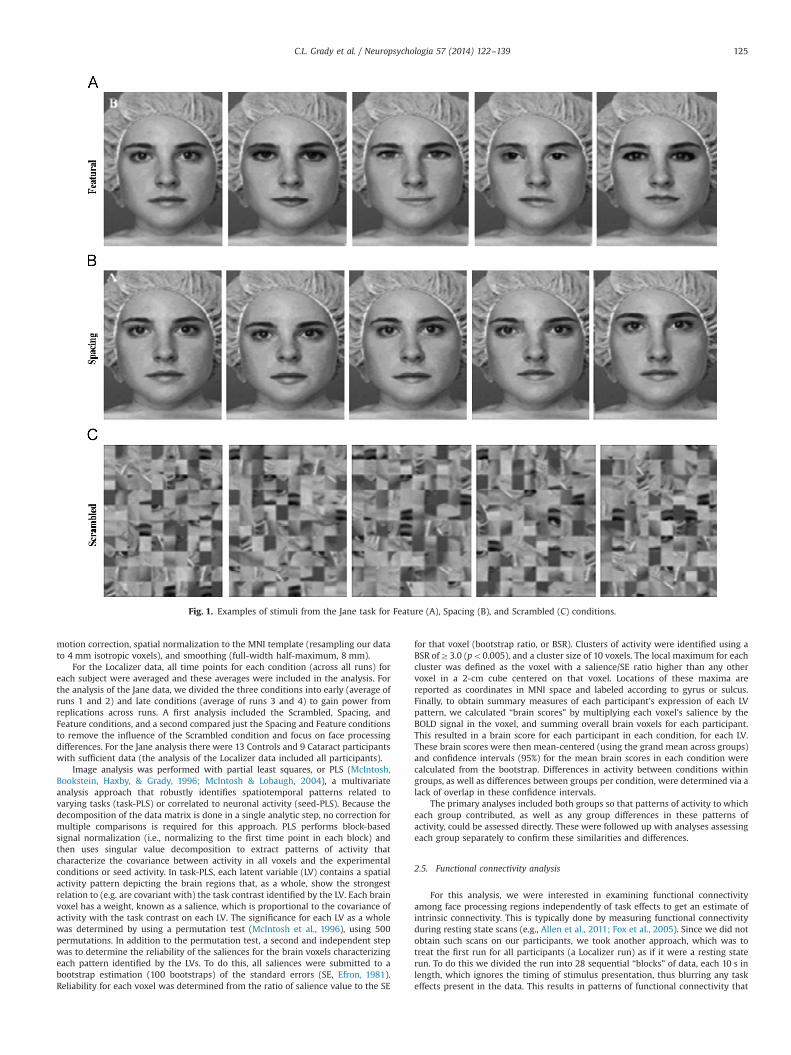
The stimuli for the Jane task were identical to those described previously in ourbehavioral studies (Le Grand et al., 2001; Mondloch et al., 2002). Briefly, gray scaledigitized images of Caucasian female faces were taken under standard lighting.A photograph of a single face (called “Jane”) was modified with Adobe Photoshop tocreate eight new versions (“Jane’s sisters”). The four modified faces in the featuralset were created by replacing the model’s eyes and mouth with the features of thesame length from different females. On every “different” trial, the two faces haddifferent eyes and mouth. The four modified faces in the spacing set were createdby moving the eyes of the original face up, down, closer together, or farther apart,and the mouth up or down. We used all possible combinations of the five faces;because there were only two mouth positions, on 20% of the different trials themouth was in the same location in the two faces and only the location of the eyesdiffered. According to anthropomorphic norms (Farkas, 1981), the movementscorrespond to shifts in Jane’s eyes of 1.3 SDs up or down, of 2.4 SDs closer together,or of 3.2 SDs farther apart, and shifts of Jane’s mouth by 0.79 SDs up or down. Thus,the differences covered most of the variations in spacing among adult female facesin the population, without being so large that the faces appeared deformed orunnatural. Control stimuli consisted of scrambled Jane images created using customMATLAB software. The original images were cut digitally into 20 � 20 pixelsections and reassigned randomly to positions in the display. Edges between thepieces were smoothed by convolving a Gaussian filter with the scrambled image(see Fig. 1 for examples of the stimuli).
2.3. Procedure
Prior to the experimental session, participants practiced the task outside theMRI scanner. They were shown Jane and her sisters and told that they would seeone of the faces flash quickly on the screen followed by another face. They wereinstructed to press a key with the index finger if the second face matched the firstface and to press with the middle finger if the two faces were different. The speedof responding was emphasized in addition to accuracy. Participants also practicedmaking same/different judgments about the scrambled images.
After the practice session, participants were positioned in the MRI scanner withtheir head stabilized with snug foam cushions. They were fitted with MRI-compatible Silent Vision Goggles (Avotec Inc.), which were adjusted to correctvision (up to 6 diopters) independently for each eye. Following anatomical scans,two or three 5-min functional Localizer scans were performed during which eachpicture in the 24-s block of faces, houses or objects was presented for 1900 ms,with an ISI of 100 ms. Each Localizer run consisted of three sequences of an 8-sfixation block, followed by object/house/face blocks (with stimulus-block ordercounterbalanced), followed by a final fixation block. The instructions given duringthe practice session were repeated before the first run. In the Jane task each trialconsisted of the presentation of the first face for 200 ms, an inter-stimulus intervalof 300 ms, followed by the second face for 1500 ms, with no inter-trial interval.On half the trials, the correct response was “different.” Conditions (Spacing,Featural, or Scrambled) were blocked with 22 trials in each block. Blocks lasted45 s each and were presented in a fixed order during each run (scrambled, spacing,feature, spacing, feature, scrambled, spacing, feature, spacing, feature, scrambled).Trial types were segregated to allow time for each style of processing to emerge,but the subjects were not explicitly informed about the distinctions. Each Jane runlasted 495 s, and participants performed three to five runs, resulting in a total of540–900 s of data from each of the three face tasks across the runs. Responses werecollected through a RURB (Rowland Universal Response Box, Rowland Institute forScience, Cambridge, MA).
Imaging was performed with a 1.5 T whole-body GE Signa MRI scanner with astandard head coil (CV/i hardware, LX8.3 software; General Electric Medical Systems,Waukesha, WI). During the functional scans, the blood oxygenation level dependent(BOLD) MRI signal was measured in 26 5 mm slices (no gap). The imaging sequencewas a single shot T2*-weighted pulse sequence with spiral readout, offline gridding,and reconstruction (TR¼2000 ms, TE¼40 ms, flip angle 801). Structural scans wereobtained prior to task performance by using a 3D T1-weighted pulse sequence(TR¼35.0 ms, TE¼6.0 ms, flip angle 351, 22 � 16.5 field of view, 124 axial slices,1.4-mm thick). For the functional scans, the in-plane resolution was 3 mm � 3 mmand the slice thickness was 5 mm.
2.4. Image processing and task analysis
Preprocessing of the fMRI data was performed with AFNI (Cox, 1996) andconsisted of physiological motion correction (Glover, Li, & Ress, 2000), rigid-body
C.L. Grady et al. / Neuropsychologia 57 (2014) 122–139124
motion correction, spatial normalization to the MNI template (resampling our datato 4 mm isotropic voxels), and smoothing (full-width half-maximum, 8 mm).
For the Localizer data, all time points for each condition (across all runs) foreach subject were averaged and these averages were included in the analysis. Forthe analysis of the Jane data, we divided the three conditions into early (average ofruns 1 and 2) and late conditions (average of runs 3 and 4) to gain power fromreplications across runs. A first analysis included the Scrambled, Spacing, andFeature conditions, and a second compared just the Spacing and Feature conditionsto remove the influence of the Scrambled condition and focus on face processingdifferences. For the Jane analysis there were 13 Controls and 9 Cataract participantswith sufficient data (the analysis of the Localizer data included all participants).
Image analysis was performed with partial least squares, or PLS (McIntosh,Bookstein, Haxby, & Grady, 1996; McIntosh & Lobaugh, 2004), a multivariateanalysis approach that robustly identifies spatiotemporal patterns related tovarying tasks (task-PLS) or correlated to neuronal activity (seed-PLS). Because thedecomposition of the data matrix is done in a single analytic step, no correction formultiple comparisons is required for this approach. PLS performs block-basedsignal normalization (i.e., normalizing to the first time point in each block) andthen uses singular value decomposition to extract patterns of activity thatcharacterize the covariance between activity in all voxels and the experimentalconditions or seed activity. In task-PLS, each latent variable (LV) contains a spatialactivity pattern depicting the brain regions that, as a whole, show the strongestrelation to (e.g. are covariant with) the task contrast identified by the LV. Each brainvoxel has a weight, known as a salience, which is proportional to the covariance ofactivity with the task contrast on each LV. The significance for each LV as a wholewas determined by using a permutation test (McIntosh et al., 1996), using 500permutations. In addition to the permutation test, a second and independent stepwas to determine the reliability of the saliences for the brain voxels characterizingeach pattern identified by the LVs. To do this, all saliences were submitted to abootstrap estimation (100 bootstraps) of the standard errors (SE, Efron, 1981).Reliability for each voxel was determined from the ratio of salience value to the SE
for that voxel (bootstrap ratio, or BSR). Clusters of activity were identified using aBSR ofZ3.0 (po0.005), and a cluster size of 10 voxels. The local maximum for eachcluster was defined as the voxel with a salience/SE ratio higher than any othervoxel in a 2-cm cube centered on that voxel. Locations of these maxima arereported as coordinates in MNI space and labeled according to gyrus or sulcus.Finally, to obtain summary measures of each participant’s expression of each LVpattern, we calculated “brain scores” by multiplying each voxel’s salience by theBOLD signal in the voxel, and summing overall brain voxels for each participant.This resulted in a brain score for each participant in each condition, for each LV.These brain scores were then mean-centered (using the grand mean across groups)and confidence intervals (95%) for the mean brain scores in each condition werecalculated from the bootstrap. Differences in activity between conditions withingroups, as well as differences between groups per condition, were determined via alack of overlap in these confidence intervals.
The primary analyses included both groups so that patterns of activity to whicheach group contributed, as well as any group differences in these patterns ofactivity, could be assessed directly. These were followed up with analyses assessingeach group separately to confirm these similarities and differences.
2.5. Functional connectivity analysis
For this analysis, we were interested in examining functional connectivityamong face processing regions independently of task effects to get an estimate ofintrinsic connectivity. This is typically done by measuring functional connectivityduring resting state scans (e.g., Allen et al., 2011; Fox et al., 2005). Since we did notobtain such scans on our participants, we took another approach, which was totreat the first run for all participants (a Localizer run) as if it were a resting staterun. To do this we divided the run into 28 sequential “blocks” of data, each 10 s inlength, which ignores the timing of stimulus presentation, thus blurring any taskeffects present in the data. This results in patterns of functional connectivity that
Fig. 1. Examples of stimuli from the Jane task for Feature (A), Spacing (B), and Scrambled (C) conditions.
C.L. Grady et al. / Neuropsychologia 57 (2014) 122–139 125
closely resemble those calculated from “true” resting state scans (Grigg & Grady,2010b), and similar approaches have been used by others (Al-Aidroos, Said, & Turk-Browne, 2012). For our purposes here, we assessed functional connectivity of twofusiform gyrus regions based on their proximity to the right and left FFA, as definedin the literature (see Supplementary Table 1 for an average estimate of FFAlocation). The seed coordinates were obtained from an LV identified by the task-PLS analysis of the Localizer, which showed a group difference in face-specificactivity (see Table 2b, results for LV2). The aim of this analysis was to test the ideathat cataracts would alter the functional connectivity of these regions with otherareas in the face network. For this analysis, we included both regions (or seeds) andboth groups because we wanted to determine the common set of regions thatwould be functionally connected with the two seeds in the groups, as well as thegroup differences in the strength of functional connections in this network.
For this analysis, we used seed PLS, which involved extracting the mean signalfor each seed voxel from the 28 “blocks” in the first scan, and correlating thesevalues with the mean signal in all other brain voxels, across participants in eachgroup. These correlations (one for each block) were then compared across blocksand groups; this analysis was data-driven, as were the task analyses. The first LVidentified a common network that was strongly correlated with both seeds in bothgroups, and it is this pattern that we report here. To provide a measure of howstrongly seed activity covaried with the whole-brain pattern of activity, correlationsbetween brain scores and seed activity were computed for each group, for eachblock. We compared the distribution of the correlations across the 28 blocksbetween groups using t-tests (note that the same results were obtained with t-testsafter converting the r values to Z values using a Fisher transformation, and whenusing an independent samples non-parametric test), and the correlation strengthbetween right/left seeds within each group with paired t-tests. Because this type ofcorrelation analysis is sensitive to outliers, one cataract participant who was shownto be an outlier in preliminary analyses was omitted. To assess functionalconnectivity of these fusiform regions in a “true” resting state for comparison,we carried out a similar analysis in an independent group of 45 healthy youngadults, who were scanned at rest in other experiments (Campbell, Grady, Ng, &Hasher, 2012; Campbell, Grigg, Saverino, Churchill, & Grady, 2013; Grigg & Grady,2010a), using the same two seed regions.
3. Results
3.1. Behavioral data
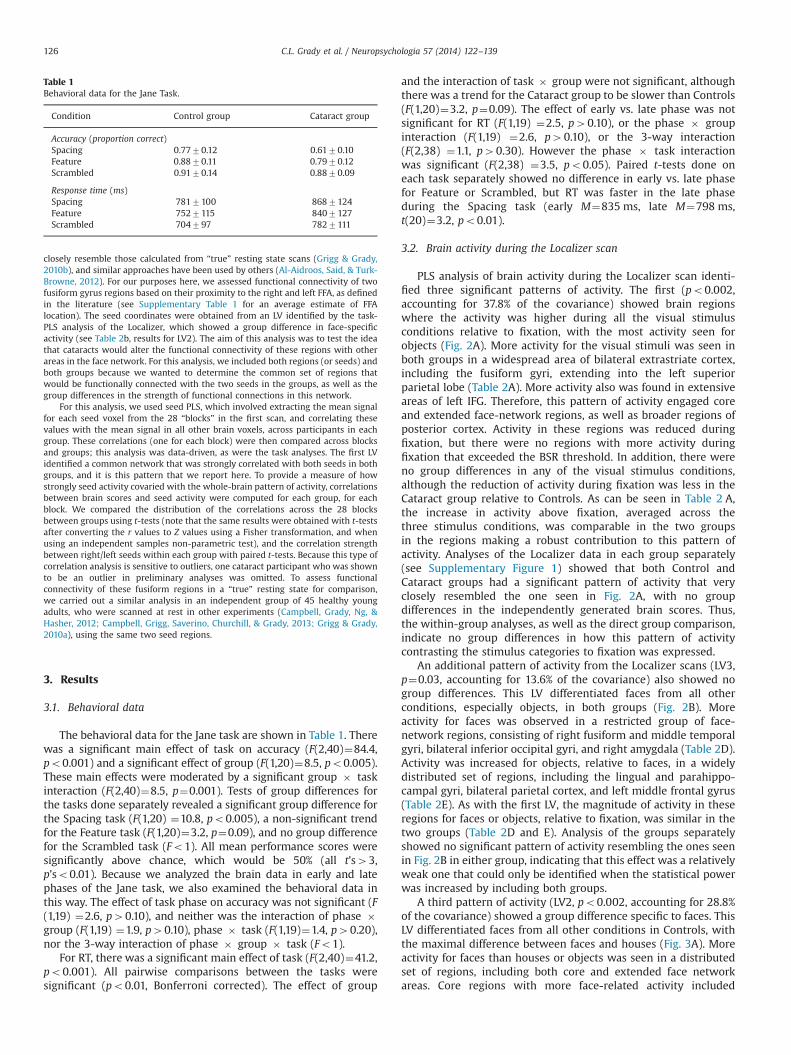
The behavioral data for the Jane task are shown in Table 1. Therewas a significant main effect of task on accuracy (F(2,40)¼84.4,po0.001) and a significant effect of group (F(1,20)¼8.5, po0.005).These main effects were moderated by a significant group � taskinteraction (F(2,40)¼8.5, p¼0.001). Tests of group differences forthe tasks done separately revealed a significant group difference forthe Spacing task (F(1,20) ¼10.8, po0.005), a non-significant trendfor the Feature task (F(1,20)¼3.2, p¼0.09), and no group differencefor the Scrambled task (Fo1). All mean performance scores weresignificantly above chance, which would be 50% (all t’s43,p’so0.01). Because we analyzed the brain data in early and latephases of the Jane task, we also examined the behavioral data inthis way. The effect of task phase on accuracy was not significant (F(1,19) ¼2.6, p40.10), and neither was the interaction of phase �group (F(1,19) ¼1.9, p40.10), phase � task (F(1,19)¼1.4, p40.20),nor the 3-way interaction of phase � group � task (Fo1).
For RT, there was a significant main effect of task (F(2,40)¼41.2,po0.001). All pairwise comparisons between the tasks weresignificant (po0.01, Bonferroni corrected). The effect of group
and the interaction of task � group were not significant, althoughthere was a trend for the Cataract group to be slower than Controls(F(1,20)¼3.2, p¼0.09). The effect of early vs. late phase was notsignificant for RT (F(1,19) ¼2.5, p40.10), or the phase � groupinteraction (F(1,19) ¼2.6, p40.10), or the 3-way interaction(F(2,38) ¼1.1, p40.30). However the phase � task interactionwas significant (F(2,38) ¼3.5, po0.05). Paired t-tests done oneach task separately showed no difference in early vs. late phasefor Feature or Scrambled, but RT was faster in the late phaseduring the Spacing task (early M¼835 ms, late M¼798 ms,t(20)¼3.2, po0.01).
3.2. Brain activity during the Localizer scan
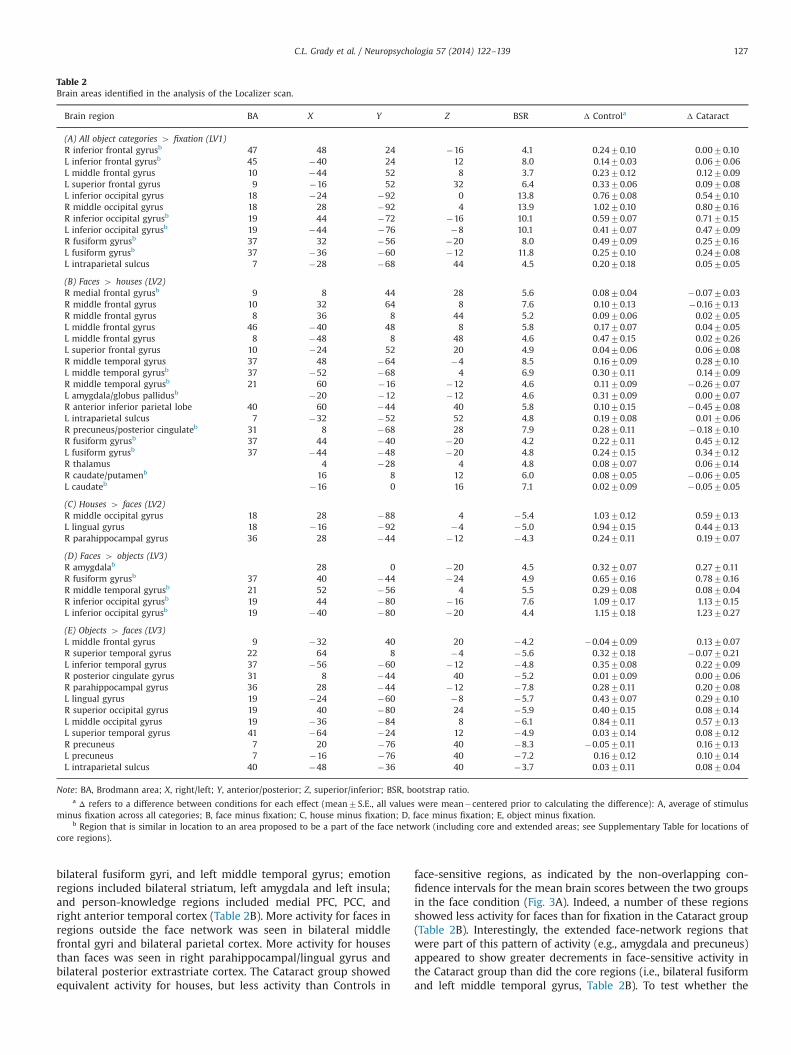
PLS analysis of brain activity during the Localizer scan identi-fied three significant patterns of activity. The first (po0.002,accounting for 37.8% of the covariance) showed brain regionswhere the activity was higher during all the visual stimulusconditions relative to fixation, with the most activity seen forobjects (Fig. 2A). More activity for the visual stimuli was seen inboth groups in a widespread area of bilateral extrastriate cortex,including the fusiform gyri, extending into the left superiorparietal lobe (Table 2A). More activity also was found in extensiveareas of left IFG. Therefore, this pattern of activity engaged coreand extended face-network regions, as well as broader regions ofposterior cortex. Activity in these regions was reduced duringfixation, but there were no regions with more activity duringfixation that exceeded the BSR threshold. In addition, there wereno group differences in any of the visual stimulus conditions,although the reduction of activity during fixation was less in theCataract group relative to Controls. As can be seen in Table 2 A,the increase in activity above fixation, averaged across thethree stimulus conditions, was comparable in the two groupsin the regions making a robust contribution to this pattern ofactivity. Analyses of the Localizer data in each group separately(see Supplementary Figure 1) showed that both Control andCataract groups had a significant pattern of activity that veryclosely resembled the one seen in Fig. 2A, with no groupdifferences in the independently generated brain scores. Thus,the within-group analyses, as well as the direct group comparison,indicate no group differences in how this pattern of activitycontrasting the stimulus categories to fixation was expressed.
An additional pattern of activity from the Localizer scans (LV3,p¼0.03, accounting for 13.6% of the covariance) also showed nogroup differences. This LV differentiated faces from all otherconditions, especially objects, in both groups (Fig. 2B). Moreactivity for faces was observed in a restricted group of face-network regions, consisting of right fusiform and middle temporalgyri, bilateral inferior occipital gyri, and right amygdala (Table 2D).Activity was increased for objects, relative to faces, in a widelydistributed set of regions, including the lingual and parahippo-campal gyri, bilateral parietal cortex, and left middle frontal gyrus(Table 2E). As with the first LV, the magnitude of activity in theseregions for faces or objects, relative to fixation, was similar in thetwo groups (Table 2D and E). Analysis of the groups separatelyshowed no significant pattern of activity resembling the ones seenin Fig. 2B in either group, indicating that this effect was a relativelyweak one that could only be identified when the statistical powerwas increased by including both groups.
A third pattern of activity (LV2, po0.002, accounting for 28.8%of the covariance) showed a group difference specific to faces. ThisLV differentiated faces from all other conditions in Controls, withthe maximal difference between faces and houses (Fig. 3A). Moreactivity for faces than houses or objects was seen in a distributedset of regions, including both core and extended face networkareas. Core regions with more face-related activity included
Response time (ms)Spacing 7817100 8687124Feature 7527115 8407127Scrambled 704797 7827111
C.L. Grady et al. / Neuropsychologia 57 (2014) 122–139126
bilateral fusiform gyri, and left middle temporal gyrus; emotionregions included bilateral striatum, left amygdala and left insula;and person-knowledge regions included medial PFC, PCC, andright anterior temporal cortex (Table 2B). More activity for faces inregions outside the face network was seen in bilateral middlefrontal gyri and bilateral parietal cortex. More activity for housesthan faces was seen in right parahippocampal/lingual gyrus andbilateral posterior extrastriate cortex. The Cataract group showedequivalent activity for houses, but less activity than Controls in
face-sensitive regions, as indicated by the non-overlapping con-fidence intervals for the mean brain scores between the two groupsin the face condition (Fig. 3A). Indeed, a number of these regionsshowed less activity for faces than for fixation in the Cataract group(Table 2B). Interestingly, the extended face-network regions thatwere part of this pattern of activity (e.g., amygdala and precuneus)appeared to show greater decrements in face-sensitive activity inthe Cataract group than did the core regions (i.e., bilateral fusiformand left middle temporal gyrus, Table 2B). To test whether the
Table 2Brain areas identified in the analysis of the Localizer scan.
Note: BA, Brodmann area; X, right/left; Y, anterior/posterior; Z, superior/inferior; BSR, bootstrap ratio.a Δ refers to a difference between conditions for each effect (mean7S.E., all values were mean�centered prior to calculating the difference): A, average of stimulus
minus fixation across all categories; B, face minus fixation; C, house minus fixation; D, face minus fixation; E, object minus fixation.b Region that is similar in location to an area proposed to be a part of the face network (including core and extended areas; see Supplementary Table for locations of
core regions).
C.L. Grady et al. / Neuropsychologia 57 (2014) 122–139 127
activity in the core face-network regions was maintained in theCataract group, compared to the extended network regions, weconducted a two-factor ANOVA (group and region type [core,extended]) on the mean activity for the three core regions andthe mean activity for the extended network regions (regions areindicated by asterisks in Table 2B). The group by region typeinteraction was significant (F[1,22]¼5.5, p¼0.03); follow-up t-testsshowed that the activity for core regions did not differ betweengroups (t[22]o1), but the Cataract group had significantly lessactivity for extended-network regions (t[22]¼4.5, po0.001).Finally, unlike Controls, the activity for objects was significantlyincreased above baseline in the Cataract group.
When the Control and Cataract groups were analyzed sepa-rately, each group showed a significant LV that replicated thepattern seen in the between-group analysis. In Controls theprimary contrast was between faces and houses (po0.002), aswas seen in the analysis of both groups (compare Fig. 3B to A).
In the Cataract group the largest difference in activity wasbetween objects and houses, with little contribution of faces andfixation (p¼0.004, compare Fig. 3C to A). Thus, the within-groupanalyses, as well as the between-group analysis, suggested a groupby condition interaction, such that Controls had more activity forfaces than objects, whereas the Cataract group showed theopposite. An ANOVA on the face and object brain scores fromthe between-group analysis (i.e., those seen in Fig. 3A) showed asignificant group by condition interaction (F[1,22]¼6.4, p¼0.02),confirming that the face-sensitive regions in Controls tended to bemore object-sensitive in the Cataract group.
3.3. Brain activity during the Jane task
The task-PLS analysis of data from all three conditions of theJane runs resulted in a single significant LV (po0.002, accountingfor 43.6% of the covariance). This LV identified a set of regions
Fig. 2. The result of the analysis of the Localizer scans, showing two LVs on which there were no group differences for any of the visual category conditions. (A) The warmcolored brain areas (associated with positive brain scores) are those with increased activity for objects, faces and houses relative to fixation in both groups. The graph showsthe average of the mean-centered brain scores for each condition in each group (error bars are the 95% confidence intervals, CIs). The only group difference was seen in thefixation condition (indicated by “*”). In this and all subsequent figures, non-overlapping CIs between bars indicate reliable differences in activity, whereas overlapping CIsindicate no differences. CIs that overlap with zero on the graph indicate activity that does not differ from the mean activity across all conditions and groups. (B) The warm-colored areas (associated with positive brain scores) are those with increased activity mainly for faces in both groups. Cool colored areas (associated with negative brainscores) have more activity for objects. Overlapping CIs between groups for all conditions indicate no group differences. The color bars indicate the range of BSRs shown in theimages. In this and subsequent figures the left and right hemispheres are indicated by “L” and “R”, respectively. (For interpretation of the references to color in this figurecaption, the reader is referred to the web version of this paper.)
C.L. Grady et al. / Neuropsychologia 57 (2014) 122–139128
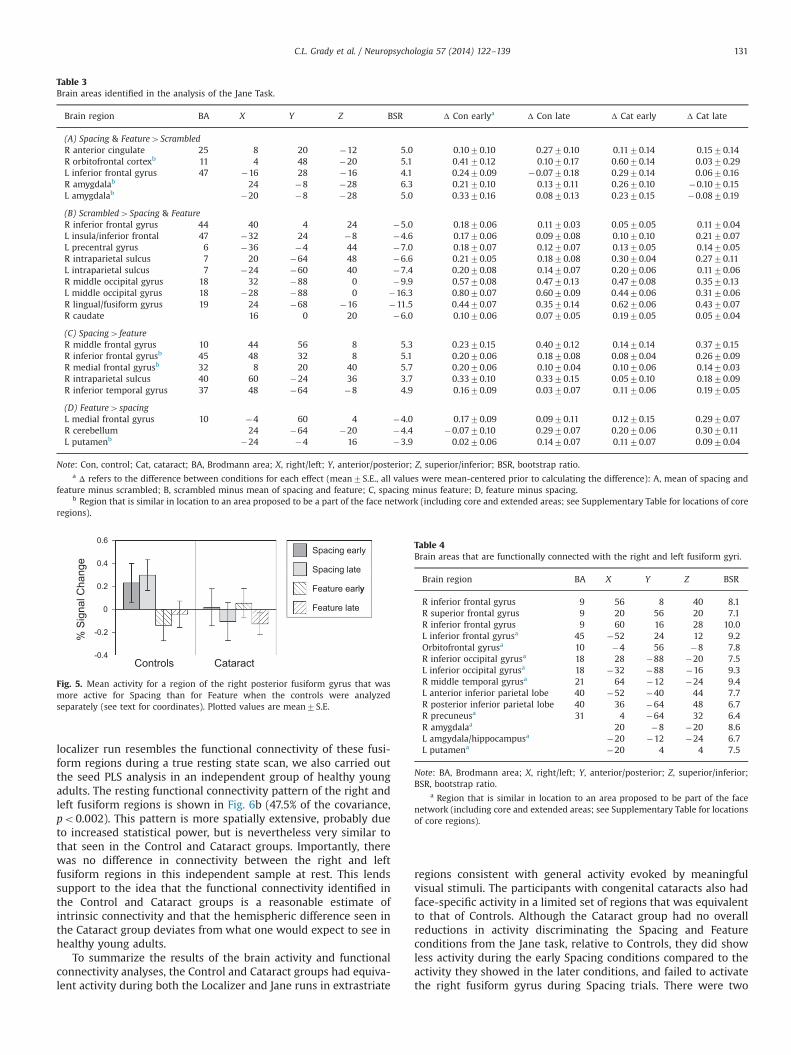
where activity differentiated the Scrambled condition from theSpacing and Feature conditions (Fig. 4a) for early and late runs inboth groups, with no group differences. There was greater activityfor scrambled faces in an extensive set of occipital and parietalregions and in left inferior frontal gyrus (see Table 3A for themagnitude of these activity increases), similar to the set of regionswith more activity for objects, houses and faces, relative tofixation, seen in Fig. 2a. This occipital activity is likely due to theincreased number of edges and “objects” seen in the scrambledimages. More activity for the Spacing and Feature conditions,relative to Scrambled, was seen only in two face network regions,ventromedial prefrontal cortex, including OFC, and bilateral amyg-dala (Fig. 4a, Table 3B). The late blocks showed reduced differencesin brain activity between the Jane and Scrambled conditionsbecause the activity during the Scrambled condition declined inboth groups over time (Fig. 4a, Table 3A and B). When the groupswere analyzed separately, significant patterns showing the sameeffect as in Fig. 4a were found, with no differences between groupsin the expression of this pattern (see Supplementary Figure 2).
When the Scrambled condition was omitted from the analysis,a single significant pattern of activity differentiating the Spacingand Feature conditions was identified (p¼0.02, accounting for26.7% of the covariance, Fig. 4b). Both the Cataract and Controlgroups showed activity that differentiated early and late Spacingconditions from the Feature conditions, and there were no groupdifferences in the expression of this pattern. However, the Cataract
group had reliably less activity in the early Spacing condition thanthe late condition, whereas Controls showed no early/late differ-ences (non-overlapping confidence intervals for early vs. lateSpacing in the Cataract group, Fig. 4b). Regions with more activityfor Spacing than for Feature were all in the right hemisphere,including frontal areas of the extended face network (IFG anddorsomedial frontal cortex, Table 3C). More activity for the Featurecondition was seen in left ventromedial prefrontal cortex, leftputamen and right cerebellum (Table 3D). When the groups wereanalyzed separately, only the Controls showed a significant patterndifferentiating the Spacing and Feature conditions (accounting for42.9% of the covariance, p¼0.01), indicating that this effect wasweaker in the Cataract group (p¼0.15), although still detectablewhen both groups were included in the analysis.
Neither the right nor left fusiform gyrus showed a Spacing/Feature difference during the Jane task. However, we probedactivity in this region further, given that in our previous study(Maurer et al., 2007b), which reported data from 10 of the controlparticipants included in the current report, we found a region inthe right posterior fusiform gyrus (within the boundary of the FFAas defined here) that was more active in Controls during theSpacing condition than during the Feature condition. To determineif the failure to find such a region in the current analysis was dueto the influence of the Cataract group, we carried out a task PLSanalysis including just the Controls. This analysis revealed a regionin the right posterior fusiform with more activity for Spacing
Fig. 3. An additional LV from the Localizer that showed a group difference for face-specific activity. (A) Warm-colored brain areas (associated with positive brain scores) arethose with more activity for faces vs. the other conditions and cool colors (associated with negative brain scores) indicate more activity for houses in Controls. For theCataract group, the activity for faces does not differ from the mean, or differ from objects, and is less than that seen in controls. There was a group difference in activity forfaces and a significant interaction of group by condition for the face and object conditions (both indicated by “*”). (B) Analysis of the Control group only, showing conditioncontrasts that closely resemble the pattern for Controls in A. (C) Analysis of the Cataract group only, showing condition contrasts that closely resemble the pattern for thisgroup in A. Error bars in the graphs are the 95% confidence intervals. (For interpretation of the references to color in this figure caption, the reader is referred to the webversion of this paper.)
C.L. Grady et al. / Neuropsychologia 57 (2014) 122–139 129
(X¼52, Y¼�60, Z¼�24, similar to our previously reportedregion: X¼56, Y¼�64, Z¼�20). When the activity from thisregion was extracted for the Cataract group, there was nodifference in activity between the Spacing and Feature conditions(Fo1, Fig. 5).
3.4. Functional connectivity of right and left fusiform gyri
The network of regions that showed positive functional con-nectivity with the right and left fusiform seeds when both groupswere included is shown in Fig. 6a (25.6% of the covariance,po0.002). This set of regions included widespread extrastriateareas, bilateral frontal cortex (including IFG and OFC), medialparietal cortex, bilateral amygdala and left striatum. This groupof regions therefore included both core face-network areas andextended areas (Table 4). Mean connectivity strength across the 28blocks of the run was positive for both seeds and both groups, anddid not differ between groups for the right fusiform seed (to1).However the connectivity strength did differ for the left fusiform
region, and was stronger in the Cataract group compared toControls (t(54)¼3.5, p¼0.001). In addition, the Cataract grouphad significantly weaker functional connectivity in the right fusi-form compared to the left (paired t(27)¼�3.4, po0.005),whereas the Control group showed no hemispheric difference(to1). Thus, this analysis identified regions with strong functionalconnections to the fusiform gyri that were common to bothgroups. Although we did not find weaker right fusiform connec-tivity in the Cataract group, relative to Controls, we did seereductions compared to their own left hemisphere connectivity,which in turn was increased relative to Controls. The groupdifference was therefore not in the regions that were functionallyconnected to the fusiform gyri, but in the strength of correlationsbetween these regions and the left fusiform region. Separatefunctional connectivity analyses in the two groups revealed verysimilar patterns of activity to that seen in Fig. 6a and almostidentical mean correlation values (see Supplementary Figure 3).
To assess whether the pattern of functional connectivity seenhere using our estimate of intrinsic connectivity during the first
Fig. 4. Results of the analysis for the Jane task. (A) The warm-colored areas (associated with positive brain scores) have increased activity for Spacing and Feature vs.Scrambled, and cool colored regions (associated with negative brain scores) indicate more activity for Scrambled stimuli. The graphs in this figure show the average of themean-centered brain scores for each condition in each group. Both groups show distinct activity for Spacing/Feature vs. Scrambled, with no group differences. (B) The warm-colored areas are those with increased activity for Spacing and cool colors indicate more activity for Feature. The activity for both Spacing conditions differed from bothFeature conditions, and no group differences in activity were seen. In Controls there were no differences between early and late runs for either Spacing or Feature, but theCataract group showed less activity for the early Spacing condition than the late Spacing condition (indicated by “*”). The color bars indicate the range of BSRs shown in theimages. Error bars in the graphs are the 95% confidence intervals. (For interpretation of the references to color in this figure caption, the reader is referred to the web versionof this paper.)
C.L. Grady et al. / Neuropsychologia 57 (2014) 122–139130
localizer run resembles the functional connectivity of these fusi-form regions during a true resting state scan, we also carried outthe seed PLS analysis in an independent group of healthy youngadults. The resting functional connectivity pattern of the right andleft fusiform regions is shown in Fig. 6b (47.5% of the covariance,po0.002). This pattern is more spatially extensive, probably dueto increased statistical power, but is nevertheless very similar tothat seen in the Control and Cataract groups. Importantly, therewas no difference in connectivity between the right and leftfusiform regions in this independent sample at rest. This lendssupport to the idea that the functional connectivity identified inthe Control and Cataract groups is a reasonable estimate ofintrinsic connectivity and that the hemispheric difference seen inthe Cataract group deviates from what one would expect to see inhealthy young adults.
To summarize the results of the brain activity and functionalconnectivity analyses, the Control and Cataract groups had equiva-lent activity during both the Localizer and Jane runs in extrastriate
regions consistent with general activity evoked by meaningfulvisual stimuli. The participants with congenital cataracts also hadface-specific activity in a limited set of regions that was equivalentto that of Controls. Although the Cataract group had no overallreductions in activity discriminating the Spacing and Featureconditions from the Jane task, relative to Controls, they did showless activity during the early Spacing conditions compared to theactivity they showed in the later conditions, and failed to activatethe right fusiform gyrus during Spacing trials. There were two
Table 3Brain areas identified in the analysis of the Jane Task.
Brain region BA X Y Z BSR Δ Con earlya Δ Con late Δ Cat early Δ Cat late
Note: Con, control; Cat, cataract; BA, Brodmann area; X, right/left; Y, anterior/posterior; Z, superior/inferior; BSR, bootstrap ratio.a Δ refers to the difference between conditions for each effect (mean7S.E., all values were mean-centered prior to calculating the difference): A, mean of spacing and
feature minus scrambled; B, scrambled minus mean of spacing and feature; C, spacing minus feature; D, feature minus spacing.b Region that is similar in location to an area proposed to be a part of the face network (including core and extended areas; see Supplementary Table for locations of core
regions).
0.6Spacing early
0.4Spacing late
0.2 Feature earlyy
0 Feature late
-0.2% S
igna
l Cha
nge
-0.4Controls Cataract
Fig. 5. Mean activity for a region of the right posterior fusiform gyrus that wasmore active for Spacing than for Feature when the controls were analyzedseparately (see text for coordinates). Plotted values are mean7S.E.
Table 4Brain areas that are functionally connected with the right and left fusiform gyri.
a Region that is similar in location to an area proposed to be part of the facenetwork (including core and extended areas; see Supplementary Table for locationsof core regions).
C.L. Grady et al. / Neuropsychologia 57 (2014) 122–139 131
robust group differences. First, the Controls showed face-specificactivity in a broad set of regions, including core and extended face-network regions, and activity in this distributed group of brainareas was markedly reduced for faces in the Cataract group, whoinstead had activation for objects in these regions. The reductionin face-specific activity was more pronounced for extended face-network regions than for core regions. Second, the bilateral fusi-form seed regions had strong functional connections to core andextended-network areas in both groups, but these connectionswere greater with the left fusiform region in the Cataract grouprelative to Controls.
3.5. Brain activity and behavior
We next assessed whether any of the brain activity patternsseen during the Localizer or Jane scans were related to perfor-mance on the Jane task. To address this question, we assessed fourdifferent regression models (using backward regressions) for
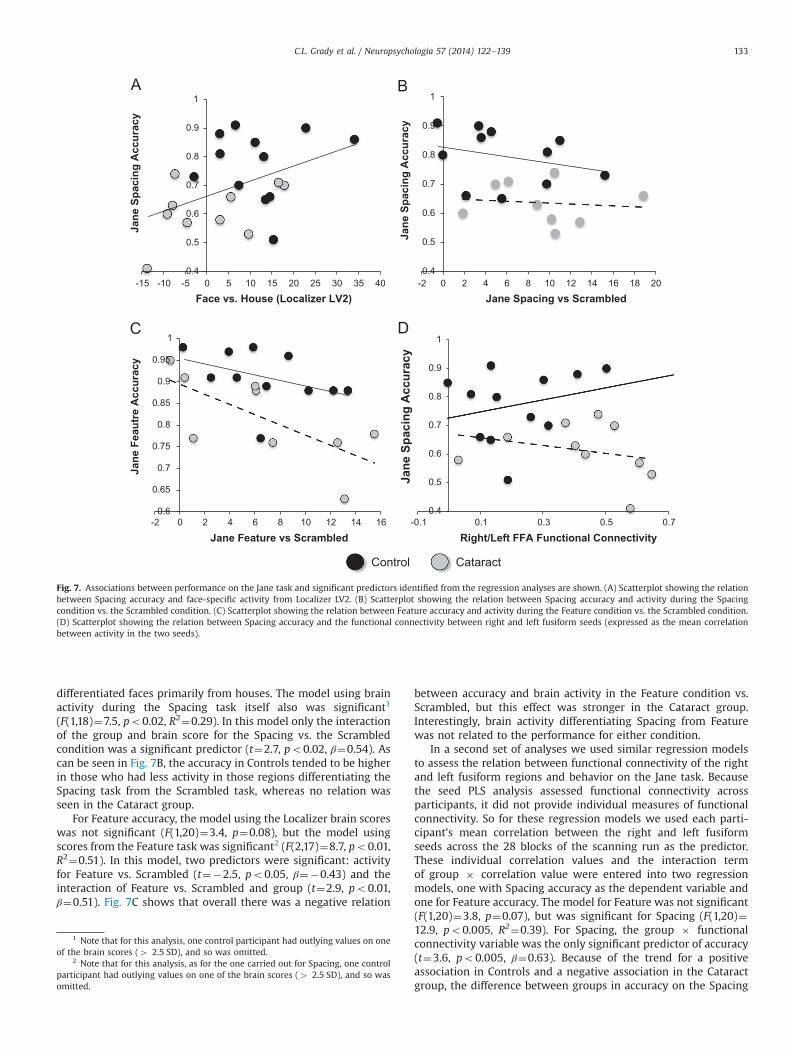
accuracy on the Spacing and Feature tasks. In two models, thepredictors were the brain scores from the face condition in thethree Localizer LVs, and the three interaction terms of these scoreswith the group, and the dependent variable was accuracy on theSpacing (or Feature) task. The other two models included the brainscores from early and late Spacing (or Feature) conditions, thebrain score in the Spacing (or Feature) condition vs. the Scrambledcondition (averaged across early and late runs), and the interactionterms of these scores with the group, to predict the accuracy.The group interaction terms were included so that we could assesswhether there were group differences in brain/behavior associa-tions. For the Spacing performance, the model using the Localizerdata was significant (F(1,20)¼5.0, po0.05, R2¼0.20). The onlysignificant predictor of Spacing accuracy was face-specific activityin the brain regions identified in LV2 of the Localizer data (t¼2.2,po0.05, β¼0.48). This indicates that, in both groups (Fig. 7A),better performance on the Spacing task was related to moreactivity in the distributed set of face-network regions that
5 10
0
0.1
0.2
0.3
0.4
0.5
0.6
0.7
Right Left
Func
tiona
l C
onne
ctiv
ity
R
5 10
0
0.1
0.2
0.3
0.4
0.5
0.6
0.7
Right Left
Func
tiona
l C
onne
ctiv
ity
Control Cataract
*
L
*
Fig. 6. (A) The set of regions where the activity was robustly correlated with right and left fusiform seeds in the Cataract and Control groups is shown in warm colors.The color bars indicate the range of BSRs shown in the images. The graph shows the strength of the functional connectivity for both regions and groups, i.e., the meancorrelation over the 28 blocks between each seed’s activity and a score expressing activity in all the regions seen in the figure (the brain score). The Cataract group hadstronger functional connectivity for the left fusiform gyrus seed relative to Controls and relative to their own connectivity for the right fusiform seed (both effects areindicated by “*”). (B) Regions where resting activity was robustly correlated with right and left fusiform seeds in an independent group of young adults are shown in warmcolors. The color bars indicate the range of BSRs shown in the images. The graph shows the strength of the functional connectivity for both regions, measured as the meancorrelation (over 29 blocks) between each seed’s activity and the brain score. The error bars in the graphs are the S.E. (For interpretation of the references to color in thisfigure caption, the reader is referred to the web version of this paper.)
C.L. Grady et al. / Neuropsychologia 57 (2014) 122–139132
differentiated faces primarily from houses. The model using brainactivity during the Spacing task itself also was significant1
(F(1,18)¼7.5, po0.02, R2¼0.29). In this model only the interactionof the group and brain score for the Spacing vs. the Scrambledcondition was a significant predictor (t¼2.7, po0.02, β¼0.54). Ascan be seen in Fig. 7B, the accuracy in Controls tended to be higherin those who had less activity in those regions differentiating theSpacing task from the Scrambled task, whereas no relation wasseen in the Cataract group.
For Feature accuracy, the model using the Localizer brain scoreswas not significant (F(1,20)¼3.4, p¼0.08), but the model usingscores from the Feature task was significant2 (F(2,17)¼8.7, po0.01,R2¼0.51). In this model, two predictors were significant: activityfor Feature vs. Scrambled (t¼�2.5, po0.05, β¼�0.43) and theinteraction of Feature vs. Scrambled and group (t¼2.9, po0.01,β¼0.51). Fig. 7C shows that overall there was a negative relation
between accuracy and brain activity in the Feature condition vs.Scrambled, but this effect was stronger in the Cataract group.Interestingly, brain activity differentiating Spacing from Featurewas not related to the performance for either condition.
In a second set of analyses we used similar regression modelsto assess the relation between functional connectivity of the rightand left fusiform regions and behavior on the Jane task. Becausethe seed PLS analysis assessed functional connectivity acrossparticipants, it did not provide individual measures of functionalconnectivity. So for these regression models we used each parti-cipant’s mean correlation between the right and left fusiformseeds across the 28 blocks of the scanning run as the predictor.These individual correlation values and the interaction termof group � correlation value were entered into two regressionmodels, one with Spacing accuracy as the dependent variable andone for Feature accuracy. The model for Feature was not significant(F(1,20)¼3.8, p¼0.07), but was significant for Spacing (F(1,20)¼12.9, po0.005, R2¼0.39). For Spacing, the group � functionalconnectivity variable was the only significant predictor of accuracy(t¼3.6, po0.005, β¼0.63). Because of the trend for a positiveassociation in Controls and a negative association in the Cataractgroup, the difference between groups in accuracy on the Spacing
0.4
0.5
0.6
0.7
0.8
0.9
1
-15 -10 -5 0 5 10 15 20 25 30 35 40
Jane
Spa
cing
Acc
urac
y
Face vs. House (Localizer LV2)
0.4
0.5
0.6
0.7
0.8
0.9
1
-2 0 2 4 6 8 10 12 14 16 18 20
Jane
Spa
cing
Acc
urac
y
Jane Spacing vs Scrambled
Control Cataract
0.6
0.65
0.7
0.75
0.8
0.85
0.9
0.95
1
-2 0 2 4 6 8 10 12 14 16
Jane
Fea
utre
Acc
urac
y
Jane Feature vs Scrambled
0.4
0.5
0.6
0.7
0.8
0.9
1
-0.1 0.1 0.3 0.5 0.7
Jane
Spa
cing
Acc
urac
y
Right/Left FFA Functional Connectivity
A B
C D
Fig. 7. Associations between performance on the Jane task and significant predictors identified from the regression analyses are shown. (A) Scatterplot showing the relationbetween Spacing accuracy and face-specific activity from Localizer LV2. (B) Scatterplot showing the relation between Spacing accuracy and activity during the Spacingcondition vs. the Scrambled condition. (C) Scatterplot showing the relation between Feature accuracy and activity during the Feature condition vs. the Scrambled condition.(D) Scatterplot showing the relation between Spacing accuracy and the functional connectivity between right and left fusiform seeds (expressed as the mean correlationbetween activity in the two seeds).
1 Note that for this analysis, one control participant had outlying values on oneof the brain scores (4 2.5 SD), and so was omitted.
2 Note that for this analysis, as for the one carried out for Spacing, one controlparticipant had outlying values on one of the brain scores (4 2.5 SD), and so wasomitted.
C.L. Grady et al. / Neuropsychologia 57 (2014) 122–139 133
task increased as a functional connectivity between right and leftfusiform regions increased (Fig. 7D).3
A final set of correlations was carried out in the Cataract groupto assess relations between visual acuity or days of deprivationprior to cataract removal and: (1) the brain scores from theLocalizer and Jane analyses; and (3) functional connectivitybetween the right and left fusiform seed regions. None of thecorrelations with acuity were statistically significant, and only oneof the correlations with days of deprivation was significant. Thiswas the correlation between deprivation duration and activity forfaces from LV3 in the Localizer analysis (r¼0.66, po0.05), indicat-ing that longer deprivation was associated with more activity forfaces in the few face-network regions seen in this pattern (warmcolored regions in Fig. 2B).
4. Discussion
In this study, we compared brain activity in young adultstreated for congenital cataracts to that of a control group, todetermine the influence of early visual deprivation on faceprocessing. The first finding of note is that the effect of congenitalcataracts on visual processing is not a general one, despite thereduced acuity in the Cataract group. There were no groupdifferences in the general patterns of visual activity identified inthe Localizer and Jane runs, and the Cataract group showed noreductions in the brain activity accompanying processing of eitherhouses or objects. Instead, like the behavioral findings in previousstudies (de Heering & Maurer, 2014; Mondloch et al., 2010b;Robbins et al., 2010) and the behavioral findings during the Janetask of this study, the fMRI data indicate that the deficit is specificfor faces. The second novel finding is that the individuals withcongenital cataracts had reduced brain activity in both core andextended face-network regions, including prefrontal regions,when viewing faces in the Localizer scan. Interestingly, we foundno evidence that early visual deprivation from congenital cataractsled to engagement of different brain regions from those ofControls; instead, there were reductions in the use of the areasnormally engaged for face processing. Third, we found that thebrain activity characterizing faces vs. other stimuli was related toperformance on the Jane task in both Controls and Cataractparticipants, although again there were group differences in thestrength of these associations. Finally, the functional connectivityof the fusiform gyri was altered in the Cataract group such thatconnectivity with the left fusiform and other face-network regionswas increased. Additionally, the functional connectivity betweenright and left fusiform regions was differentially associated withthe performance on the Jane task in the two groups. The implica-tions of these results are discussed below.
4.1. Activity during the Localizer
Analysis of the Localizer data showed three different patternsof brain activity across the conditions. The general visual network(LV1) was active for houses, faces, and objects, relative to fixation,as would be expected, and included areas thought to be sensitiveto each of the visual categories (including the fusiform and lingualgyri, and lateral occipital cortex). The pattern distinguishing facesfrom houses in Controls (LV2) was similar to the distinctive regionsreported by others, in that it showed fusiform activity for faces and
activity in parahippocampal/lingual gyrus for houses (e.g., Epstein,Graham, & Downing, 2003; Large, Cavina-Pratesi, Vilis, & Culham,2008; Maurer et al., 2007b; Spiridon, Fischl, & Kanwisher, 2006).Activity for faces also included the left STS (a core network region)and extended-network regions involved in face recognition(Gobbini & Haxby, 2007), such as the amygdala (responsive toemotional expressions in faces), precuneus/posterior cingulate andmedial PFC (person knowledge), and caudate/striatum (socialreward). The third Localizer pattern consisted of increased activityin core face-network areas and the amygdala during face pre-sentation in both groups, and a much more widely distributed setof regions active for objects. Note that although we identifiedthese areas using a group analysis instead of individual analyses asis often done, we found activity in regions that are similar inlocation to those defined functionally for each visual category andreported in the literature (see Supplementary Table 1). However,because we used a whole brain, multivariate approach, we alsowere able to identify a much wider range of activity, includingmost of the face network.
Only the second of these Localizer patterns showed less activityin the Cataract group relative to Controls when viewing faces.Although this distributed pattern of activity was reduced as awhole in the Cataract group, the magnitude of the reduction wasgreater in extended face-network regions than in core regions.This suggests that the major effect of visual deprivation is not incore face-network regions per se, but in extended face-networkregions, suggesting altered communication within the broadernetwork. In addition, the activity in these regions overall wasrobust for objects in the Cataract group, not for faces; this lack offace-specific activity was particularly evident when the Cataractgroup was analyzed separately (see Fig. 3b). This suggests theinteresting possibility that the face network has been “co-opted”for object processing instead of face processing, which would bean important aspect for future research.
Interestingly, the fusiform gyrus contributed to two patterns,one with (LV2) and one without (LV1) group differences. This isconsistent with the idea that the activity within nodes of anetwork can fluctuate up or down in response to task demandsrelatively independently of one another or may participate inmultiple networks to flexibly respond to task demands or proces-sing states (Bressler & Menon, 2010; McIntosh, 2000). It alsoshould be noted that the particular fusiform regions that con-tribute to LV1 and LV2 are somewhat different in location, with theface-specific regions being more anterior. Our results indicate thatthe posterior fusiform covaried with other general visual areas in anon-specific way across all the visual categories (LV1), and therewas no reduction of activity in these regions in the Cataract group.In contrast, the anterior fusiform covaried with other face-networkregions specifically during face presentation (LV2), and the Catar-act group had reduced activity overall in this group of regions.These anterior/posterior fusiform regions are similar in location tothose reported by Pinsk et al. (2009) in a study comparing facesensitive regions in humans and monkeys. Our results, takentogether with theirs, suggest some level of specialization withinthe fusiform regions that are sensitive to face stimuli, although theexact nature of such a specialization is not yet known.
Early visual deprivation impacted activity in most of theextended face-network regions in at least one hemisphere duringthe Localizer scan. Indeed, there was a more marked reduction inextended network regions than in core regions, suggesting thatthe face-processing deficit of these individuals is not in faceperception per se, but in how face information is transmitted to,or processed by, the extended areas. This interpretation is con-sistent with evidence that individuals with congenital cataractsconfuse subtle facial expressions with each other and do not makenormal judgments of the similarity among facial expressions (Gao,
3 Note that the significant group � brain measure interactions do not implythat the within-group correlations between these measures and behavior weresignificant. Only one of the correlations depicted in Fig. 7 was significant (Fig. 7c,between Feature accuracy and Feature vs. Scrambled brain scores in the Cataractgroup, r¼�0.68, po0.05).
C.L. Grady et al. / Neuropsychologia 57 (2014) 122–139134
Maurer, & Nishimura, 2013). In addition, reduced activity inperson-knowledge regions may contribute to these patients’deficit in recognizing famous faces (de Heering & Maurer, 2014).Interestingly, the majority of the frontal regions in the extendedface network showed no reduction of face-specific activity duringthe Localizer, but did show differences in activity during the earlyand late phases of the Jane task in the Cataract group, to which weturn next.
4.2. Activity during the Jane task
The set of regions more active during the Scrambled condition,compared to Spacing and Feature, were very similar to those activeduring all object categories during the Localizer runs, which weattributed to general visual activity. The finding that the activityfor scrambled faces declined in both groups across the Jane runs,despite the lack of any changes in accuracy or RT in the Scrambledcondition, likely represents adaptation to stimuli that are initiallyquite novel but become less so with repeated presentations (Grill-Spector, Henson, & Martin, 2006). The finding of equivalentactivity in these diffuse occipital regions both for multiple objectcategories vs. fixation and scrambled faces vs. real faces in the twogroups is strong evidence for a lack of effect of congenital cataractson brain activity associated with presumably low level visualanalysis of stimuli sufficiently large and containing sufficientcontrast to be above any visibility threshold.
In terms of regions with more activity for the Spacing andFeature conditions than the Scrambled condition, we did not find adifference in the fusiform gyri. This may be due to the nature ofour scrambled images, in which one can see contours and someface parts. Studies that define the FFA using a functional localizertypically do so using objects, houses or scenes as the contrastingstimuli (e.g., Epstein et al., 2003; Gauthier et al., 2000; Grill-Spector et al., 2004; Kanwisher et al., 1997), and find robustactivity in the fusiform gyri, as we did in our Localizer scan.A few studies used scrambled images to define face-sensitiveregions (Fairhall & Ishai, 2007; Hoffman & Haxby, 2000; Ishai etal., 2005), but these used phase scrambling, which obscures allface parts and object-like contours. So it would seem that theresponse of the fusiform gyri to scrambled images of faces mightdepend critically on how the scrambling is done. Although we didnot find more activity in core network regions for Spacing andFeature compared to Scrambled, there was more activity in OFCand the bilateral amygdala, both extended-network regions. TheOFC is thought to be involved in emotional regulation (Gillihan etal., 2011; Northoff et al., 2004; Wheeler & Fellows, 2008) and isoften active during face tasks (Fairhall & Ishai, 2007; Lee, Grady,Habak, Wilson, & Moscovitch, 2011; Li et al., 2010) so that it hasbeen included in the extended face network. The amygdala is alsocritically involved in emotional perception and memory, as indi-cated above. Because the increased activity was seen for bothSpacing and Feature conditions, it may thus represent a generalemotional response to the Jane faces, and the lack of a groupdifference in the activity of these regions suggests that theemotional response to these faces, although not required for thetask, was equivalent in the two groups. However, the activity inthese face-network regions was related to length of deprivation inthe Cataract group. This correlation could have been due to chance(as it was the only one out of 11 correlations between deprivationand brain measures that was significant). Alternatively, it mightsuggest that the activity in these regions increases to compensatefor the duration of visual deprivation, as does the P1/N170amplitude over parietal and occipital regions recorded withevent-related potentials when these patients are presented withpictures of faces, houses, and objects (Mondloch et al., 2013).
Unlike the other brain activity patterns seen here, comparisonof the Spacing and Feature conditions showed a rather strikinghemispheric asymmetry, with right hemisphere regions active forSpacing and left hemisphere regions active for Feature. Thisasymmetry is consistent with evidence of a prominent role ofthe right hemisphere in face processing (for a review seeBehrmann & Plaut, 2013) and with evidence that deprivation ofthe right hemisphere is critical for face processing deficits aftercongenital cataracts (Le Grand et al., 2003). The most extensiveregions with more Spacing activity were in right prefrontal cortex.For example, the region that included IFG, an extended facenetwork area, is similar to one that is thought to be involved inprocessing higher-order relations among object features (Bunge,Helskog, & Wendelken, 2009), consistent with its role here inprocessing second-order relations among facial features. In addi-tion, the cingulate/dorsomedial prefrontal region with more Spa-cing activity also is part of the extended face network and isinvolved in self-reference and theory of mind (Andrews-Hanna,Reidler, Sepulcre, Poulin, & Buckner, 2010; Grigg & Grady, 2010a;Northoff & Bermpohl, 2004; Spreng & Grady, 2010). In particular,this region shows evidence of reduced face-specific activity in theCataract group (during the Localizer, LV2) and an early/latedifference on Jane spacing, so processing in this region, perhapsreflecting the processing of other people’s faces in relation to ones’self, may be particularly impacted by early cataracts. There wasmore activity for Feature vs. Spacing in the ventromedial pre-frontal cortex, which is involved in a network of regions known asthe default mode network that is thought to represent self-reference and other social cognitive processes (e.g., Buckner,Andrews-Hanna, & Schacter, 2008; Grigg & Grady, 2010a;Gusnard, Akbudak, Shulman, & Raichle, 2001; Spreng, Mar, &Kim, 2009). The default network shows reduced activity duringexternally driven tasks, such as the Jane task, particularly whenthe task is difficult (McKiernan, Kaufman, Kucera-Thompson, &Binder, 2003; Persson, Lustig, Nelson, & Reuter-Lorenz, 2007).Because the Feature task was easier than the Spacing task, moreactivity in ventromedial PFC during the Feature task may be due toless deactivation of the default network in an easier task, and notanything specific to faces. Plotting the regions more active forFeature vs. Spacing at a lower threshold supports this idea (seeSupplementary Figure 4), as this shows more default networkregions, such as the posterior cingulate. Overall, the contrast ofSpacing and Feature processing during the Jane task suggests thatthe difference is driven by Spacing activity in right hemispherefrontal regions involved in social aspects of the extended facenetwork. Given that the Cataract group showed reliably increasedactivity for Spacing only in the later trials, our results suggest thatearly visual deprivation is associated with less consistent activa-tion of these regions when using a spacing strategy for facediscrimination.
4.3. Functional connectivity of the fusiform gyri
The seed analysis supported the notion that the strength offunctional connectivity is altered in the Cataract group within thenetwork of regions that are functionally connected to the fusiformgyri in both groups. This indicates that the network itself is notaltered spatially after early visual deprivation, but deprivationdoes affect how strongly the nodes of the network are inter-connected. Although we would have expected to see weakerfunctional connectivity of the right fusiform region in this groupif the right hemisphere is a primary target of early deprivation (LeGrand et al., 2003), this was not the case. It is possible that otheraspects of this region’s connectivity might be altered, for examplethe fiber tracts connecting it to other areas, or its functionalconnections outside the face network. Even though the right
C.L. Grady et al. / Neuropsychologia 57 (2014) 122–139 135
fusiform was not reliably weakened within the face network, wedid find enhanced connectivity of the left fusiform in the Cataractgroup. The lack of a hemispheric difference in functional con-nectivity in both the Control group and the independent sample ofyoung adults scanned at rest supports the interpretation that theasymmetry seen in the Cataract group is not what one wouldexpect to see in those with typical development of the visualsystem. We cannot determine from these data whether theenhanced functional connectivity of the left fusiform is a conse-quence of alterations in its right hemisphere homolog, but this isan intriguing possibility. According to one recent theory(Behrmann & Plaut, 2013), both right and left fusiforms contributeto face processing early in life, but during development the leftregion becomes more strongly connected with language areas asits role in word processing increases, and the right fusiformbecomes more finely tuned for faces as a consequence. Our resultwould suggest that early visual deprivation from bilateral cataractsalters the developmental process so that this asymmetry fails tomature fully, leaving the left hemisphere more strongly connectedto other face processing regions.
The regions that were functionally connected to the right andleft fusiform seeds, and that showed increased connectivity withthe left fusiform in the Cataract group, included most of theregions in the extended face network, at least in one hemisphere,with the exception of dorsomedial prefrontal cortex, insula andsuperior temporal sulcus. This finding, along with the reducedface-specific activity during the Localizer and less consistentactivity in the Jane scans in the Cataract group, adds furthersupport to the conclusion that early visual deprivation influencesthe integrated activity of the distributed set of regions active forthe various aspects of processing faces. There is not much in theliterature about how functional connectivity in the face networkmight be altered under different conditions, but there is evidencein healthy aging that the functional connectivity between rightand left fusiform gyri during same/different discrimination of facesis disrupted relative to young adults, with a concomitant increasein connectivity between right fusiform and OFC (Burianova, Lee,Grady, & Moscovitch, 2013). This finding, taken together with ourresults here, indicates that functional interactions between rightand left fusiform gyri are important for face processing, and forhow well one can carry out this processing, as we discuss next.
4.4. Associations between brain activity and behavior
The patterns of activity and functional connectivity identifiedin our analyses not only differentiated the groups but also wereassociated with how well participants carried out the tasks.The relation between face-specific activity seen in the Localizerscan and better performance on the Jane Spacing task is intriguing,as it indicates that activity in the extended face network isimportant for the ability to identify faces based on feature spacing.Despite the fact that the Cataract participants had particulardifficulty with this task, as well as less activity in these brainregions, they nevertheless showed the same brain/behavior asso-ciation as Controls, suggesting that their face processing alsodepends on this network. This result is further support for theidea that early visual deprivation impairs the ability to engage theextended face network, or perhaps hampers its efficiency, but doesnot result in a major reorganization of the network.
Accuracy on both Spacing and Feature tasks was associatedwith activity during these tasks relative to that seen duringscrambled faces. In both cases, the relation was such that moreactivity in OFC and amygdala during the face tasks, compared toScrambled, was associated with worse performance on the tasks.In addition, this relation was stronger for Controls in the Spacingtask, and stronger for the Cataract group in the Feature condition.
If activity in these regions is associated with emotional processingof the faces, as we suggest above, this difference in how activitypredicts performance implies that responding to the emotionalaspects of the faces in this task, where emotion is not relevant tothe task, is disruptive to identifying them. This group difference inwhich task shows the larger impact may depend on whichstrategy individuals tend to use more readily when processingfaces, that is, a more holistic approach in Controls and a feature-based strategy in the participants with early visual deprivation.
Finally, a group difference was found in the relation betweenfunctional connectivity between right and left fusiform regionsand performance on the Spacing task. The trend for Controls wasfor a positive association between functional connectivity andperformance, whereas this trend was negative for the Cataractgroup, suggesting that functional interactions between these twocore face regions no longer carry the same information after earlydeprivation. Importantly, this interaction also indicates that thedifference in Spacing performance between the groups increasesas functional connectivity increases. This is further evidence, alongwith the increased functional connectivity between the left fusi-form gyrus and other face processing regions, at the expense ofright fusiform connectivity, that activity within the face network isdisrupted by early deprivation, especially so for face processingthat depends on spacing among facial features.
4.5. Limitations
One potential limitation of the study is that the Cataract groupperformed more poorly on the Jane task, so a concern might bethat the observed brain differences would simply reflect thisbehavioral difference. We do not think that this is a major concernbecause the main group difference in brain activity was seenduring the Localizer and no response was required during theseruns. It therefore seems unlikely that the reduced activity in face-processing regions in the Cataract group during the Localizer canbe explained by behavioral differences. This reduction in face-specific activity likely reflects some difference in how the faces areprocessed even during passive presentation. Similarly, the rela-tions among brain activity during the Localizer scan, functionalconnectivity and Jane performance (seen in Fig. 7a and d) areunlikely to be influenced by behavioral differences because thebrain measures were obtained from an independent scan. Never-theless, group differences in the performance on the Jane task mayhave influenced some of the relations between performance andbrain activity measured during this task. Finally, the lack ofsignificant correlations between acuity and the brain measuressuggests that the effects that we observed in the Cataract groupwere not due to their relatively poor acuity.
Another potential limitation is that we did not have a resting-state scan from our participants for assessing intrinsic functionalconnectivity, and instead approximated this connectivity by divid-ing a task run into sequential “blocks”, thus disrupting thehemodynamic response to stimulus presentation. The similarityof functional connectivity patterns seen in the Control andCataract groups to that seen in the group of participants scannedat rest indicates that the method used here to identify thefunctional connectivity of the fusiform gyri does indeed approx-imate the “true” intrinsic connectivity of these regions. However,we cannot completely rule out some influence of residual taskeffects on functional connectivity, as changes in functional con-nectivity have been reported in other networks between task andrest states (Betti et al., 2013; Mennes, Kelly, Colcombe, Castellanos,& Milham, 2013). For example, the apparently smaller extent ofregions functionally connected to the fusiform gyri in the currentsample relative to the larger, independent sample scanned at rest(see Fig. 6) could be due either to reduced statistical power
C.L. Grady et al. / Neuropsychologia 57 (2014) 122–139136
(smaller sample size) or to some as yet unidentified influence oftask on face-network functional connectivity.
4.6. Conclusions
We found that adults who experienced visual deprivation fromcataracts during infancy appear to use the normal face processingnetwork when passively viewing faces or making judgments aboutwhether or not two faces are the same. However, there is less thannormal activation, particularly in the extended face-processingnetwork. In addition, functional connectivity in the face network isaltered, and all these brain changes have a more marked impact onthe ability to make judgments about feature spacing than onjudgments based on features per se. Thus, early visual input isnecessary to set up or preserve the connections in the extendedface-processing network that will later mediate expert faceprocessing.
Future fMRI studies would be useful to determine whether thepatterns observed here represent the partial recovery of faceprocessing networks as the cataract-reversal patients gain experi-ence with faces, or whether they represent stable deficits. Forexample, it is possible that patients initially use mainly anundifferentiated and compromised network for processing bothfaces and objects, but as they attempt to remember more andmore faces as they enter first primary and then high school, theobject and face networks differentiate to some extent, with thelate-differentiating face network remaining disadvantaged. Thishypothesis is consistent with evidence that the object and facenetworks become increasingly differentiated during childhood inchildren with normal eyes. Future fMRI studies would also beuseful on the effects of early visual deprivation on other aspects offace processing at which adults excel: detecting direction of eyegaze; decoding facial expressions; and integrating informationabout identity, eye gaze, age, race, and facial expression.
Acknowledgments
This research was supported by the National Science andEngineering Research Council (Canada, Grant # 9797 to D.M.)and the Canadian Institutes of Health Research (MOP67176 to D.M.and MOP14036 to C.L.G.). We thank Charisa Ng for data analysis.
Appendix A. Supporting information
Supplementary data associated with this paper can be found inthe online version at http://dx.doi.org/10.1016/j.neuropsychologia.2014.03.005.
References
Adolphs, R., Tranel, D., Damasio, H., & Damasio, A. (1994). Impaired recognition ofemotion in facial expressions following bilateral damage to the humanamygdala. Nature, 372, 669–672.
Al-Aidroos, N., Said, C. P., & Turk-Browne, N. B. (2012). Top-down attention switchescoupling between low-level and high-level areas of human visual cortex.Proceedings of the National Academy of Sciences of the United States of America,109, 14675–14680.
Allen, E. A., Erhardt, E. B., Damaraju, E., Gruner, W., Segall, J. M., Silva, R. F., et al.(2011). A baseline for the multivariate comparison of resting-state networks.Frontiers in Systems Neuroscience, 5, 2.
Andrews-Hanna, J. R., Reidler, J. S., Sepulcre, J., Poulin, R., & Buckner, R. L. (2010).Functional-anatomic fractionation of the brain's default network. Neuron, 65,550–562.
Axelrod, V., & Yovel, G. (2012). Hierarchical processing of face viewpoint in humanvisual cortex. Journal of Neuroscience, 32, 2442–2452.
Behrmann, M., & Plaut, D. C. (2013). Distributed circuits, not circumscribed centers,mediate visual recognition. Trends in Cognitive Sciences, 17, 210–219.
Betti, V., Della Penna, S., de Pasquale, F., Mantini, D., Marzetti, L., Romani, G. L., et al.(2013). Natural scenes viewing alters the dynamics of functional connectivity inthe human brain. Neuron, 79, 782–797.
Bhatt, R. S., Bertin, E., Hayden, A., & Reed, A. (2005). Face processing in infancy:Developmental changes in the use of different kinds of relational information.Child Development, 76, 169–181.
Bressler, S. L., & Menon, V. (2010). Large-scale brain networks in cognition:Emerging methods and principles. Trends in Cognitive Sciences, 14, 277–290.
Buckner, R. L., Andrews-Hanna, J. R., & Schacter, D. L. (2008). The brain's defaultnetwork: Anatomy, function, and relevance to disease. Annals of the New YorkAcademy of Sciences, 1124, 1–38.
Bunge, S. A., Helskog, E. H., & Wendelken, C. (2009). Left, but not right, rostrolateralprefrontal cortex meets a stringent test of the relational integration hypothesis.Neuroimage, 46, 338–342.
Burianova, H., Lee, Y., Grady, C. L., & Moscovitch, M. (2013). Age-related dediffer-entiation and compensatory changes in the functional network underlying faceprocessing. Neurobiology of Aging, 34, 2759–2767.
Campbell, K. L., Grady, C. L., Ng, C., & Hasher, L. (2012). Age differences in thefrontoparietal cognitive control network: Implications for distractibility. Neu-ropsychologia, 50, 2212–2223.
Campbell, K. L., Grigg, O., Saverino, C., Churchill, N., & Grady, C. L. (2013). Agedifferences in the intrinsic functional connectivity of default network sub-systems. Frontiers in Aging Neuroscience, 5, 73 (Article).
Cohen Kadosh, K., Cohen Kadosh, R., Dick, F., & Johnson, M. H. (2011). Develop-mental changes in effective connectivity in the emerging core face network.Cerebral Cortex, 21, 1389–1394.
Cox, R. W. (1996). AFNI: Software for analysis and visualization of functionalmagnetic resonance neuroimages. Computers & Biomedical Research, 29,162–173.
Crookes, K., & McKone, E. (2009). Early maturity of face recognition: No childhooddevelopment of holistic processing, novel face encoding, or face-space. Cogni-tion, 111, 219–247.
de Heering, A., & Maurer, D. (2014). Face memory deficits in patients deprived ofearly visual input by bilateral congenital cataracts. Developmental Psychobiology,56, 96–108.
de Heering, A., Rossion, B., & Maurer, D. (2012). Developmental changes in facerecognition during childhood: Evidence from upright and inverted faces.Cognitive Development, 27, 17–27.
Downing, P. E., Chan, A. W., Peelen, M. V., Dodds, C. M., & Kanwisher, N. (2006).Domain specificity in visual cortex. Cerebral Cortex, 16, 1453–1461.
Druzgal, T. J., & D'Esposito, M. (2003). Dissecting contributions of prefrontal cortexand fusiform face area to face working memory. Journal of Cognitive Neu-roscience, 15, 771–784.
Efron, B. (1981). Nonparametric estimates of standard error: The jackknife, thebootstrap, and other methods. Biometrika, 68, 589–599.
Epstein, R., Graham, K. S., & Downing, P. E. (2003). Viewpoint-specific scenerepresentations in human parahippocampal cortex. Neuron, 37, 865–876.
Fairhall, S. L., & Ishai, A. (2007). Effective connectivity within the distributed corticalnetwork for face perception. Cerebral Cortex, 17, 2400–2406.
Farkas, L. (1981). Anthropometry of the Head and Face in Medicine. New York: Elsevier.Fellows, L. K. (2007). The role of orbitofrontal cortex in decision making: A
component process account. Annals of the New York Academy of Sciences,1121, 421–430.
Fox, M. D., Snyder, A. Z., Vincent, J. L., Corbetta, M., Van Essen, D. C., & Raichle, M. E.(2005). The human brain is intrinsically organized into dynamic, anticorrelatedfunctional networks. Proceedings of the National Academy of Science U S A, 102,9673–9678.
Gao, X., Maurer, D., & Nishimura, M. (2013). Altered representation of facialexpressions after early visual deprivation. Frontiers in Psychology, 4, 878.
Gauthier, I., Skudlarski, P., Gore, J. C., & Anderson, A. W. (2000). Expertise for carsand birds recruits brain areas involved in face recognition. Nature Neuroscience,3, 191–197.
Gauthier, I., Tarr, M. J., Anderson, A. W., Skudlarski, P., & Gore, J. C. (1999). Activationof the middle fusiform 'face area' increases with expertise in recognizing novelobjects. Nature Neuroscience, 2, 568–573.
Geldart, S., Mondloch, C., Maurer, D., de Schonen, S., & Brent, H. (2002). The effectsof early visual deprivation on the development of face processing. Develop-mental Science, 5, 490–501.
Gillihan, S. J., Xia, C., Padon, A. A., Heberlein, A. S., Farah, M. J., & Fellows, L. K. (2011).Contrasting roles for lateral and ventromedial prefrontal cortex in transient anddispositional affective experience. Social Cognitive and Affective Neuroscience, 6,128–137.
Glover, G. H., Li, T. Q., & Ress, D. (2000). Image-based method for retrospectivecorrection of physiological motion effects in fMRI: RETROICOR. MagneticResonance in Medicine, 44, 162–167.
Gobbini, M. I., & Haxby, J. V. (2007). Neural systems for recognition of familiar faces.Neuropsychologia, 45, 32–41.
Golarai, G., Liberman, A., Yoon, J. M., & Grill-Spector, K. (2010). Differentialdevelopment of the ventral visual cortex extends through adolescence. Fron-tiers in Human Neuroscience, 3, 80.
Graham, K. S., Lee, A. C., Brett, M., & Patterson, K. (2003). The neural basis ofautobiographical and semantic memory: New evidence from three PET studies.Cognitive, Affective and Behavioral Neuroscience, 3, 234–254.
Grigg, O., & Grady, C. L. (2010a). The default network and processing of personallyrelevant information: Converging evidence from task-related modulations andfunctional connectivity. Neuropsychologia, 48, 3815–3823.
C.L. Grady et al. / Neuropsychologia 57 (2014) 122–139 137
Grigg, O., & Grady, C. L. (2010b). Task-related effects on the temporal and spatialdynamics of resting-state functional connectivity in the default network. PLoSONE, 5, e13311.
Grill-Spector, K., Henson, R., & Martin, A. (2006). Repetition and the brain: Neuralmodels of stimulus-specific effects. Trends in Cognitive Sciences, 10, 14–23.
Grill-Spector, K., Knouf, N., & Kanwisher, N. (2004). The fusiform face areasubserves face perception, not generic within-category identification. NatureNeuroscience, 7, 555–562.
Grill-Spector, K., Kushnir, T., Edelman, S., Itzchak, Y., & Malach, R. (1998). Cue-invariant activation in object-related areas of the human occipital lobe. Neuron,21, 191–202.
Gusnard, D. A., Akbudak, E., Shulman, G. L., & Raichle, M. E. (2001). Medialprefrontal cortex and self-referential mental activity: Relation to a defaultmode of brain function. Proceedings of the National Academy of Science, USA, 98,4259–4264.
Haber, S. N., & Knutson, B. (2010). The reward circuit: Linking primate anatomy andhuman imaging. Neuropsychopharmacology, 35, 4–26.
Haist, F., Adamo, M., Han Wazny, J., Lee, K., & Stiles, J. (2013). The functionalarchitecture for face-processing expertise: FMRI evidence of the developmentaltrajectory of the core and the extended face systems. Neuropsychologia, 51,2893–2908.
Haist, F., Lee, K., & Stiles, J. (2010). Individuating faces and common objectsproduces equal responses in putative face-processing areas in the ventraloccipitotemporal cortex. Frontiers in Human Neuroscience, 4, 181.
Haxby, J. V., Gobbini, M. I., Furey, M. L., Ishai, A., Schouten, J. L., & Pietrini, P. (2001).Distributed and overlapping representations of faces and objects in ventraltemporal cortex. Science, 293, 2425–2430.
Haxby, J. V., Horwitz, B., Ungerleider, L. G., Maisog, J. M., Pietrini, P., & Grady, C. L.(1994). The functional organization of human extrastriate cortex: A PET-rCBFstudy of selective attention to faces and locations. Journal of Neuroscience, 14,6336–6353.
Hayden, A., Bhatt, R. S., Reed, A., Corbly, C. R., & Joseph, J. E. (2007). Thedevelopment of expert face processing: Are infants sensitive to normaldifferences in second-order relational information? Journal of ExperimentalChild Psychology, 97, 85–98.
Hoffman, E. A., & Haxby, J. V. (2000). Distinct representations of eye gaze andidentity in the distributed human neural system for face perception. NatureNeuroscience, 3, 80–84.
Hole, G. J. (1994). Configurational factors in the perception of unfamiliar faces.Perception, 23, 65–74.
Ishai, A., Haxby, J. V., & Ungerleider, L. G. (2002). Visual imagery of famous faces:Effects of memory and attention revealed by fMRI. NeuroImage, 17, 1729–1741.
Ishai, A., Schmidt, C. F., & Boesiger, P. (2005). Face perception is mediated by adistributed cortical network. Brain Research Bulletin, 67, 87–93.
Ishai, A., & Yago, E. (2006). Recognition memory of newly learned faces. BrainResearch Bulletin, 71, 167–173.
Itier, R. J., & Batty, M. (2009). Neural bases of eye and gaze processing: The core ofsocial cognition. Neuroscience and Biobehavioral Reviews, 33, 843–863.
Joseph, J. E., & Gathers, A. D. (2002). Natural and manufactured objects activate thefusiform face area. Neuroreport, 13, 935–938.
Joseph, J. E., Swearingen, J. E., Clark, J. D., Benca, C. E., Collins, H. R., Corbly, C. R.,et al. (2012). The changing landscape of functional brain networks for faceprocessing in typical development. NeuroImage, 63, 1223–1236.
Kanwisher, N., McDermott, J., & Chun, M. M. (1997). The fusiform face area: Amodule in human extrastriate cortex specialized for face perception. Journal ofNeuroscience, 17, 4302–4311.
Lane, R. D., Reiman, E. M., Ahern, G. L., Schwartz, G. E., & Davidson, R. J. (1997).Neuroanatomical correlates of happiness, sadness, and disgust. AmericanJournal of Psychiatry, 154, 926–933.
Large, M. E., Cavina-Pratesi, C., Vilis, T., & Culham, J. C. (2008). The neural correlatesof change detection in the face perception network. Neuropsychologia, 46,2169–2176.
Le Grand, R., Mondloch, C. J., Maurer, D., & Brent, H. P. (2001). Neuroperception.Early visual experience and face processing. Nature, 410, 890.
Le Grand, R., Mondloch, C. J., Maurer, D., & Brent, H. P. (2003). Expert faceprocessing requires visual input to the right hemisphere during infancy. NatureNeuroscience, 6, 1108–1112.
Le Grand, R., Mondloch, C. J., Maurer, D., & Brent, H. P. (2004). Impairment inholistic face processing following early visual deprivation. Psychological Science,15, 762–768.
Lee, Y., Anaki, D., Grady, C., & Moscovitch, M. (2012). Neural correlates of temporalintegration in face recognition: An fMRI study. Neuroimage, 61, 1287–1299.
Lee, Y., Grady, C. L., Habak, C., Wilson, H. R., & Moscovitch, M. (2011). Faceprocessing changes in normal aging revealed by fMRI adaptation. Journal ofCognitive Neuroscience, 23, 3433–3447.
Leveroni, C. L., Seidenberg, M., Mayer, A. R., Mead, L. A., Binder, J. R., & Rao, S. M.(2000). Neural systems underlying the recognition of familiar and newlylearned faces. Journal of Neuroscience, 20, 878–886.
Li, J., Liu, J., Liang, J., Zhang, H., Zhao, J., Rieth, C. A., et al. (2010). Effectiveconnectivities of cortical regions for top-down face processing: A DynamicCausal Modeling study. Brain Research, 1340, 40–51.
Malach, R., Reppas, J. B., Benson, R. R., Kwong, K. K., Jiang, H., Kennedy, W. A., et al.(1995). Object-related activity revealed by functional magnetic resonanceimaging in human occipital cortex. Proceedings of the National Academy ofScience U S A, 92, 8135–8139.
Maurer, D., Le Grand, R., & Mondloch, C. (2002). The many faces of configuralprocessing. Trends in Cognitive Sciences, 6, 255–260.
Maurer, D., Mondloch, C. J., & Lewis, T. L. (2007a). Effects of early visual deprivationon perceptual and cognitive development. Progress in Brain Research, 164,87–104.
Maurer, D., O'Craven, K. M., Le Grand, R., Mondloch, C. J., Springer, M. V., Lewis, T. L.,et al. (2007b). Neural correlates of processing facial identity based on featuresversus their spacing. Neuropsychologia, 45, 1438–1451.
Mazard, A., Schiltz, C., & Rossion, B. (2006). Recovery from adaptation to facialidentity is larger for upright than inverted faces in the human occipito-temporal cortex. Neuropsychologia, 44, 912–922.
McIntosh, A. R. (2000). Towards a network theory of cognition. Neural Networks, 13,861–870.
McIntosh, A. R., Bookstein, F. L., Haxby, J. V., & Grady, C. L. (1996). Spatial patternanalysis of functional brain images using partial least squares. NeuroImage, 3,143–157.
McIntosh, A. R., Grady, C. L., Ungerleider, L. G., Haxby, J. V., Rapoport, S. I., &Horwitz, B. (1994). Network analysis of cortical visual pathways mapped withPET. Journal of Neuroscience, 14, 655–666.
McIntosh, A. R., & Lobaugh, N. L. (2004). Partial least squates analysis of neuroima-ging data: Applications and advances. Neuroimage, 23(Suppl. 1), S250–S263.
McKiernan, K. A., Kaufman, J. N., Kucera-Thompson, J., & Binder, J. R. (2003). Aparametric manipulation of factors affecting task-induced deactivation infunctional neuroimaging. Journal of Cognitive Neuroscience, 15, 394–408.
Mennes, M., Kelly, C., Colcombe, S., Castellanos, F. X., & Milham, M. P. (2013). Theextrinsic and intrinsic functional architectures of the human brain are notequivalent. Cerebral Cortex, 23, 223–229.
Michel, C., Rossion, B., Han, J., Chung, C. S., & Caldara, R. (2006). Holistic processingis finely tuned for faces of one's own race. Psychological Science, 17, 608–615.
Mondloch, C. J., Elms, N., Maurer, D., Rhodes, G., Hayward, W., Tanaka, J., et al.(2010a). Processes underlying the cross-race effect: Holistic, featural, andrelational processing of own- and other-race faces. Perception, 39, 1065–1085.
Mondloch, C. J., Geldart, S., Maurer, D., & Le Grand, R. (2003a). Developmentalchanges in face processing skills. Journal of Experimental Child Psychology, 86,67–84.
Mondloch, C. J., Le Grand, R., & Maurer, D. (2002). Configural face processingdevelops more slowly than featural face processing. Perception, 31, 553–566.
Mondloch, C. J., Le Grand, R., & Maurer, D. (2003b). Early visual experience isnecessary for the development of some—but not all—aspects of face processing.In: O. Pascalis, & A. Slater (Eds.), The development of face processing in infancyand early childhood (pp. 99–117). New York: Nova.
Mondloch, C. J., Maurer, D., & Ahola, S. (2006). Becoming a face expert. PsychologicalScience, 17, 930–934.
Mondloch, C. J., Robbins, R., & Maurer, D. (2010b). Discrimination of facial featuresby adults, 10-year-olds, and cataract-reversal patients. Perception, 39, 184–194.
Mondloch, C. J., Segalowitz, S. J., Lewis, T. L., Dywan, J., Le Grand, R., & Maurer, D.(2013). The effect of early visual deprivation on the development of facedetection. Developmental Science, 16, 728–742.
Natu, V., Raboy, D., & O'Toole, A. J. (2011). Neural correlates of own- and other-raceface perception: Spatial and temporal response differences. NeuroImage, 54,2547–2555.
Nestor, A., Plaut, D. C., & Behrmann, M. (2011). Unraveling the distributed neuralcode of facial identity through spatiotemporal pattern analysis. Proceedings ofthe National Academy of Sciences of the United States of America, 108,9998–10003.
Nestor, A., Vettel, J. M., & Tarr, M. J. (2008). Task-specific codes for face recognition:How they shape the neural representation of features for detection andindividuation. PLoS One, 3, e3978.
Nichols, D. F., Betts, L. R., & Wilson, H. R. (2010). Decoding of faces and facecomponents in face-sensitive human visual cortex. Frontiers in Psychology, 1, 28.
Northoff, G., & Bermpohl, F. (2004). Cortical midline structures and the self. Trendsin Cognitive Sciences, 8, 102–107.
Northoff, G., Heinzel, A., Bermpohl, F., Niese, R., Pfennig, A., Pascual-Leone, A., et al.(2004). Reciprocal modulation and attenuation in the prefrontal cortex: AnfMRI study on emotional–cognitive interaction. Human Brain Mapping, 21,202–212.
O'Craven, K. M., Downing, P. E., & Kanwisher, N. (1999). fMRI evidence for objects asthe units of attentional selection. Nature, 401, 584–587.
Persson, J., Lustig, C., Nelson, J. K., & Reuter-Lorenz, P. A. (2007). Age differences indeactivation: A link to cognitive control? Journal of Cognitive Neuroscience, 19,1021–1032.
Phillips, M. L., Young, A. W., Senior, C., Brammer, M., Andrew, C., Calder, A. J., et al.(1997). A specific neural substrate for perceiving facial expressions of disgust.Nature, 389, 495–498.
Pinsk, M. A., Arcar o, M., Weiner, K. S., Kalkus, J. F., Inati, S. J., Gross, C. G., et al.(2009). Neural representations of faces and body parts in macaque and humancortex: A comparative FMRI study. Journal of Neurophysiology, 101, 2581–2600.
Rhodes, G., Byatt, G., Michie, P. T., & Puce, A. (2004). Is the fusiform face areaspecialized for faces, individuation, or expert individuation? Journal of CognitiveNeuroscience, 16, 189–203.
Robbins, R. A., Maurer, D., Hatry, A., Anzures, G., & Mondloch, C. J. (2012). Effects ofnormal and abnormal visual experience on the development of opposingaftereffects for upright and inverted faces. Developmental Science, 15, 194–203.
Robbins, R. A., Nishimura, M., Mondloch, C. J., Lewis, T. L., & Maurer, D. (2010).Deficits in sensitivity to spacing after early visual deprivation in humans: A
C.L. Grady et al. / Neuropsychologia 57 (2014) 122–139138
comparison of human faces, monkey faces, and houses. Developmental Psycho-biology, 52, 775–781.
Robbins, R. A., Shergill, Y., Maurer, D., & Lewis, T. L. (2011). Development ofsensitivity to spacing versus feature changes in pictures of houses: Evidencefor slow development of a general spacing detection mechanism? Journal ofExperimental Child Psychology, 109, 371–382.
Roder, B., Ley, P., Shenoy, B. H., Kekunnaya, R., & Bottari, D. (2013). Sensitive periodsfor the functional specialization of the neural system for human face proces-sing. Proceedings of the National Academy of Sciences of the United States ofAmerica, 110, 16760–16765.
Rolls, E. T. (2000). The orbitofrontal cortex and reward. Cerebral Cortex, 10, 284–294.Rossion, B., Caldara, R., Seghier, M., Schuller, A. M., Lazeyras, F., & Mayer, E. (2003). A
network of occipito-temporal face-sensitive areas besides the right middlefusiform gyrus is necessary for normal face processing. Brain, 126, 2381–2395.
Schiltz, C., Dricot, L., Goebel, R., & Rossion, B. (2010). Holistic perception ofindividual faces in the right middle fusiform gyrus as evidenced by thecomposite face illusion. Journal of Vision, 1025.1–25.16.
Schiltz, C., & Rossion, B. (2006). Faces are represented holistically in the humanoccipito-temporal cortex. Neuroimage, 32, 1385–1394.
Simion, F., Leo, I., Turati, C., Valenza, E., & Dalla Barba, B. (2007). How facespecialization emerges in the first months of life. Progress in Brain Research,164, 169–185.
Spiridon, M., Fischl, B., & Kanwisher, N. (2006). Location and spatial profile ofcategory-specific regions in human extrastriate cortex. Human Brain Mapping,27, 77–89.
Spreng, R. N., & Grady, C. L. (2010). Patterns of brain activity supporting autobio-graphical memory, prospection, and theory of mind, and their relationship tothe default mode network. Journal of Cognitive Neuroscience, 22, 1112–1123.
Spreng, R. N., Mar, R. A., & Kim, A. S. (2009). The common neural basis ofautobiographical memory, prospection, navigation, theory of mind, and the
default mode: A quantitative meta-analysis. Journal of Cognitive Neuroscience,21, 489–510.
Tanaka, J. W., Kiefer, M., & Bukach, C. M. (2004). A holistic account of the own-raceeffect in face recognition: Evidence from a cross-cultural study. Cognition, 93,B1–9.
Taubert, J. (2009). Chimpanzee faces are 'special' to humans. Perception, 38,343–356.
Taylor, M. J., Batty, M., & Itier, R. J. (2004). The faces of development: A review ofearly face processing over childhood. Journal of Cognitive Neuroscience, 16,1426–1442.
Turati, C., Macchi Cassia, V., Simion, F., & Leo, I. (2006). Newborns' face recognition:Role of inner and outer facial features. Child Development, 77, 297–311.
Turati, C., Valenza, E., Leo, I., & Simion, F. (2005). Three-month-olds' visualpreference for faces and its underlying visual processing mechanisms. Journalof Experimental Child Psychology, 90, 255–273.
Tzourio-Mazoyer, N., De Schonen, S., Crivello, F., Reutter, B., Aujard, Y., & Mazoyer, B.(2002). Neural correlates of woman face processing by 2-month-old infants.Neuroimage, 15, 454–461.
Wheeler, E. Z., & Fellows, L. K. (2008). The human ventromedial frontal lobe iscritical for learning from negative feedback. Brain, 131, 1323–1331.
Wojciulik, E., Kanwisher, N., & Driver, J. (1998). Covert visual attention modulatesface-specific activity in the human fusiform gyrus: fMRI study. Journal ofNeurophysiology, 79, 1574–1578.
Young, A. W., Hellawell, D., & Hay, D. C. (1987). Configurational information in faceperception. Perception, 16, 747–759.
Yovel, G., & Kanwisher, N. (2004). Face perception: Domain specific, not processspecific. Neuron, 44, 889–898.
Zieber, N., Kangas, A., Hock, A., Hayden, A., Collins, R., Bada, H., et al. (2013).Perceptual specialization and configural face processing in infancy. Journal ofExperimental Child Psychology, 116, 625–639.
C.L. Grady et al. / Neuropsychologia 57 (2014) 122–139 139