18
EARNINGS PRESENTATION | 9M/Q3-FY2018
| Date post: | 27-May-2018 |
| Category: |
Documents |
| Upload: | nguyennguyet |
| View: | 215 times |
| Download: | 0 times |

EARNINGS PRESENTATION | 9M/Q3-FY2018
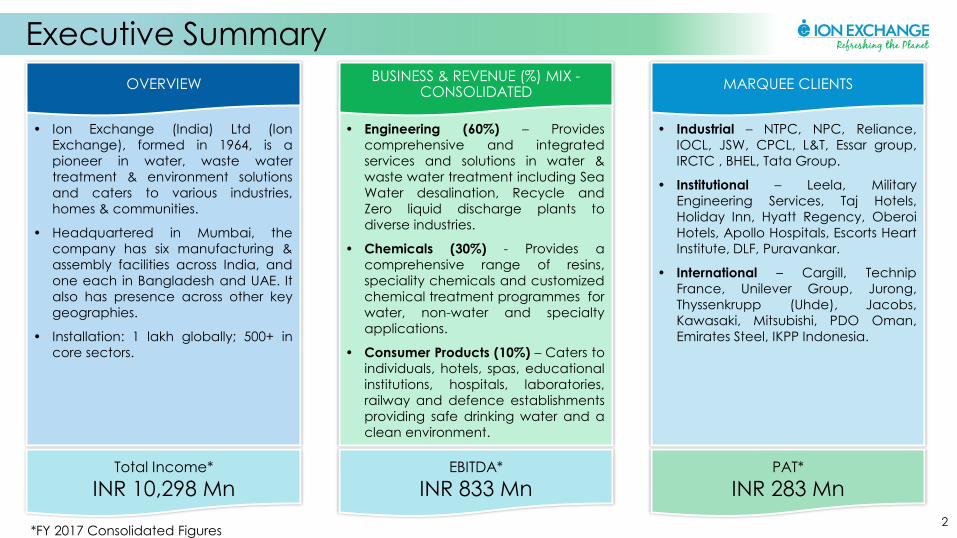
Executive Summary
Total Income*
INR 10,298 Mn EBITDA*
INR 833 Mn PAT*
INR 283 Mn
• Ion Exchange (India) Ltd (Ion
Exchange), formed in 1964, is a
pioneer in water, waste water
treatment & environment solutions
and caters to various industries,
homes & communities.
• Headquartered in Mumbai, the
company has six manufacturing &
assembly facilities across India, and
one each in Bangladesh and UAE. It
also has presence across other key
geographies.
• Installation: 1 lakh globally; 500+ in
core sectors.
• Engineering (60%) – Provides
comprehensive and integrated
services and solutions in water &
waste water treatment including Sea
Water desalination, Recycle and
Zero liquid discharge plants to
diverse industries.
• Chemicals (30%) - Provides a
comprehensive range of resins,
speciality chemicals and customized
chemical treatment programmes for
water, non-water and specialty
applications.
• Consumer Products (10%) – Caters to
individuals, hotels, spas, educational
institutions, hospitals, laboratories,
railway and defence establishments
providing safe drinking water and a
clean environment.
• Industrial – NTPC, NPC, Reliance,
IOCL, JSW, CPCL, L&T, Essar group,
IRCTC , BHEL, Tata Group.
• Institutional – Leela, Military
Engineering Services, Taj Hotels,
Holiday Inn, Hyatt Regency, Oberoi
Hotels, Apollo Hospitals, Escorts Heart
Institute, DLF, Puravankar.
• International – Cargill, Technip
France, Unilever Group, Jurong,
Thyssenkrupp (Uhde), Jacobs,
Kawasaki, Mitsubishi, PDO Oman,
Emirates Steel, IKPP Indonesia.
OVERVIEW BUSINESS & REVENUE (%) MIX -
CONSOLIDATED MARQUEE CLIENTS
2 *FY 2017 Consolidated Figures

• Ion Exchange was originally formed as a subsidiary of Permutit, UK in 1964. It became a wholly owned Indian company in 1985. The company is currently in its 53rd Year of operations.
• The company has expanded its footprints globally and possesses a diversified product range. It offers one stop water and non-water treatment solutions catering to diverse segments like infrastructure, industry, institutions, municipal, homes and communities, urban and rural.
• The company offers a wide range of solutions across the water cycle from
pre-treatment to process water treatment, waste water treatment, recycle, zero liquid discharge, sewage treatment, packaged drinking water, sea water desalination etc.
• The company is also engaged in manufacturing ion exchange resins, speciality chemicals for water and waste water treatment as well as non-water applications.
• It has two facilities for in-house R&D and two applications and testing centers.
• The company has over 50 patents to their credit and 100+ products commercialized.
• The company has a global presence apart from presence in major cities
in India with sales & service centers and dealer network of more than 100.
• The company exports to Africa, Japan, Middle East, Russia, South East Asia, Europe, UK, USA, Canada and neighbouring countries.
REVENUE BREAKUP 9M-FY18*
Exports
32%
Domestic 68%
GEOGRAPHICAL BREAKUP FY17**
**Consolidated
Company Overview
3
53% 36%
11% Engineering
Chemicals
Consumer
Products
* Standalone Numbers

9M/Q3-FY18 STANDALONE FINANCIAL HIGHLIGHTS
Q3-FY18 Performance:
• Total Income*: INR 2,489 Mn;
Growth of 23% Y-o-Y; 10% Q-o-Q
• EBITDA: INR 203 Mn;
Growth of 31% Y-o-Y; 2% Q-o-Q
• EBITDA Margins: 8.16%;
Growth of 50 Bps Y-o-Y; (64) Bps Q-o-Q
• Net Profit After Tax: INR 88 Mn;
Growth of 49% Y-o-Y; 11% Q-o-Q
• PAT Margins: 3.54%;
Growth of 62 Bps Y-o-Y; 5 Bps Q-o-Q
• Diluted EPS: INR 7.37;
Growth of 49% Y-o-Y;12% Q-o-Q
9M-FY18 Performance:
• Total Income*: INR 6,888 Mn;
Growth of 10% Y-o-Y
• EBITDA: INR 577 Mn;
Growth of 11% Y-o-Y
• EBITDA Margins: 8.38%;
Growth of 3 Bps
• Net Profit After Tax: INR 240 Mn;
Growth of 5% Y-o-Y
• PAT Margins: 3.48%;
Growth of (19) Bps
• Diluted EPS: INR 20.04;
Growth of 5% Y-o-Y
* Includes other income
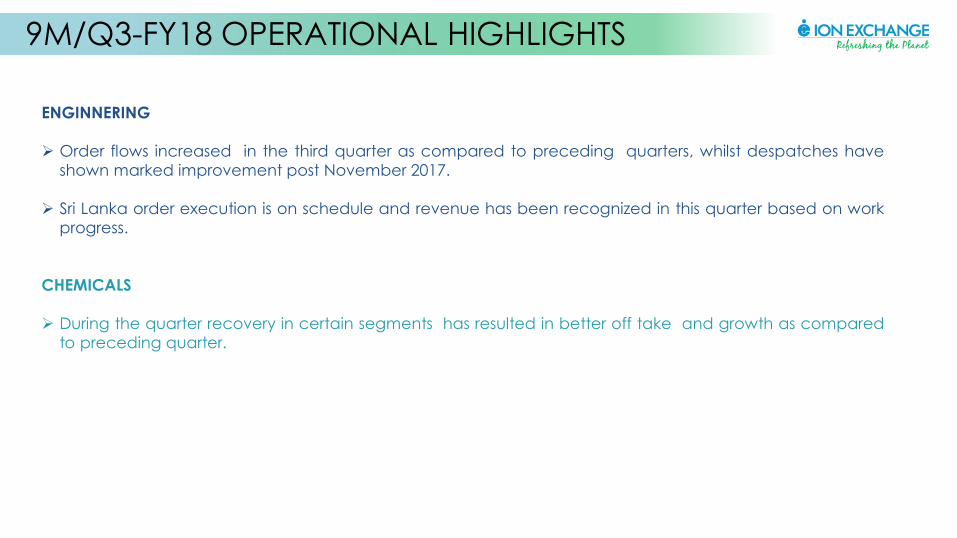
9M/Q3-FY18 OPERATIONAL HIGHLIGHTS
ENGINNERING
Order flows increased in the third quarter as compared to preceding quarters, whilst despatches have
shown marked improvement post November 2017.
Sri Lanka order execution is on schedule and revenue has been recognized in this quarter based on work
progress.
CHEMICALS
During the quarter recovery in certain segments has resulted in better off take and growth as compared
to preceding quarter.

SEGMENTAL BREAKUP-QUARTERLY STANDALONE ENGINEERING (INR MN) CHEMICALS (INR MN) CONSUMER PRODUCTS (INR MN)
R
E
V
E
N
U
E
E
B
I
T
1,436
1,032
500
750
1,000
1,250
1,500
Q3FY18 Q3FY17
31
15 10
15
20
25
30
35
Q3FY18 Q3FY17
843
824
800
815
830
845
Q3FY18 Q3FY17
112
116
110
111
112
113
114
115
116
117
Q3FY18 Q3FY17
254
232
210
225
240
255
270
Q3FY18 Q3FY17
-8
-14
-16
-12
-8
-4
0
Q3FY18 Q3FY17

Q3-FY18 – STANDALONE INCOME STATEMENT (IND AS)
* Includes other income
INCOME STATEMENT (INR MN) Q3-FY18 Q3-FY17 Y-o-Y Q2-FY18 Q-o-Q
Total Income* 2,489 2,023 23.0% 2,262 10.0%
Total Expenses 2,286 1,868 22.4% 2,063 10.8%
EBITDA 203 155 31.0% 199 2.0%
EBITDA Margins (%) 8.16% 7.66% 50 Bps 8.80% (64) Bps
Depreciation 30 27 11.1% 32 (6.3)%
Finance Cost 37 37 NA 39 (5.1)%
PBT 136 91 49.5% 128 6.3%
Tax 48 32 50.0% 49 (2.0)%
Profit After Tax 88 59 49.2% 79 11.4%
PAT Margins (%) 3.54% 2.92% 62 Bps 3.49% 5 Bps
Other Comprehensive Income (1) (1) NA (1) NA
Total Comprehensive Income 87 58 50.0% 78 11.5%
EPS Diluted (INR) 7.37 4.96 48.6% 6.60 11.7%

9M-FY18 – STANDALONE INCOME STATEMENT(IND AS)
* Includes other income
INCOME STATEMENT (INR MN) 9M-FY18 9M-FY17 Y-o-Y
Total Income* 6,888 6,243 10.3%
Total Expenses 6,311 5,722 10.3%
EBITDA 577 521 10.7%
EBITDA Margins (%) 8.38% 8.35% 3 Bps
Depreciation 94 79 19.0%
Finance Cost 108 97 11.3%
PBT 375 345 8.7%
Tax 135 116 16.4%
Profit After Tax 240 229 4.8%
PAT Margins (%) 3.48% 3.67% (19) Bps
Other Comprehensive Income (3) (3) NA
Total Comprehensive Income 237 226 4.9%
EPS Diluted (INR) 20.04 19.10 4.9%
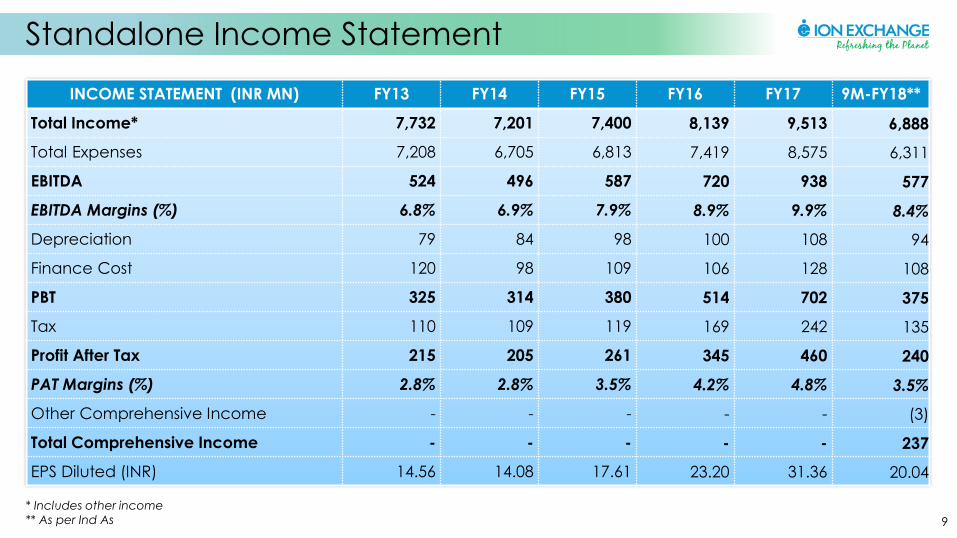
INCOME STATEMENT (INR MN) FY13 FY14 FY15 FY16 FY17 9M-FY18**
Total Income* 7,732 7,201 7,400 8,139 9,513 6,888
Total Expenses 7,208 6,705 6,813 7,419 8,575 6,311
EBITDA 524 496 587 720 938 577
EBITDA Margins (%) 6.8% 6.9% 7.9% 8.9% 9.9% 8.4%
Depreciation 79 84 98 100 108 94
Finance Cost 120 98 109 106 128 108
PBT 325 314 380 514 702 375
Tax 110 109 119 169 242 135
Profit After Tax 215 205 261 345 460 240
PAT Margins (%) 2.8% 2.8% 3.5% 4.2% 4.8% 3.5%
Other Comprehensive Income - - - - - (3)
Total Comprehensive Income - - - - - 237
EPS Diluted (INR) 14.56 14.08 17.61 23.20 31.36 20.04
* Includes other income
** As per Ind As
Standalone Income Statement
9
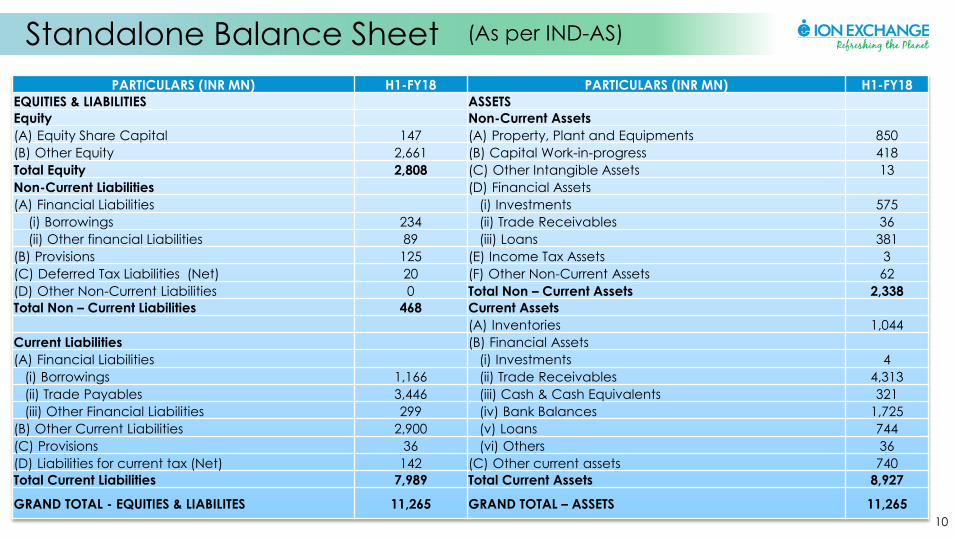
Standalone Balance Sheet
10
(As per IND-AS)
PARTICULARS (INR MN) H1-FY18 PARTICULARS (INR MN) H1-FY18
EQUITIES & LIABILITIES ASSETS
Equity Non-Current Assets
(A) Equity Share Capital 147 (A) Property, Plant and Equipments 850
(B) Other Equity 2,661 (B) Capital Work-in-progress 418
Total Equity 2,808 (C) Other Intangible Assets 13
Non-Current Liabilities (D) Financial Assets
(A) Financial Liabilities (i) Investments 575
(i) Borrowings 234 (ii) Trade Receivables 36
(ii) Other financial Liabilities 89 (iii) Loans 381
(B) Provisions 125 (E) Income Tax Assets 3
(C) Deferred Tax Liabilities (Net) 20 (F) Other Non-Current Assets 62
(D) Other Non-Current Liabilities 0 Total Non – Current Assets 2,338
Total Non – Current Liabilities 468 Current Assets
(A) Inventories 1,044
Current Liabilities (B) Financial Assets
(A) Financial Liabilities (i) Investments 4
(i) Borrowings 1,166 (ii) Trade Receivables 4,313
(ii) Trade Payables 3,446 (iii) Cash & Cash Equivalents 321
(iii) Other Financial Liabilities 299 (iv) Bank Balances 1,725
(B) Other Current Liabilities 2,900 (v) Loans 744
(C) Provisions 36 (vi) Others 36
(D) Liabilities for current tax (Net) 142 (C) Other current assets 740
Total Current Liabilities 7,989 Total Current Assets 8,927
GRAND TOTAL - EQUITIES & LIABILITES 11,265 GRAND TOTAL – ASSETS 11,265
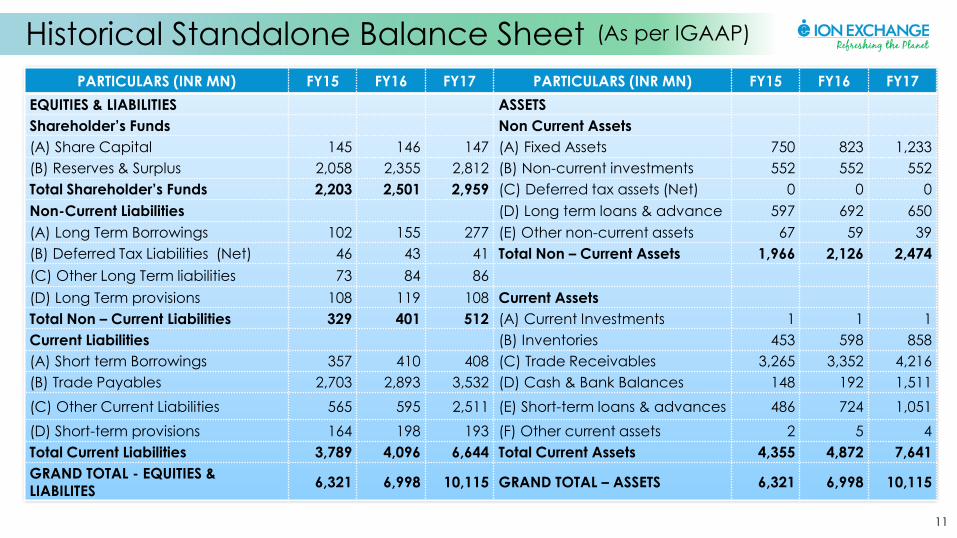
PARTICULARS (INR MN) FY15 FY16 FY17 PARTICULARS (INR MN) FY15 FY16 FY17
EQUITIES & LIABILITIES ASSETS
Shareholder’s Funds Non Current Assets
(A) Share Capital 145 146 147 (A) Fixed Assets 750 823 1,233
(B) Reserves & Surplus 2,058 2,355 2,812 (B) Non-current investments 552 552 552
Total Shareholder’s Funds 2,203 2,501 2,959 (C) Deferred tax assets (Net) 0 0 0
Non-Current Liabilities (D) Long term loans & advance 597 692 650
(A) Long Term Borrowings 102 155 277 (E) Other non-current assets 67 59 39
(B) Deferred Tax Liabilities (Net) 46 43 41 Total Non – Current Assets 1,966 2,126 2,474
(C) Other Long Term liabilities 73 84 86
(D) Long Term provisions 108 119 108 Current Assets
Total Non – Current Liabilities 329 401 512 (A) Current Investments 1 1 1
Current Liabilities (B) Inventories 453 598 858
(A) Short term Borrowings 357 410 408 (C) Trade Receivables 3,265 3,352 4,216
(B) Trade Payables 2,703 2,893 3,532 (D) Cash & Bank Balances 148 192 1,511
(C) Other Current Liabilities 565 595 2,511 (E) Short-term loans & advances 486 724 1,051
(D) Short-term provisions 164 198 193 (F) Other current assets 2 5 4
Total Current Liabilities 3,789 4,096 6,644 Total Current Assets 4,355 4,872 7,641
GRAND TOTAL - EQUITIES & LIABILITES
6,321 6,998 10,115 GRAND TOTAL – ASSETS 6,321 6,998 10,115
Historical Standalone Balance Sheet
11
(As per IGAAP)
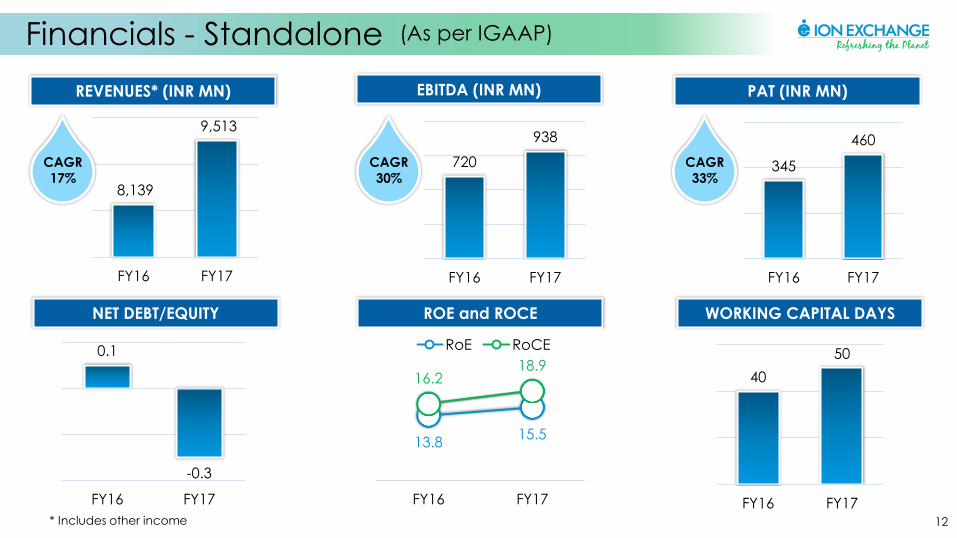
REVENUES* (INR MN) EBITDA (INR MN) PAT (INR MN)
NET DEBT/EQUITY ROE and ROCE WORKING CAPITAL DAYS
8,139
9,513
FY16 FY17
720
938
FY16 FY17
345
460
FY16 FY17
0.1
-0.3
FY16 FY17
13.8 15.5
16.2 18.9
FY16 FY17
RoE RoCE
40
50
FY16 FY17* Includes other income
Financials - Standalone
12
CAGR
17%
CAGR
30%
CAGR
33%
(As per IGAAP)
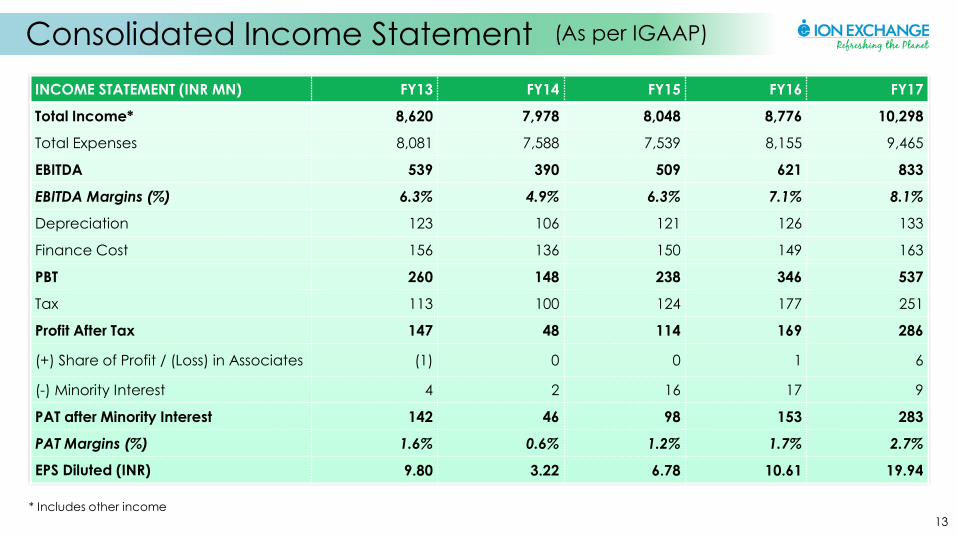
INCOME STATEMENT (INR MN) FY13 FY14 FY15 FY16 FY17
Total Income* 8,620 7,978 8,048 8,776 10,298
Total Expenses 8,081 7,588 7,539 8,155 9,465
EBITDA 539 390 509 621 833
EBITDA Margins (%) 6.3% 4.9% 6.3% 7.1% 8.1%
Depreciation 123 106 121 126 133
Finance Cost 156 136 150 149 163
PBT 260 148 238 346 537
Tax 113 100 124 177 251
Profit After Tax 147 48 114 169 286
(+) Share of Profit / (Loss) in Associates (1) 0 0 1 6
(-) Minority Interest 4 2 16 17 9
PAT after Minority Interest 142 46 98 153 283
PAT Margins (%) 1.6% 0.6% 1.2% 1.7% 2.7%
EPS Diluted (INR) 9.80 3.22 6.78 10.61 19.94
* Includes other income
Consolidated Income Statement
13
(As per IGAAP)

PARTICULARS (INR MN) FY 15 FY 16 FY 17 PARTICULARS (INR MN) FY 15 FY 16 FY 17
EQUITIES & LIABILITIES ASSETS
Shareholder Funds Non Current Assets
(A) Share Capital 141 141 142 (A) Fixed Assets 989 1,050 1,453
(B) Reserves& Surplus 1,420 1,560 1,837 (B) Non-current investments 24 24 29
Total -Shareholder Funds 1,561 1,701 1,979 (C) Deferred tax assets (Net) 8 8 9
Minority Interest 85 62 63 (D) Long term advance 476 543 453
Non Current Liabilities (E) Other non-current assets 263 263 266
(A) Long Term Borrowings 202 230 299 Total - Non – Current Assets 1,760 1,888 2,210
(B) Deferred Tax Liabilities (Net) 47 44 41
(C) Other Long Term Liabilities 110 128 126 Current Assets
(D) Long Term provisions 116 129 118 (A) Current Investments 1 1 1
Total - Non – Current Liabilities 475 531 584 (B) Inventories 793 814 1,109
Current Liabilities (C) Trade Receivables 3,582 3,630 4,405
(A) Short term Borrowings 567 567 608 (D) Cash and Bank Balances 262 334 1,669
(B) Trade Payables 3,162 3,314 3,960 (E) Short-term loans and
advances 401 489 646
(C) Other Current Liabilities 783 781 2,650 (F) Other current assets 3 5 5
(D) Short-term provisions 169 205 201 Total – Current Assets 5,042 5,273 7,835
Total – Current Liabilities 4,681 4,867 7,419
GRAND TOTAL - EQUITIES & LIABILITES 6,802 7,161 10,045 GRAND TOTAL – ASSETS 6,802 7,161 10,045
Historical Consolidated Balance Sheet
14
(As per IGAAP)

REVENUES* (INR MN) EBITDA (INR MN) PAT **(INR MN)
NET DEBT/ EQUITY ROE and ROCE WORKING CAPITAL DAYS
**PAT after Minority Interest
8,776
FY16 FY17
10,298 621
833
FY16 FY17
153
283
FY16 FY17
0.3
-0.4
FY16 FY17
9.0
14.3
16.8
21.8
FY16 FY17
RoE RoCE
40
47
FY16 FY17* Includes other income
Financials - Consolidated
15
CAGR
17%
CAGR
34%
CAGR
85%
(As per IGAAP)

Market Data (Bloomberg – ION IN, Reuters – IONX.BO)
PRICE DATA (AS ON 31st DECEMBER, 2017)
Face value (INR) 10
Market Price (INR) 599.7
52 Week H/L (INR) 638/286
Market Cap (INR Mn) 8,795.6
Equity Shares Outstanding (Mn) 14.67
1 Year Avg. trading volume (‘000) 12.82
SHAREHOLDING PATTERN (AS ON 31st DECEMBER, 2017)
1 YEAR SHARE PRICE MOVEMENT (AS ON 31st DECEMBER, 2017)
Promoter
44.0%
FII
0.3% DII
5.5%
Others
50.2%
16
0%
20%
40%
60%
80%
100%
120%
140% ION Exchange Sensex

Ion Exchange (India) Limited No representation or warranty, express or implied, is made as to, and no reliance should be placed on, the fairness, accuracy, completeness or correctness of the information or opinions contained in this presentation. Such information and opinions are in all events not current after the date of this presentation. Certain statements made in this presentation may not be based on historical information or facts and may be "forward looking statements" based on the currently held beliefs and assumptions of the management of Ion Exchange (India) Limited (“Company” or “IONEX” ), which are expressed in good faith and in their opinion reasonable, including those relating to the Company’s general business plans and strategy, its future financial condition and growth prospects and future developments in its industry and its competitive and regulatory
environment. Forward-looking statements involve known and unknown risks, uncertainties and other factors, which may cause the actual results, financial condition, performance or achievements of the Company or industry results to differ materially from the results, financial condition, performance or achievements expressed or implied by such forward-looking statements, including future changes or developments in the Company’s business, its competitive environment and political, economic, legal and social conditions.
Further, past performance is not necessarily indicative of future results. Given these risks, uncertainties and other factors, viewers of this presentation are cautioned not to place undue reliance on these forward-looking statements. The Company disclaims any obligation to update these forward-looking statements to reflect future events or developments. This presentation is for general information purposes only, without regard to any specific objectives, financial situations or informational needs of any particular person. This presentation does not constitute an offer or invitation to purchase or subscribe for any securities in any jurisdiction, including the United States. No part of it should form the basis of or be relied upon in connection with any investment decision or any contract or commitment to purchase or subscribe for any securities. None of our securities may be offered or sold in the United States, without registration under the U.S. Securities Act of 1933, as amended, or pursuant to an exemption from registration there from. This presentation is confidential and may not be copied or disseminated, in whole or in part, and in any manner.
Valorem Advisors Disclaimer: Valorem Advisors is an Independent Investor Relations Management Service company. This Presentation has been prepared by Valorem Advisors based on information and
data which the Company considers reliable, but Valorem Advisors and the Company makes no representation or warranty, express or implied, whatsoever, and no reliance shall be placed on, the truth, accuracy, completeness, fairness and reasonableness of the contents of this Presentation. This Presentation may not be all inclusive and may not contain all of the information that you may consider material. Any liability in respect of the contents of, or any omission from, this Presentation is expressly excluded.
Valorem Advisors also hereby certifies that the directors or employees of Valorem Advisors do not own any stock in personal or company capacity of the Company under review.
For further details please contact our Investor Relations Representatives:
VALOREM ADVISORS
Mr. Anuj Sonpal
Tel: +91-22-4903-9500
Email: [email protected]
Disclaimer
17
THANK YOU


