24
www.savola.com Earnings Presentation Q3 2017

www.savola.com
Earnings Presentation Q3 2017

DISCLAIMER
This presentation contains forward-looking statements which may be identified by the use of words like
“plans,” “expects,” “will,” “anticipates,” “believes,” “intends,” “projects,” “estimates” or other words of
similar meaning. All statements that address expectations or projections about the future, including, but
not limited to, statements about the strategy for growth, market position, expenditures, and financial
results, are forward looking statements.
Forward-looking statements are based on certain assumptions and expectations of future events. The
Savola Group (Savola or Group), its subsidiaries and its affiliates (the “Companies”) referred to in this
presentation cannot guarantee that these assumptions and expectations are accurate or will be
realized. The actual results, performance or achievements of the Companies, could thus differ
materially from those projected in any such forward-looking statements. The Companies assume no
responsibility to publicly amend, modify or revise any forward looking statements, on the basis of any
subsequent developments, information or events, or otherwise.
2
The Q3 2017 numbers are based on interim unaudited financials.

GROUP – HIGHLIGHTS
• In Q3 2017, the Group reported a net profit of SAR 829 million; with adjusted net profit of SAR 135.1 million after deducting the capital gain of SAR 693.9 million from the sale of 2% of Almarai shares.
• Savola’s retail segment recorded a net loss of SAR 218.8 million for the quarter. The turnaround is ongoing; the business has maintained the negative working capital position and cash flow from operations is positive.
• Within the food segment, revenues continue to be stable and the segment recorded a net profit of SAR 105.7 million for the quarter. Operationally, Egypt continues to be challenging due to the economic conditions.
• Herfy recorded a net income of SAR 56 million for the quarter, a decline of 5.5% compared to the same quarter last year.
• Almarai continues to perform well with a profit of SAR 667 million in Q3, translating into SAR 241.4 million net income contribution to the Group.
3

Q3 2017 - SNAPSHOT
4
» Q3 2017 revenue of SAR 5.7 bn (Q3 2016: SAR 6.2 bn)
» Q3 2017 net income SAR 829 mn (Q3 2016: SAR 179.5 mn)
» Adjusted net income of SAR 135.1 mn after gain of sale of Almarai sharesGROUP
RETAIL
FOODS
INVESTMENTS
» Q3 2017 revenue of SAR 2.7 bn (Q3 2016: SAR 3.2 bn)
» Q3 2017 net loss of SAR 218.8 mn (Q3 2016: Net loss of SAR 142.4 mn)
» Almarai recorded quarterly net income of SAR 667 mn
HERFY» Q3 2017 revenue of SAR 311.7 mn (Q3 2016: SAR 315.2 mn)
» Q3 2017 net income of SAR 56 mn (Q3 2016: SAR 59.3 mn)
» Q3 2017 revenue of SAR 2.7 bn (Q3 2016: 2.7 bn)
» Q3 2017 net income of SAR 105.7 mn (Q3 2016: SAR 101.2 mn)

GROUP – CONSOLIDATED FINANCIAL SNAPSHOT
SAR Mn
Q3 2017
YTD 2017
Revenue
5,663-8.0% vs. LY
18,208 -7.7% vs. LY
Gross Profit
1,042-11.9% vs. LY
3,222 -15.0% vs. LY
EBIT
280-20.9% vs. LY
712 -38.2% vs. LY
Net Income
829+361.8% vs. LY
1,063+92.5% vs. LY
Adjusted Net
Income
135.1-24.7% vs. LY
316-44.8% vs. LY
5

Note: the figures presented in the charts are rounded
GROUP – CONSOLIDATED FINANCIAL HIGHLIGHTSGrowth Margin
SAR Mn
6
YoY Sales
Q1 2017
-9%
6,422 5,833
Q1 2016 YTD 2017
-8%
18,20819,717
YTD 2016
-18%
Q1 2017
1,0401,273
Q1 2016
3,222
-15%
YTD 2017
3,788
YTD 2016
YTD Sales
YoY Gross Profit YTD Gross Profit
Q2 2016
6,711
Q2 2017
-6%
7,141
-14%
1,333
Q2 2017Q2 2016
1,140
-8%
Q3 2017
5,6636,154
Q3 2016
1,042
Q3 2017
-12%
Q3 2016
1,183
19.8% 17.8% 19.2% 17.7%18.7% 17.0% 19.2% 18.4%

GROUP – CONSOLIDATED FINANCIAL HIGHLIGHTSGrowth Margin
SAR Mn
7
YoY EBITDA
512
Q1 2016 Q1 2017
332
-35%
YTD 2017YTD 2016
-24%
1,284
1,683
5 119
-96%
Q1 2016 Q1 2017
552
+93%
1,063
YTD 2017YTD 2016
YTD EBITDA
YoY Net Profit YTD Net Profit
1.9% 0.1% 2.8% 5.8%
-36%
440
Q2 2016
683
Q2 2017
-10%
Q2 2017
254
Q2 2016
229
3.6% 3.4%
8.0% 5.7% 8.5% 7.1%9.6% 6.6%
Note: the figures presented in the charts are rounded
512
+5%
Q3 2017Q3 2016
488
7.9% 9.0%
180
+362%
Q3 2017
829
Q3 2016
2.9% 14.6%

YTD 2017SAR 18.2 Bn
YTD 2016SAR 19.7 Bn
GROUP – CONSOLIDATED REVENUE MIX, NET DEBT & CAPEXSAR Bn
8
47.7%
4.6%
47.7%43.9%
51.8%
4.4%
Revenue by Business Net Debt
CAPEX
6,6038,035
Sep/16
-18%
Sep/17
1,132
357
YTD 2017
-68%
YTD 2016
Retail
Food Services
Foods
8.8%
7.5%
11.1%
72.6%
Revenue by Geography
Iran
Others
Egypt
KSA
YTD 2017SAR 18.2 Bn
YTD 2016SAR 19.7 Bn
8.4%
73.3%
8.7%
9.6%

IMPLICATIONS OF EXCEPTIONAL ITEMS
316
3425
1,063
86536724
2055239513
62
134
91
YT
D 2
01
6
Ad
jus
ted
NI
YT
D 2
01
7
rep
ort
ed
NI
Dilu
tio
n G
ain
on
US
CE
-63%
Pa
nd
a in
ve
nto
ry
ad
jus
tme
nts
SF
C F
X im
pa
ct
IFR
S
Ad
jus
tme
nt
Sh
are
of
as
so
cia
te’s
lia
bil
ity
US
D s
ou
rcin
g S
FC
Pa
nd
a E
gyp
t lo
ss
es
Pa
nd
ati
sto
re
clo
su
res
co
st
Ca
pit
al G
ain
on
Sa
le
of
Hyp
er
Pa
nd
a U
AE
Sh
are
of
imp
air
me
nt
los
s f
rom
an
as
so
cia
te
694
YT
D 2
01
6
rep
ort
ed
NI
Ga
in o
n S
ale
of
Ma
rai S
ha
res
YT
D 2
01
6 IF
RS
ad
jus
ted
NI
YT
D 2
01
7
Ad
jus
ted
NI
SAR Mn
9
Adjusted YTD 2016 Net Income Adjusted YTD 2017 Net Income

PANDA RETAIL COMPANY

RETAIL – HIGHLIGHTS
• The transformation exercise initiated last year is ongoing with several initiatives running concurrently.
• Six Pandati stores and three supermarkets closed in Q3 2017. Total retail selling space decreased by -0.06% in Q3 2017 from Dec 2016
• LFL sales dropped owing mainly to a reduction in basket size across both hypermarket and supermarket formats. This is mainly attributable to a consumer preference to buy promotional items.
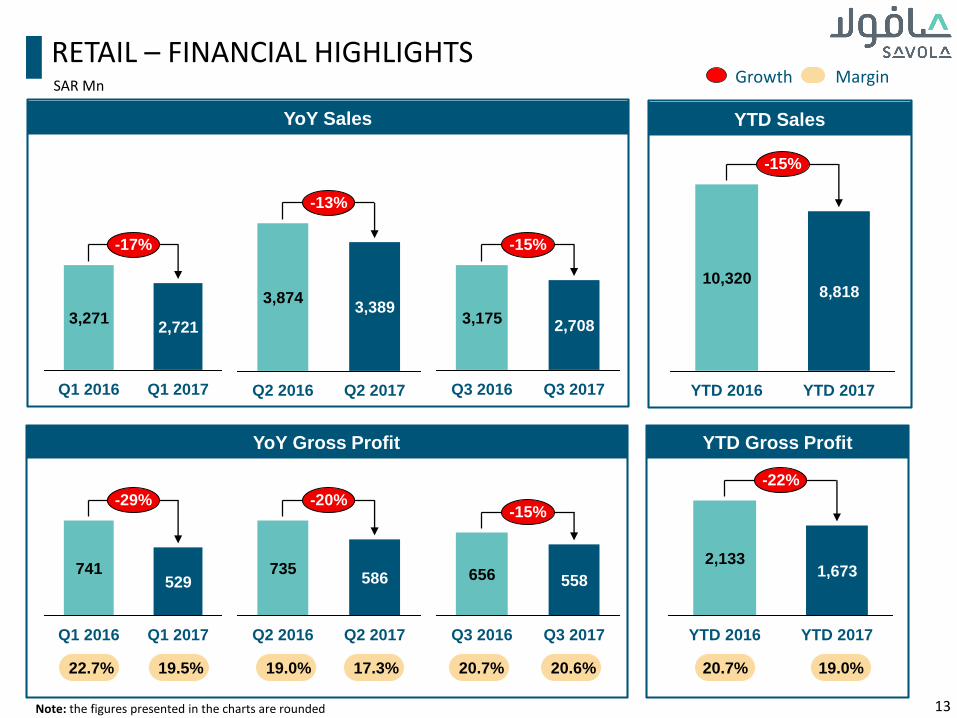
• Reported net loss for Q3 2017 for Retail was SAR 219 million, compared to SAR 142 million last year.
11

SAR m
Q3 2017
YTD 2017
Revenue
2,708-14.7% vs. LY
8,818-14.6% vs. LY
Gross Profit
558-15.0% vs. LY
1,673-21.6% vs. LY
Net Loss
(219)Q3 2016 : (142)
(608)YTD 2016: (268)
Adjusted Net Loss
(219) Q3 2016 : (142)
(670) YTD 2016: (268)
Selling Space
Reduced by 6,791 m2
Total Space 752,303 m2
RETAIL - SNAPSHOT
12
Note: the figures presented in the charts are rounded
RETAIL – FINANCIAL HIGHLIGHTSGrowth Margin
SAR Mn
13
YoY Sales
-17%
3,271
Q1 2016 Q1 2017
2,721
YTD 2017
-15%
8,81810,320
YTD 2016
-29%
Q1 2017
529
Q1 2016
741
-22%
YTD 2017
1,673
YTD 2016
2,133
YTD Sales
YoY Gross Profit YTD Gross Profit
3,874
-13%
Q2 2017
3,389
Q2 2016
-20%
586735
Q2 2016 Q2 2017
3,175
Q3 2016 Q3 2017
-15%
2,708
-15%
Q3 2016
656
Q3 2017
558
22.7% 19.5% 20.7% 19.0%19.0% 17.3% 20.7% 20.6%

RETAIL – FINANCIAL HIGHLIGHTSMargin
SAR Mn
14
YoY EBITDA
(84)
99
Q1 2016 Q1 2017
115
YTD 2016 YTD 2017
(245)
(608)
YTD 2017
(268)
YTD 2016
YTD EBITDA
YoY Net Profit YTD Net Profit
-1.0% -8.4% -2.6% -6.9%
40
Q2 2016 Q2 2017
(106)
(94)
Q2 2016 Q2 2017
(160)
-2.4% -4.7%
3.0% -3.1% 1.1% -2.8%1.0% -3.1%
(230)
Q1 2016 Q1 2017
(32)
Note: the figures presented in the charts are rounded
(75)
Q3 2017Q3 2016
(18)
-0.6% -2.8%
Q3 2016 Q3 2017
(219)(142)
-4.5% -8.1%

RETAIL – NUMBER OF STORES BY QUARTER
Selling Area
752,303 m2
(YTD Decline: -0.1%)
15
162163
Q1
’17
Q3
’17
(3)2
Dec
2016
Q2
’17
Closures YTD
’17
Hyper
Total
Selling Area
752,784 m2
6766
Closures YTD
’17
Q2
’17
Q3
’17
Dec
2016
(1)
Q1
’17
1 1
175 181
Dec
2016
(7)1
Q2
’17
Q1
’17
Closures YTD
’17
Q3
’17
404 410 3
Dec
2016
2
YTD
’17
Closures
(11)
Q2
’17
Q1
’17
Q3
’17
Super
Pandati
Hyper
Total
4 in Egypt
UAEHyper
EgyptHyper
1 KSA1 Egypt KSA
Hyper

SAVOLA FOODS

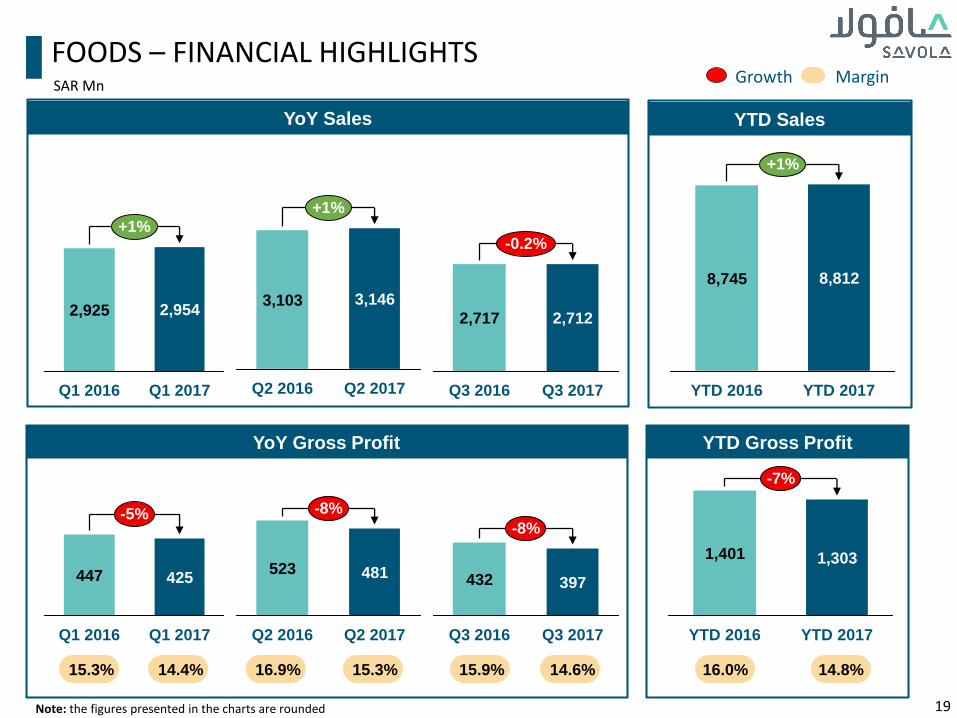
• Q3 2017 total revenue of SAR 2.71 billion is 0.2% below Q3 2016 revenue of SAR 2.72 billion while YTD September 2017 revenue was 8.8 billion vs. YTD September 2016 revenue of 8.7 billion (+0.8%)
• Total volume of 2,535 k MT 0.8% below September YTD 2016 attributed to the following:
• Oil volumes increased by 1.9%
• Sugar volumes decreased by 3.1%
• Pasta volumes decreased by 3.1%
• Reported net income for Q3 2017 for Food was SAR 106 million.
FOODS – HIGHLIGHTS
17

FOODS - SNAPSHOT
18
SAR m
Q3 2017
YTD 2017
Revenue
2,712-0.2% vs. LY
8,812+0.8% vs. LY
Gross Profit
397-8.0% vs. LY
1,303-7.0% vs. LY
EBIT
188-8.5% vs. LY
641-9.0% vs. LY
Net Income
106+4.5% vs. LY
409+16.6% vs. LY
Adjusted Net
Income
106+4.5% vs. LY
393+12.2% vs. LY
Note: the figures presented in the charts are rounded
FOODS – FINANCIAL HIGHLIGHTSGrowth Margin
SAR Mn
19
YoY Sales
+1%
Q1 2017
2,925 2,954
Q1 2016 YTD 2017
+1%
8,812
YTD 2016
8,745
-5%
Q1 2017Q1 2016
425447
YTD 2017
-7%
YTD 2016
1,401 1,303
YTD Sales
YoY Gross Profit YTD Gross Profit
Q2 2017
+1%
3,103 3,146
Q2 2016
-8%
523
Q2 2017
481
Q2 2016
2,712
Q3 2017
-0.2%
2,717
Q3 2016
Q3 2017Q3 2016
-8%
432 397
16.0% 14.8%16.9% 15.3%15.3% 14.4% 15.9% 14.6%
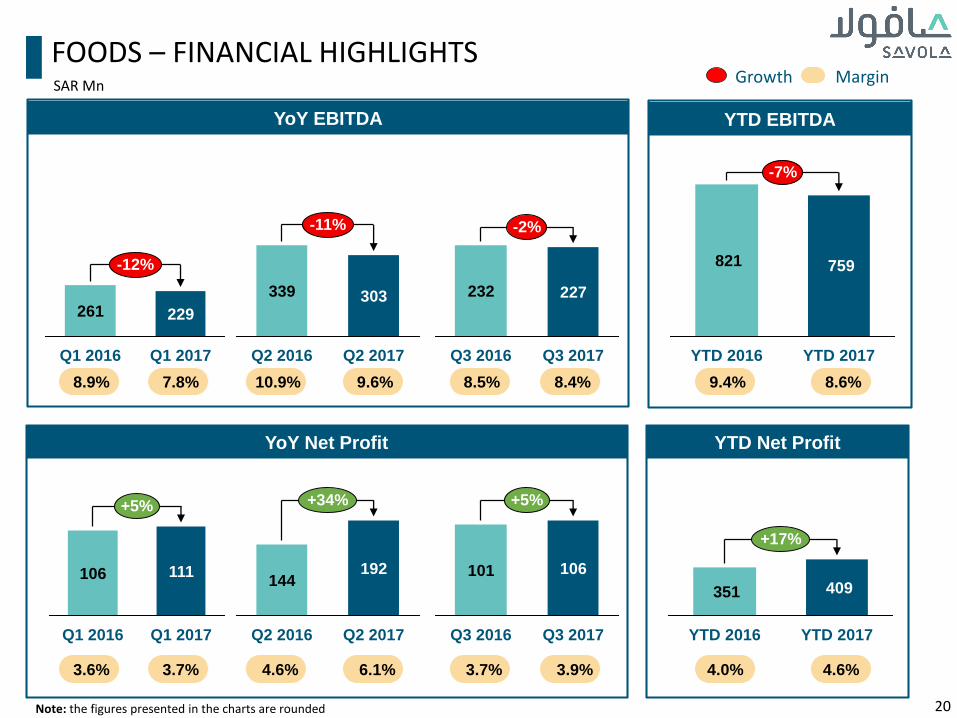
FOODS – FINANCIAL HIGHLIGHTSGrowth Margin
SAR Mn
20
YoY EBITDA
261
-12%
Q1 2017
229
Q1 2016
759 821
YTD 2016
-7%
YTD 2017
+5%
111
Q1 2016 Q1 2017
106 409 351
YTD 2016
+17%
YTD 2017
YTD EBITDA
YoY Net Profit YTD Net Profit
4.0% 4.6%
Q2 2017
-11%
339 303
Q2 2016
Q2 2017
+34%
144
Q2 2016
192
4.6% 6.1%
8.9% 7.8%
3.6% 3.7%
10.9% 9.6% 9.4% 8.6%
Note: the figures presented in the charts are rounded
-2%
227232
Q3 2017Q3 2016
8.5% 8.4%
Q3 2016
101
Q3 2017
+5%
106
3.7% 3.9%

FOODS – OIL SEGMENT ANALYSIS
21
SAR Mn
10%
11%
YTD 2017
5,978
34%
+0.5%
29%
7%6%
4%
15%
5%
5,949
28%
32%
4%
4%
YTD 2016
11%
Iran
YoY +6%
Egypt
YoY -26%
KSA
YoY +4%
Sudan
YoY +13%
Morocco
YoY +12%
Algeria
YoY +20%
Turkey
YoY -7%
5%
+1.9%
YTD 2017
1,192
13%
30%
9%
9%
29%
31%
15%
8%
9%
28%
YTD 2016
4%
1,1705%5%
Turkey
YoY +4%
Sudan
YoY +11%
Egypt
YoY -9%
Algeria
YoY +14%
Morocco
YoY +5%
KSA
YoY +5%
Iran
YoY -1%
Volume (MT 000) Revenues
Note: the figures presented in the charts are rounded

FOODS – SUGAR SEGMENT ANALYSIS
22
88%
YTD 2017
+6.2%
12%
2,367
YTD 2016
88%
2,515
12%
KSA
YoY +6%
Egypt
YoY +6%-3.1%
1,1301,166
YTD 2016
12%
88%
YTD 2017
12%
88%
KSA
YoY -3%
Egypt
YoY -4%
SAR Mn
Volume (MT ‘000) (1) Revenues (1)
(1) Sugar volumes and revenues include only the contribution from sugar operations (USC and ASC).

FINANCIAL SUMMARY

FINANCIALS – YTD September 2017
24
Note: YTD 2016 net income has been adjusted for IFRS, whereas Adjusted Profit excludes the impact of both SFC FX impact, USD sourcing and Panda one off items shown earlier in slide 9.
(all figures are in SAR millions)
Revenue Gross Profit EBIT Net Income EBITDA Revenue Gross Profit EBIT Net Income EBITDA
Food
Oil-Mature Markets 5,037 866 383 275 433 5,134 1,029 562 371 610
Oil-Start-up Markets* 941 109 41 23 50 815 103 35 20 45
Total Oil 5,978 976 424 298 484 5,949 1,131 597 390 655
Sugar 2,523 285 201 102 249 2,367 169 53 (77) 99
Pasta 310 42 17 9 27 429 100 55 37 67
Total Foods 8,812 1,303 641 409 759 8,745 1,401 705 351 821
Retail
KSA 8,669 1,657 (609) (656) (230) 10,068 2,086 (207) (264) 114
Overseas 149 17 (19) 48 (15) 252 48 (2) (4) 2
Total Retail 8,818 1,673 (627) (608) (245) 10,320 2,133 (209) (268) 115
Herfy 859 252 163 152 216 876 257 170 162 235
Real Estate - - (26) (26) (26) - - 16 16 16
Al Marai-Savola Share - - 607 607 607 - - 590 590 590
HQ/Elimination/Impairments (281) (7) (47) 529 (28) (224) (3) (121) (299) (93)
Total 18,208 3,222 712 1,063 1,284 19,717 3,788 1,151 552 1,683
Adjustments
Gain on Sale of USCE (25) -
Share of Associates Liability - 20
Gain on Sale of Hyper Panda UAE (62) -
Gain on Sale of 2% of Al Marai (694) -
Share of impairment Loss from an Associate 34 -
Adjusted Profit 316 573
* Start-up markets include Algeria, Morocco and Sudan
Segment Wise Financials
YTD - 2017 YTD - 2016 (Represented)


