Renesas Electronics’ Consolidated Financial Results for the Third Quarter Ended September 30, 2020 Media Contacts Investor Contacts Kyoko Okamoto Shigeo Muto Renesas Electronics Corporation Renesas Electronics Corporation +81 3-6773-3001 +81 3-6773-3002 [email protected][email protected]Renesas Electronics Reports Financial Results for the Third Quarter Ended September 30, 2020 TOKYO, Japan, October 29, 2020 — Renesas Electronics Corporation (TSE:6723) today announced consolidated financial results in accordance with IFRS for the nine months ended September 30, 2020. Summary of Consolidated Financial Results (Note 1) Three months ended September 30, 2020 Nine months ended September 30, 2020 Billion Yen % of Revenue Billion Yen % of Revenue Revenue 178.7 100.0 524.1 100.0 Operating profit 17.2 9.7 47.8 9.1 Profit attributable to owners of parent 15.3 8.5 38.5 7.3 Capital expenditures (Note 2) 4.6 14.8 Depreciation and others (Note 3) 34.5 107.7 R&D expenses (Note 4) 33.4 98.5 Yen Yen Exchange rate (USD) 107 108 Exchange rate (EUR) 123 121 As of September 30, 2020 Billion Yen Total assets 1,620.4 Total equity 632.2 Equity attributable to owners of parent 629.3 Equity ratio attributable to owners of parent (%) 38.8 Interest-bearing liabilities 717.1 Note 1: All figures are rounded to the nearest 100 million yen. Note 2: Capital expenditures refer to the amount of capital for property, plant and equipment (manufacturing equipment) and intangible assets based on the amount of investment decisions made during the quarter ended September 30, 2020. From the quarter ended March 31, 2020, capital expenditures include Integrated Device Technology, Inc. (hereinafter “IDT”)’s investments as well as investments including fixed costs of masks and tools. Note 3: Depreciation and others includes depreciation of property, plant and equipment, amortization of intangible assets and amortization of long-term prepaid expenses in consolidated statements of cash flows. Note 4: R&D expenses includes a partially capitalized R&D expenses recorded as intangible assets.
Transcript
Renesas Electronics’ Consolidated Financial Results for the Third Quarter Ended September 30, 2020
Renesas Electronics Reports Financial Results for the Third Quarter Ended September 30, 2020
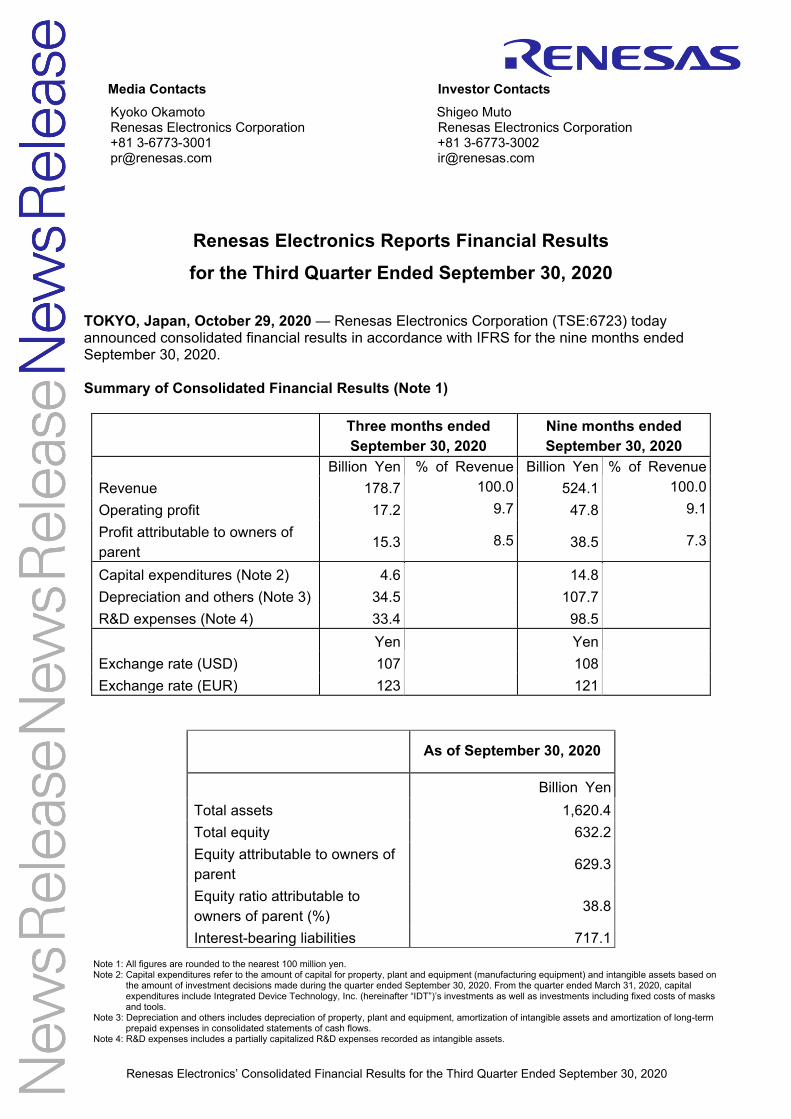
TOKYO, Japan, October 29, 2020 — Renesas Electronics Corporation (TSE:6723) today announced consolidated financial results in accordance with IFRS for the nine months ended September 30, 2020. Summary of Consolidated Financial Results (Note 1)
Three months ended September 30, 2020
Nine months ended September 30, 2020
Billion Yen % of Revenue Billion Yen % of Revenue Revenue 178.7 100.0 524.1 100.0 Operating profit 17.2 9.7 47.8 9.1 Profit attributable to owners of parent
15.3 8.5 38.5 7.3
Capital expenditures (Note 2) 4.6 14.8 Depreciation and others (Note 3) 34.5 107.7 R&D expenses (Note 4) 33.4 98.5 Yen Yen Exchange rate (USD) 107 108 Exchange rate (EUR) 123 121
As of September 30, 2020
Billion Yen Total assets 1,620.4 Total equity 632.2 Equity attributable to owners of parent
629.3
Equity ratio attributable to owners of parent (%)
38.8
Interest-bearing liabilities 717.1
Note 1: All figures are rounded to the nearest 100 million yen. Note 2: Capital expenditures refer to the amount of capital for property, plant and equipment (manufacturing equipment) and intangible assets based on
the amount of investment decisions made during the quarter ended September 30, 2020. From the quarter ended March 31, 2020, capital expenditures include Integrated Device Technology, Inc. (hereinafter “IDT”)’s investments as well as investments including fixed costs of masks and tools.
Note 3: Depreciation and others includes depreciation of property, plant and equipment, amortization of intangible assets and amortization of long-term prepaid expenses in consolidated statements of cash flows.
Note 4: R&D expenses includes a partially capitalized R&D expenses recorded as intangible assets.
Renesas Electronics’ Consolidated Financial Results for the Third Quarter Ended September 30, 2020
RENESAS ELECTRONICS CORPORATION Consolidated Financial Results for the Third Quarter Ended September 30, 2020
English translation from the original Japanese-language document
October 29, 2020
Company name :Renesas Electronics Corporation Stock exchanges on which the shares are listed :Tokyo Stock Exchange, First Section Code number :6723 URL :https://www.renesas.com Representative :Hidetoshi Shibata, Representative Director,
President and CEO Contact person :Yoichi Kobayashi, Senior Director
Filing date of Shihanki Hokokusho (scheduled) :November 5, 2020 (Amounts are rounded to the nearest million yen) 1. Consolidated financial results for the nine months ended September 30, 2020 1.1 Consolidated financial results (% of change from corresponding period of the previous year)
Revenue Operating profit (loss)
Profit before tax from continuing
operations (loss)
Profit (loss)
Profit attributable to
owners of parent (loss)
Total comprehensive
income (loss)
Million yen
% Million yen
%
Million yen
%
Million yen
%
Million yen
%
Million yen
%
Nine months ended September 30, 2020 Nine months ended September 30, 2019
524,093
526,241
(0.4)
(7.5)
47,818
(4,174)
---
---
46,592
(6,608)
---
---
38,488
(6,965)
---
---
38,471
(6,967)
---
---
(3,930)
(44,305)
---
---
Basic earnings per share
(loss)
Diluted earnings per share
(loss) Yen Yen Nine months ended September 30, 2020 Nine months ended September 30, 2019
22.42
(4.12)
21.98
(4.12)
1.2 Consolidated financial position
Total assets Total equity Equity attributable
to owners of parent
Equity ratio attributable to
owners of parent Million yen Million yen Million yen % September 30, 2020 December 31, 2019
1,620,426
1,668,148
632,171
624,404
629,311
621,455
38.8
37.3
Renesas Electronics’ Consolidated Financial Results for the Third Quarter Ended September 30, 2020
2. Cash dividends
Cash dividends per share At the end
of first quarter
At the end of second
quarter
At the end of third quarter
At the end of year
Total
Yen Yen Yen Yen Yen Year ended December 31, 2019
--- 0.00 --- 0.00 0.00
Year ending December 31, 2020
--- 0.00 ---
Year ending December 31, 2020 (forecast)
0.00 0.00
Note: Change in forecast of cash dividends since the most recently announced forecast: Yes
3. Forecast of consolidated results for the full year ending December 31, 2020
Non-GAAP Revenue
Non-GAAP Gross Margin
Non-GAAP Operating Margin
Full year ending December 31, 2020
Million yen
707,093 to 715,093
%
(1.6) to (0.4)
%
47.3
%pts
4.4
%
19.0
%pts
6.1
Note 1: The Group reports its consolidated forecast on a quarterly basis (cumulative quarters) as substitute for a yearly forecast in a range format. For details, please refer to Appendix 1.3. “Consolidated Forecasts” page 6.
Note 2: Non-GAAP figures are calculated by removing or adjusting non-recurring items and other adjustments from GAAP figures following a certain set of rules. The Group believes non-GAAP measures provide useful information in understanding and evaluating the Group’s constant business results, and therefore forecasts are provided as a non-GAAP basis.
4. Others 4.1 Changes in significant subsidiaries for the nine months ended September 30, 2020: Yes (Changes in specified subsidiaries resulting in changes in scope of consolidation) (Note) For details, please refer to page 16. 4.2 Changes in Accounting Policies, Changes in Accounting Estimates and Corrections of Prior Period Errors
1. Changes in accounting policies with revision of accounting standard: No 2. Changes in accounting policies except for 4.2.1: Yes 3. Changes in accounting estimates: No
4.3 Number of shares issued and outstanding (common stock) 1. Number of shares issued and outstanding (including treasury stock)
As of September 30, 2020: 1,723,201,290 shares As of December 31, 2019: 1,710,276,790 shares
2. Number of treasury stock
As of September 30, 2020: 2,581 shares As of December 31, 2019: 2,581 shares
3. Average number of shares issued and outstanding
Nine months ended September 30, 2020: 1,716,107,309 shares Nine months ended September 30, 2019: 1,689,257,809 shares
(Note) Information regarding the implementation of audit procedures.
These financial results are not subject to quarterly review procedures by the independent auditor. .
Renesas Electronics’ Consolidated Financial Results for the Third Quarter Ended September 30, 2020
Cautionary Statement
The Group will hold a quarterly earnings conference for institutional investors and analysts on October 29, 2020. The Group plans to post the materials which are provided at the meeting, on the Group’s website on that day.
The statements with respect to the financial outlook of Renesas Electronics Corporation (hereinafter “the Company”) and its consolidated subsidiaries (hereinafter “the Group”) are forward-looking statements involving risks and uncertainties. We caution you in advance that actual results may differ materially from such forward-looking statements due to changes in several important factors.
1 Renesas Electronics’ Consolidated Financial Results for the Third Quarter Ended September 30, 2020
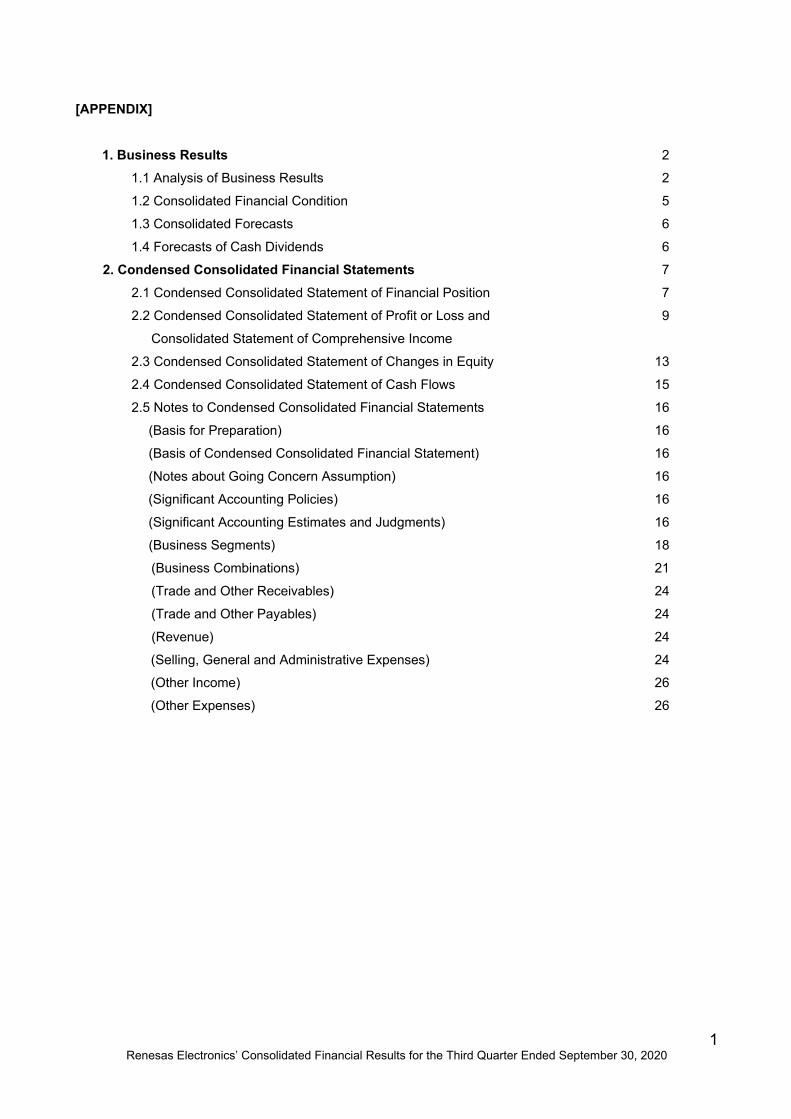
[APPENDIX]
1. Business Results 2 1.1 Analysis of Business Results 2
1.2 Consolidated Financial Condition 5
1.3 Consolidated Forecasts 6
1.4 Forecasts of Cash Dividends 6
2. Condensed Consolidated Financial Statements 7
2.1 Condensed Consolidated Statement of Financial Position 7
2.2 Condensed Consolidated Statement of Profit or Loss and 9
Consolidated Statement of Comprehensive Income
2.3 Condensed Consolidated Statement of Changes in Equity 13
2.4 Condensed Consolidated Statement of Cash Flows 15
2.5 Notes to Condensed Consolidated Financial Statements 16
(Basis for Preparation) 16
(Basis of Condensed Consolidated Financial Statement) 16
(Notes about Going Concern Assumption) 16
(Significant Accounting Policies) 16
(Significant Accounting Estimates and Judgments) 16
(Business Segments) 18 (Business Combinations) 21
(Trade and Other Receivables) 24
(Trade and Other Payables) 24
(Revenue) 24
(Selling, General and Administrative Expenses) 24 (Other Income) 26 (Other Expenses) 26
2 Renesas Electronics’ Consolidated Financial Results for the Third Quarter Ended September 30, 2020
1. Business Results
1.1 Analysis of Business Results The Group discloses consolidated business results in terms of both its internal measures which the management relies upon in making decisions (hereinafter the “Non-GAAP” financial measures) and those under IFRS. Non-GAAP operating profit is operating profit under IFRS (hereinafter “IFRS operating profit”) after excluding or adjusting non-recurring items and other adjustments following a certain set of rules. The Group believes providing non-GAAP forecasts will help to better understand the Group’s constant business results. Non-recurring items include depreciation of intangible assets recognized from acquisitions, other purchase price allocation (hereinafter “PPA”) adjustments, cost relating to acquisitions and stock-based compensation as well as other non-recurring expenses and income the Group believes to be applicable.
In addition, after acquisition of IDT in March 2019 and the transition to an organizational structure based on two business units, the financial figures disclosed have been reformed into two segments: “Automotive Business” and “Industrial/Infrastructure/IoT Business” from the third quarter ended September 30, 2019. Following these changes, the Group discontinued the disclosure of the “Non-GAAP Revenue from Semiconductors” segment. For details, please refer to Appendix 2 “Condensed Consolidated Financial Statements, 2.5 Notes to Condensed Consolidated Financial Statements (Business Segments)”.
Moreover, the Group finalized provisional accounting treatment for business integration as of the financial year ended December 31, 2019, and for the nine months ended September 30, 2019 as well as the three months ended September 30, 2019, therefore the condensed quarterly consolidated financial results reflect significant revised acquisition cost allocation. For details, please refer to Appendix 2. “Condensed Consolidated Financial Statements, 2.5 Notes to Condensed Consolidated Financial Statements (Business Combinations)”.
Furthermore, following the acquisition of IDT and the absorption type merger of IDT with Renesas Electronics America Inc., since January 1, 2020, the Group has begun the integration of business processes and IT systems, etc. as part of the “One Renesas” promotion. With these processes as a momentum, expense classifications have been revised in order to appropriately display the Group’s financial status and business performance. Changes in classifications have been applied retroactively; therefore, the consolidated financial results of the nine months ended September 30, 2019 as well as the three months ended September 30, 2019 have been reclassified. For details, please refer to Appendix 2 “Condensed Consolidated Financial Statements, 2.5 Notes to Condensed Consolidated Financial Statements (Basis for Preparation), (4) Changes in Accounting Policy (Changes of the classification of expenses)”.
(Note): For disclosure of Non-GAAP financial measures, the Group refers to the rules specified by the U.S. Securities and
Exchange Commission but does not fully comply with such rules.
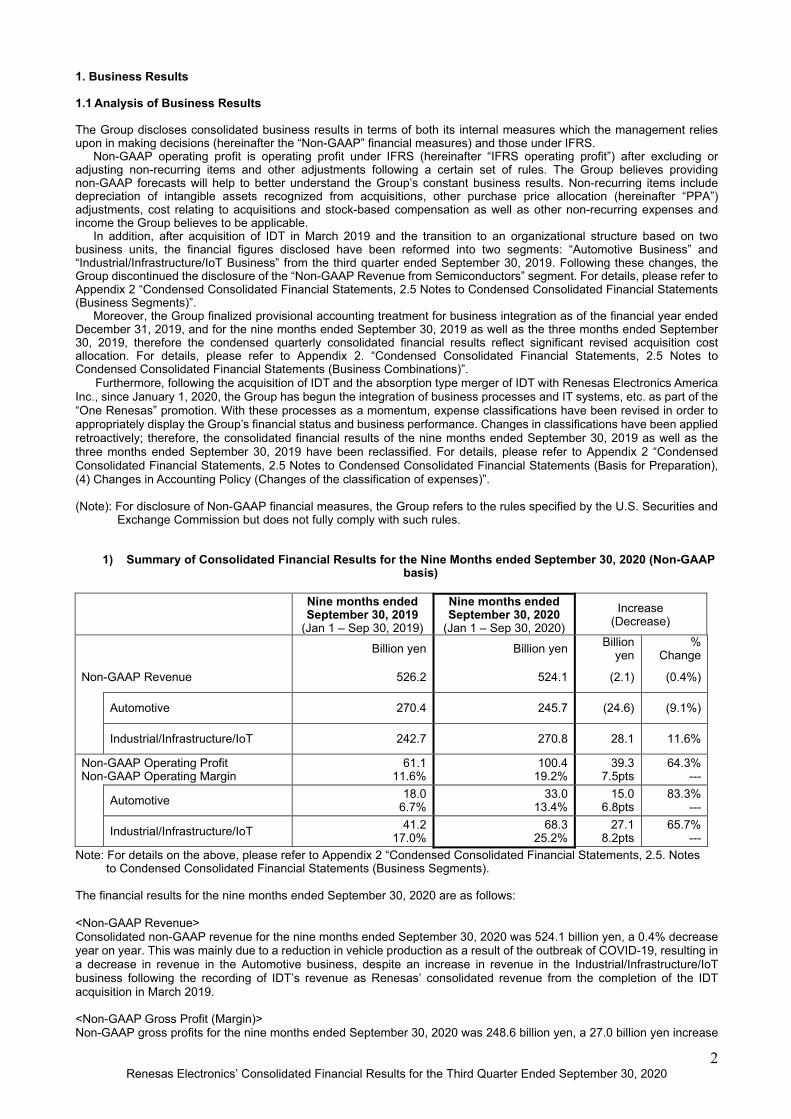
1) Summary of Consolidated Financial Results for the Nine Months ended September 30, 2020 (Non-GAAP basis)
Note: For details on the above, please refer to Appendix 2 “Condensed Consolidated Financial Statements, 2.5. Notes to Condensed Consolidated Financial Statements (Business Segments).
The financial results for the nine months ended September 30, 2020 are as follows: <Non-GAAP Revenue> Consolidated non-GAAP revenue for the nine months ended September 30, 2020 was 524.1 billion yen, a 0.4% decrease year on year. This was mainly due to a reduction in vehicle production as a result of the outbreak of COVID-19, resulting in a decrease in revenue in the Automotive business, despite an increase in revenue in the Industrial/Infrastructure/IoT business following the recording of IDT’s revenue as Renesas’ consolidated revenue from the completion of the IDT acquisition in March 2019. <Non-GAAP Gross Profit (Margin)> Non-GAAP gross profits for the nine months ended September 30, 2020 was 248.6 billion yen, a 27.0 billion yen increase
3 Renesas Electronics’ Consolidated Financial Results for the Third Quarter Ended September 30, 2020
year on year. This was mainly due to the effects of sales increases in the Industrial/Infrastructure/IoT business as well as reduction of fixed costs. As a result, non-GAAP gross margin for the nine months ended September 30, 2020 was 47.4%, an increase by 5.3 points year on year. <Non-GAAP Operating Profit (Margin)> Non-GAAP operating profit for the nine months ended September 30, 2020 was 100.4 billion yen, a 39.3 billion yen increase year on year. This was mainly due to an increase in gross profit as well as optimization of costs, mainly in selling, general and administrative expenses. As a result, non-GAAP operating margin for the nine months ended September 30, 2020 was 19.2%, an increase by 7.5 points year on year.
The non-GAAP revenue breakdown of the business segments for the nine months ended September 30, 2020 are as follows: Automotive Business The Automotive business includes the product categories “Automotive control,” comprising semiconductor devices for controlling automobile engines and bodies, and “Automotive information,” comprising of semiconductor devices used in sensing systems for detecting environments inside and outside the vehicle as well as automotive information devices such as IVI (in-vehicle infotainment) and instrument panels used to give various information to the driver of the vehicle. The Group mainly supplies microcontrollers (MCUs), system-on-chips (SoCs), analog semiconductor devices and power semiconductor devices in each of these categories.
Non-GAAP revenue of the Automotive business for the nine months ended September 30, 2020 was 245.7 billion yen, a 9.1% decrease year on year. This was mainly due to a decrease in sales in the “Automotive control” category owing to the slowdown in the automotive business resulting from the reduction in vehicle production.
Non-GAAP operating profit of the Automotive business for the nine months ended September 30, 2020 was 33.0 billion yen, a 15.0 billion yen increase year on year. This was mainly due to an increase in gross margin owing to improvements to the product mix as well as a decrease in selling, general and administrative expenses despite a decrease in revenue. Industrial/Infrastructure/IoT Business The Industrial/Infrastructure/IoT business includes the categories “Industrial”, “Infrastructure” and “IoT” which support the smart society. The Group mainly supplies MCUs and SoCs in each of these categories.
Non-GAAP revenue of the Industrial/Infrastructure/IoT business for the nine months ended September 30, 2020 was 270.8 billion yen, an 11.6% increase year on year. This was mainly due to revenue increase effects following the completion of the IDT acquisition in March 2019 and increased revenue in the “Infrastructure” category, mainly in data centers, and the “IoT” category, in OA devices for PCs which have seen increased demands owing to remote work and remote learning.
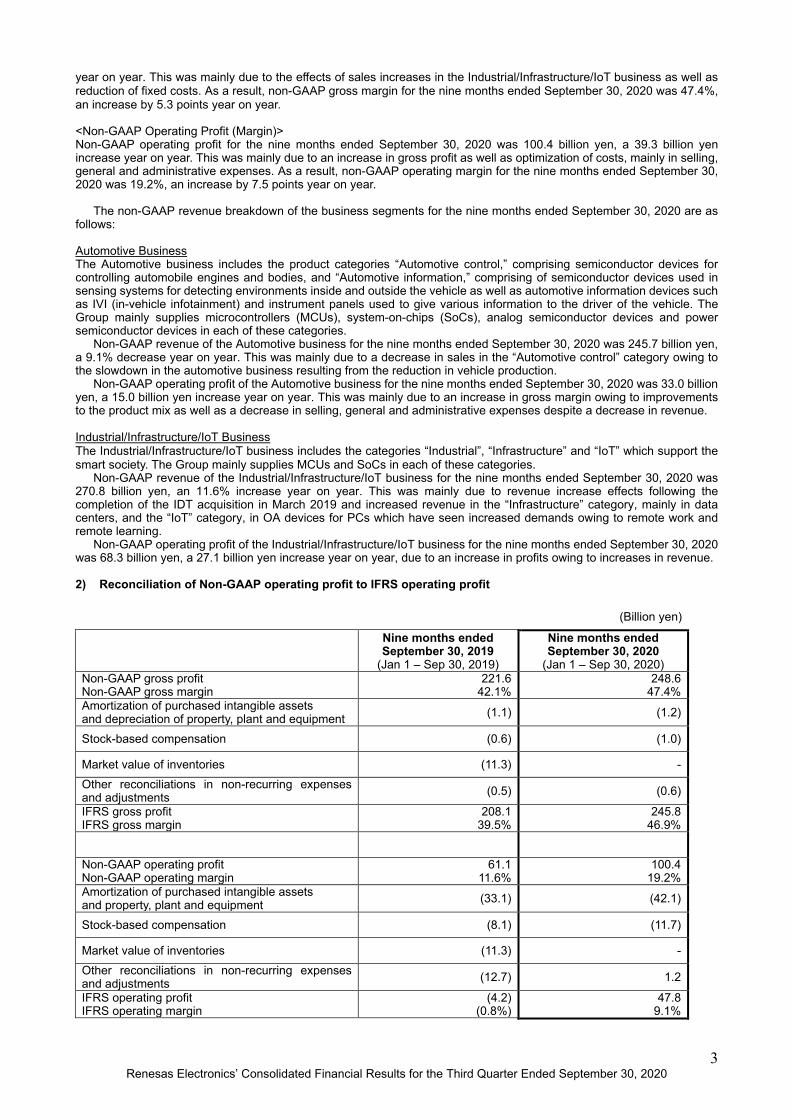
Non-GAAP operating profit of the Industrial/Infrastructure/IoT business for the nine months ended September 30, 2020 was 68.3 billion yen, a 27.1 billion yen increase year on year, due to an increase in profits owing to increases in revenue. 2) Reconciliation of Non-GAAP operating profit to IFRS operating profit
Amortization of purchased intangible assets and property, plant and equipment (33.1) (42.1)
Stock-based compensation (8.1) (11.7)
Market value of inventories (11.3) - Other reconciliations in non-recurring expenses and adjustments (12.7) 1.2
IFRS operating profit IFRS operating margin
(4.2) (0.8%)
47.8 9.1%
4 Renesas Electronics’ Consolidated Financial Results for the Third Quarter Ended September 30, 2020
(Note): “Other reconciliations in non-recurring expenses and adjustments” includes the non-recurring items related to acquisitions and other adjustments as well as non-recurring profits or losses.
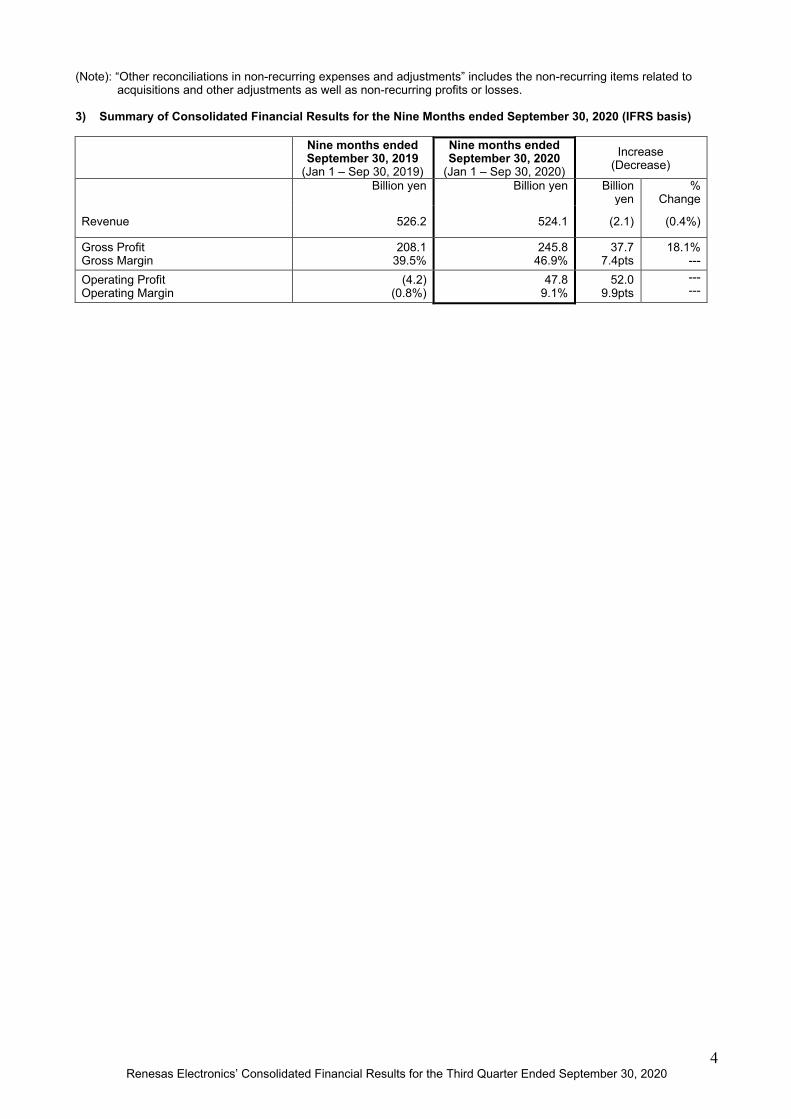
3) Summary of Consolidated Financial Results for the Nine Months ended September 30, 2020 (IFRS basis)
Nine months ended September 30, 2019
(Jan 1 – Sep 30, 2019)
Nine months ended September 30, 2020
(Jan 1 – Sep 30, 2020) Increase
(Decrease)
Billion yen Billion yen Billion yen
% Change
Revenue 526.2 524.1 (2.1) (0.4%)
Gross Profit Gross Margin
208.1 39.5%
245.8 46.9%
37.7 7.4pts
18.1% ---
Operating Profit Operating Margin
(4.2) (0.8%)
47.8 9.1%
52.0 9.9pts
--- ---
5 Renesas Electronics’ Consolidated Financial Results for the Third Quarter Ended September 30, 2020
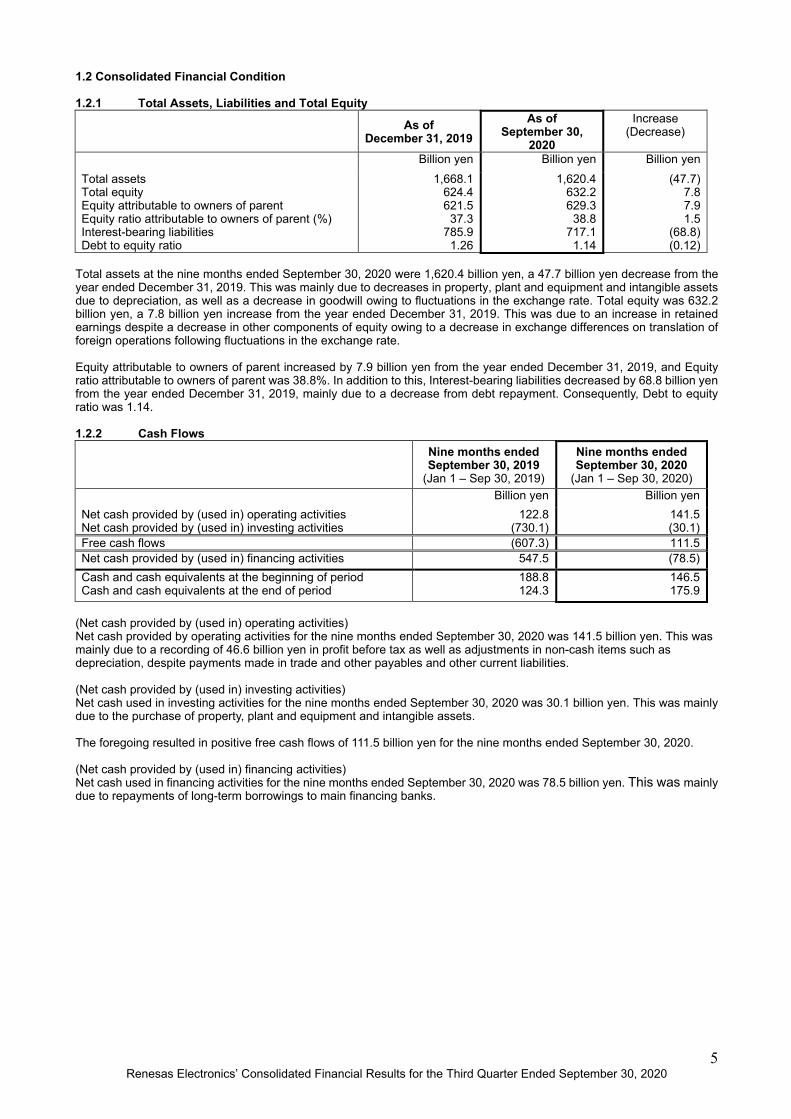
1.2 Consolidated Financial Condition 1.2.1 Total Assets, Liabilities and Total Equity As of
December 31, 2019 As of
September 30, 2020
Increase (Decrease)
Billion yen Billion yen Billion yen Total assets Total equity Equity attributable to owners of parent Equity ratio attributable to owners of parent (%) Interest-bearing liabilities Debt to equity ratio
1,668.1 624.4 621.5 37.3
785.9 1.26
1,620.4 632.2 629.3 38.8
717.1 1.14
(47.7) 7.8 7.9 1.5
(68.8) (0.12)
Total assets at the nine months ended September 30, 2020 were 1,620.4 billion yen, a 47.7 billion yen decrease from the year ended December 31, 2019. This was mainly due to decreases in property, plant and equipment and intangible assets due to depreciation, as well as a decrease in goodwill owing to fluctuations in the exchange rate. Total equity was 632.2 billion yen, a 7.8 billion yen increase from the year ended December 31, 2019. This was due to an increase in retained earnings despite a decrease in other components of equity owing to a decrease in exchange differences on translation of foreign operations following fluctuations in the exchange rate. Equity attributable to owners of parent increased by 7.9 billion yen from the year ended December 31, 2019, and Equity ratio attributable to owners of parent was 38.8%. In addition to this, Interest-bearing liabilities decreased by 68.8 billion yen from the year ended December 31, 2019, mainly due to a decrease from debt repayment. Consequently, Debt to equity ratio was 1.14. 1.2.2 Cash Flows Nine months ended
September 30, 2019 (Jan 1 – Sep 30, 2019)
Nine months ended September 30, 2020
(Jan 1 – Sep 30, 2020) Billion yen Billion yen Net cash provided by (used in) operating activities Net cash provided by (used in) investing activities
122.8 (730.1)
141.5 (30.1)
Free cash flows (607.3) 111.5 Net cash provided by (used in) financing activities 547.5 (78.5) Cash and cash equivalents at the beginning of period Cash and cash equivalents at the end of period
188.8 124.3
146.5 175.9
(Net cash provided by (used in) operating activities) Net cash provided by operating activities for the nine months ended September 30, 2020 was 141.5 billion yen. This was mainly due to a recording of 46.6 billion yen in profit before tax as well as adjustments in non-cash items such as depreciation, despite payments made in trade and other payables and other current liabilities. (Net cash provided by (used in) investing activities) Net cash used in investing activities for the nine months ended September 30, 2020 was 30.1 billion yen. This was mainly due to the purchase of property, plant and equipment and intangible assets. The foregoing resulted in positive free cash flows of 111.5 billion yen for the nine months ended September 30, 2020. (Net cash provided by (used in) financing activities) Net cash used in financing activities for the nine months ended September 30, 2020 was 78.5 billion yen. This was mainly due to repayments of long-term borrowings to main financing banks.
6 Renesas Electronics’ Consolidated Financial Results for the Third Quarter Ended September 30, 2020
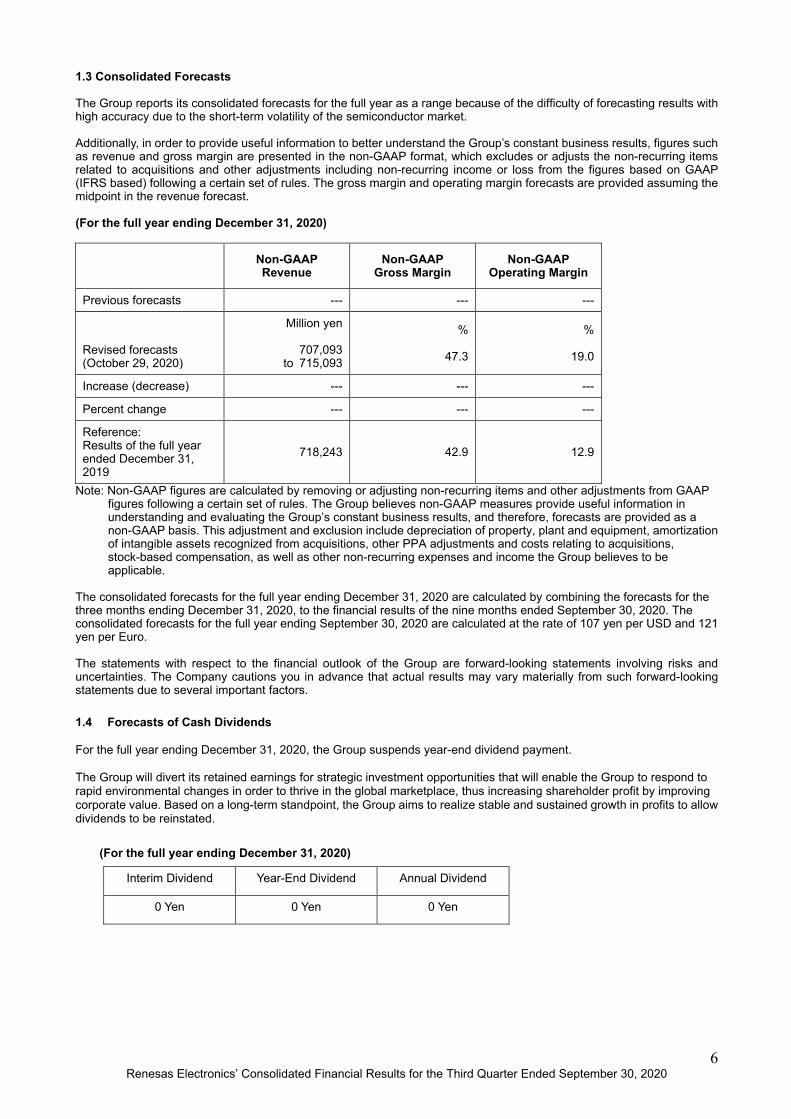
1.3 Consolidated Forecasts The Group reports its consolidated forecasts for the full year as a range because of the difficulty of forecasting results with high accuracy due to the short-term volatility of the semiconductor market. Additionally, in order to provide useful information to better understand the Group’s constant business results, figures such as revenue and gross margin are presented in the non-GAAP format, which excludes or adjusts the non-recurring items related to acquisitions and other adjustments including non-recurring income or loss from the figures based on GAAP (IFRS based) following a certain set of rules. The gross margin and operating margin forecasts are provided assuming the midpoint in the revenue forecast. (For the full year ending December 31, 2020)
Non-GAAP Revenue
Non-GAAP Gross Margin
Non-GAAP Operating Margin
Previous forecasts --- --- ---
Revised forecasts (October 29, 2020)
Million yen
707,093 to 715,093
%
47.3
%
19.0
Increase (decrease) --- --- ---
Percent change --- --- ---
Reference: Results of the full year ended December 31, 2019
718,243 42.9 12.9
Note: Non-GAAP figures are calculated by removing or adjusting non-recurring items and other adjustments from GAAP figures following a certain set of rules. The Group believes non-GAAP measures provide useful information in understanding and evaluating the Group’s constant business results, and therefore, forecasts are provided as a non-GAAP basis. This adjustment and exclusion include depreciation of property, plant and equipment, amortization of intangible assets recognized from acquisitions, other PPA adjustments and costs relating to acquisitions, stock-based compensation, as well as other non-recurring expenses and income the Group believes to be applicable.
The consolidated forecasts for the full year ending December 31, 2020 are calculated by combining the forecasts for the three months ending December 31, 2020, to the financial results of the nine months ended September 30, 2020. The consolidated forecasts for the full year ending September 30, 2020 are calculated at the rate of 107 yen per USD and 121 yen per Euro. The statements with respect to the financial outlook of the Group are forward-looking statements involving risks and uncertainties. The Company cautions you in advance that actual results may vary materially from such forward-looking statements due to several important factors. 1.4 Forecasts of Cash Dividends For the full year ending December 31, 2020, the Group suspends year-end dividend payment. The Group will divert its retained earnings for strategic investment opportunities that will enable the Group to respond to rapid environmental changes in order to thrive in the global marketplace, thus increasing shareholder profit by improving corporate value. Based on a long-term standpoint, the Group aims to realize stable and sustained growth in profits to allow dividends to be reinstated.
7 Renesas Electronics’ Consolidated Financial Results for the Third Quarter Ended September 30, 2020
2. Condensed Consolidated Financial Statements 2.1 Condensed Consolidated Statement of Financial Position
(In millions of yen) As of December 31, 2019 As of September 30, 2020
Assets Current assets
Cash and cash equivalents 146,468 175,886 Trade and other receivables 84,459 79,311 Inventories 90,785 96,877 Other current financial assets 468 433 Income taxes receivable 4,438 2,506 Other current assets 7,344 6,864 Total current assets 333,962 361,877
Non-current assets
Property, plant and equipment 232,579 198,852 Goodwill 625,030 603,581 Intangible assets 414,582 386,670 Other non-current financial assets 9,995 13,312 Deferred tax assets 46,050 50,462 Other non-current assets 5,950 5,672 Total non-current assets 1,334,186 1,258,549 Total assets 1,668,148 1,620,426
8 Renesas Electronics’ Consolidated Financial Results for the Third Quarter Ended September 30, 2020
(In millions of yen) As of December 31, 2019 As of September 30, 2020
Liabilities and equity Liabilities
Current liabilities Trade and other payables 100,187 95,259 Bonds and borrowings 93,182 93,182 Other current financial liabilities 4,362 3,919 Income taxes payable 7,861 10,466 Provisions 7,521 4,451 Other current liabilities 55,528 51,173 Total current liabilities 268,641 258,450
Non-current liabilities
Trade and other payables 845 27,496 Bonds and borrowings 678,577 609,535 Other non-current financial liabilities 10,093 10,740 Income taxes payable 4,499 4,375 Retirement benefit liability 29,572 29,138 Provisions 3,860 3,030 Deferred tax liabilities 43,257 41,045 Other non-current liabilities 4,400 4,446 Total non-current liabilities 775,103 729,805 Total liabilities 1,043,744 988,255
Equity
Share capital 22,213 26,219 Capital surplus 201,588 205,594 Retained earnings 403,857 443,175 Treasury shares (11) (11) Other components of equity (6,192) (45,666) Total equity attributable to owners of parent 621,455 629,311 Non-controlling interests 2,949 2,860 Total equity 624,404 632,171 Total liabilities and equity 1,668,148 1,620,426
9 Renesas Electronics’ Consolidated Financial Results for the Third Quarter Ended September 30, 2020
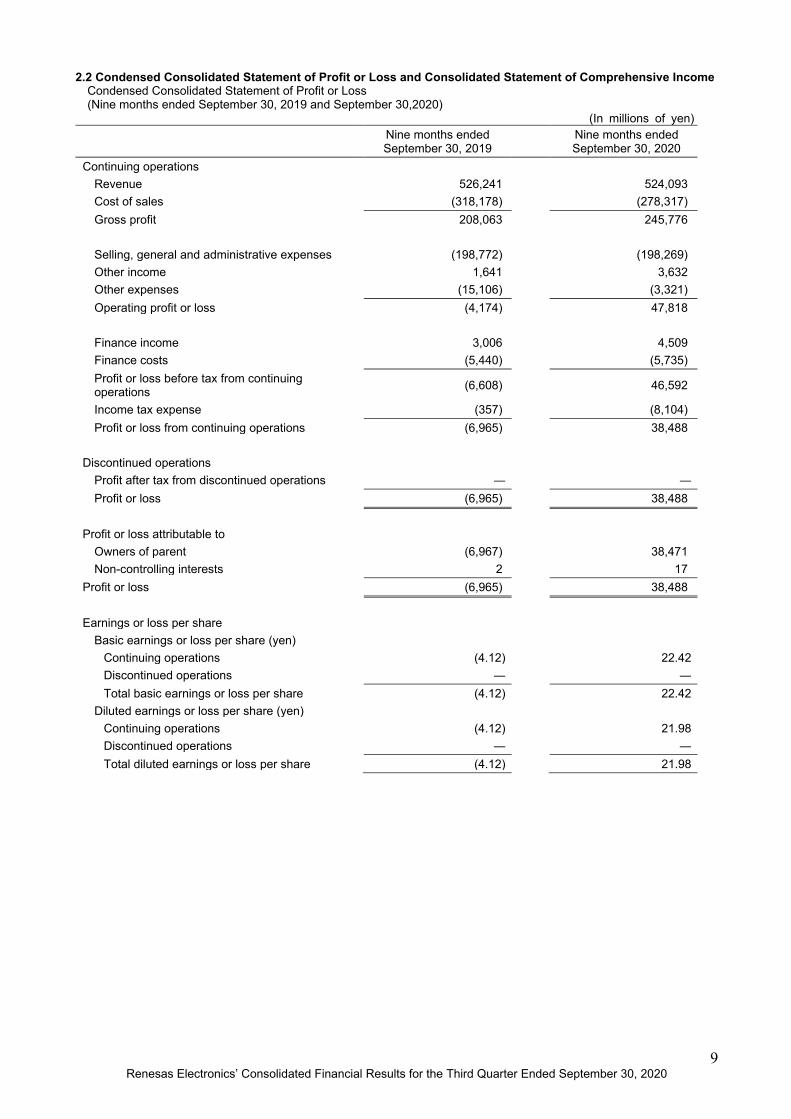
2.2 Condensed Consolidated Statement of Profit or Loss and Consolidated Statement of Comprehensive Income Condensed Consolidated Statement of Profit or Loss (Nine months ended September 30, 2019 and September 30,2020)
(In millions of yen) Nine months ended
September 30, 2019 Nine months ended September 30, 2020
Selling, general and administrative expenses (198,772) (198,269) Other income 1,641 3,632 Other expenses (15,106) (3,321) Operating profit or loss (4,174) 47,818
Finance income 3,006 4,509 Finance costs (5,440) (5,735) Profit or loss before tax from continuing operations (6,608) 46,592
Income tax expense (357) (8,104) Profit or loss from continuing operations (6,965) 38,488
Discontinued operations
Profit after tax from discontinued operations ― ― Profit or loss (6,965) 38,488
Profit or loss attributable to
Owners of parent (6,967) 38,471 Non-controlling interests 2 17
Profit or loss (6,965) 38,488 Earnings or loss per share
Basic earnings or loss per share (yen) Continuing operations (4.12) 22.42 Discontinued operations ― ― Total basic earnings or loss per share (4.12) 22.42
Diluted earnings or loss per share (yen) Continuing operations (4.12) 21.98 Discontinued operations ― ― Total diluted earnings or loss per share (4.12) 21.98
10 Renesas Electronics’ Consolidated Financial Results for the Third Quarter Ended September 30, 2020
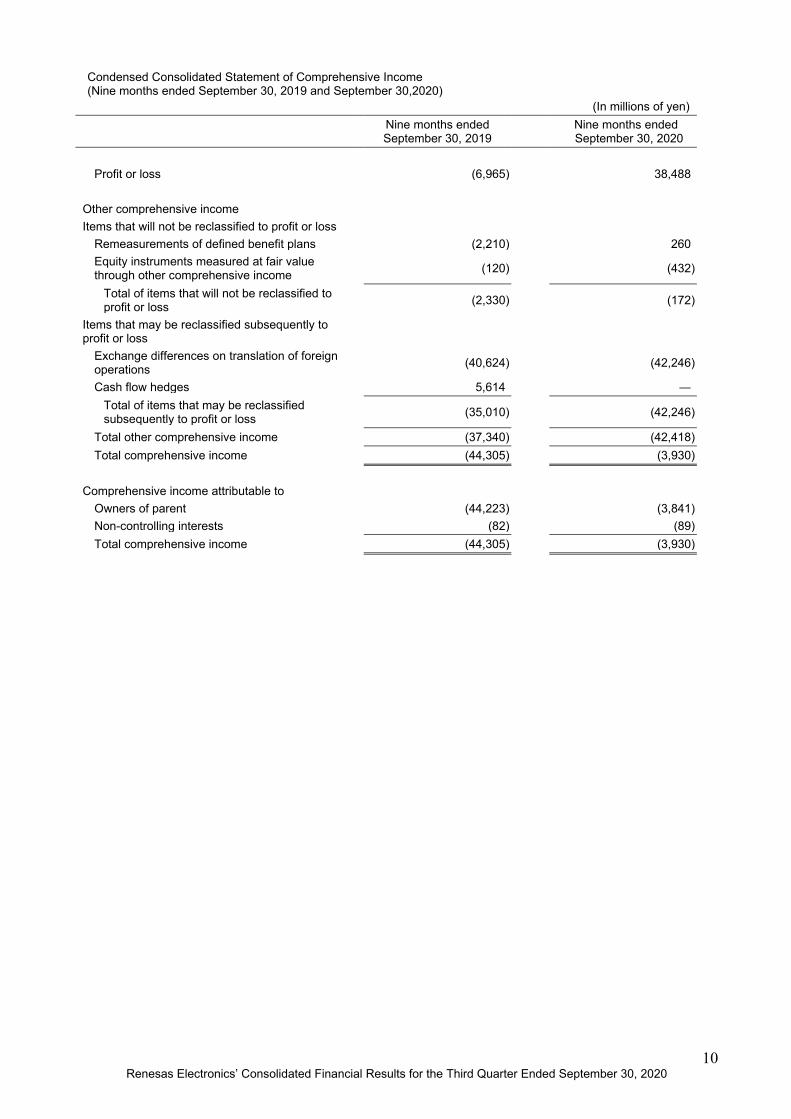
Condensed Consolidated Statement of Comprehensive Income (Nine months ended September 30, 2019 and September 30,2020)
(In millions of yen)
Nine months ended September 30, 2019 Nine months ended
September 30, 2020
Profit or loss (6,965) 38,488 Other comprehensive income Items that will not be reclassified to profit or loss
Remeasurements of defined benefit plans (2,210) 260 Equity instruments measured at fair value through other comprehensive income (120) (432)
Total of items that will not be reclassified to profit or loss (2,330) (172)
Items that may be reclassified subsequently to profit or loss
Exchange differences on translation of foreign operations (40,624) (42,246)
Cash flow hedges 5,614 ― Total of items that may be reclassified subsequently to profit or loss (35,010) (42,246)
Total other comprehensive income (37,340) (42,418) Total comprehensive income (44,305) (3,930)
Comprehensive income attributable to
Owners of parent (44,223) (3,841) Non-controlling interests (82) (89) Total comprehensive income (44,305) (3,930)
11 Renesas Electronics’ Consolidated Financial Results for the Third Quarter Ended September 30, 2020
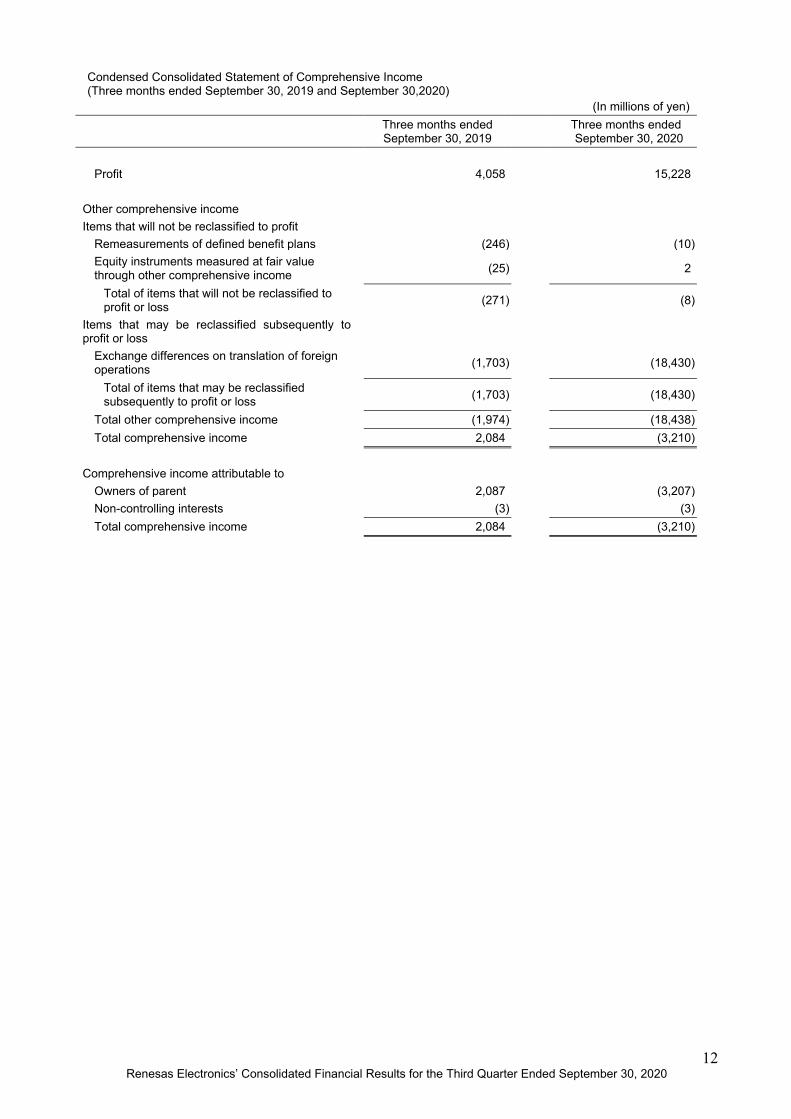
Condensed Consolidated Statement of Profit or Loss (Three months ended September 30, 2019 and September 30,2020)
(In millions of yen) Three months ended
September 30, 2019 Three months ended September 30, 2020
Total transactions with owners 10,320 10,320 (748) ― 9,496 2,210 61
Balance as of September 30, 2019
21,019 200,394 404,129 (11) 14,661 ― (1,131)
Equity attributable to owners of parent
Non-controlling interests Total equity
Other components of equity Total equity
attributable to owners of parent
Exchange differences on translation of
foreign operations
Cash flow hedges Total
Balance as of January 1, 2019 (3,089) (14,318) (13,314) 598,100 2,868 600,968
Effects of changes in accounting policies ― ― ― 1,192 ― 1,192
Balance as of January 1, 2019 after changes in accounting policies
(3,089) (14,318) (13,314) 599,292 2,868 602,160
Profit or Loss ― ― ― (6,967) 2 (6,965) Other comprehensive income (40,540) 5,614 (37,256) (37,256) (84) (37,340)
Total comprehensive income (40,540) 5,614 (37,256) (44,223) (82) (44,305)
Issuance of new shares ― ― ― 21,213 ― 21,213
Share-based payment transactions
― ― 10,446 10,446 ― 10,446
Transfer to retained earnings ― ― 1,321 ― ― ―
Reclassification to non-financial assets ― 8,704 8,704 8,704 ― 8,704
Total transactions with owners ― 8,704 20,471 40,363 ― 40,363
Balance as of September 30, 2019
(43,629) ― (30,099) 595,432 2,786 598,218
14 Renesas Electronics’ Consolidated Financial Results for the Third Quarter Ended September 30, 2020
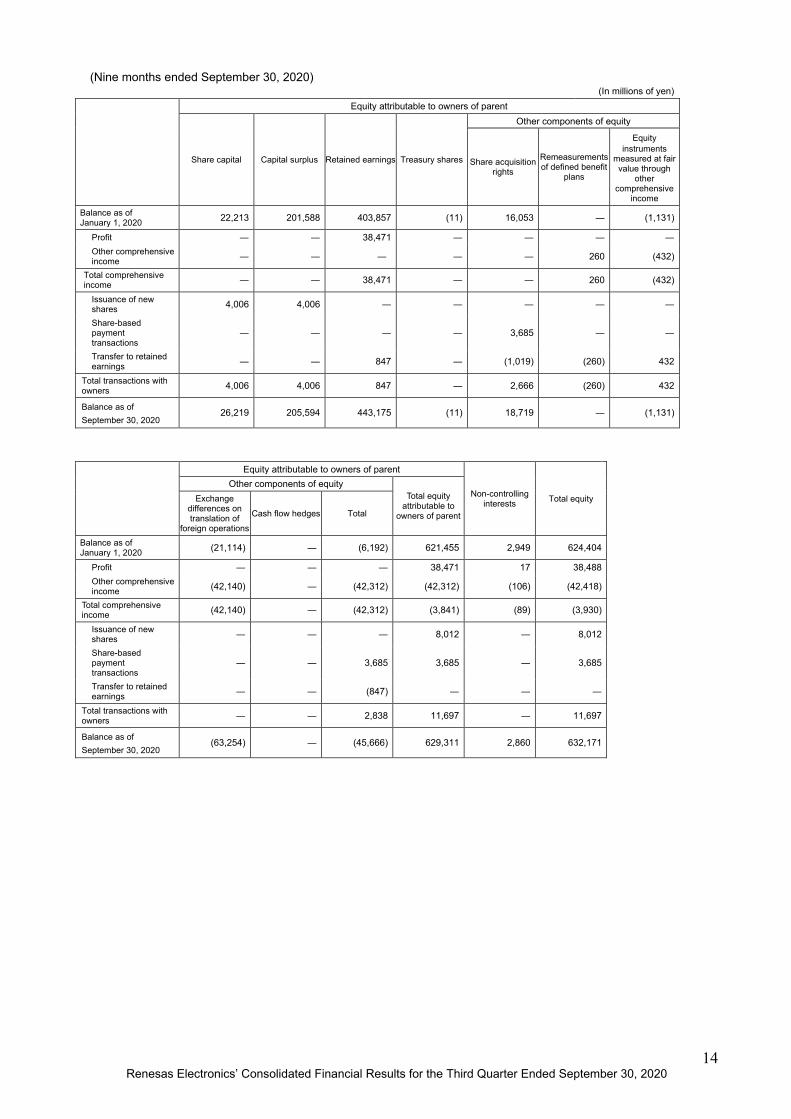
(Nine months ended September 30, 2020)
(In millions of yen) Equity attributable to owners of parent
Share capital Capital surplus Retained earnings Treasury shares
Other components of equity
Share acquisition rights
Remeasurements of defined benefit
plans
Equity instruments
measured at fair value through
other comprehensive
income Balance as of January 1, 2020 22,213 201,588 403,857 (11) 16,053 ― (1,131)
Profit ― ― 38,471 ― ― ― ― Other comprehensive income ― ― ― ― ― 260 (432)
Total comprehensive income ― ― 38,471 ― ― 260 (432)
Issuance of new shares 4,006 4,006 ― ― ― ― ―
Share-based payment transactions
― ― ― ― 3,685 ― ―
Transfer to retained earnings ― ― 847 ― (1,019) (260) 432
Total transactions with owners 4,006 4,006 847 ― 2,666 (260) 432
Balance as of September 30, 2020
26,219 205,594 443,175 (11) 18,719 ― (1,131)
Equity attributable to owners of parent
Non-controlling interests Total equity
Other components of equity Total equity
attributable to owners of parent
Exchange differences on translation of
foreign operations
Cash flow hedges Total
Balance as of January 1, 2020 (21,114) ― (6,192) 621,455 2,949 624,404
Profit ― ― ― 38,471 17 38,488 Other comprehensive income (42,140) ― (42,312) (42,312) (106) (42,418)
Total comprehensive income (42,140) ― (42,312) (3,841) (89) (3,930)
Issuance of new shares ― ― ― 8,012 ― 8,012
Share-based payment transactions
― ― 3,685 3,685 ― 3,685
Transfer to retained earnings ― ― (847) ― ― ―
Total transactions with owners ― ― 2,838 11,697 ― 11,697
Balance as of September 30, 2020
(63,254) ― (45,666) 629,311 2,860 632,171
15 Renesas Electronics’ Consolidated Financial Results for the Third Quarter Ended September 30, 2020
2.4 Condensed Consolidated Statement of Cash Flows (Nine months ended September 30, 2019 and September 30, 2020)
(In millions of yen)
Nine months ended September 30, 2019 Nine months ended
September 30, 2020 Cash flows from operating activities
Profit or loss before tax (6,608) 46,592 Depreciation and amortization 108,815 107,706 Impairment losses 1,583 579 Finance income and finance costs 4,030 5,273 Share-based payment expenses 8,000 11,683 Loss (gain) on sales of property, plant and equipment, and intangible assets (426) (559)
Decrease (increase) in inventories 39,091 (6,866) Decrease (increase) in trade and other receivables 11,074 4,271
Increase (decrease) in trade and other payables (11,211) (8,314) Increase (decrease) in retirement benefit liability (3,767) (472) Increase (decrease) in provisions 341 (3,670) Increase (decrease) in other current liabilities (19,310) (4,070) Other (4,791) (5,514)
Subtotal 126,821 146,639 Interest received 1,195 242 Dividends received 204 212 Income taxes paid (5,422) (5,562) Net cash flows from operating activities 122,798 141,531
Cash flows from investing activities
Purchase of property, plant and equipment (29,804) (15,905) Proceeds from sales of property, plant and equipment 500 764
Purchase of intangible assets (14,596) (12,595) Purchase of other financial assets (348) (448) Proceeds from sales of other financial assets 1,221 405 Purchase of shares of subsidiaries (685,831) ― Other (1,213) (2,293) Net cash flows from investing activities (730,071) (30,072)
Cash flows from financing activities
Net increase (decrease) in short-term borrowings (25,000) ―
Proceeds from long-term borrowings 847,000 ― Repayments of long-term borrowings (194,352) (70,003) Repayments of lease liabilities (3,764) (3,720) Interest paid (11,034) (4,785) Payments for retirement by purchase of bonds (65,409) ― Other 38 13 Net cash flows from financing activities 547,479 (78,495)
Effect of exchange rate changes on cash and cash equivalents (4,696) (3,546)
Net increase (decrease) in cash and cash equivalents (64,490) 29,418
Cash and cash equivalents at beginning of the period 188,820 146,468
Cash and cash equivalents at end of the period 124,330 175,886
16 Renesas Electronics’ Consolidated Financial Results for the Third Quarter Ended September 30, 2020
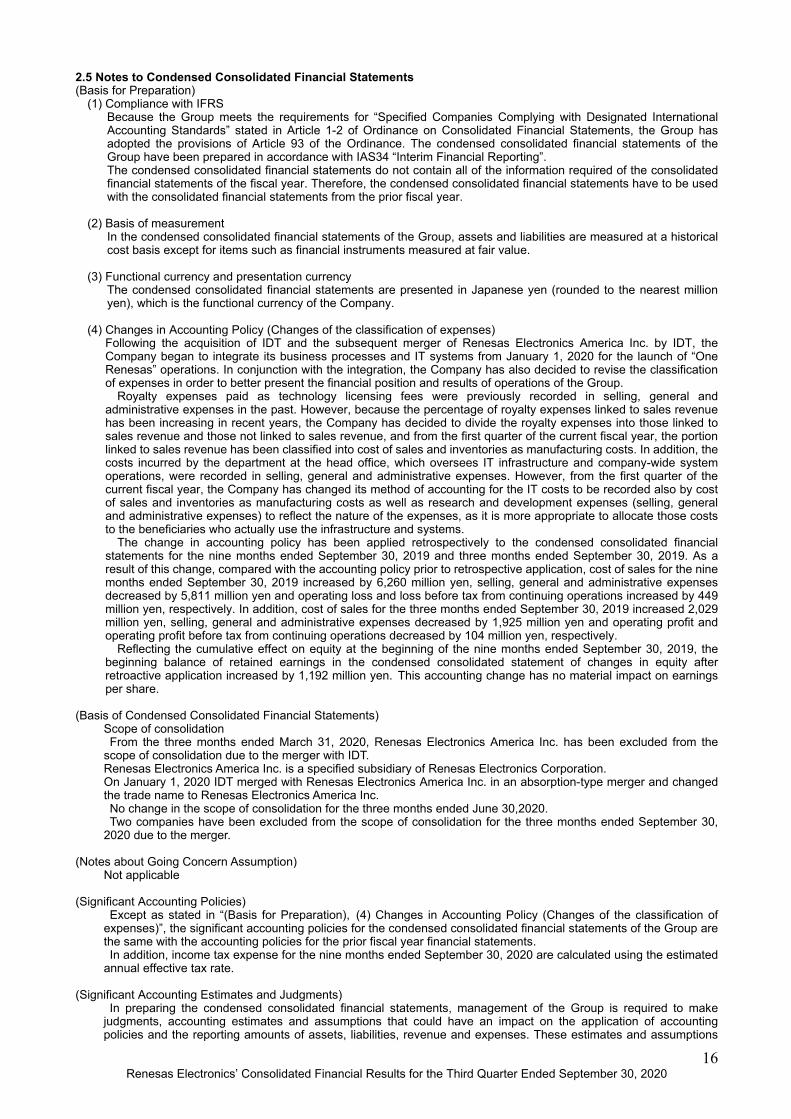
2.5 Notes to Condensed Consolidated Financial Statements (Basis for Preparation)
(1) Compliance with IFRS Because the Group meets the requirements for “Specified Companies Complying with Designated International Accounting Standards” stated in Article 1-2 of Ordinance on Consolidated Financial Statements, the Group has adopted the provisions of Article 93 of the Ordinance. The condensed consolidated financial statements of the Group have been prepared in accordance with IAS34 “Interim Financial Reporting”. The condensed consolidated financial statements do not contain all of the information required of the consolidated financial statements of the fiscal year. Therefore, the condensed consolidated financial statements have to be used with the consolidated financial statements from the prior fiscal year.
(2) Basis of measurement
In the condensed consolidated financial statements of the Group, assets and liabilities are measured at a historical cost basis except for items such as financial instruments measured at fair value.
(3) Functional currency and presentation currency The condensed consolidated financial statements are presented in Japanese yen (rounded to the nearest million yen), which is the functional currency of the Company.
(4) Changes in Accounting Policy (Changes of the classification of expenses)
Following the acquisition of IDT and the subsequent merger of Renesas Electronics America Inc. by IDT, the Company began to integrate its business processes and IT systems from January 1, 2020 for the launch of “One Renesas” operations. In conjunction with the integration, the Company has also decided to revise the classification of expenses in order to better present the financial position and results of operations of the Group.
Royalty expenses paid as technology licensing fees were previously recorded in selling, general and administrative expenses in the past. However, because the percentage of royalty expenses linked to sales revenue has been increasing in recent years, the Company has decided to divide the royalty expenses into those linked to sales revenue and those not linked to sales revenue, and from the first quarter of the current fiscal year, the portion linked to sales revenue has been classified into cost of sales and inventories as manufacturing costs. In addition, the costs incurred by the department at the head office, which oversees IT infrastructure and company-wide system operations, were recorded in selling, general and administrative expenses. However, from the first quarter of the current fiscal year, the Company has changed its method of accounting for the IT costs to be recorded also by cost of sales and inventories as manufacturing costs as well as research and development expenses (selling, general and administrative expenses) to reflect the nature of the expenses, as it is more appropriate to allocate those costs to the beneficiaries who actually use the infrastructure and systems.
The change in accounting policy has been applied retrospectively to the condensed consolidated financial statements for the nine months ended September 30, 2019 and three months ended September 30, 2019. As a result of this change, compared with the accounting policy prior to retrospective application, cost of sales for the nine months ended September 30, 2019 increased by 6,260 million yen, selling, general and administrative expenses decreased by 5,811 million yen and operating loss and loss before tax from continuing operations increased by 449 million yen, respectively. In addition, cost of sales for the three months ended September 30, 2019 increased 2,029 million yen, selling, general and administrative expenses decreased by 1,925 million yen and operating profit and operating profit before tax from continuing operations decreased by 104 million yen, respectively.
Reflecting the cumulative effect on equity at the beginning of the nine months ended September 30, 2019, the beginning balance of retained earnings in the condensed consolidated statement of changes in equity after retroactive application increased by 1,192 million yen. This accounting change has no material impact on earnings per share.
(Basis of Condensed Consolidated Financial Statements)
Scope of consolidation From the three months ended March 31, 2020, Renesas Electronics America Inc. has been excluded from the
scope of consolidation due to the merger with IDT. Renesas Electronics America Inc. is a specified subsidiary of Renesas Electronics Corporation. On January 1, 2020 IDT merged with Renesas Electronics America Inc. in an absorption-type merger and changed the trade name to Renesas Electronics America Inc. No change in the scope of consolidation for the three months ended June 30,2020. Two companies have been excluded from the scope of consolidation for the three months ended September 30,
2020 due to the merger.
(Notes about Going Concern Assumption) Not applicable (Significant Accounting Policies)
Except as stated in “(Basis for Preparation), (4) Changes in Accounting Policy (Changes of the classification of expenses)”, the significant accounting policies for the condensed consolidated financial statements of the Group are the same with the accounting policies for the prior fiscal year financial statements. In addition, income tax expense for the nine months ended September 30, 2020 are calculated using the estimated
annual effective tax rate.
(Significant Accounting Estimates and Judgments) In preparing the condensed consolidated financial statements, management of the Group is required to make
judgments, accounting estimates and assumptions that could have an impact on the application of accounting policies and the reporting amounts of assets, liabilities, revenue and expenses. These estimates and assumptions
17 Renesas Electronics’ Consolidated Financial Results for the Third Quarter Ended September 30, 2020
are based on the best judgment of management, taking into account various factors that are deemed reasonable on the closing date in light of past experience and available information. However, figures based on these estimates and assumptions may differ from the actual results due to their nature. Estimates and underlying assumptions are reviewed continuously. The impact of the review of these estimates is
recognized in the period when the estimates are revised and future periods. The Company reflects the impact of COVID-19 to estimates and assumptions (judgment to indication of impairment losses of goodwill and others), which are based on information available and believes to be reasonable at the moment. These estimates and assumptions may be affected depending on the future situations of the spread of COVID-19.
18 Renesas Electronics’ Consolidated Financial Results for the Third Quarter Ended September 30, 2020
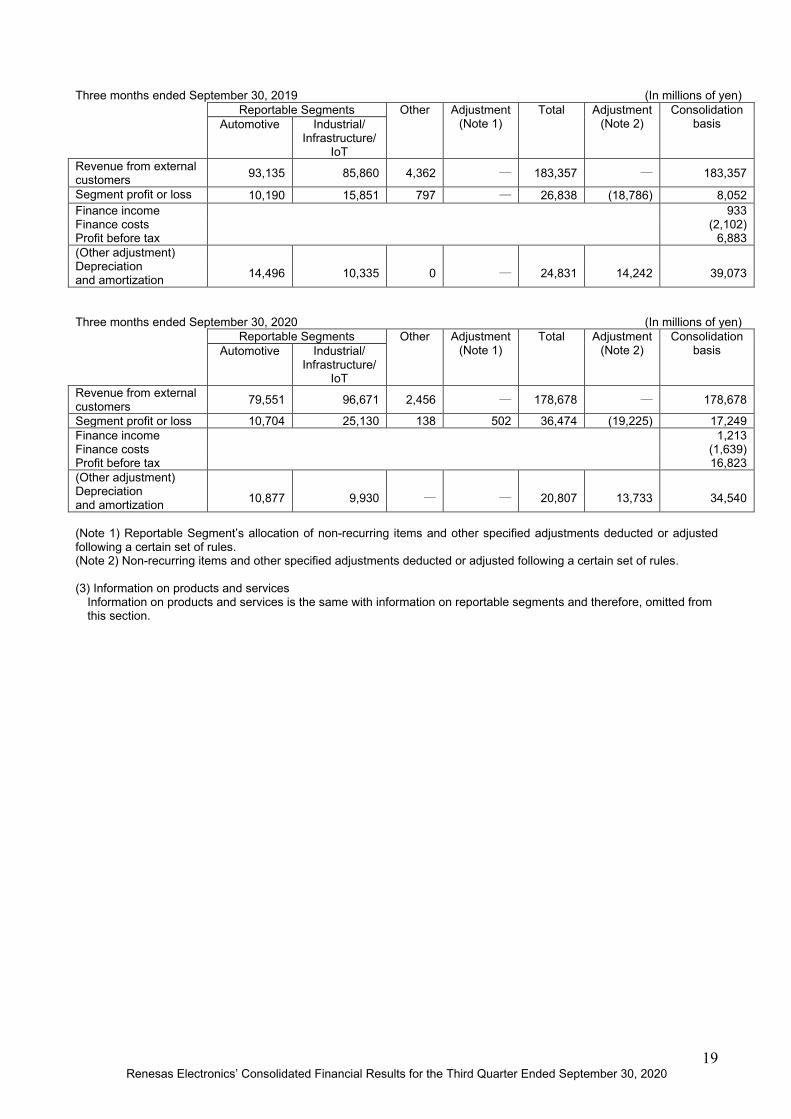
(Business Segments) (1) Overview of reportable segments The Group’s reportable segments are components of the Group for which separate financial information is available that is evaluated regularly by the Board of Directors to determine the allocation of management resources and assess performance. The Group consists of “Automotive Business” and “Industrial/Infrastructure/IoT Business” and those are the Group’s reportable segments. The Automotive business includes the product categories “Automotive control,” comprising semiconductor devices for controlling automobile engines and bodies, and “Automotive information,” comprising of semiconductor devices used in sensing systems for detecting environments inside and outside the vehicle as well as automotive information devices such as IVI (in-vehicle infotainment) and instrument panels used to give various information to the driver of the vehicle. The Group mainly supplies microcontrollers (MCUs), system-on-chips (SoCs), analog semiconductor devices and power semiconductor devices in each of these categories. The Industrial/Infrastructure/IoT Business includes the product categories “Industrial”, “Infrastructure” and “IoT” which support the smart society. The Group mainly supplies MCUs and SoCs in each of these categories. Additionally, commissioned development and manufacturing from the Group’s design and manufacturing subsidiaries are categorized as “Other”. (2) Information on reportable segments The accounting treatment for reportable segments is same as described in “Significant Accounting Policies”. The internal indicators which are used by management when making decisions have been adjusted by non-recurring items specified by the Group and other adjustment following a certain set of rules from operating profit in accordance with IFRS. Segment profit or loss is calculated by deducting “Cost of Sale”, “Selling, General and Administrative Expenses” and “Other Expenses” from “Revenue” and adding “Other Income”. The Group’s Executive Officers assess the performance after eliminating intragroup transactions, and therefore, there is no transfer between reportable segments. Information on reportable segments is as follows. Nine months ended September 30, 2019 (In millions of yen) Reportable Segments Other Adjustment
Segment profit or loss 10,704 25,130 138 502 36,474 (19,225) 17,249 Finance income 1,213 Finance costs (1,639) Profit before tax 16,823 (Other adjustment) Depreciation and amortization 10,877 9,930 ― ― 20,807 13,733 34,540
(Note 1) Reportable Segment’s allocation of non-recurring items and other specified adjustments deducted or adjusted following a certain set of rules. (Note 2) Non-recurring items and other specified adjustments deducted or adjusted following a certain set of rules. (3) Information on products and services
Information on products and services is the same with information on reportable segments and therefore, omitted from this section.
20 Renesas Electronics’ Consolidated Financial Results for the Third Quarter Ended September 30, 2020
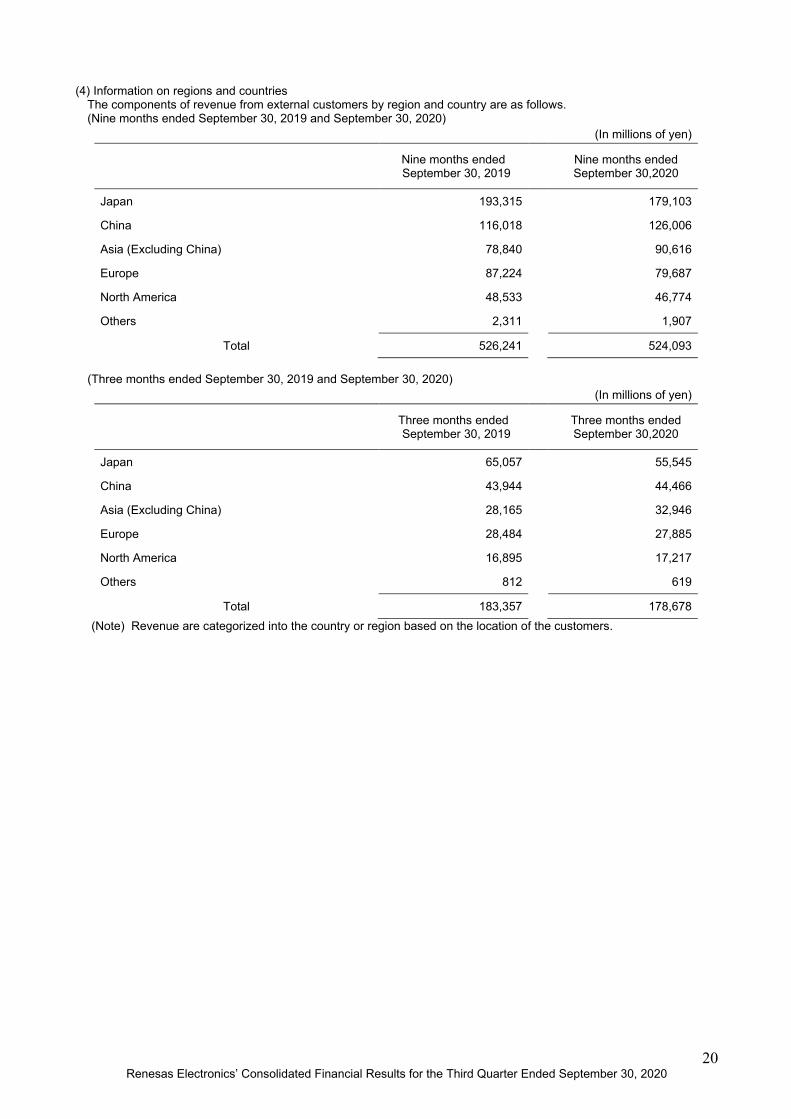
(4) Information on regions and countries
The components of revenue from external customers by region and country are as follows. (Nine months ended September 30, 2019 and September 30, 2020)
(In millions of yen)
Nine months ended September 30, 2019 Nine months ended
September 30,2020
Japan 193,315 179,103
China 116,018 126,006
Asia (Excluding China) 78,840 90,616
Europe 87,224 79,687
North America 48,533 46,774
Others 2,311 1,907
Total 526,241 524,093
(Three months ended September 30, 2019 and September 30, 2020) (In millions of yen)
Three months ended September 30, 2019 Three months ended
September 30,2020
Japan 65,057 55,545
China 43,944 44,466
Asia (Excluding China) 28,165 32,946
Europe 28,484 27,885
North America 16,895 17,217
Others 812 619
Total 183,357 178,678 (Note) Revenue are categorized into the country or region based on the location of the customers.
21 Renesas Electronics’ Consolidated Financial Results for the Third Quarter Ended September 30, 2020
(Business Combinations) (1) Business combination by acquisition
(The year ended December 31, 2019) a. Overview of business combination The Company resolved at the Meeting of Board of Directors to reach an agreement with IDT, whereby IDT would become a wholly-owned subsidiary of the Company and concluded a merger agreement for the purpose of implementing the acquisition on September 11, 2018. In addition, on March 30, 2019, following the completion of the acquisition, IDT has become a wholly-owned subsidiary of the Company.
1) Name and overview of the acquiree Name of the acquiree: Integrated Device Technology, Inc. Business overview: Development, Manufacturing and Sale of mixed signal analog integrated circuit, etc.
2) Date of the acquisition March 30, 2019 (Pacific Daylight Time: March 29, 2019)
3) Purpose of the Acquisition
The Group has been executing its growth strategy to thrive as a world-leading embedded solution provider in the rapidly changing global semiconductor market. As the pillars of its growth strategy, the Group is accelerating its focus on the automotive segment, where the Group has maintained a key global position over many years and further growth is anticipated in areas such as autonomous driving and EV/HEV; industrial and infrastructure segments, which are expected to advance with Industry 4.0 and 5G (fifth-generation) wireless communications, as well as the fast-growing IoT segment. In order to achieve this growth strategy, the Group is working to expand its analog solution lineup and to strengthen its kit solution offerings that combine its world-leading microcontrollers (MCUs), system-on-chips (SoCs) and analog products. In this context, the Group already completed the acquisition of Intersil Corporation (hereafter “Intersil”), a U.S.-based analog semiconductor supplier, in February 2017. With the Intersil acquisition, the Group enhanced its lineup of power management-related analog devices as well as its ability to deliver kit solutions to customers combining the Group’s MCUs/SoCs and analog products from the former Intersil. At the same time, the Group expanded its sales and design-ins outside of Japan and strengthened global management capabilities by absorbing the former Intersil’s experienced management team into the Group. The Group has made the decision to acquire IDT, a U.S.-based analog semiconductor supplier, to contribute further towards the growth strategy. IDT is a global enterprise engaged in the development, production, sale, and provision of services related to analog semiconductor products such as mixed-signal semiconductor solutions particularly for markets related to the data economy such as data center and communication infrastructure that require big-data processing. IDT has annual sales of approximately US$843 million (approximately 92.7 billion yen at an exchange rate of 110 yen to the dollar, as of March 2018) and an operating profit margin of over 25 percent (Non-GAAP basis). The main strategic benefits this transaction is expected to bring are: (i) Complementary products expand the Group’s solution offerings, and (ii) Expands business growth opportunities. Details are as follows: (i) Complementary products expand the Group’s solution offerings The acquisition will provide the Group with access to a vast array of robust analog mixed-signal capabilities in embedded systems, including RF, high performance timing, memory interface, real-time interconnect, optical interconnect, wireless power and smart sensors. The combination of these product lines with the Group’s advanced MCUs and SoCs and power management ICs enables the Group to offer an integrated solution that supports the increasing demand of high data processing performance. The enriched solution offerings will bring optimal systems from external sensors through analog front end to processors and interfaces. (ii) Expands business growth opportunities IDT's analog mixed-signal products for data sensing, storage and interconnect are key devices that support the growth of data economy. Acquisition of these products enables the Group to extend its reach to fast-growing data economy-related applications including data center and communication infrastructure and strengthens its presence in the industrial and automotive segments. Welcoming IDT as part of the Group after the Intersil acquisition completed in 2017 is therefore seen as an effective measure to further enhance the Group’s competitiveness in fields where the Group is focusing its efforts to strengthen the company’s position as a global leader.
22 Renesas Electronics’ Consolidated Financial Results for the Third Quarter Ended September 30, 2020
4) Acquisition Method For the purpose of the acquisition, the Group had established a wholly-owned subsidiary (“acquisition subsidiary”) in Delaware, United States that then merged with IDT (in a reverse triangular merger). The surviving company following the merger is IDT. Cash was issued for IDT’s shares as consideration for the merger, and the shares of the acquisition subsidiary owned by the Group was converted into outstanding shares in the surviving company, making the surviving company a wholly-owned subsidiary of the Group.
b. Consideration for the acquisition and its breakdown
(In millions of yen) Consideration Amount
Cash consideration for the acquisition 703,559 Stock options consideration for the acquisition 23,188
Total consideration for the acquisition A 726,747
Acquisition-related expenses for the business combination were 1,258 million yen, with 885 million yen recorded in “Selling, general and administrative expenses” for the year ended December 31, 2019.
c. Fair value of assets acquired, liabilities assumed and goodwill
(In millions of yen)
Date of acquisition (March 30, 2019)
Current assets Cash and cash equivalents 26,326 Trade and other receivables (Note 2) 16,136 Inventories 18,808 Other 786
Total current assets 62,056 Non-current assets
Property, plant and equipment 19,775 Intangible assets 320,276 Other 11,852
Total non-current assets 351,903
Total assets 413,959 Current liabilities
Trade and other payables 5,121 Bonds and borrowings (Note 3) 65,262 Other 13,997
Total current liabilities 84,380 Non-current liabilities
Income taxes payable 2,599 Deferred tax liabilities 33,853 Other 3,759
Total non-current liabilities 40,211
Total liabilities 124,591 Net assets B 289,368
Basis adjustments C 8,598
Goodwill (Note 4) A-B+C 445,976
23 Renesas Electronics’ Consolidated Financial Results for the Third Quarter Ended September 30, 2020
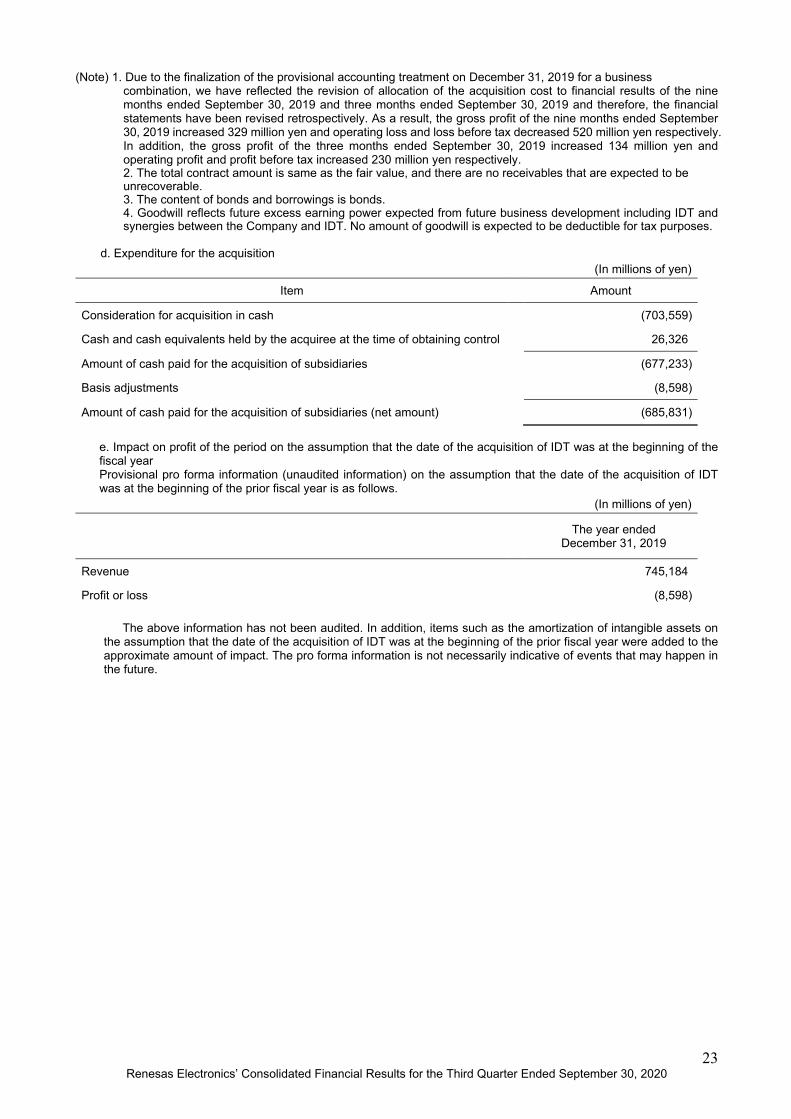
(Note) 1. Due to the finalization of the provisional accounting treatment on December 31, 2019 for a business combination, we have reflected the revision of allocation of the acquisition cost to financial results of the nine months ended September 30, 2019 and three months ended September 30, 2019 and therefore, the financial statements have been revised retrospectively. As a result, the gross profit of the nine months ended September 30, 2019 increased 329 million yen and operating loss and loss before tax decreased 520 million yen respectively. In addition, the gross profit of the three months ended September 30, 2019 increased 134 million yen and operating profit and profit before tax increased 230 million yen respectively. 2. The total contract amount is same as the fair value, and there are no receivables that are expected to be unrecoverable. 3. The content of bonds and borrowings is bonds. 4. Goodwill reflects future excess earning power expected from future business development including IDT and synergies between the Company and IDT. No amount of goodwill is expected to be deductible for tax purposes.
d. Expenditure for the acquisition
(In millions of yen)
Item Amount
Consideration for acquisition in cash (703,559)
Cash and cash equivalents held by the acquiree at the time of obtaining control 26,326
Amount of cash paid for the acquisition of subsidiaries (677,233)
Basis adjustments (8,598)
Amount of cash paid for the acquisition of subsidiaries (net amount) (685,831)
e. Impact on profit of the period on the assumption that the date of the acquisition of IDT was at the beginning of the fiscal year Provisional pro forma information (unaudited information) on the assumption that the date of the acquisition of IDT was at the beginning of the prior fiscal year is as follows.
(In millions of yen)
The year ended December 31, 2019
Revenue 745,184
Profit or loss (8,598)
The above information has not been audited. In addition, items such as the amortization of intangible assets on the assumption that the date of the acquisition of IDT was at the beginning of the prior fiscal year were added to the approximate amount of impact. The pro forma information is not necessarily indicative of events that may happen in the future.
24 Renesas Electronics’ Consolidated Financial Results for the Third Quarter Ended September 30, 2020
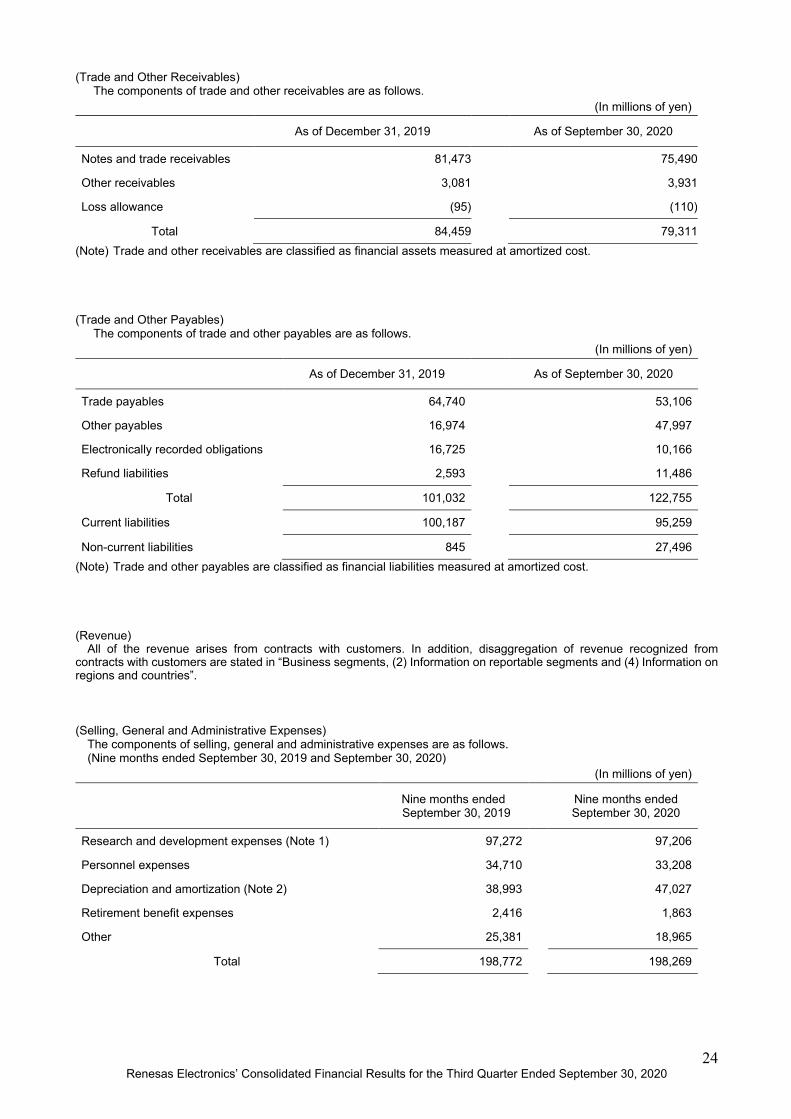
(Trade and Other Receivables) The components of trade and other receivables are as follows.
(In millions of yen)
As of December 31, 2019 As of September 30, 2020
Notes and trade receivables 81,473 75,490
Other receivables 3,081 3,931
Loss allowance (95) (110)
Total 84,459 79,311 (Note) Trade and other receivables are classified as financial assets measured at amortized cost.
(Trade and Other Payables) The components of trade and other payables are as follows.
(In millions of yen)
As of December 31, 2019 As of September 30, 2020
Trade payables 64,740 53,106
Other payables 16,974 47,997
Electronically recorded obligations 16,725 10,166
Refund liabilities 2,593 11,486
Total 101,032 122,755
Current liabilities 100,187 95,259
Non-current liabilities 845 27,496 (Note) Trade and other payables are classified as financial liabilities measured at amortized cost. (Revenue)
All of the revenue arises from contracts with customers. In addition, disaggregation of revenue recognized from contracts with customers are stated in “Business segments, (2) Information on reportable segments and (4) Information on regions and countries”.
(Selling, General and Administrative Expenses)
The components of selling, general and administrative expenses are as follows. (Nine months ended September 30, 2019 and September 30, 2020)
(In millions of yen)
Nine months ended September 30, 2019 Nine months ended
September 30, 2020
Research and development expenses (Note 1) 97,272 97,206
Personnel expenses 34,710 33,208
Depreciation and amortization (Note 2) 38,993 47,027
Retirement benefit expenses 2,416 1,863
Other 25,381 18,965
Total 198,772 198,269
25 Renesas Electronics’ Consolidated Financial Results for the Third Quarter Ended September 30, 2020
(Three months ended September 30, 2019 and September 30, 2020) (In millions of yen)
Three months ended September 30, 2019 Three months ended
September 30, 2020
Research and development expenses (Note 1) 33,652 32,868
Personnel expenses 12,136 12,332
Depreciation and amortization (Note 2) 16,131 15,122
Retirement benefit expenses 716 645
Other 7,741 5,823
Total 70,376 66,790 (Note 1) As stated in“(Basis for Preparation) (4) Changes in Accounting Policy (Changes of the classification of expenses),”, research and development expenses for the nine and three months ended September 30, 2019 disclosed as comparative information have been revised. (Note 2) As stated in “(Business Combinations)”, disclosed figures of depreciation and amortization of the nine and three months ended September 30, 2019 as comparisons have been revised.
26 Renesas Electronics’ Consolidated Financial Results for the Third Quarter Ended September 30, 2020
(Other Income) The components of other income are as follows. (Nine months ended September 30, 2019 and September 30, 2020)
(In millions of yen)
Nine months ended September 30, 2019 Nine months ended
September 30, 2020
Insurance claim income 21 2,386
Gain on sales of property, plant and equipment 542 602
Other 1,078 644
Total 1,641 3,632
(Three months ended September 30, 2019 and September 30, 2020) (In millions of yen)
Three months ended September 30, 2019 Three months ended
September 30, 2020
Subsidy income 142 182
Gain on sales of property, plant and equipment 28 113
Other 178 191
Total 348 486 (Other Expenses)
The components of other expenses are as follows. (Nine months ended September 30, 2019 and September 30, 2020)
(In millions of yen)
Nine months ended September 30, 2019 Nine months ended
September 30, 2020
Business restructuring expenses (Note) 11,489 1,253
Other 3,617 2,068
Total 15,106 3,321
(Three months ended September 30, 2019 and September 30, 2020) (In millions of yen)
Three months ended September 30, 2019 Three months ended
September 30, 2020
Provision for loss on litigation 133 519
Business restructuring expenses (Note) 727 8
Other 599 291
Total 1,459 818 (Note) Business restructuring expenses for the nine and three months ended September 30, 2019 include Extra retirement payments and others incurred from Early Retirement Incentive program.
27 Renesas Electronics’ Consolidated Financial Results for the Third Quarter Ended September 30, 2020
Forward-Looking Statements The statements in this press release with respect to the plans, strategies and financial outlook of Renesas Electronics Corporation and its consolidated subsidiaries (collectively “we”) are forward-looking statements involving risks and uncertainties. We caution you in advance that actual results may differ materially from such forward-looking statements due to several important factors including, but not limited to, general economic conditions in our markets, which are primarily Japan, North America, Asia, and Europe; demand for, and competitive pricing pressure on, products and services in the marketplace; ability to continue to win acceptance of products and services in these highly competitive markets; and fluctuations in currency exchange rates, particularly between the yen and the U.S. dollar. Among other factors, downturn of the world economy; deteriorating financial conditions in world markets, or deterioration in domestic and overseas stock markets, may cause actual results to differ from the projected results forecast.
About Renesas Electronics Corporation
Renesas Electronics Corporation (TSE: 6723) delivers trusted embedded design innovation with complete semiconductor solutions that enable billions of connected, intelligent devices to enhance the way people work and live—securely and safely. A global leader in microcontrollers, analog, power, and SoC products and integrated platforms, Renesas provides the expertise, quality, and comprehensive solutions for a broad range of Automotive, Industrial, Home Electronics, Office Automation and Information Communication Technology applications to help shape a limitless future. Learn more at renesas.com.