13
Earnings Update for Q3’FY21 Zee Entertainment Enterprises Limited – 4 th February, 2021 1

Earnings Update for Q3’FY21
Zee Entertainment Enterprises Limited – 4th February, 2021
1

Safe Harbor Statement
This Release/Communication, except for the historical information, may contain statements, including the words or phrases such as ‘expects, anticipates, intends, will, would, undertakes, aims, estimates, contemplates, seeks to, objective, goal, projects, should’ and similar expressions or variations of these expressions or negatives of these terms indicating future performance or results, financial or otherwise, which are forward looking statements. These forward looking statements are based on certain expectations, assumptions, anticipated developments and other factors which are not limited to, risk and uncertainties regarding fluctuations in earnings, market growth, intense competition and the pricing environment in the market, consumption level, ability to maintain and manage key customer relationship and supply chain sources and those factors which may affect our ability to implement business strategies successfully, namely changes in regulatory environments, political instability, change in international oil prices and input costs and new or changed priorities of the trade. The Company, therefore, cannot guarantee that the forward-looking statements made herein shall be realized. The Company, based on changes as stated above, may alter, amend, modify or make necessary corrective changes in any manner to any such forward looking statement contained herein or make written or oral forward looking statements as may be required from time to time on the basis of subsequent developments and events. The Company does not undertake any obligation to update forward looking statements that may be made from time to time by or on behalf of the Company to reflect the events or circumstances after the date hereof.
2
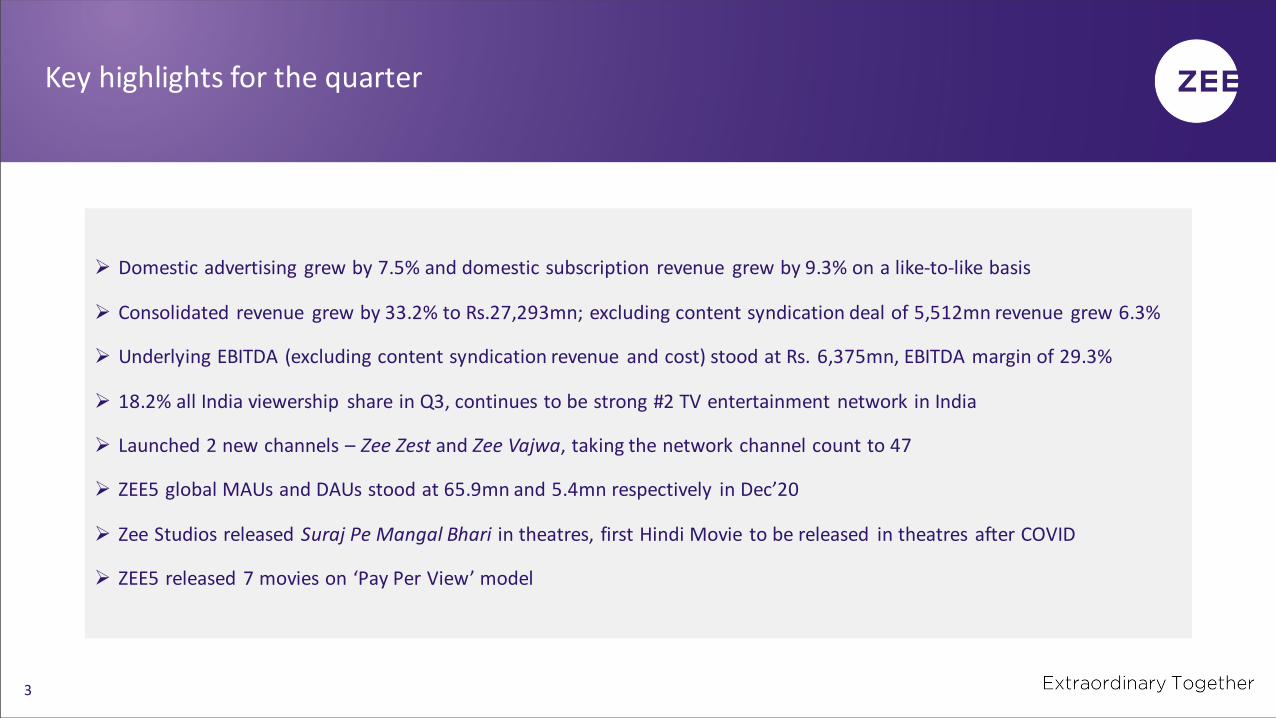
➢ Domestic advertising grew by 7.5% and domestic subscription revenue grew by 9.3% on a like-to-like basis
➢ Consolidated revenue grew by 33.2% to Rs.27,293mn; excluding content syndication deal of 5,512mn revenue grew 6.3%
➢ Underlying EBITDA (excluding content syndication revenue and cost) stood at Rs. 6,375mn, EBITDA margin of 29.3%
➢ 18.2% all India viewership share in Q3, continues to be strong #2 TV entertainment network in India
➢ Launched 2 new channels – Zee Zest and Zee Vajwa, taking the network channel count to 47
➢ ZEE5 global MAUs and DAUs stood at 65.9mn and 5.4mn respectively in Dec’20
➢ Zee Studios released Suraj Pe Mangal Bhari in theatres, first Hindi Movie to be released in theatres after COVID
➢ ZEE5 released 7 movies on ‘Pay Per View’ model
Key highlights for the quarter
3

Business Performance
4
Broadcast network expansion continues with new channels
5
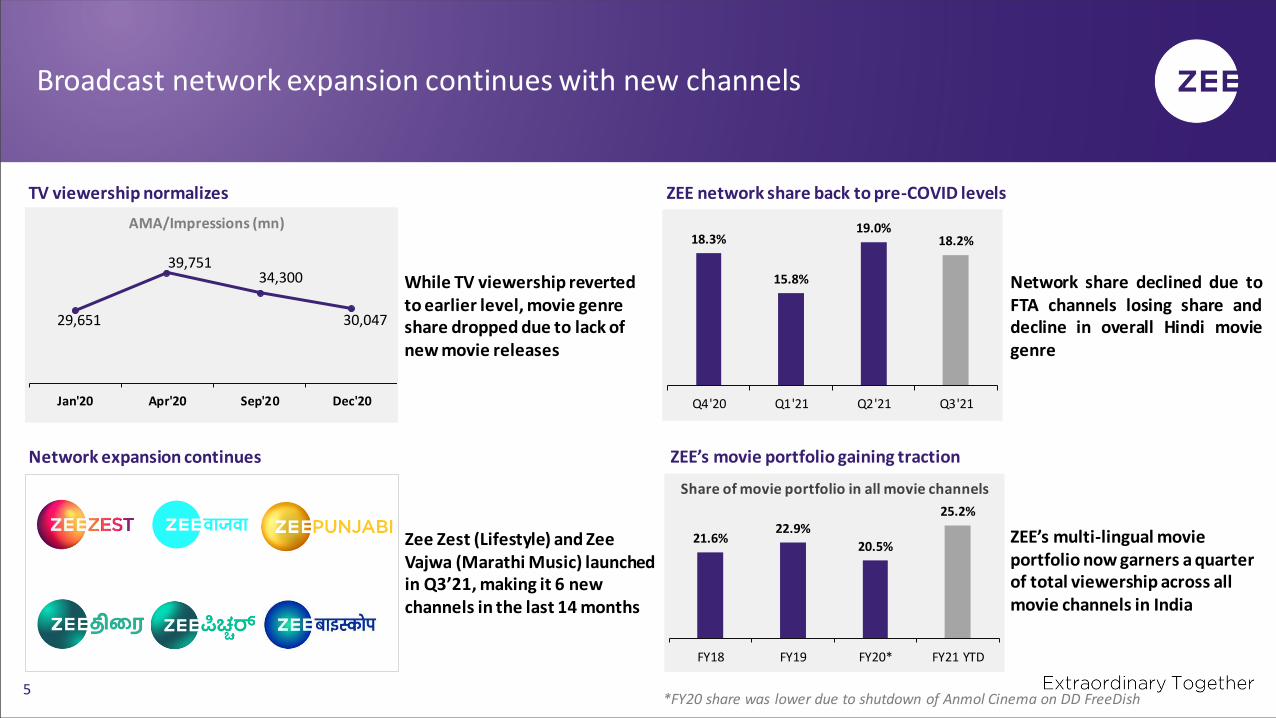
Network share declined due toFTA channels losing share anddecline in overall Hindi moviegenre
ZEE network share back to pre-COVID levels
Network expansion continues
While TV viewership reverted to earlier level, movie genre share dropped due to lack of new movie releases
TV viewership normalizes
29,651
39,751 34,300
30,047
Jan'20 Apr'20 Sep'20 Dec'20
18.3%
15.8%
19.0%18.2%
Q4'20 Q1'21 Q2'21 Q3'21
ZEE’s movie portfolio gaining traction
ZEE’s multi-lingual movie portfolio now garners a quarter of total viewership across all movie channels in India
Zee Zest (Lifestyle) and Zee Vajwa (Marathi Music) launched in Q3’21, making it 6 new channels in the last 14 months
21.6%22.9%
20.5%
25.2%
FY18 FY19 FY20* FY21 YTD
*FY20 share was lower due to shutdown of Anmol Cinema on DD FreeDish
AMA/Impressions (mn)
Share of movie portfolio in all movie channels

Released 7 movies across languages on PPV model on ZEE5
ZEE5 released 20 originals during the quarter
18 original shows and 2 original movies released during the quarter
➢ 65.9 mn global MAUs*, 5.4 mn global DAUs* in Dec’20
➢ 133 minutes average watch time per viewer per month in Dec’20
➢ Q3 Revenue and EBITDA# stood at Rs. 1,178 mn and Rs. (1,757) mn
*Operating KPIs based on internal data analytics#EBITDA loss excludes costs incurred by the business on ZEEL network
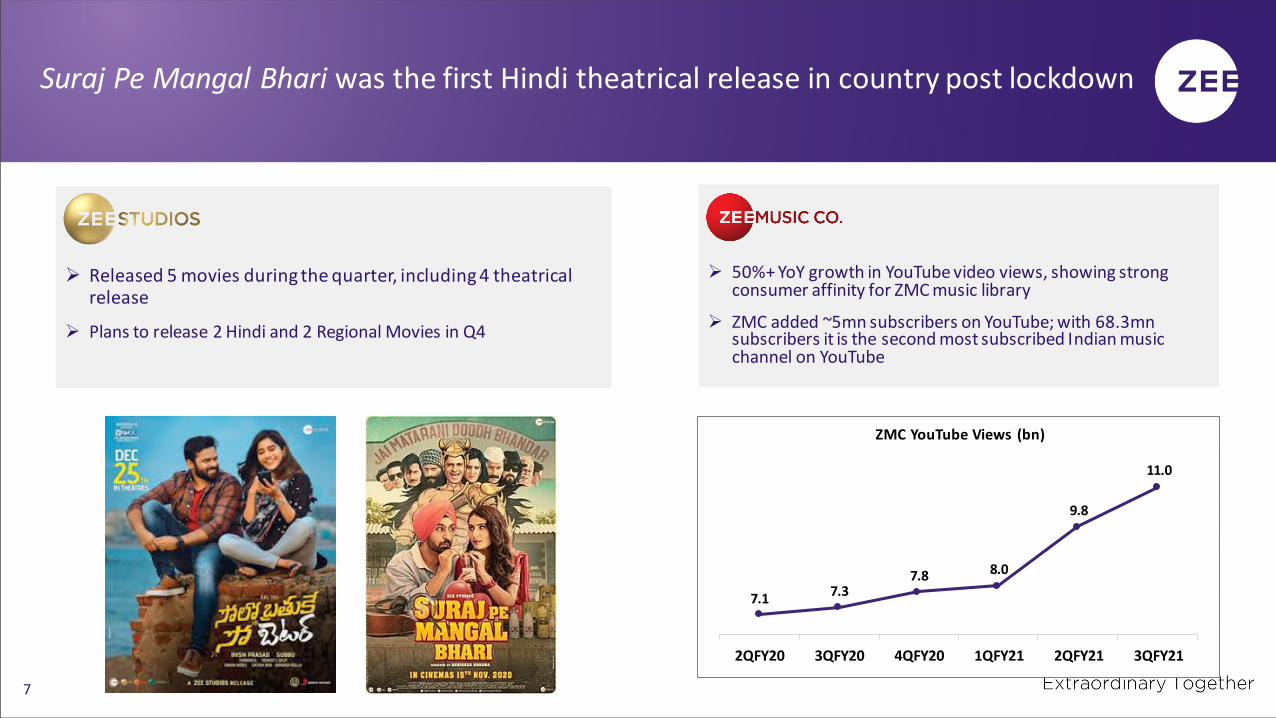
➢ 50%+ YoY growth in YouTube video views, showing strong consumer affinity for ZMC music library
➢ ZMC added ~5mn subscribers on YouTube; with 68.3mn subscribers it is the second most subscribed Indian music channel on YouTube
Suraj Pe Mangal Bhari was the first Hindi theatrical release in country post lockdown
➢ Released 5 movies during the quarter, including 4 theatrical release
➢ Plans to release 2 Hindi and 2 Regional Movies in Q4
7
7.17.3
7.8 8.0
9.8
11.0
2QFY20 3QFY20 4QFY20 1QFY21 2QFY21 3QFY21
ZMC YouTube Views (bn)

Financial Performance
8
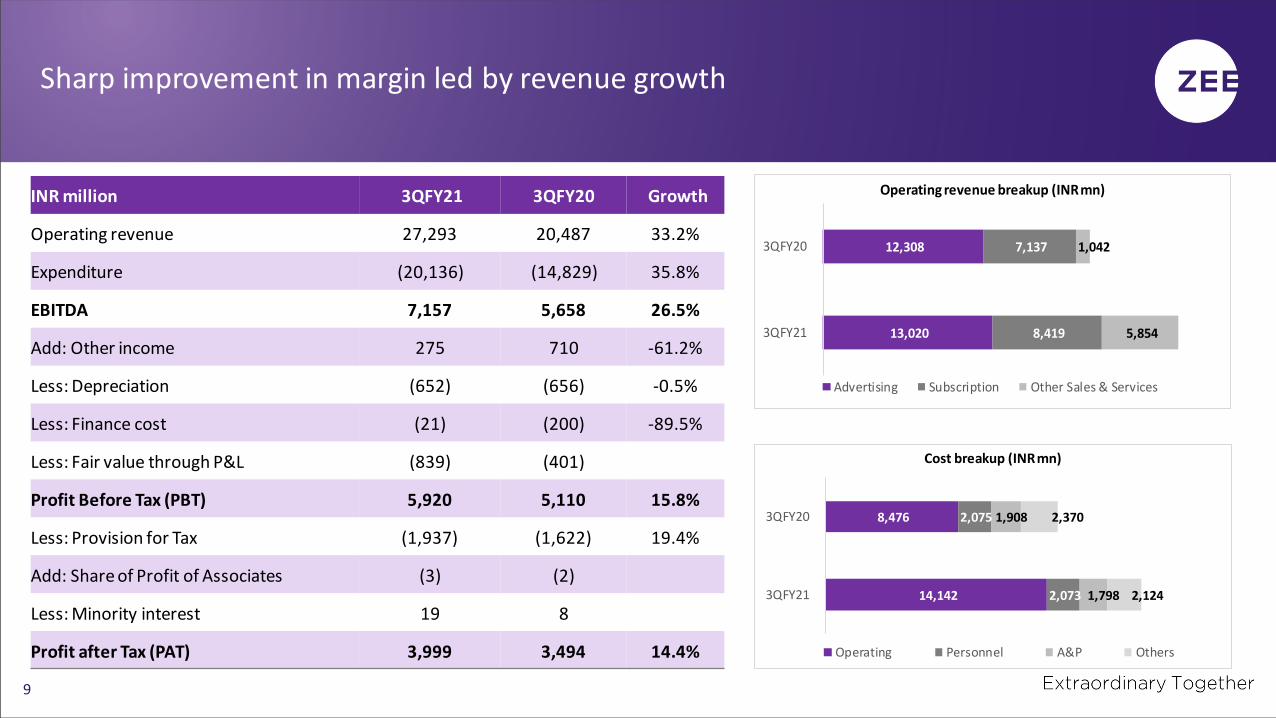
Sharp improvement in margin led by revenue growth
9
INR million 3QFY21 3QFY20 Growth
Operating revenue 27,293 20,487 33.2%
Expenditure (20,136) (14,829) 35.8%
EBITDA 7,157 5,658 26.5%
Add: Other income 275 710 -61.2%
Less: Depreciation (652) (656) -0.5%
Less: Finance cost (21) (200) -89.5%
Less: Fair value through P&L (839) (401)
Profit Before Tax (PBT) 5,920 5,110 15.8%
Less: Provision for Tax (1,937) (1,622) 19.4%
Add: Share of Profit of Associates (3) (2)
Less: Minority interest 19 8
Profit after Tax (PAT) 3,999 3,494 14.4%
13,020
12,308
8,419
7,137
5,854
1,042
3QFY21
3QFY20
Advertising Subscription Other Sales & Services
Operating revenue breakup (INR mn)
14,142
8,476
2,073
2,075
1,798
1,908
2,124
2,370
3QFY21
3QFY20
Operating Personnel A&P Others
Cost breakup (INR mn)
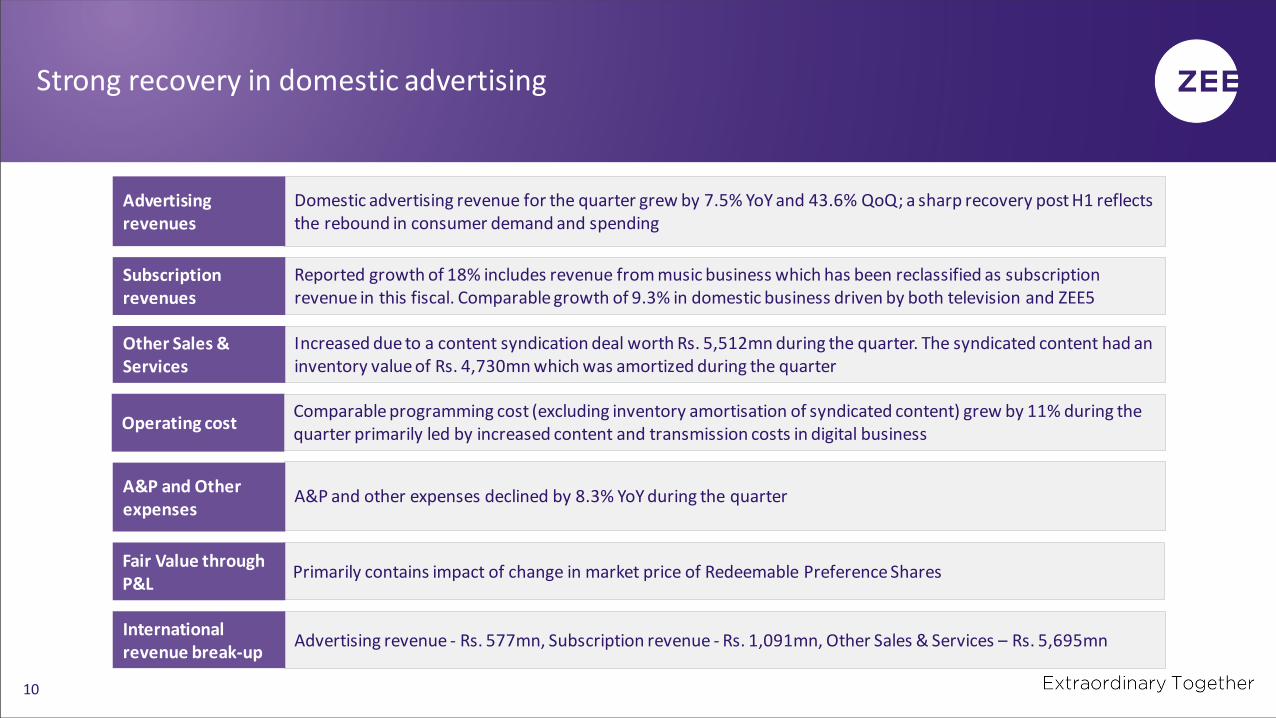
Strong recovery in domestic advertising
10
Domestic advertising revenue for the quarter grew by 7.5% YoY and 43.6% QoQ; a sharp recovery post H1 reflects the rebound in consumer demand and spending
Comparable programming cost (excluding inventory amortisation of syndicated content) grew by 11% during the quarter primarily led by increased content and transmission costs in digital business
Advertisingrevenues
Operating cost
Reported growth of 18% includes revenue from music business which has been reclassified as subscription revenue in this fiscal. Comparable growth of 9.3% in domestic business driven by both television and ZEE5
Subscription revenues
Increased due to a content syndication deal worth Rs. 5,512mn during the quarter. The syndicated content had an inventory value of Rs. 4,730mn which was amortized during the quarter
Other Sales & Services
A&P and other expenses declined by 8.3% YoY during the quarterA&P and Other expenses
Advertising revenue - Rs. 577mn, Subscription revenue - Rs. 1,091mn, Other Sales & Services – Rs. 5,695mn Internationalrevenue break-up
Primarily contains impact of change in market price of Redeemable Preference SharesFair Value through P&L
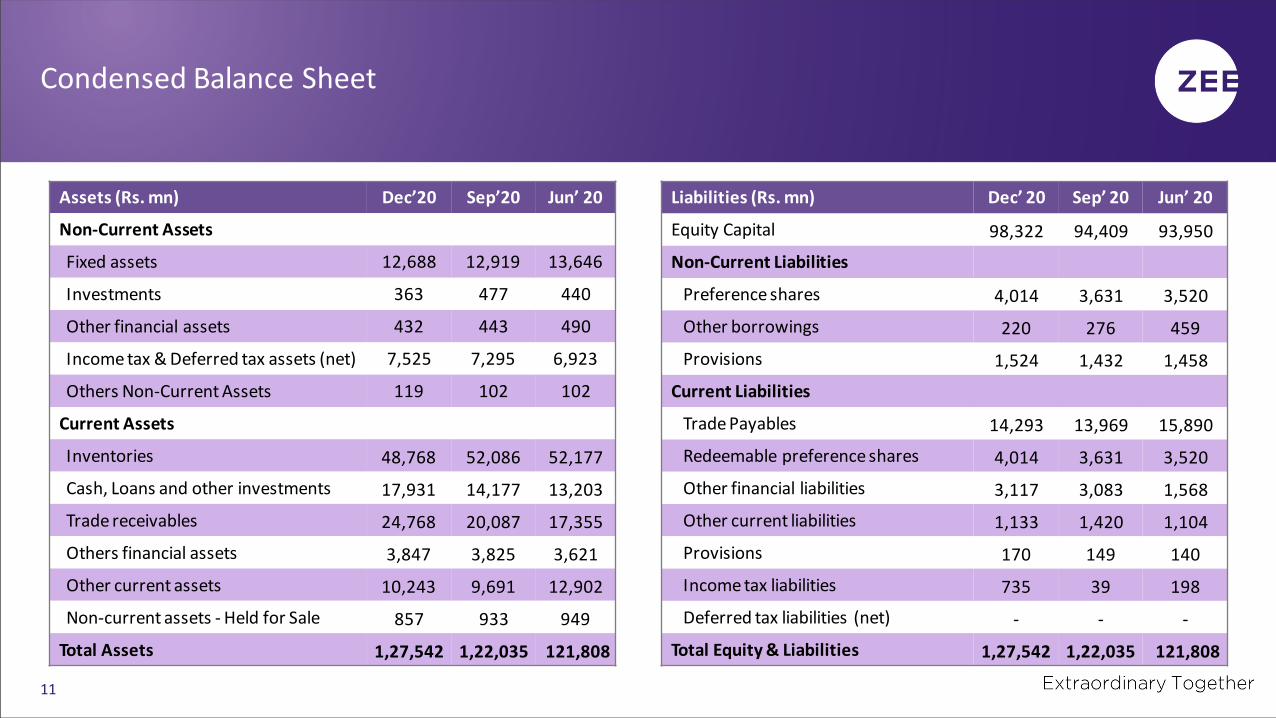
Condensed Balance Sheet
11
Assets (Rs. mn) Dec’20 Sep’20 Jun’ 20
Non-Current Assets
Fixed assets 12,688 12,919 13,646
Investments 363 477 440
Other financial assets 432 443 490
Income tax & Deferred tax assets (net) 7,525 7,295 6,923
Others Non-Current Assets 119 102 102
Current Assets
Inventories 48,768 52,086 52,177
Cash, Loans and other investments 17,931 14,177 13,203
Trade receivables 24,768 20,087 17,355
Others financial assets 3,847 3,825 3,621
Other current assets 10,243 9,691 12,902
Non-current assets - Held for Sale 857 933 949
Total Assets 1,27,542 1,22,035 121,808
Liabilities (Rs. mn) Dec’ 20 Sep’ 20 Jun’ 20
Equity Capital 98,322 94,409 93,950
Non-Current Liabilities
Preference shares 4,014 3,631 3,520
Other borrowings 220 276 459
Provisions 1,524 1,432 1,458
Current Liabilities
Trade Payables 14,293 13,969 15,890
Redeemable preference shares 4,014 3,631 3,520
Other financial liabilities 3,117 3,083 1,568
Other current liabilities 1,133 1,420 1,104
Provisions 170 149 140
Income tax liabilities 735 39 198
Deferred tax liabilities (net) - - -
Total Equity & Liabilities 1,27,542 1,22,035 121,808

Break-up of content inventory, advances and deposits
12
FY19: Rs. 58.0bn FY20: Rs. 64.1bn
Movie Rights Shows Movie production, Music & Others Content Advances & Deposits
62%14%
7%
17%
55%
9%2%
34%
63%17%
6%
14%
Q2’FY21: Rs. 60.4bn
67%
12%
7%
14%
Q3’FY21: Rs. 56.5bn

13


