Earth and Planetary Science Letters 297 (2010) 174–182
Contents lists available at ScienceDirect
Earth and Planetary Science Letters
j ourna l homepage: www.e lsev ie r.com/ locate /eps l
Hydrothermal formation of Clay-Carbonate alteration assemblages in the Nili Fossaeregion of Mars
Adrian J. Brown a,⁎, Simon J. Hook b, Alice M. Baldridge b, James K. Crowley c, Nathan T. Bridges b,Bradley J. Thomson d, Giles M. Marion e, Carlos R. de Souza Filho f, Janice L. Bishop a
a SETI Institute, 515 N. Whisman Rd, Mountain View, CA 94043, USAb Jet Propulsion Laboratory, 4800 Oak Grove Dr, CA 91109, USAc P.O. Box 344, Lovettsville, VA 20180, USAd Johns Hopkins University Applied Physics Laboratory, Laurel, MD, 20723, USAe Desert Research Institute, 2215 Raggio Pkwy, Reno, NV 89512, USAf Universidade Estadual de Campinas, Campinas, São Paulo, Brasil
The Compact Reconnaissance Imaging Spectrometer for Mars (CRISM) has returned observations of the NiliFossae region indicating the presence of Mg-carbonate in small (b10 km sq2), relatively bright rock units thatare commonly fractured (Ehlmann et al., 2008b). We have analyzed spectra from CRISM images and used co-located HiRISE images in order to further characterize these carbonate-bearing units. We applied absorptionband mapping techniques to investigate a range of possible phyllosilicate and carbonate minerals that couldbe present in the Nili Fossae region. We also describe a clay-carbonate hydrothermal alteration mineralassemblage in the Archean Warrawoona Group of Western Australia that is a potential Earth analog to theNili Fossae carbonate-bearing rock units. We discuss the geological and biological implications forhydrothermal processes on Noachian Mars.
Data from the CRISM instrument has recently been used to detectthe presence of Mg-carbonate minerals in the Nili Fossae region ofMars (Ehlmann et al., 2008b). Nili Fossae displays a diverse range ofminerals in a classic ‘low dust cover’ volcanic province that containsexposed rock units dating back to the Noachian period of Mars(Mustard et al., 1993; Ehlmann et al., 2007; Mangold et al., 2007;Mustard et al., 2007; Ehlmann et al., 2009). Ehlmann et al. (2008b)proffered four potential formation scenarios for the carbonate-bearingunit – 1.) groundwater percolating through fractures altering olivineto Mg-carbonate at slightly elevated temperatures, 2.) olivine-richmaterial, heated by impact or volcanic processes, was deposited ontop of a water-bearing phyllosilicate rich unit and initiated hydro-thermal alteration along the contact, 3.) olivine-rich rocks wereweathered to carbonate at surface (cold) temperatures in a manner
similar to olivine weathering of meteorites in Antarctica, and 4.) thecarbonate precipitated from shallow ephemeral lakes.
Here we further develop and slightly modify Ehlmann's hydro-thermal emplacement hypothesis (#2). We propose that the phyl-losilicate (possibly talc) and overlying carbonate bearing unit wasformed at the same time by a single hydrothermal event (Brown et al.,2008a). In this scenario, the phyllosilicate (argillic) and carbonate(propylitic) zones reflect different temperature zones achieved duringhydrothermal alteration.
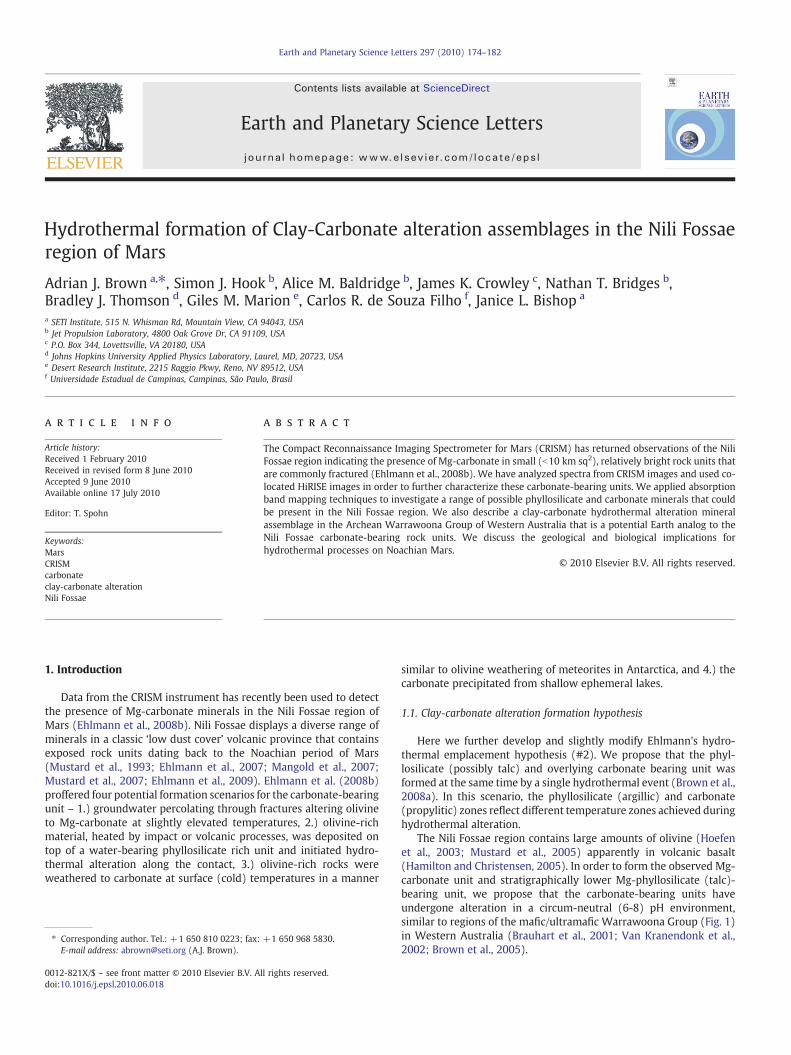
The Nili Fossae region contains large amounts of olivine (Hoefenet al., 2003; Mustard et al., 2005) apparently in volcanic basalt(Hamilton and Christensen, 2005). In order to form the observed Mg-carbonate unit and stratigraphically lower Mg-phyllosilicate (talc)-bearing unit, we propose that the carbonate-bearing units haveundergone alteration in a circum-neutral (6-8) pH environment,similar to regions of the mafic/ultramafic Warrawoona Group (Fig. 1)in Western Australia (Brauhart et al., 2001; Van Kranendonk et al.,2002; Brown et al., 2005).
175A.J. Brown et al. / Earth and Planetary Science Letters 297 (2010) 174–182
2. Background
2.1. Geological Setting of the North Pole Dome Region of the Pilbara
In October 2002 an airborne hyperspectral imaging dataset wasacquired over the North Pole Dome Region of the East Pilbara Granite-Greenstone terrain, where significant outcrops of themafic/ultramaficWarrawoona Group are located (Brown et al., 2005). The North PoleDome region provides excellent exposure of low-grade (prehnite-pumpellyite to greenschist) metamorphism. In the WarrawoonaGroup, there are large areas where weathering rinds do not obscureinherentmineralogy from airborne reflectance spectrometers, makingit an excellent study region for proving remote sensing technologies.
The rocks of the Warrawoona Group constitute two komatiitic-thoelitic-felsic-chert volcanic successions which have ages spanning3.515-3.426 Ga - as each succession gets younger in age, it getsprogressively less mafic (Van Kranendonk et al., 2002). Thehyperspectral VNIR signature of talc has been used to map a komatiitelayer around the North Pole Dome in the Apex Basalt member of theWarrawoona Group (Brown et al., 2004b). The Apex Basalt overliesthe stromatolite-bearing 3.49 Ga Dresser Formation chert-barite unit,which probably represents the late stage of an active volcanic caldera(Van Kranendonk et al., 2008). The komatiitic 3.46 Ga Apex Basaltprobably represents resumption of distal volcanic activity following a∼20 k year hiatus. Talc-carbonate hydrothermal alteration of the ApexBasalt was either achieved on emplacement of the komatiite or whenthe overlying theolitic 3.46 Ga Mt. Ada Basalt unit was emplaced.
Komatiite lavas form when high-temperature (∼1400-1600 °C),low viscosity (0.1-1 Pa), mantle derived, ultramafic lavas are extrudedand flow turbulently at the surface. Komatiites are found almostexclusively in Archean shield areas due to the higher heat of theEarth's mantle during that period (Campbell et al., 1989). Komatiiterocks on Earth have high Mg contents (N 9% MgO by weight – those inthe Warrawoona Group have up to 29% MgO), which may be asignificant factor on Mars since only Mg-carbonates have beendetected at Nili Fossae (Ehlmann et al., 2008b). Komatiite lavas havepreviously been proposed as possible analogs for Martian rocks ongeochemical (Baird and Clark, 1981), morphological (Reyes andChristensen, 1994) and spectral (Mustard et al., 1993) grounds. Thekomatiite layer detected in the North Pole Dome was associated withtalc-carbonate alteration which has been hypothesized to be theresult of hydrothermal alteration (Brown et al., 2005).
The North Pole Dome also displays some of the oldest evidence oflife in the form of stromatolites (Walter et al., 1980) and microfossils(Ueno et al., 2004) were likely to have formed in a volcanic plateau
Fig. 1. Clay-carbonate altered basalt outcrop in the Pilbara region of We
setting where abundant hydrothermal activity is in evidence (VanKranendonk et al., 2008).
2.2. Carbonates on Mars
Carbonates (X-CO3 minerals) are expected to form from basalt inan aqueous alteration environment under a CO2 rich atmosphere(O'Connor, 1968; Booth and Kieffer, 1978; Gooding, 1978; Catling,1999; Morse and Marion, 1999; Longhi and Takahashi, 2006; Quinnet al., 2006). Because of this, they have been searched for extensivelyon Mars using remote sensing methods (McKay and Nedell, 1988;Blaney and McCord, 1989; Pollack et al., 1990; Bell et al., 1994; Calvinet al., 1994; Lellouch et al., 2000; Jouglet et al., 2007). Until recently,only trace amounts of carbonate have been detected in bright Martiandust (Wagner and Schade, 1996; Bandfield et al., 2003; Boynton et al.,2009; Palomba et al., 2009) and in Martian meteorites (Bishop et al.,1998a, b; Bridges et al., 2001; Niles et al., 2009). Recent findings ofcarbonate by CRISM on MRO (Ehlmann et al., 2008b) and the roverSpirit (Morris et al., 2010) have been the strongest evidence yet forcarbonates on Mars.
3. Methods
3.1. Visible to Near Infrared Spectroscopy
CRISM is a visible and infrared imaging hyperspectral spectrom-eter covering the 0.36-3.92 μm region with 6.55 nm/channel resolu-tion (Murchie et al., 2007). In high resolution targetedmode (relevantto all observations discussed in this paper) CRISM has a groundsampling distance of 15-19 m/pixel, and a swath width of approxi-mately 10.8 km on the ground.
HyMap is a visible to near infrared (0.4-2.5 μm) imaging spec-trometer with 126 spectral bands and a spectral resolution of ∼15 nm,manufactured by Integrated Spectronics (www.intspec.com). Thespatial resolution of the Pilbara dataset was 5 m (Brown, 2006b).Ground-truth spectra were also taken by the PIMA SP (first gen-eration) handheld spectrometer manufactured by Integrated Spectro-nics (spectral coverage 1.3-2.5 μm, 600 bands and resolution of 2 nm).
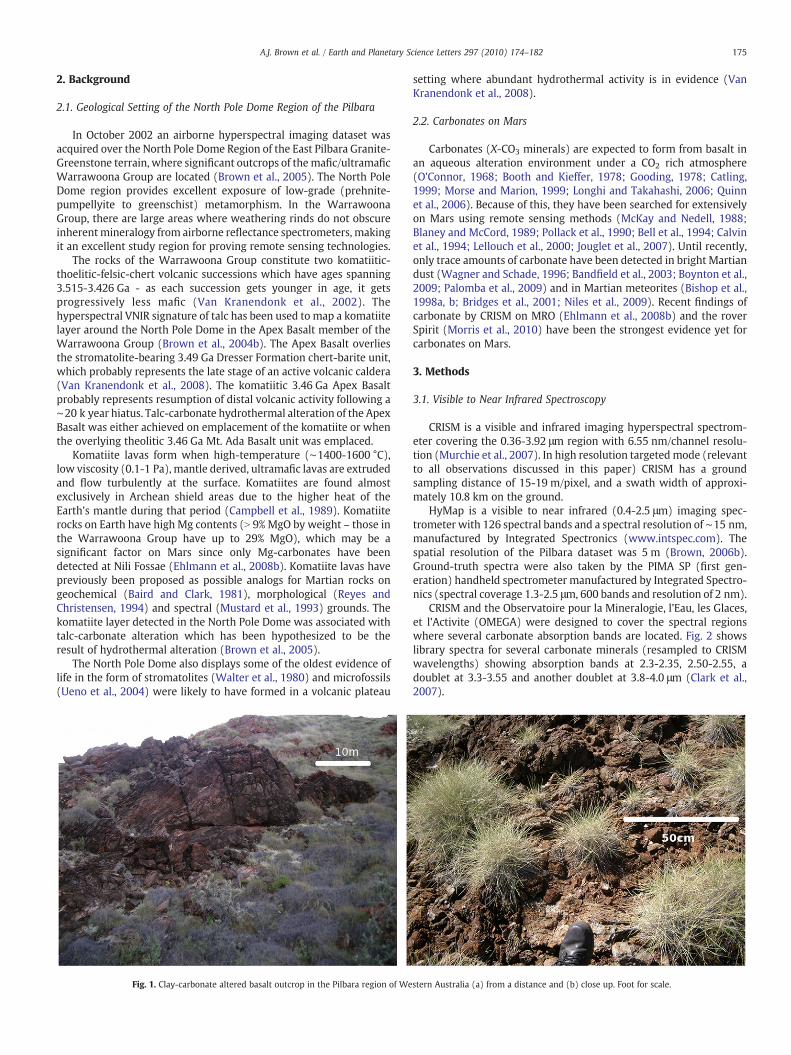
CRISM and the Observatoire pour la Mineralogie, l'Eau, les Glaces,et l'Activite (OMEGA) were designed to cover the spectral regionswhere several carbonate absorption bands are located. Fig. 2 showslibrary spectra for several carbonate minerals (resampled to CRISMwavelengths) showing absorption bands at 2.3-2.35, 2.50-2.55, adoublet at 3.3-3.55 and another doublet at 3.8-4.0 μm (Clark et al.,2007).
stern Australia (a) from a distance and (b) close up. Foot for scale.
Fig. 2. USGS Spectral Library (splib06 from http://speclab.cr.usgs.gov/) near infraredspectra of calcite and siderite showing bands at 2.3, 2.54, 3.4 and 3.9 μms (in addition toother bands). Note apparent weakness of 3.4 and 3.9 μm band in siderite. The averagegrain size for the calcite sample is 410 microns, and the siderite sample is the 74-250micron sieved fraction.
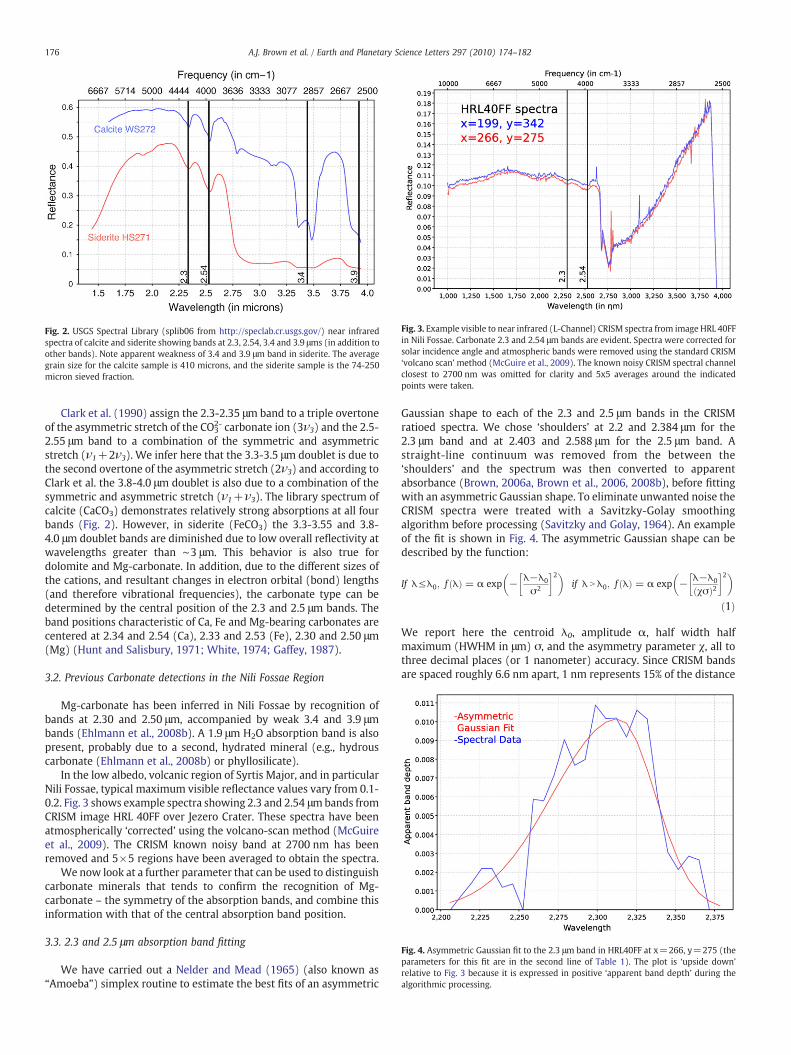
Fig. 3. Example visible to near infrared (L-Channel) CRISM spectra from image HRL 40FFin Nili Fossae. Carbonate 2.3 and 2.54 μm bands are evident. Spectra were corrected forsolar incidence angle and atmospheric bands were removed using the standard CRISM‘volcano scan’ method (McGuire et al., 2009). The known noisy CRISM spectral channelclosest to 2700 nm was omitted for clarity and 5x5 averages around the indicatedpoints were taken.
Fig. 4. Asymmetric Gaussian fit to the 2.3 μm band in HRL40FF at x=266, y=275 (theparameters for this fit are in the second line of Table 1). The plot is ‘upside down’relative to Fig. 3 because it is expressed in positive ‘apparent band depth’ during thealgorithmic processing.
176 A.J. Brown et al. / Earth and Planetary Science Letters 297 (2010) 174–182
Clark et al. (1990) assign the 2.3-2.35 μm band to a triple overtoneof the asymmetric stretch of the CO3
2- carbonate ion (3ν3) and the 2.5-2.55 μm band to a combination of the symmetric and asymmetricstretch (ν1+2ν3). We infer here that the 3.3-3.5 μm doublet is due tothe second overtone of the asymmetric stretch (2ν3) and according toClark et al. the 3.8-4.0 μm doublet is also due to a combination of thesymmetric and asymmetric stretch (ν1+ν3). The library spectrum ofcalcite (CaCO3) demonstrates relatively strong absorptions at all fourbands (Fig. 2). However, in siderite (FeCO3) the 3.3-3.55 and 3.8-4.0 μm doublet bands are diminished due to low overall reflectivity atwavelengths greater than ∼3 μm. This behavior is also true fordolomite and Mg-carbonate. In addition, due to the different sizes ofthe cations, and resultant changes in electron orbital (bond) lengths(and therefore vibrational frequencies), the carbonate type can bedetermined by the central position of the 2.3 and 2.5 μm bands. Theband positions characteristic of Ca, Fe and Mg-bearing carbonates arecentered at 2.34 and 2.54 (Ca), 2.33 and 2.53 (Fe), 2.30 and 2.50 μm(Mg) (Hunt and Salisbury, 1971; White, 1974; Gaffey, 1987).
3.2. Previous Carbonate detections in the Nili Fossae Region
Mg-carbonate has been inferred in Nili Fossae by recognition ofbands at 2.30 and 2.50 μm, accompanied by weak 3.4 and 3.9 μmbands (Ehlmann et al., 2008b). A 1.9 μm H2O absorption band is alsopresent, probably due to a second, hydrated mineral (e.g., hydrouscarbonate (Ehlmann et al., 2008b) or phyllosilicate).
In the low albedo, volcanic region of Syrtis Major, and in particularNili Fossae, typical maximum visible reflectance values vary from 0.1-0.2. Fig. 3 shows example spectra showing 2.3 and 2.54 μmbands fromCRISM image HRL 40FF over Jezero Crater. These spectra have beenatmospherically ‘corrected’ using the volcano-scan method (McGuireet al., 2009). The CRISM known noisy band at 2700 nm has beenremoved and 5×5 regions have been averaged to obtain the spectra.
We now look at a further parameter that can be used to distinguishcarbonate minerals that tends to confirm the recognition of Mg-carbonate – the symmetry of the absorption bands, and combine thisinformation with that of the central absorption band position.
3.3. 2.3 and 2.5 μm absorption band fitting
We have carried out a Nelder and Mead (1965) (also known as“Amoeba”) simplex routine to estimate the best fits of an asymmetric
Gaussian shape to each of the 2.3 and 2.5 μm bands in the CRISMratioed spectra. We chose ‘shoulders’ at 2.2 and 2.384 μm for the2.3 μm band and at 2.403 and 2.588 μm for the 2.5 μm band. Astraight-line continuum was removed from the between the‘shoulders’ and the spectrum was then converted to apparentabsorbance (Brown, 2006a, Brown et al., 2006, 2008b), before fittingwith an asymmetric Gaussian shape. To eliminate unwanted noise theCRISM spectra were treated with a Savitzky-Golay smoothingalgorithm before processing (Savitzky and Golay, 1964). An exampleof the fit is shown in Fig. 4. The asymmetric Gaussian shape can bedescribed by the function:
If λ≤λ0; f ðλÞ = α exp − λ−λ0
σ2
� �2� �if λ N λ0; f ðλÞ = α exp − λ−λ0
ðχσÞ2� �2� �
ð1Þ
We report here the centroid λ0, amplitude α, half width halfmaximum (HWHM in μm) σ, and the asymmetry parameter χ, all tothree decimal places (or 1 nanometer) accuracy. Since CRISM bandsare spaced roughly 6.6 nm apart, 1 nm represents 15% of the distance
177A.J. Brown et al. / Earth and Planetary Science Letters 297 (2010) 174–182
between spectral bands. The asymmetry parameter is unbounded –
values less than 1 indicate ‘right asymmetry’ (the HWHM on the rightside is less than the HWHM on the left side of the centroid, as seen inFig. 4), values greater than 1 indicate left asymmetry.
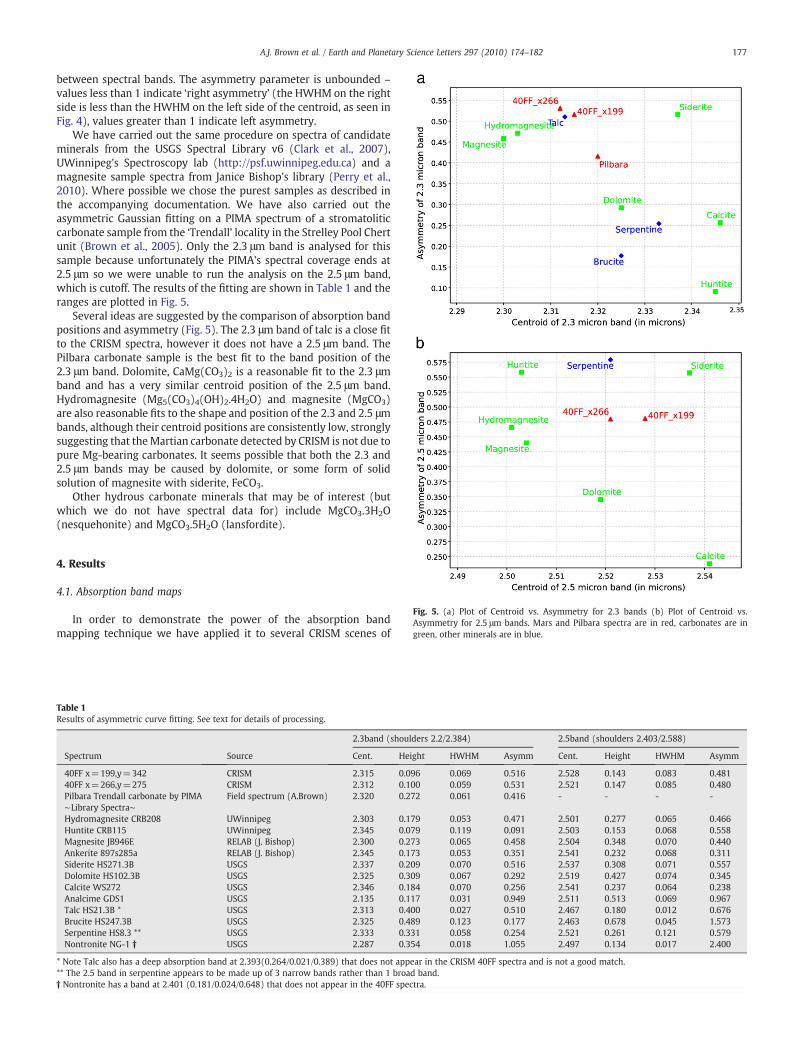
We have carried out the same procedure on spectra of candidateminerals from the USGS Spectral Library v6 (Clark et al., 2007),UWinnipeg's Spectroscopy lab (http://psf.uwinnipeg.edu.ca) and amagnesite sample spectra from Janice Bishop's library (Perry et al.,2010). Where possible we chose the purest samples as described inthe accompanying documentation. We have also carried out theasymmetric Gaussian fitting on a PIMA spectrum of a stromatoliticcarbonate sample from the ‘Trendall’ locality in the Strelley Pool Chertunit (Brown et al., 2005). Only the 2.3 μm band is analysed for thissample because unfortunately the PIMA's spectral coverage ends at2.5 μm so we were unable to run the analysis on the 2.5 μm band,which is cutoff. The results of the fitting are shown in Table 1 and theranges are plotted in Fig. 5.
Several ideas are suggested by the comparison of absorption bandpositions and asymmetry (Fig. 5). The 2.3 μm band of talc is a close fitto the CRISM spectra, however it does not have a 2.5 μm band. ThePilbara carbonate sample is the best fit to the band position of the2.3 μm band. Dolomite, CaMg(CO3)2 is a reasonable fit to the 2.3 μmband and has a very similar centroid position of the 2.5 μm band.Hydromagnesite (Mg5(CO3)4(OH)2.4H2O) and magnesite (MgCO3)are also reasonable fits to the shape and position of the 2.3 and 2.5 μmbands, although their centroid positions are consistently low, stronglysuggesting that theMartian carbonate detected by CRISM is not due topure Mg-bearing carbonates. It seems possible that both the 2.3 and2.5 μm bands may be caused by dolomite, or some form of solidsolution of magnesite with siderite, FeCO3.
Other hydrous carbonate minerals that may be of interest (butwhich we do not have spectral data for) include MgCO3.3H2O(nesquehonite) and MgCO3.5H2O (lansfordite).
Fig. 5. (a) Plot of Centroid vs. Asymmetry for 2.3 bands (b) Plot of Centroid vs.Asymmetry for 2.5 μm bands. Mars and Pilbara spectra are in red, carbonates are ingreen, other minerals are in blue.
4. Results
4.1. Absorption band maps
In order to demonstrate the power of the absorption bandmapping technique we have applied it to several CRISM scenes of
Table 1Results of asymmetric curve fitting. See text for details of processing.
* Note Talc also has a deep absorption band at 2.393(0.264/0.021/0.389) that does not appear in the CRISM 40FF spectra and is not a good match.** The 2.5 band in serpentine appears to be made up of 3 narrow bands rather than 1 broad band.† Nontronite has a band at 2.401 (0.181/0.024/0.648) that does not appear in the 40FF spectra.
178 A.J. Brown et al. / Earth and Planetary Science Letters 297 (2010) 174–182
Nili Fossae containing Mg-carbonate spectra. We used a thresholdmethod to map the presence of carbonates. We required that 1.) the2.3 and 2.5 μm bands be present, 2.) the 2.3 μm band had a depth of0.1 and lay between 2.285 and 2.335 and 3.) the 2.5 μm band had adepth of 0.1 and lay between 2.46 and 2.54 μm. The 0.1 thresholddepth heuristic was chosen in order to avoid false detections on noisypixels, and was established by experimentation with a set of CRISMimages and hand-checking selected spectra for the presence ofrecognizable carbonate bands at 2.3 and 2.5 microns. In addition, asimple noise detection algorithm was used before band fitting toeliminate spectra that had obvious noise spikes before processing.
The spectral smile of the CRISM instrument was compensated forby using the smile-corrected two-dimensional CDR WA wavelengthtables supplied by the CRISM team. No atmospheric correction wasapplied before absorption band mapping, since no atmosphericcorrection is perfect and in this way will avoid any questions overbias introduced by a particular atmospheric removal process. Noknown gaseous absorption bands are likely to contaminate the 2.3 and2.5 bands. Two factors help eliminate the misidentification ofcarbonates due to gaseous absorption bands – 1.) If a well-mixedgaseous absorption band was present then it would be expected to bepresent throughout an image, not in patches of the image, and 2.) nogas expected in the Martian atmosphere has absorption bands at 2.3
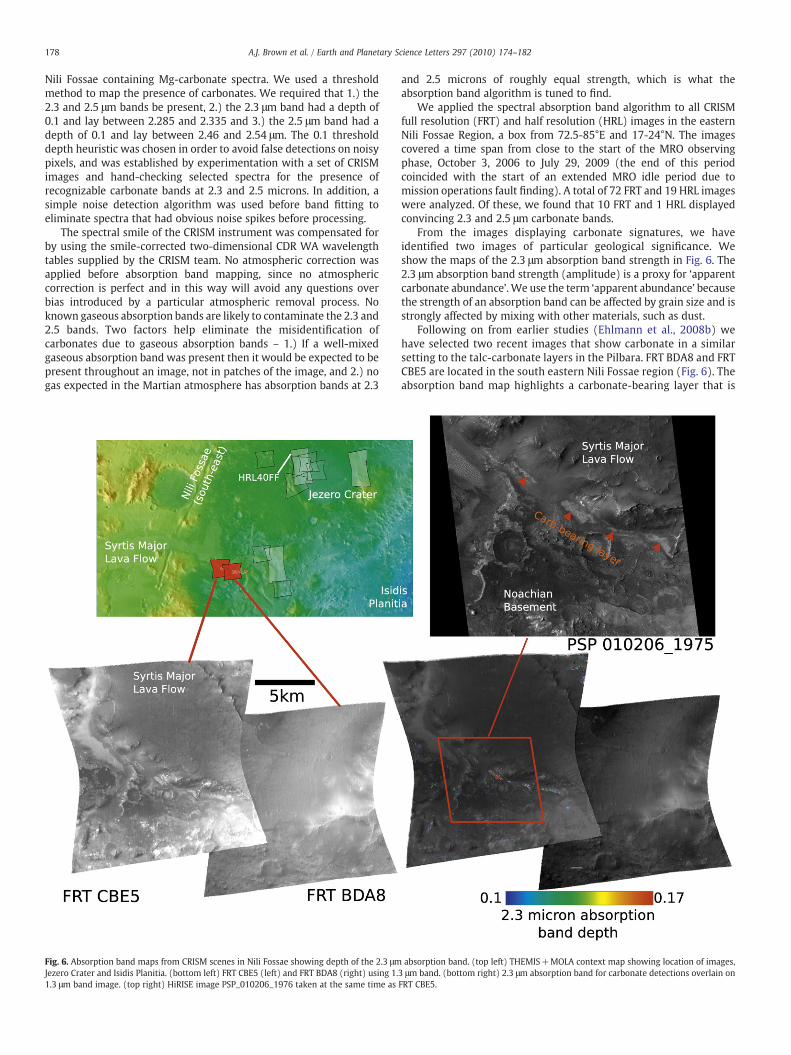
Fig. 6. Absorption band maps from CRISM scenes in Nili Fossae showing depth of the 2.3 μmJezero Crater and Isidis Planitia. (bottom left) FRT CBE5 (left) and FRT BDA8 (right) using 1.1.3 μm band image. (top right) HiRISE image PSP_010206_1976 taken at the same time as
and 2.5 microns of roughly equal strength, which is what theabsorption band algorithm is tuned to find.
We applied the spectral absorption band algorithm to all CRISMfull resolution (FRT) and half resolution (HRL) images in the easternNili Fossae Region, a box from 72.5-85°E and 17-24°N. The imagescovered a time span from close to the start of the MRO observingphase, October 3, 2006 to July 29, 2009 (the end of this periodcoincided with the start of an extended MRO idle period due tomission operations fault finding). A total of 72 FRT and 19 HRL imageswere analyzed. Of these, we found that 10 FRT and 1 HRL displayedconvincing 2.3 and 2.5 μm carbonate bands.
From the images displaying carbonate signatures, we haveidentified two images of particular geological significance. Weshow the maps of the 2.3 μm absorption band strength in Fig. 6. The2.3 μm absorption band strength (amplitude) is a proxy for ‘apparentcarbonate abundance’. We use the term ‘apparent abundance’ becausethe strength of an absorption band can be affected by grain size and isstrongly affected by mixing with other materials, such as dust.
Following on from earlier studies (Ehlmann et al., 2008b) wehave selected two recent images that show carbonate in a similarsetting to the talc-carbonate layers in the Pilbara. FRT BDA8 and FRTCBE5 are located in the south eastern Nili Fossae region (Fig. 6). Theabsorption band map highlights a carbonate-bearing layer that is
absorption band. (top left) THEMIS+MOLA context map showing location of images,3 μm band. (bottom right) 2.3 μm absorption band for carbonate detections overlain onFRT CBE5.
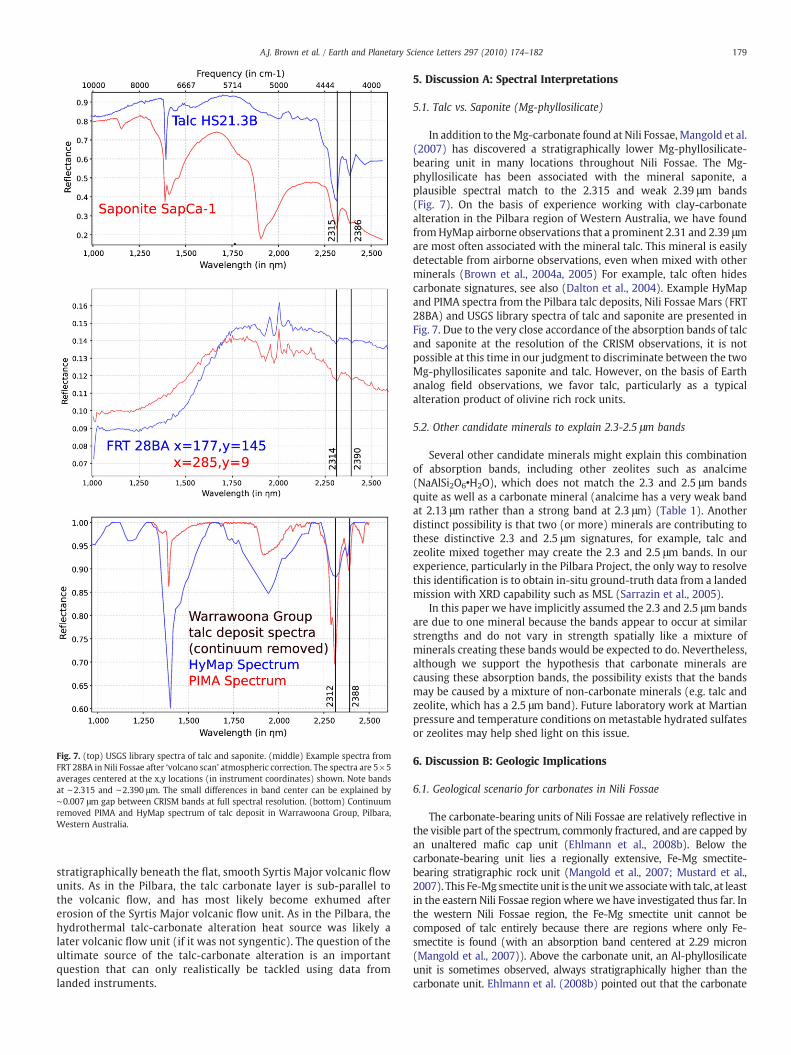
Fig. 7. (top) USGS library spectra of talc and saponite. (middle) Example spectra fromFRT 28BA in Nili Fossae after ‘volcano scan’ atmospheric correction. The spectra are 5×5averages centered at the x,y locations (in instrument coordinates) shown. Note bandsat ∼2.315 and ∼2.390 μm. The small differences in band center can be explained by∼0.007 μm gap between CRISM bands at full spectral resolution. (bottom) Continuumremoved PIMA and HyMap spectrum of talc deposit in Warrawoona Group, Pilbara,Western Australia.
179A.J. Brown et al. / Earth and Planetary Science Letters 297 (2010) 174–182
stratigraphically beneath the flat, smooth Syrtis Major volcanic flowunits. As in the Pilbara, the talc carbonate layer is sub-parallel tothe volcanic flow, and has most likely become exhumed aftererosion of the Syrtis Major volcanic flow unit. As in the Pilbara, thehydrothermal talc-carbonate alteration heat source was likely alater volcanic flow unit (if it was not syngentic). The question of theultimate source of the talc-carbonate alteration is an importantquestion that can only realistically be tackled using data fromlanded instruments.
5. Discussion A: Spectral Interpretations
5.1. Talc vs. Saponite (Mg-phyllosilicate)
In addition to theMg-carbonate found at Nili Fossae, Mangold et al.(2007) has discovered a stratigraphically lower Mg-phyllosilicate-bearing unit in many locations throughout Nili Fossae. The Mg-phyllosilicate has been associated with the mineral saponite, aplausible spectral match to the 2.315 and weak 2.39 μm bands(Fig. 7). On the basis of experience working with clay-carbonatealteration in the Pilbara region of Western Australia, we have foundfromHyMap airborne observations that a prominent 2.31 and 2.39 μmare most often associated with the mineral talc. This mineral is easilydetectable from airborne observations, even when mixed with otherminerals (Brown et al., 2004a, 2005) For example, talc often hidescarbonate signatures, see also (Dalton et al., 2004). Example HyMapand PIMA spectra from the Pilbara talc deposits, Nili Fossae Mars (FRT28BA) and USGS library spectra of talc and saponite are presented inFig. 7. Due to the very close accordance of the absorption bands of talcand saponite at the resolution of the CRISM observations, it is notpossible at this time in our judgment to discriminate between the twoMg-phyllosilicates saponite and talc. However, on the basis of Earthanalog field observations, we favor talc, particularly as a typicalalteration product of olivine rich rock units.
5.2. Other candidate minerals to explain 2.3-2.5 μm bands
Several other candidate minerals might explain this combinationof absorption bands, including other zeolites such as analcime(NaAlSi2O6•H2O), which does not match the 2.3 and 2.5 μm bandsquite as well as a carbonate mineral (analcime has a very weak bandat 2.13 μm rather than a strong band at 2.3 μm) (Table 1). Anotherdistinct possibility is that two (or more) minerals are contributing tothese distinctive 2.3 and 2.5 μm signatures, for example, talc andzeolite mixed together may create the 2.3 and 2.5 μm bands. In ourexperience, particularly in the Pilbara Project, the only way to resolvethis identification is to obtain in-situ ground-truth data from a landedmission with XRD capability such as MSL (Sarrazin et al., 2005).
In this paper we have implicitly assumed the 2.3 and 2.5 μm bandsare due to one mineral because the bands appear to occur at similarstrengths and do not vary in strength spatially like a mixture ofminerals creating these bands would be expected to do. Nevertheless,although we support the hypothesis that carbonate minerals arecausing these absorption bands, the possibility exists that the bandsmay be caused by a mixture of non-carbonate minerals (e.g. talc andzeolite, which has a 2.5 μm band). Future laboratory work at Martianpressure and temperature conditions on metastable hydrated sulfatesor zeolites may help shed light on this issue.
6. Discussion B: Geologic Implications
6.1. Geological scenario for carbonates in Nili Fossae
The carbonate-bearing units of Nili Fossae are relatively reflective inthe visible part of the spectrum, commonly fractured, and are capped byan unaltered mafic cap unit (Ehlmann et al., 2008b). Below thecarbonate-bearing unit lies a regionally extensive, Fe-Mg smectite-bearing stratigraphic rock unit (Mangold et al., 2007; Mustard et al.,2007). This Fe-Mg smectite unit is theunitwe associatewith talc, at leastin the eastern Nili Fossae region where we have investigated thus far. Inthe western Nili Fossae region, the Fe-Mg smectite unit cannot becomposed of talc entirely because there are regions where only Fe-smectite is found (with an absorption band centered at 2.29 micron(Mangold et al., 2007)). Above the carbonate unit, an Al-phyllosilicateunit is sometimes observed, always stratigraphically higher than thecarbonate unit. Ehlmann et al. (2008b) pointed out that the carbonate
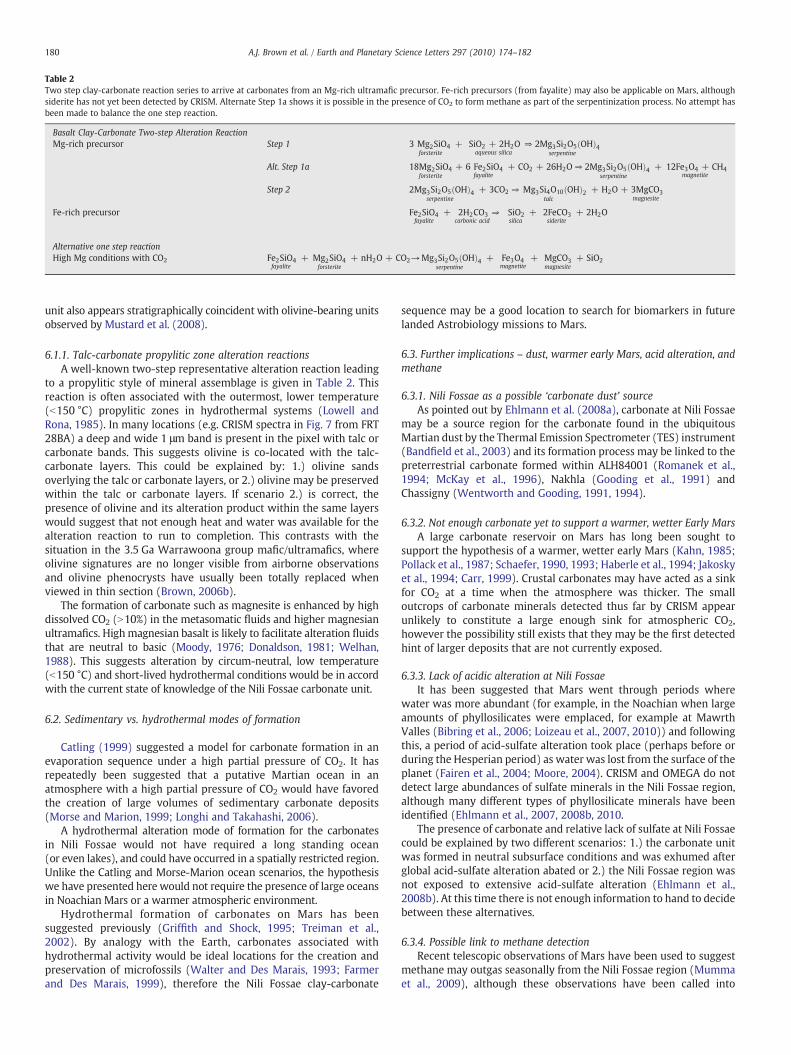
Table 2Two step clay-carbonate reaction series to arrive at carbonates from an Mg-rich ultramafic precursor. Fe-rich precursors (from fayalite) may also be applicable on Mars, althoughsiderite has not yet been detected by CRISM. Alternate Step 1a shows it is possible in the presence of CO2 to form methane as part of the serpentinization process. No attempt hasbeen made to balance the one step reaction.
Alternative one step reactionHigh Mg conditions with CO2 Fe2SiO4
fayalite+ Mg2SiO4
forsterite+ nH2O + CO2→Mg3Si2O5 OHð Þ4
serpentine+ Fe3O4
magnetite+ MgCO3
magnesite+ SiO2
180 A.J. Brown et al. / Earth and Planetary Science Letters 297 (2010) 174–182
unit also appears stratigraphically coincident with olivine-bearing unitsobserved by Mustard et al. (2008).
6.1.1. Talc-carbonate propylitic zone alteration reactionsA well-known two-step representative alteration reaction leading
to a propylitic style of mineral assemblage is given in Table 2. Thisreaction is often associated with the outermost, lower temperature(b150 °C) propylitic zones in hydrothermal systems (Lowell andRona, 1985). In many locations (e.g. CRISM spectra in Fig. 7 from FRT28BA) a deep and wide 1 μm band is present in the pixel with talc orcarbonate bands. This suggests olivine is co-located with the talc-carbonate layers. This could be explained by: 1.) olivine sandsoverlying the talc or carbonate layers, or 2.) olivine may be preservedwithin the talc or carbonate layers. If scenario 2.) is correct, thepresence of olivine and its alteration product within the same layerswould suggest that not enough heat and water was available for thealteration reaction to run to completion. This contrasts with thesituation in the 3.5 Ga Warrawoona group mafic/ultramafics, whereolivine signatures are no longer visible from airborne observationsand olivine phenocrysts have usually been totally replaced whenviewed in thin section (Brown, 2006b).
The formation of carbonate such as magnesite is enhanced by highdissolved CO2 (N10%) in the metasomatic fluids and higher magnesianultramafics. Highmagnesian basalt is likely to facilitate alteration fluidsthat are neutral to basic (Moody, 1976; Donaldson, 1981; Welhan,1988). This suggests alteration by circum-neutral, low temperature(b150 °C) and short-lived hydrothermal conditions would be in accordwith the current state of knowledge of the Nili Fossae carbonate unit.
6.2. Sedimentary vs. hydrothermal modes of formation
Catling (1999) suggested a model for carbonate formation in anevaporation sequence under a high partial pressure of CO2. It hasrepeatedly been suggested that a putative Martian ocean in anatmosphere with a high partial pressure of CO2 would have favoredthe creation of large volumes of sedimentary carbonate deposits(Morse and Marion, 1999; Longhi and Takahashi, 2006).
A hydrothermal alteration mode of formation for the carbonatesin Nili Fossae would not have required a long standing ocean(or even lakes), and could have occurred in a spatially restricted region.Unlike the Catling and Morse-Marion ocean scenarios, the hypothesiswe have presented here would not require the presence of large oceansin Noachian Mars or a warmer atmospheric environment.
Hydrothermal formation of carbonates on Mars has beensuggested previously (Griffith and Shock, 1995; Treiman et al.,2002). By analogy with the Earth, carbonates associated withhydrothermal activity would be ideal locations for the creation andpreservation of microfossils (Walter and Des Marais, 1993; Farmerand Des Marais, 1999), therefore the Nili Fossae clay-carbonate
sequence may be a good location to search for biomarkers in futurelanded Astrobiology missions to Mars.
6.3. Further implications – dust, warmer early Mars, acid alteration, andmethane
6.3.1. Nili Fossae as a possible ‘carbonate dust’ sourceAs pointed out by Ehlmann et al. (2008a), carbonate at Nili Fossae
may be a source region for the carbonate found in the ubiquitousMartian dust by the Thermal Emission Spectrometer (TES) instrument(Bandfield et al., 2003) and its formation process may be linked to thepreterrestrial carbonate formed within ALH84001 (Romanek et al.,1994; McKay et al., 1996), Nakhla (Gooding et al., 1991) andChassigny (Wentworth and Gooding, 1991, 1994).
6.3.2. Not enough carbonate yet to support a warmer, wetter Early MarsA large carbonate reservoir on Mars has long been sought to
support the hypothesis of a warmer, wetter early Mars (Kahn, 1985;Pollack et al., 1987; Schaefer, 1990, 1993; Haberle et al., 1994; Jakoskyet al., 1994; Carr, 1999). Crustal carbonates may have acted as a sinkfor CO2 at a time when the atmosphere was thicker. The smalloutcrops of carbonate minerals detected thus far by CRISM appearunlikely to constitute a large enough sink for atmospheric CO2,however the possibility still exists that they may be the first detectedhint of larger deposits that are not currently exposed.
6.3.3. Lack of acidic alteration at Nili FossaeIt has been suggested that Mars went through periods where
water was more abundant (for example, in the Noachian when largeamounts of phyllosilicates were emplaced, for example at MawrthValles (Bibring et al., 2006; Loizeau et al., 2007, 2010)) and followingthis, a period of acid-sulfate alteration took place (perhaps before orduring the Hesperian period) as water was lost from the surface of theplanet (Fairen et al., 2004; Moore, 2004). CRISM and OMEGA do notdetect large abundances of sulfate minerals in the Nili Fossae region,although many different types of phyllosilicate minerals have beenidentified (Ehlmann et al., 2007, 2008b, 2010.
The presence of carbonate and relative lack of sulfate at Nili Fossaecould be explained by two different scenarios: 1.) the carbonate unitwas formed in neutral subsurface conditions and was exhumed afterglobal acid-sulfate alteration abated or 2.) the Nili Fossae region wasnot exposed to extensive acid-sulfate alteration (Ehlmann et al.,2008b). At this time there is not enough information to hand to decidebetween these alternatives.
6.3.4. Possible link to methane detectionRecent telescopic observations of Mars have been used to suggest
methane may outgas seasonally from the Nili Fossae region (Mummaet al., 2009), although these observations have been called into
181A.J. Brown et al. / Earth and Planetary Science Letters 297 (2010) 174–182
question on the basis of possible telluric contamination (Zahnle et al.,2010). If indeed the Nili Fossae region is a source of methane, theserpentinization process outlined in Table 2 (Step 1a) is one potentialsource. Oze and Sharma (2005) have suggested that for serpentiniza-tion to occur on Mars it is necessary to have: 1.) pressure of 0.5 bar(i.e. subsurface onMars), 2.) temperatureb330 °C and 3.) liquid waterand dissolved CO2(aq) must be present. As shown in Table 2, thisproposed reaction would be consistent with ongoing clay-carbonatehydrothermal alteration, however for this process to be a source ofmethane on Mars today, it would imply that clay carbonate alterationis occurring kms below the Martian surface, and cannot be directlylinked to the Nili Fossae carbonate observed by CRISM. Any linkagesbetween current day methane production and carbonate likelyrequires further investigation from landed spacecraft.
7. Conclusions
The results of our work are summarized below.
1. We have found that based on the position of the 2.3 and 2.5 micronband the carbonates in Nili Fossae are unlikely to be pure Mg-carbonates, and are likely to be a solid solution with sideriteor calcite, and may be partially dolomitised magnesite orhydromagnesite.
2. We propose that a talc-carbonate mineral assemblage similar tothat present at the Archean Warrawoona Group in the Pilbararegion of Western Australia is a plausible analog for the clay andcarbonate-bearing Noachian rock unit at Nili Fossae, Mars.
3. We suggest that hydrothermal alteration of a basaltic mafic/ultramafic precursor has produced the carbonate and clay detectedby CRISM in Nili Fossae. This formation scenario requires liquidwater, but would not necessitate large lakes or oceans on NoachianMars.
4. The presence of clay and carbonate in the Nili Fossae regionsuggests that biomarkers (if present) could have been preservedwithin these rocks, as they have been in the Pilbara region.
Further investigation of this area by landed missions withmineralogical characterization capability (VNIR, Raman or XRD)would enable a more detailed analysis of the clay and carbonatecomponents of these rock units and should be a high priority of theMars Exploration Program.
Acknowledgements
We would like to thank Bethany Ehlmann, Ed Cloutis, KatrinStephan and Nicolas Mangold for their reviews which improved thispaper immensely. Wewould also like to thank the entire CRISM Team,particularly the Science Operations team at JHU APL. This work wassupported by the NASA Interdisciplinary Exploration Systems Pro-gram NNH05ZDA001N-IES.
Appendix
A.1. 3.4 and 3.9 μm band sensitivity analysis
We present a sensitivity analysis of the 3-4 μm region for CRISM inorder to assess absorption band strengths that would be required forband recognition in the 3-4 μm region.
The OMEGA team considered the detection of carbonates torequire detection of a 3.4 μmband (Jouglet et al., 2007) and the CRISMcarbonate spectra do not show this band. Ehlmann et al. (2008b)suggest that laboratory spectra of carbonates show the 3.4 and 3.9 μmbands of carbonate can be reduced or eliminated in the presence ofwater, coatings or other minerals. Hydrous carbonates frequentlyhave reduced or eliminated 3.4 or 3.9 μm bands (Cloutis et al., 2000).
Here we determine the relationship between signal to noise andband depth in order to determine the relative sensitivity of the CRISMinstrument to the 3.4 and 2.5 μm bands. We chose the calcite spectrallibrary as an exemplar, since it has a strong 3.4 μm band (compared tosiderite, for example, as in Fig. 2).
From Table 1, the calcite HWHM of the 2.5 μm band is 0.064 μm.We estimate the HWHM of the calcite 3.4 μm band to be 0.130 μm.These figures are somewhat dependant on the purity of samples, grainsize effects and viewing conditions. However, we would assert thatwe cannot envisage a scenario where the carbonate 3.4 μm absorptionband is likely to be more than 3 times wider than the 2.5 μm band.Following Kirkland et al. (2001), we calculated a “relative detectionlimit” incorporating the signal to noise of the CRISM instrument in the2.5 and 3.4 μm regions. Using the formula in Equation 2:
andusinga sampling interval of 6.6 nm,approximate signal tonoise (peaktopeakorPtoP) forCRISMat2.5 μmof450andat3.4 μmof80(Murchie etal., 2007) (and eliminating the somewhat arbitrary confidence factor bysetting it to 1)we find the 2.5 μm feature has a detection limit of 0.05 andthe 3.4 μm feature has a detection limit of 0.199.
Considering only the relative detection limits, this implies that theCRISM spectral band detection threshold for the 3.4 μm feature is fourtimes that of the 2.5 μm feature. In the limit of small abundances(or low albedo conditions due to highly absorbing co-contaminants,the likely scenario for Nili Fossae) the 3.4 μm band will becomeundetectable by CRISM far more quickly than the 2.5 μm band. Thismay provide an additional explanation for why strong 3.4 (or 3.9) μmcarbonate absorption bands have not been detected by CRISM orOMEGA.
References
Baird, A.K., Clark, B.C., 1981. On the Original Igneous Source of Martian Fines. Icarus 45,113–123.
Bandfield, J.L., et al., 2003. Spectroscopic identification of carbonate minerals in themartian dust. Science 301, 1084–1087.
Bell, J.F., et al., 1994. Spectroscopy of Mars from 2.04 to 2.44 Mu-M During the 1993Opposition - Absolute Calibration and Atmospheric Vs Mineralogic Origin ofNarrow Absorption Features. Icarus 111, 106–123.
Bibring, J.-P., et al., 2006. Global Mineralogical and Aqueous Mars History Derived fromOMEGA/Mars Express Data. Science 312, 400–404.
Bishop, J.L., et al., 1998a. Recognition of minor constituents in reflectance spectra ofAllan Hills 84001 chips and the importance for remote sensing on Mars. Meteorit.Planet. Sci. 33, 693–698.
Bishop, J.L., et al., 1998b. Spectroscopic analysis of Martian meteorite Allan Hills 84001powder and applications for spectral identification of minerals and other soilcomponents on Mars. Meteorit. Planet. Sci. 33, 699–707.
Blaney, D.L., McCord, T.B., 1989. An observational search for carbonates on Mars.J. Geophys. Res. 94, 10159–10166.
Boynton, W.V., et al., 2009. Evidence for Calcium Carbonate at the Mars PhoenixLanding Site. Science 325, 61–64.
Brauhart, C.W., et al., 2001. Geochemical Mass-Transfer Patterns as Indicators of theArchitecture of a Complete Volcanic-HostedMassive SulfideHydrothermal AlterationSystem, Panorama District, Pilbara, Western Australia. Econ. Geol. 96, 1263–1278.
Bridges, J.C., et al., 2001. Alteration Assemblages in Martian Meteorites: Implications forNear-Surface Processes. Space Sci. Rev. 96, 365–392.
Brown, A.J., 2006a. Spectral Curve Fitting for Automatic Hyperspectral Data Analysis.IEEE Trans. Geosci. Remote Sens. 44, 1601–1608.
Brown, A. J., Hyperspectral Mapping of Ancient Hydrothermal Systems. Earth andPlanetary Sciences, Vol. PhD. Macquarie University, Sydney, N.S.W., 2006b.
Brown, A.J., et al., 2004a. Short Wave Infrared Reflectance Investigation of Sitesof Palaeobiological interest: Applications for Mars Exploration. Astrobiology 4,359–376.
Brown, A.J., et al., 2004b. Hyperspectral and field mapping of an Archaean KomatiiteUnit in the Pilbara Craton. Western Australia: Applications for CRISMMission. LPSCXXXV. LPI, Houston. Vol. abstract 1420.
Brown, A.J., et al., 2005. Hyperspectral Imaging Spectroscopy of a Mars AnalogEnvironment at the North Pole Dome, Pilbara Craton, Western Australia. Aust. J.Earth Sci. 52, 353–364.
182 A.J. Brown et al. / Earth and Planetary Science Letters 297 (2010) 174–182
Brown, A.J., et al., 2006. Hydrothermal alteration at the Panorama Formation, North PoleDome, Pilbara Craton, Western Australia. Precambrian Res. 151, 211–223.
Brown, A.J., et al., 2008a. Talc carbonate Weathering as a Possible Terrestrial Analog forAlteration Assemblages in the Nili Fossae Region of Mars. Astrobiology 8, 432.
Brown, A.J., et al., 2008b. The MARTE Imaging Spectrometer Experiment: Design andAnalysis. Astrobiology 8, 1001–1011.
Calvin, W.M., et al., 1994. Hydrous Carbonates on Mars - Evidence from Mariner 6/7Infrared Spectrometer and Ground-Based Telescopic Spectra. J. Geophys. Res.-Planets 99, 14659–14675.
Campbell, I.H., et al., 1989. Melting in an Archaeanmantle plume: heads it's basalts, tailsit's komatiites. Nature 339, 697–699.
Carr, M.H., 1999. Retention of an atmosphere on early Mars. J. Geophys. Res.-Planets104, 21897–21909.
Catling, D.C., 1999. A chemical model for evaporites on early Mars: Possiblesedimentary tracers of the climate and implications for exploration. J. Geophys.Res. 104, 16453–16469.
Clark, R.N., et al., 1990. High spectral resolution reflectance spectroscopy of minerals.J. Geophys. Res. 95 (B), 12653–12680.
Clark, R. N., et al., USGS digital spectral library splib06a: http://speclab.cr.usgs.gov/spectral.lib06., Digital Data Series 231. U.S. Geological Survey, 2007.
Cloutis, E.A., et al., 2000. Hydrated Carbonate Minerals: Spectral Reflectance Proper-ties and Possibility of Detection in Martian Spectra. LPSC XXXI. LPI, Houston, TX.pp. Abstract 1152.
Dalton, J.B., et al., 2004. Identification of spectrally similar materials using the USGSTetracorder algorithm: the calcite-epidote-chlorite problem. Remote Sens. Environ.89, 455–466.
Donaldson, M.J., 1981. Redistribution of ore elements during serpentinization and talc-carbonate alteration of some Archean dunites, Western Australia. Econ. Geol. 76,1698–1713.
Ehlmann, B.L., et al., 2007. New secondary minerals detected by MRO CRISM and theirgeologic settings: Kaolinite, chlorite, Illite/Muscovite and the possibility ofserpentine or carbonate in Nili Fossae. Seventh International Conference on Mars.LPI, Pasadena, CA.
Ehlmann, B.L., et al., 2008a. Clay minerals in delta deposit and organic preservationpotential on Mars. Nat. Geosci. doi:10.1038/ngeo207.
Ehlmann, B.L., et al., 2008b. Orbital Identification of Carbonate-Bearing Rocks on Mars.Science 322, 1828–1832.
Ehlmann, B.L., et al., 2009. Identification of hydrated silicate minerals on Mars usingMRO-CRISM: Geologic context near Nili Fossae and implications for aqueousalteration. J. Geophys. Res. 114. doi:10.1029/2009JE003339.
Ehlmann, B.L., et al., 2010. Geologic setting of serpentine deposits on Mars. Geophys.Res. Lett. 37, L06201.
Fairen, A.G., et al., 2004. Inhibition of carbonate synthesis in acidic oceans on early Mars.Nature 431, 423–426.
Farmer, J.D., Des Marais, D.J., 1999. Exploring for a record of ancient Martian life.J. Geophys. Res.-Planets. 104, 26977–26995.
Gaffey, S.J., 1987. Spectral reflectance of carbonate minerals in the visible and nearinfrared (0.35-2.55 microns): anhydrous carbonate minerals. J. Geophys. Res. 92,1429–1440.
Gooding, J.L., 1978. Chemical weathering on Mars: Thermodynamic stabilities ofprimary minerals (and their alteration products) from mafic igneous rocks. Icarus33, 483–513.
Gooding, J.L., et al., 1991. Aqueous alteration of the Nakhla meteorite. Meteoritics. 26,135–143.
Griffith, L.L., Shock, E.L., 1995. A Geochemical Model for the Formation of HydrothermalCarbonates on Mars. Nature 377, 406–408.
Haberle, R.M., et al., 1994. A Model for the Evolution of Co2 onMars. Icarus 109, 102–120.Hamilton, V.E., Christensen, P.R., 2005. Evidence for extensive, olivine-rich bedrock on
Mars. Geology 33, 433–436.Hoefen, T.M., et al., 2003. Discovery of Olivine in the Nili Fossae Region of Mars. Science
302, 627–630.Hunt, G.R., Salisbury, J.W., 1971. Visible and Near-Infrared Spectra of Minerals and
Rocks: II Carbonates. Mod. Geol. 2, 23–30.Jakosky, B.M., et al., 1994. Mars Atmospheric Loss and Isotopic Fractionation by Solar-
Wind- Induced Sputtering and Photochemical Escape. Icarus 111, 271–288.Jouglet, D., et al., 2007. Search for Carbonates on Mars with the OMEGA/Mars Express
Data. Seventh International Conference on Mars. LPI, Pasadena, CA. pp. Abstract#3153.
Kahn, R., 1985. The evolution of CO2 on Mars. Icarus 62, 175–190.Kirkland, L.E., et al., 2001. Thermal Infrared Spectral Band Detection Limits for
Unidentified Surface Materials. Appl. Opt. 40, 4852–4862.Lellouch, E., et al., 2000. The 2.4-45 mu m spectrum of Mars observed with the Infrared
Space Observatory. Planet. Space Sci. 48, 1393–1405.Loizeau, D., et al., 2007. Phyllosilicates in the Mawrth Vallis region of Mars. J. Geophys.
Res. 112 E08S08.Loizeau, D., et al., 2010. Stratigraphy in theMawrth Vallis region through OMEGA, HRSC
color imagery and DTM. Icarus 205, 396–418.Longhi, J., Takahashi, T., 2006. Oceans on Mars: Whither Carbonate? , LPSC XXXVII. LPI,
Houston, TX. pp. Abstract 2455.Lowell, R.P., Rona, P.A., 1985. Hydrothermal models for the generation of massive
sulfide ore deposits. J. Geophys. Res. 90, 8769–8783.Mangold, N., et al., 2007. Mineralogy of the Nili Fossae region with OMEGA/Mars
Express data: 2. Aqueous alteration of the crust. J. Geophys. Res. 112. doi:10.1029/2006JE002835.
McGuire, P.C., et al., 2009. An improvement to the volcano-scan algorithm for atmosphericcorrection of CRISM and OMEGA spectral data. Planet. Space Sci. 57, 809–815.
McKay, C.P., Nedell, S.S., 1988. Are there carbonate deposits in the Valles Marineris,Mars? Icarus 73, 142–148.
McKay, D.S., et al., 1996. Search for past life on Mars: Possible relic biogenic activity inMartian meteorite ALH84001. Science 273, 924–930.
Moody, J.B., 1976. Serpentinization: a review. Lithos 9, 125–138.Moore, J.M., 2004. Blueberry fields for ever. Nature 428, 711–712.Morris, R. V., et al., 2010. Identification of Carbonate-Rich Outcrops onMars by the Spirit
Rover. Science. science.1189667.Morse, J.W., Marion, G.M., 1999. The role of carbonates in the evolution of early Martian
oceans. Am. J. Sci. 299, 738–761.Mumma, M.J., et al., 2009. Strong Release of Methane on Mars in Northern Summer
2003. Science 323, 1041–1045.Murchie, S., et al., 2007. Compact Reconnaissance Imaging Spectrometer for Mars
(CRISM) on Mars Reconnaissance Orbiter (MRO). J. Geophys. Res. 112, E05S03.doi:10.1029/2006JE002682.
Mustard, J.F., et al., 2007. Mineralogy of the Nili Fossae region with OMEGA/MarsExpress data: 1. Ancient impact melt in the Isidis Basin and implications for thetransition from the Noachian to Hesperian. J. Geophys. Res. 112.
Mustard, J.F., et al., 1993. The Surface of Syrtis Major - Composition of the VolcanicSubstrate and Mixing with Altered Dust and Soil. J. Geophys. Res.-Planets. 98,3387–3400.
Mustard, J.F., et al., 2005. Olivine and Pyroxene Diversity in the Crust of Mars. Science307, 1594–1597.
Mustard, J.F., et al., 2008. Hydrated silicate minerals on Mars observed by the MarsReconnaissance Orbiter CRISM instrument. Nature 454, 305–309.
Nelder, J.A., Mead, R., 1965. A simplex method for function minimization. Comput. J. 7,308–313.
Niles, P.B., et al., 2009. Insights into the formation of Fe- and Mg-rich aqueous solutions onearlyMarsprovided by theALH84001 carbonates. Earth Planet. Sci. Lett. 286, 122–130.
O'Connor, J.T., 1968. Mineral Stability at the Martian Surface. J. Geophys. Res. 73,5301–5311.
Oze, C., Sharma, M., 2005. Have olivine, will gas: Serpentinization and the abiogenicproduction of methane on Mars. Geophys. Res. Lett. 32, 10203.
Palomba, E., et al., 2009. Evidence for Mg-rich carbonates on Mars from a 3.9 [mu]mabsorption feature. Icarus 203, 58–65.
Perry, K.A., et al., 2010.Mineralogy of LibyaMontes,Mars andApplications of Phyllosiliate-Carbonate-Olivine Mixtures. LPSC XXXXI. LPI, Houston, TX. pp. Abstract #2605.
Pollack, J.B., et al., 1987. The case for a wet, warm climate on early Mars. Icarus 71,203–224.
Pollack, J.B., et al., 1990. Thermal emission spectra of Mars (5.4-10.5um): Evidence forsulfates, carbonates and hydrates. J. Geophys. Res. 95, 14595–14627.
Quinn, R., et al., 2006. The Photochemical Stability of Carbonates on Mars. Astrobiology6, 581–591.
Reyes, D.P., Christensen, P.R., 1994. Evidence for Komatiite-Type Lavas on Mars fromPhobos Ism Data and Other Observations. Geophys. Res. Lett. 21, 887–890.
Romanek, C.S., et al., 1994. Martian Carbonates in Alh 84001 - Textural, Elemental,and Stable Isotopic Compositional Evidence on Their Formation. Meteoritics. 29,523-523.
Sarrazin, P., et al., 2005. Field deployment of a portable X-ray diffraction/X-rayflorescence instrument on Mars analog terrain. Powder Diffr. 20, 128–133.
Savitzky, A., Golay, M.J.E., 1964. Smoothing and differentiation of data by simplifiedleast squares procedures. Anal. Chem. 36, 1627–1639.
Schaefer, M.W., 1990. Geochemical Evolution of the Northern Plains of Mars: EarlyHydrosphere, Carbonate Development, and Present Morphology. J. Geophys. Res.95, 14291–14300.
Schaefer, M.W., 1993. Aqueous geochemistry on early Mars. Geochimica et Cosmo-chemica Acta. 57, 4619–4625.
Treiman, A.H., et al., 2002. Hydrothermal origin for carbonate globules in Martianmeteorite ALH84001: a terrestrial analogue from Spitsbergen (Norway). EarthPlanet. Sci. Lett. 204, 323–332.
Ueno, Y., et al., 2004. Carbon isotopes and petrography of kerogens in 3.5-Gahydrothermal silica dikes in the North Pole area, Western Australia. Geochim.Cosmochim. Acta 68, 573–589.
Van Kranendonk, M.J., et al., 2002. Geology and tectonic evolution of the archean NorthPilbara terrain, Pilbara Craton, Western Australia. Econ. Geol. Bull. Soc. Econ. Geol.97, 695–732.
Van Kranendonk, M.J., et al., 2008. Geological setting of Earth's oldest fossils in the ca.3.5†Ga Dresser Formation, Pilbara Craton, Western Australia. Precambrian Res. 167,93–124.
Wagner, C., Schade, U., 1996. Measurements and calculations for estimating thespectrometric detection limit for carbonates in Martian soil. Icarus 123, 256–268.
Walter, M.R., Des Marais, D.J., 1993. Preservation of Biological Information in Thermal-Spring Deposits - Developing a Strategy for the Search for Fossil Life onMars. Icarus101, 129–143.
Walter, M.R., et al., 1980. Stromatolites 3400-3500 Myr old from the North Pole area,Western Australia. Nature 284, 443–445.
Welhan, J.A., 1988. Origins ofmethane inhydrothermal systems. Chem. Geol. 71, 183–198.Wentworth, S.J., Gooding, J.L., 1991. Carbonate and Sulfate Minerals in the Chassigny
Meteorite. Meteoritics. 26, 408–409.Wentworth, S.J., Gooding, J.L., 1994. Carbonates and Sulfates in the Chassigny Meteorite
- Further Evidence for Aqueous Chemistry on the Snc Parent Planet. Meteoritics. 29,860–863.
White, W.B., 1974. The carbonate minerals. In: Farmer, V.C. (Ed.), The Infra-Red Spectraof Minerals. Mineralogical Society, London, UK, pp. 227–284.
Zahnle, K., et al., 2010. Is there Methane on Mars? , LPSC 41. LPI, Houston, TX. pp. Abs.#2456.