49
Earth Observation for Crop Modelling International trends & developments How to promote earth observation applications? How to get funding? Capacity building
| Date post: | 24-Dec-2015 |
| Category: |
Documents |
| Upload: | derrick-flynn |
| View: | 215 times |
| Download: | 1 times |
Earth Observation for Crop Modelling
International trends & developmentsHow to promote earth observation
applications?How to get funding?
Capacity building
2
Mark Noort, consultant, project manager
HCP international: consulting, marketing of earth observation
Coordinator GEONetCab: project for promotion & capacity building of earth observation applications
0. Introduction

3
Earth observation applications
• On the verge of reaching new user communities
• These new user communities need to be involved
• Weakest link / last mile aspects are important
• Marketing needed: promotion & capacity building
4
Life cycle of products & services
InitializationSystem analysis & designRapid prototypingSystem developmentImplementationPost-implementation

5
Assessment of business & funding opportunities
• Categories of environmental management products & services
• Life cycle phase of product or service• Regional context, level of technological & economic
development• Optimum marketing mix

6
1. International trends & developments in crop modelling

7
Climate change
Climate change becomes more and more important, local adaptation focuses on disaster management and food security
References:
8
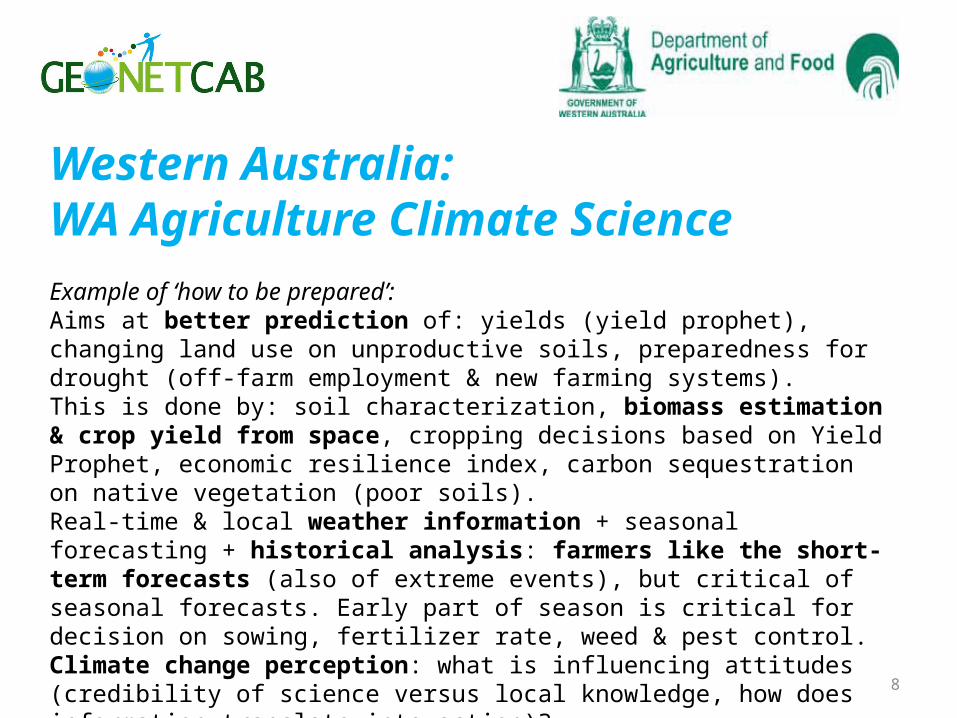
Western Australia:WA Agriculture Climate ScienceExample of ‘how to be prepared’:Aims at better prediction of: yields (yield prophet), changing land use on unproductive soils, preparedness for drought (off-farm employment & new farming systems).This is done by: soil characterization, biomass estimation & crop yield from space, cropping decisions based on Yield Prophet, economic resilience index, carbon sequestration on native vegetation (poor soils).Real-time & local weather information + seasonal forecasting + historical analysis: farmers like the short-term forecasts (also of extreme events), but critical of seasonal forecasts. Early part of season is critical for decision on sowing, fertilizer rate, weed & pest control.Climate change perception: what is influencing attitudes (credibility of science versus local knowledge, how does information translate into action)?
9
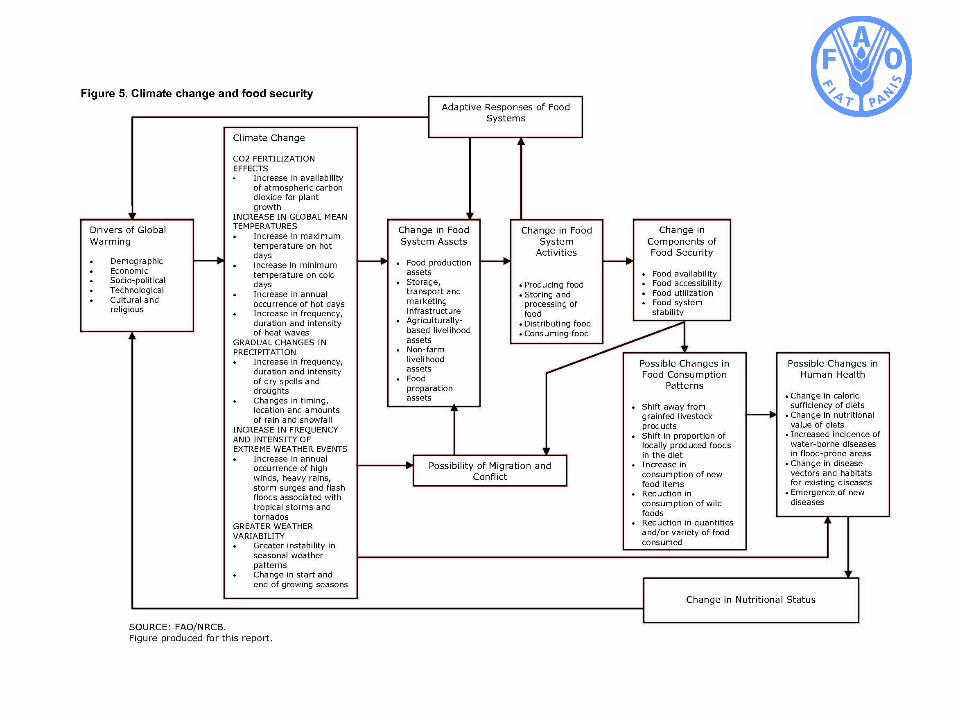
Climate Change and Food Security:A framework document
Description of processes and possible adaptive measures

10
11

12
Effects of climate change difficult to predict, but possible reduction of agricultural production up to 50% by 2020: increase resilience!Increase agricultural production: affordable technology, financial assistance, high-yielding agricultural seeds and fertilizer, small-scale storage facilities, mobile phone fund transfers, microloans + crop insurance, community-based natural resource programs.
Markets, Climate Change, and Food Security
in West Africa (Brown, Hintermann, Higgins)

13
Empowerment of local communitiesCommunity mapping initiatives: Google (H2O) and World Bank
Mapping & visualization in general: importance of knowing what is where
Example: World Bank ‘mapping for results’ @ maps.worldbank.org & aiddata.org (tracking development finance)
Crop modelling: better information provision to improve quantity and quality of production.
References:

14
Bridging the rural digital divide
“e-Agriculture” A Definition and Profile of its Application (FAO, 2005) description of global trends and FAO policy
GIEWS workstation (Global Information and Early Warning System) – FAO description of services offered to 20 countries in Africa, CIS, SE Asia and Central America
Space Technology Enabled Village Resource Centre (VRC)description of societal benefit support to villages: tele-education, tele-healthcare, land and water resources management, tele-fishery, e-governance services and weather services by the Indian Space
Research Organization (ISRO)
15
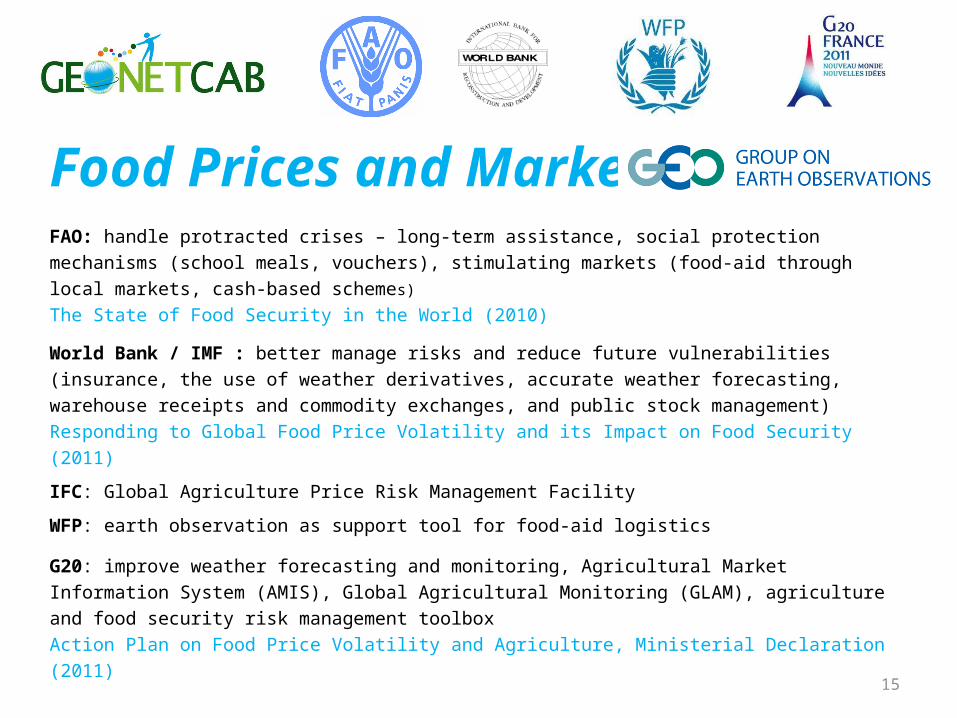
Food Prices and MarketsFAO: handle protracted crises – long-term assistance, social protection mechanisms (school meals, vouchers), stimulating markets (food-aid through local markets, cash-based schemes)
The State of Food Security in the World (2010)
World Bank / IMF : better manage risks and reduce future vulnerabilities (insurance, the use of weather derivatives, accurate weather forecasting, warehouse receipts and commodity exchanges, and public stock management) Responding to Global Food Price Volatility and its Impact on Food Security (2011)
IFC: Global Agriculture Price Risk Management Facility
WFP: earth observation as support tool for food-aid logistics
G20: improve weather forecasting and monitoring, Agricultural Market Information System (AMIS), Global Agricultural Monitoring (GLAM), agriculture and food security risk management toolbox Action Plan on Food Price Volatility and Agriculture, Ministerial Declaration (2011)
16
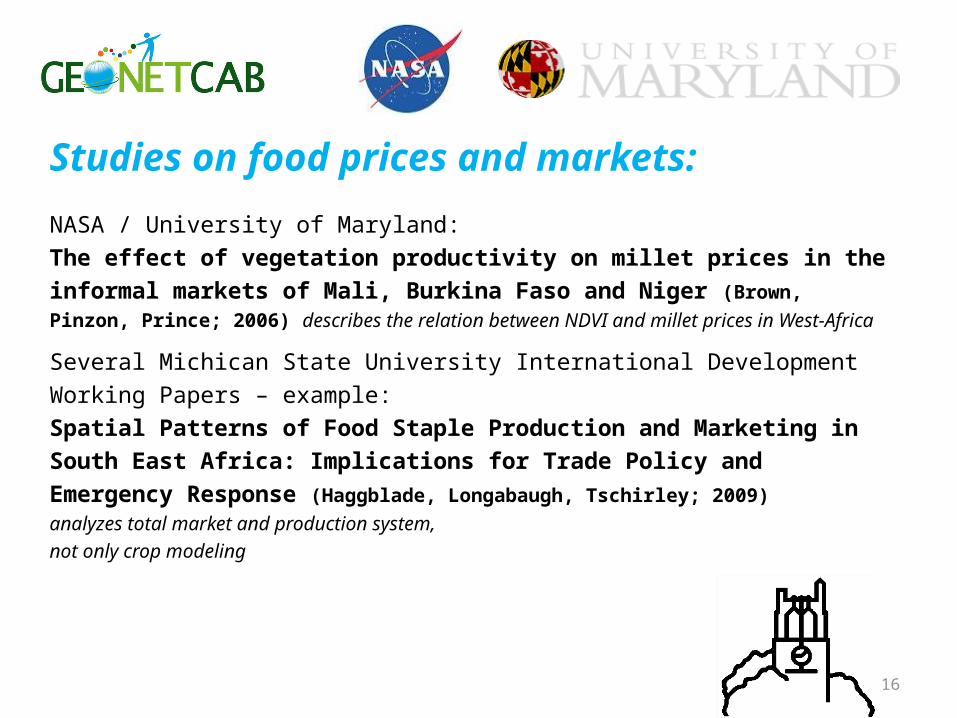
Studies on food prices and markets:
NASA / University of Maryland:The effect of vegetation productivity on millet prices in the informal markets of Mali, Burkina Faso and Niger (Brown, Pinzon, Prince; 2006) describes the relation between NDVI and millet prices in West-Africa
Several Michican State University International Development Working Papers – example:Spatial Patterns of Food Staple Production and Marketing in South East Africa: Implications for Trade Policy and Emergency Response (Haggblade, Longabaugh, Tschirley; 2009) analyzes total market and production system, not only crop modeling
17
Historical AnalysisTime dimension very important as input for decision-making:• Crop Modelling• Climate change monitoring and adaptation• Change detection (depletion of natural resources)• Analyzing the effects of different policies, practices, customs,
across administrative borders
Example:SPOT VGT difference products offered by VITO (every 10 days): Scaled Difference Vegetation Index, Vegetation Condition Index, absolute difference, etc.

18
Improved Prediction
Examples of global systems for prediction of food shortages and timely planning of aid operations:
FEWSNETGIEWS (FAO)GMFSFOOD-SEC (MARS)

19
Other examples:
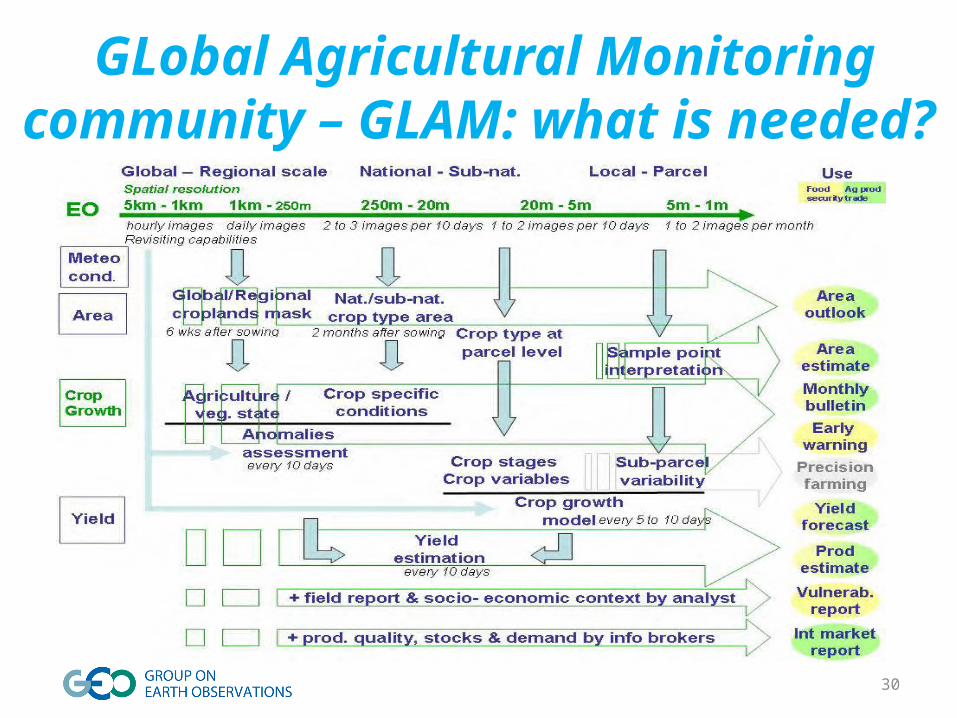
GLAM (global agricultural monitoring project) timely data delivery, continuity of EO missions, enhanced value added products, yield models, crop area estimates and seasonal weather forecasts, interoperability and better integration of datasets
Harvest Choice data harmonization (assembling heterogeneous datasets) + data distribution (new ways of collecting and distributing spatial data)
CanaSat project sugarcane area mapping and harvest monitoring (environmental protection) in Brazil
Improved Prediction

20
InsuranceVery much in focus as part of agricultural risk management strategy (World Bank reports: Managing Agricultural Production Risk & Agricultural Insurance)
Example of use of earth observation: ADASCIS, BelgiumThe use of remote sensing and agrometeorological modelling for crop damage & risk assessment in support of the Belgian Calamity Fund
Business model developed countries: more about income transfers then about risk management – indemnities paid about equal to total premiums collected, but administrative and operation costs not taken into account.

21
InsuranceIndex-based, weather-related agricultural insurance
Based on: rainfall or NDVI – Spain, Canada, Mongolia, Kenya, Mexico (all pasture / rangeland -> for crops apparent low correlation NDVI and yields) or evapotranspiration – Food Early Solutions for Africa (FESA) in experimental stage
Should be:observable and easily measured, objective, transparent, independently verifyable, reportable in a timely manner & stable and sustainable over time
Products best suited for:homogeneous areas, systemic risk at the aggregated level (reinsurance)
Historical analysis (weather, crops) is important
22
InsuranceReferences and case studies:
The Potential for Scale and Sustainability in Weather Index Insurance for Agriculture and Rural Livelihoods (IFAD, WFP)
Insurance as an Adaptation Measure to Climate Variability in Agriculture (CEIGRAM, Spain)
Comprehensive Risk Cover through Remote Sensing Techniques in Agriculture Insurance for Developing Countries: a pilot project (India)
Providing index-based agricultural insurance to smallholders: recent progress and future promise (Univ. of California, Berkeley)
Agricultural Insurance Schemes (JRC, European Union)

23
InsuranceReferences and case studies (continued):
Index Based Livestock Insurance for Northern Kenya’s Arid and Semi-Arid Lands: the Marsabit Pilot (ILRI & partners) + Designing Index Based Livestock Insurance for Managing Asset Risk in Northern Kenya
Index Based Agricultural Insurance in Developing Countries: Feasibility, Scalability and Sustainability (Montana State University)
Science-based insurance (Brown, Osgood, Carriquiry)
Contributions of Agricultural Systems Modeling to Weather Index Insurance (Baethgen et al)
State of Knowledge Report – Data Requirements for the Design of Weather Index Insurance: Innovation in Catastrophic Weather Insurance to Improve the Livelyhood of Rural Households (GlobalAgRisk)
24
InsuranceFarmers perception:Difficulty in understanding index-based concepts, what satellite images can do and concerns about visualizing satellite-based indices + calculating mean vegetation when sowing dates are different
Local companies experience:Calculating NDVI is expensive (one-off for GIS company)
25
Other Risk ManagementComprehensive Food Security and Vulnerability Analysis (CFSVA) Baseline mappingAgricultural monitoring: background information, estimation of area cultivated, yield estimation (all include historical analysis)Disaster assessmentOperational planning
Other example: Locust Habitat Monitoring for GIEWS (see also disaster management toolkit)

26
2. Steps to promote earth observation for crop modelling

27
State-of-the-art
Earth observation is new technology.
Learn technical skills, but when back in professional practice, it has to be put to good use.
That involves ‘selling’ it.
How to do that?To whom? Could be your own boss, local authorities, communities, etc.

28
References• Western Australia: WA Agriculture Climate Science
• FAO: Climate Change and Food Security: a framework document Added value earth observation:Crop modelling is one of the contributors to food security (as part of value chain management),Facilitates implementation of insurance schemes,Helps manage water more efficiently,Supports sustainable land management,Helps maintaining biodiversity,Improves livestock management,Improves fishery management.

29
References (continued)• CanaSat (Brazil) see above
• e-Leaf (eleaf.com) offers integrated agricultural services to farmers in the Netherlands and Europe – pilot phase
• GEO Task US-09-01a: Critical Earth Observations Priorities Agriculture Societal Benefit Area global overview of available observations and what is needed
for more examples: have a look at www.geonetcab.eu
30
GLobal Agricultural Monitoring community – GLAM: what is needed?
31
Marketing of earth observation
Marketing of earth observation is difficult.
New technology, few big companies, lots of small ones.
Lots of reports describing the bottlenecks, like reliability, data access, data continuity, etc. Means that relatively a lot of effort is needed to promote EO.

32
Points to keep in mind:• Look for opportunities, where can you have most success in a short time:
quick-wins.• Target the right audience to start with: who would be interested and
listen to you? For crop modelling: see next slides.
• Identify the problem that they are trying to solve: is it the same as yours?
• Learn to speak the same language. Example: when EO specialists talk about ‘food security’, experts in other fields consider EO activities as crop modelling. Translate to something the client (or your partner) understands.
• Look for examples from elsewhere (success stories): solutions that work and are affordable.

33
What users need to serve clients:
• Accurate and reliable crop production information on specific reporting levels (national, district)
• Spatial distribution of cultivated area• Crop growth models• Timely and unbiased production information on main crops• (Timely) availability of satellite data• Good quality meteorological data• Capacity building to enable correct use and integration of products and
services

34
Figure 2: Advanced multi scale crop information services (GMFS services, CA = Cultivated Area; CEP = Crop Emergence Period; EoC = Extent of Cultivation; DMP = Dry Matter Productivity; VPI= Vegetation Productivity Indicator).
35
Maturity of EO Services
Early warning: fully operational
Cultivated area: further development needed (timely delivery of data, technical complexity)
Extent of cultivation: accuracy needs to be improved for good local results (district, farm)
Crop yield forecasting: fully operational
Index-based insurance: better results for rangeland than for crops, especially for smallholders (NDVI-based, cloud cover a problem)
Precision agriculture: still in pilot phase (cloud cover in critical months of the growing season is a problem)

36
Costs of EO Services for crop modelling / food security supportService Definition of Unit Service Cost (k€) Early Warning Annual coverage of Africa with suite 230 Service of early warning indicators, at 10-day
update frequency
Agricultural Validated map of cultivated area 175 Mapping (10 – 20 m resolution) per 100 000 km2
Crop Yield Yield forecast for 2-3 main crops, 85 Assessment for 100 000 km2
Support to Support to one CFSVA mission 35 CFSVAvery global estimate, includes development for specific user needs and training

37
Be patient: introduction of new technology and / or applications takes time

38
3. How to get funding for your activities

39
Approach• Share information on your subject (a thing you are doing)
and think that is interesting for your contact, then look for the link. Could this solve a problem for your partner? Are adjustments necessary? Need other parties be involved? Take it from there.
• LEADS, LEADS, LEADS

40
How?
• Establish your network.
• Look for opportunities.
• Write a good proposal.
• Promise much, but not too much.

41
Proposal outline(more detailed version in separate document, see also www.geonetcab.eu )
1. Introduction / relevance2. Objective(s)3. Activities4. Output5. Management & evaluation
6. Risk assessment7. Time schedule8. Budget
Annexes
42
Other references
• Civicus: writing a funding proposal
• Michigan State University: guide for writing a funding proposal
• ESRI: writing a competitive GRANT application
• REC: project proposal writing
43
Again:
• SHARED PROBLEM• SHARED LANGUAGE• SHARED SOLUTION
If all else fails, try to link with a more popular (and easy tounderstand) topic.

44
4. Capacity Building
45
General
Marketing is promotion + capacity building.
Especially for the introduction of new technologies capacitybuilding is important at all levels. Capacity building is the instrument to increase self-sufficiency and make solutions work.

46
Think of:• Different instruments for different levels: workshops for decision
makers and awareness raising, detailed technical training for professionals.
• Provide follow-up. Getting funding for good capacity building is difficult: everybody agrees that it is important, but nobody has time.
• Training is usually part of funding of big projects that are managed by big companies or ministries, as a consequence capacity building is forgotten (in the end).
• Aim at small budgets that are available without having to tender.

47
Examples & referencesAGRICAB project (follow-up of DevCoCast and GMFS)optical remote sensing, radar remote sensing, agro-meteorological modelling, food security information systems, product validation
GEONetCab capacity building web www.geonetcab.eucompilation of tutorials, references, open-source software, etc.
GEO Portal: www.earthobservations.org
Focal points: cheaper processing of NDVI calculations, ground truthing, historical analysis (making use of free and open data): integration with other services
48
More referencesA Rough Google Earth Guide
MEASURE Evaluation Global Positioning System Toolkit (USAID)
Handbook of Research on Developments and Trends inWireless Sensor Networks: From Principle to Practice