INTERNATIONAL INSTITUTE FOR GEO-INFORMATION SCIENCE AND EARTH OBSERVATION Earth observation of water cycle and applications in drought monitoring and prediction Z. Bob Su International Institute for Geo-Information Science and Earth Observation (ITC) Enschede, The Netherlands E-Mail: [email protected]http://www.itc.nl
Transcript
INTERNATIONAL INSTITUTE FOR GEO-INFORMATION SCIENCE AND EARTH OBSERVATION
Earth observation of water cycle andapplications in drought monitoring and
prediction
Z. Bob SuInternational Institute for Geo-Information Science
and Earth Observation (ITC)Enschede, The Netherlands
Drought disasters have often caused greathunger, social instability, large scalemigration of the population and extinction ofcivilizations in the history.
The conflict between supply and demand ofwater resources constitutes the biggestproblem for food security of a hugepopulation in China.
Drought has become a key factor constrainingChina’s economic development.
4
Problem statements
Drought is one of the major environmental disastersin various parts of the world
Quantification of drought distribution in space andtime is very difficult
Usually, the severity of droughts can be assessed withmeteorological based indices (e.g., the standardisedprecipitation index), or satellite based indices (e.g.,vegetation indices)
But the former fail to capture short-term variationand the latter is difficult to interpret forheterogeneous terrain
INTERNATIONAL INSTITUTE FOR GEO-INFORMATION SCIENCE AND EARTH OBSERVATION
The Dragon Drought Project teamEuropean Partners:European Partners:
(1) (1) Z. Bob Su (PI), Tom Rientjes, Rogier van Z. Bob Su (PI), Tom Rientjes, Rogier van derder Velde, Marcel van Velde, Marcel van HelvoirtHelvoirt, , WenjingWenjingLin,Lin, ITC, The NetherlandsITC, The Netherlands
(2) (2) Massimo Massimo MenentiMenenti, , CNR CNR –– ISAFoMISAFoM, , ItalyItaly(3) (3) Jose Sobrino,Jose Sobrino, UniversitatUniversitat de Valencia, Spain de Valencia, Spain(4) (4) Zhao-Liang Li,Zhao-Liang Li, GRTR/LSIIT, GRTR/LSIIT, ULPULP, France, France(5) (5) WoutWout VerhoefVerhoef,, National Aerospace Laboratory, The NetherlandsNational Aerospace Laboratory, The Netherlands(6) (6) Peter Peter TrochTroch, , Wageningen University/University of Arizona, Wageningen University/University of Arizona, The NetherlandsThe Netherlands(7) (7) KeesKees van van DiepenDiepen, , Alterra, Alterra, The NetherlandsThe Netherlands(8) (8) Michael Petrakis, & C. Michael Petrakis, & C. GainnakopoulosGainnakopoulos,, National Observatory of Athens, Greece National Observatory of Athens, Greece
Chinese Partners:Chinese Partners:(1)(1) YouqiYouqi Chen (PI), Chen (PI), LiminLimin Wang, Wang, Chinese Academy of Agricultural Sciences, BeijingChinese Academy of Agricultural Sciences, Beijing(2) (2) Jiren Li,Jiren Li, IWHR, Beijing IWHR, Beijing(3) (3) Yaoming Ma,Yaoming Ma, Institute of Tibetan Plateau ResearchInstitute of Tibetan Plateau Research, CAS, , CAS, LashaLasha/Beijing/Beijing(4) (4) Li Wan, Li Wan, China University of China University of GeoscienceGeoscience, Beijing, Beijing(5) (5) Yanbo He, Yanbo He, National Meteorological National Meteorological CenterCenter, Beijing, Beijing(6) (6) QinhuoQinhuo Liu, Liu, Institute of Remote Sensing Applications, CAS, Beijing Institute of Remote Sensing Applications, CAS, Beijing(7) (7) CaixingCaixing Li, Li, Academy of Academy of OptoOpto-Electronics, CAS, Beijing, China-Electronics, CAS, Beijing, China(8) (8) Jun Jun WenWen,, Cold and Arid Regions Environmental and Engineering Research Institute,Cold and Arid Regions Environmental and Engineering Research Institute,
CAS, LanzhouCAS, Lanzhou
6
Project Objectives
To develop an operational system fornationwide drought monitoring anddrought impact assessment forapplication in agriculture and waterresources management in China
7
Wet Condition: Maximum TranspirationTranspiration limited by plant wateravailability in the root zone
What is Drought ?What is Drought ?
Dry Condition: No transpiration
8
Approaches for Drought Monitoring and Prediction
Approach 1: Surface Energy Balance To derive relative evaporation & relative soil moisture in the
root zone from land surface energy balance To define a quantitative drought severity index (DSI) for
large scale drought monitoring
Approach 2: Soil Moisture Retrieval To determine surface soil moisture To assimilate surface SM into a hydrological model to derive
root zone soil moisture
To validate the methodologies on the basis of largescale field experiments
9
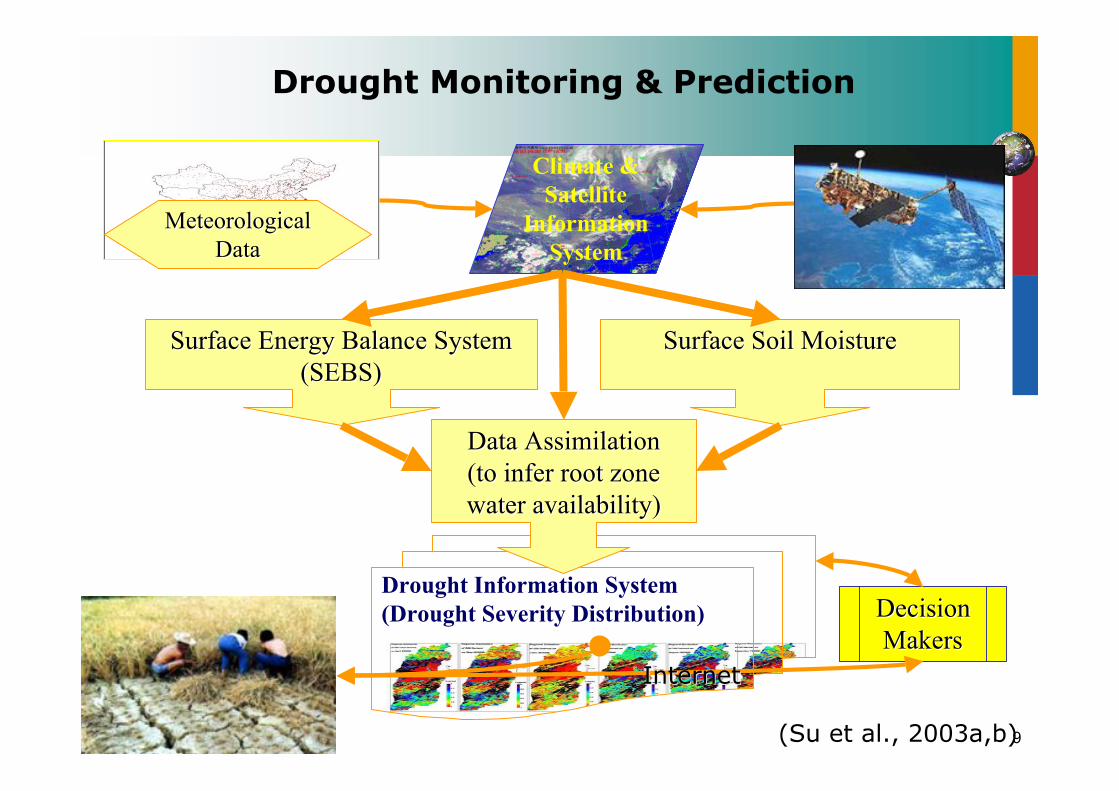
Climate &Satellite
InformationSystem
Drought Monitoring & Prediction
DecisionDecisionMakersMakers
MeteorologicalMeteorologicalDataData
Surface Energy Balance SystemSurface Energy Balance System(SEBS)(SEBS)
Drought Information System(Drought Severity Distribution)
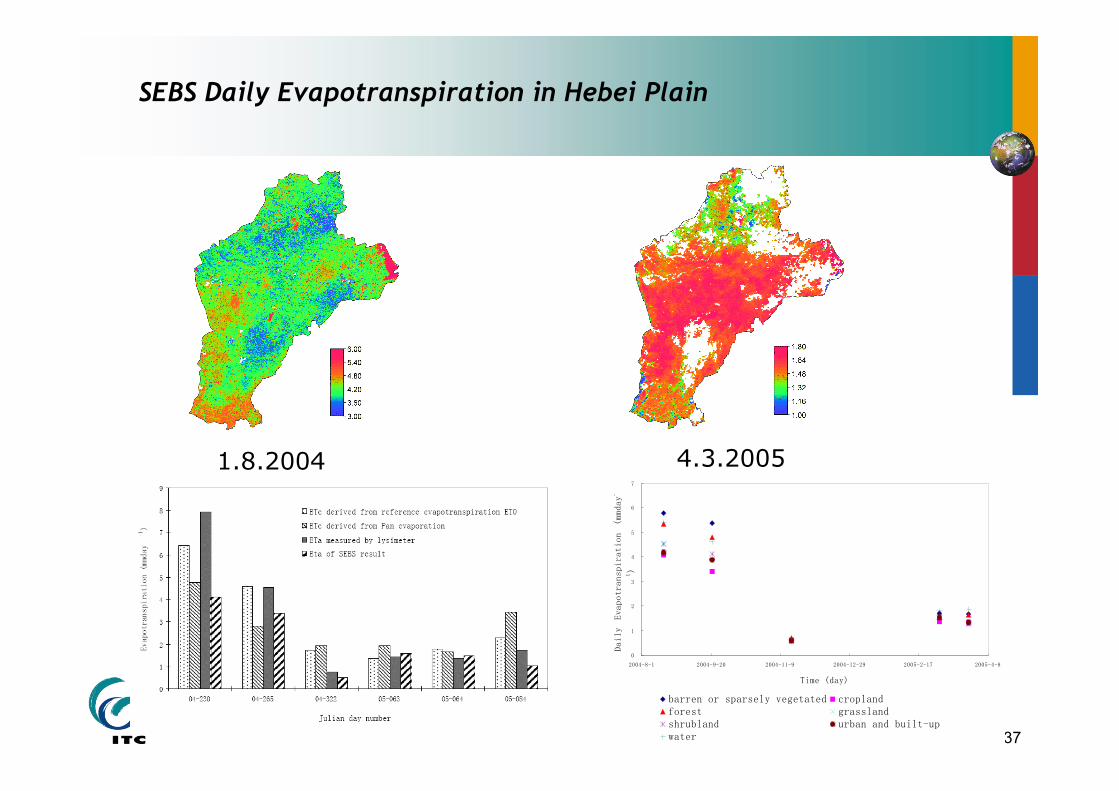
Z. Su, 2002, The Surface Energy Balance System (SEBS) for estimation of turbulent heat fluxes,Hydrology and Earth System Sciences, 6(1), 85-99.
12
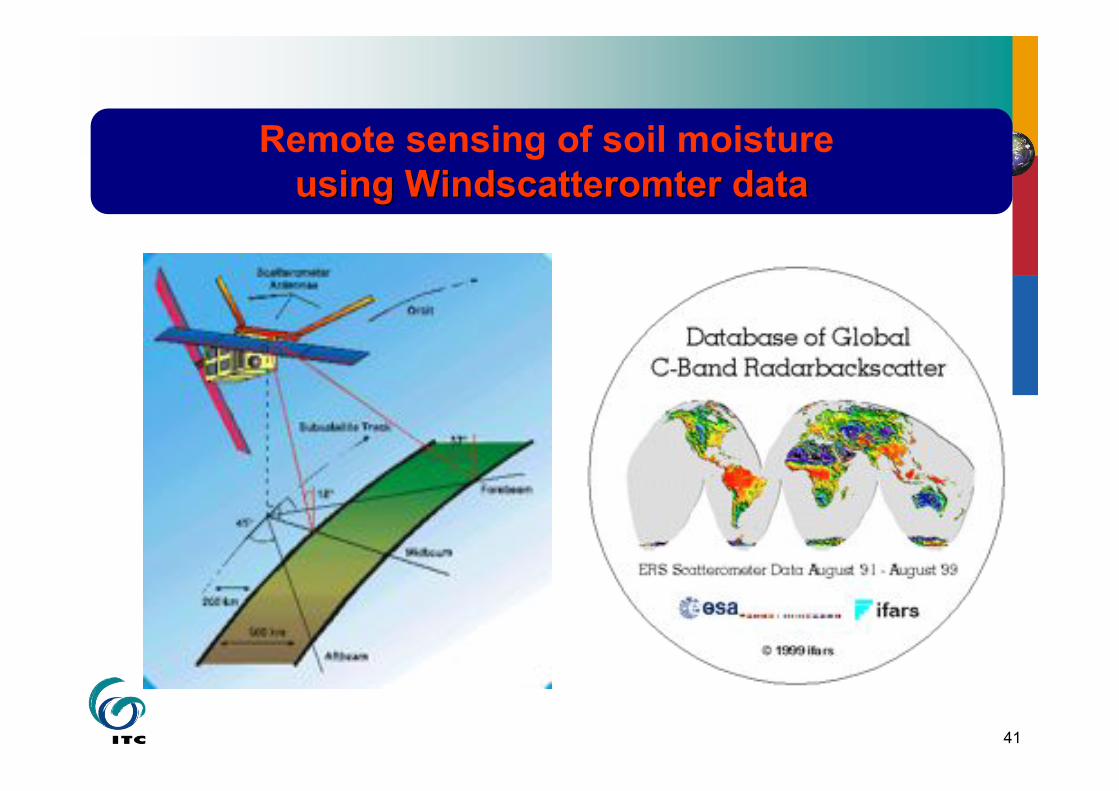
Approach 2: Microwave remote sensing of soil moisture
13
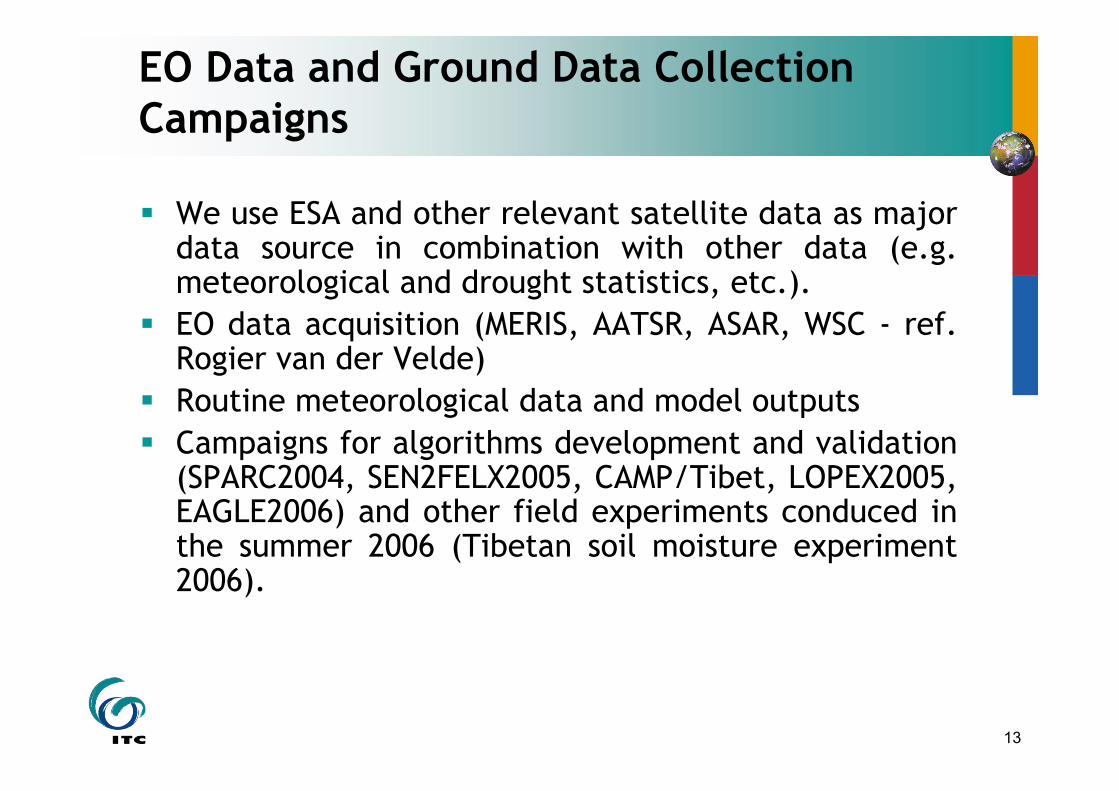
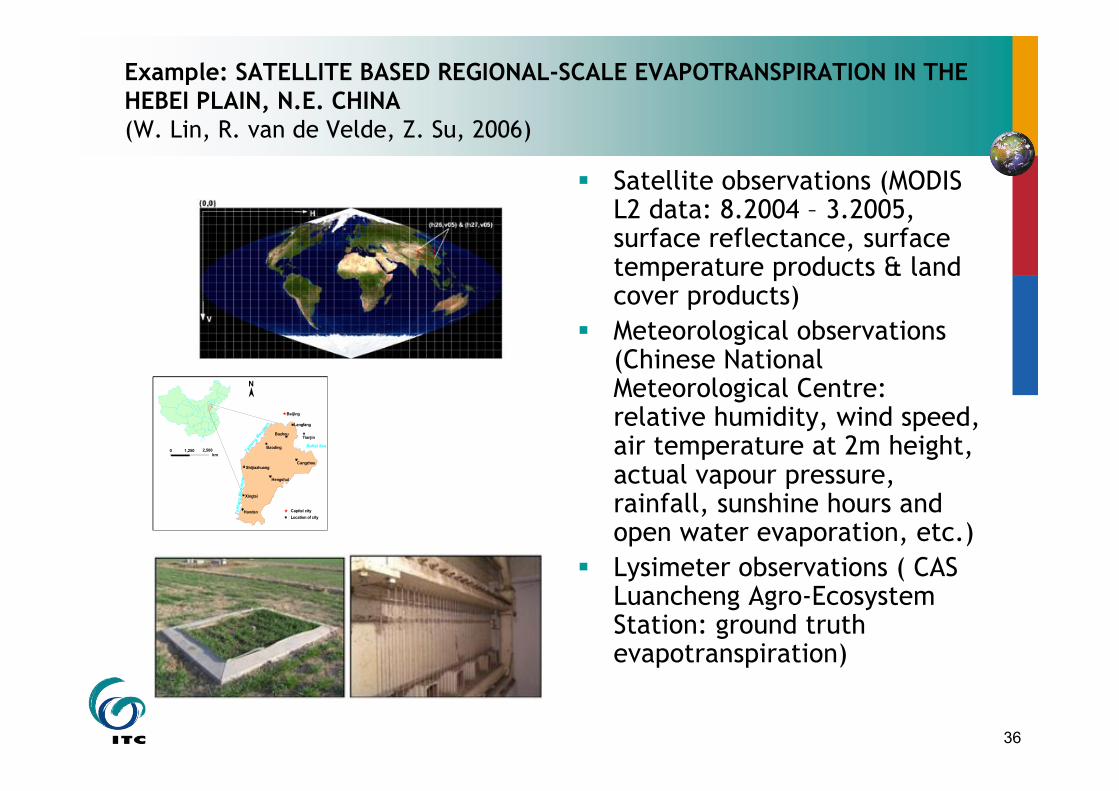
EO Data and Ground Data CollectionCampaigns
We use ESA and other relevant satellite data as majordata source in combination with other data (e.g.meteorological and drought statistics, etc.).
EO data acquisition (MERIS, AATSR, ASAR, WSC - ref.Rogier van der Velde)
Routine meteorological data and model outputs Campaigns for algorithms development and validation
(SPARC2004, SEN2FELX2005, CAMP/Tibet, LOPEX2005,EAGLE2006) and other field experiments conduced inthe summer 2006 (Tibetan soil moisture experiment2006).
14
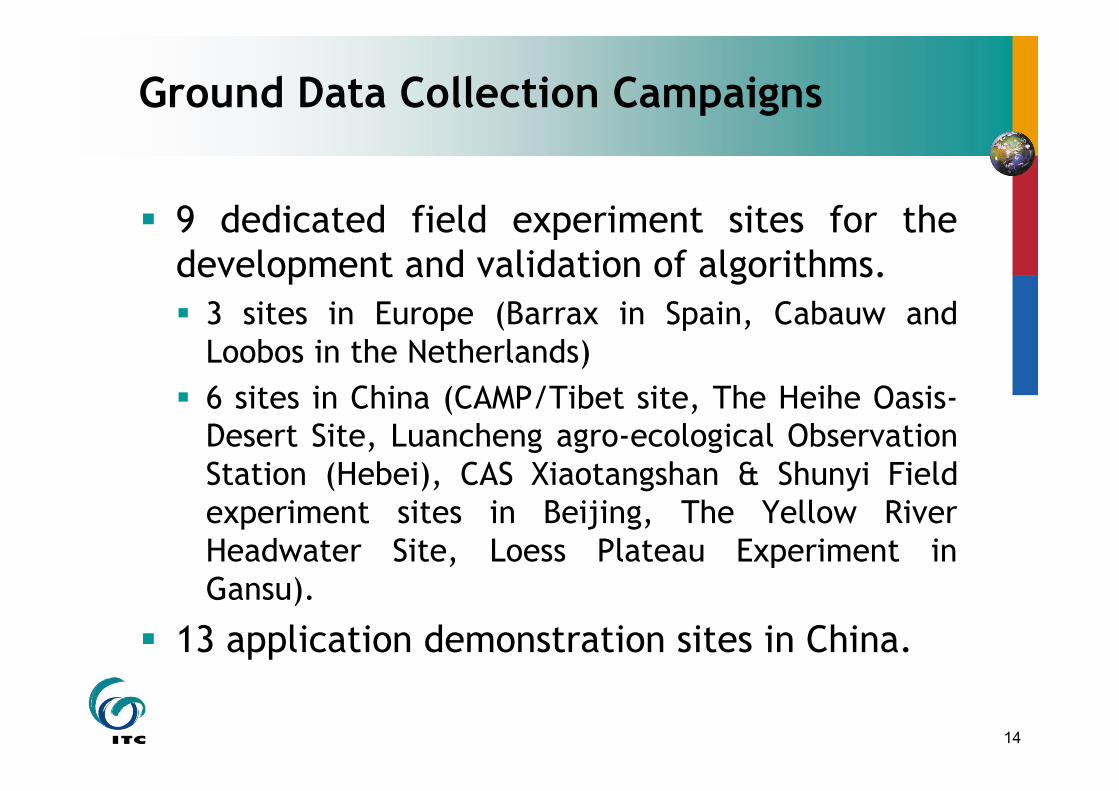
Ground Data Collection Campaigns
9 dedicated field experiment sites for thedevelopment and validation of algorithms. 3 sites in Europe (Barrax in Spain, Cabauw and
Loobos in the Netherlands) 6 sites in China (CAMP/Tibet site, The Heihe Oasis-
Desert Site, Luancheng agro-ecological ObservationStation (Hebei), CAS Xiaotangshan & Shunyi Fieldexperiment sites in Beijing, The Yellow RiverHeadwater Site, Loess Plateau Experiment inGansu).
13 application demonstration sites in China.
15
• Basic Water Cycle and Earth Observation Process Studies• Calibration/Validation of Earth Observation Data and Instrument• PhD & MSc Education
ITC Earth Observation Research and Education Sites
16
Sensible Heat fluxes derived withSEBS and AHS data, 15 July 2004(A. Gieske)
Sensible Heat Fluxwith SEBS and ASTER data,18 July 2004
WM^-2
Field campaigns – validation of retrieval algorithms
17
EAGLE2006EAGLE2006(8 June (8 June –– 2 July 2006) 2 July 2006)
EAGLE Netherlands Multi-purpose, Multi-Angle and Multi-sensor,EAGLE Netherlands Multi-purpose, Multi-Angle and Multi-sensor,In-situ, Airborne and Space Borne Campaigns over Grassland and ForestIn-situ, Airborne and Space Borne Campaigns over Grassland and Forest
ESA, ItalyESA, ItalyITC, The NetherlandsITC, The Netherlands
University of Valencia, SpainUniversity of Valencia, SpainINTA, SpainINTA, Spain
WUR / ALTERRA, The NetherlandsWUR / ALTERRA, The NetherlandsLSIIT, FranceLSIIT, France
NLR, The NetherlandsNLR, The NetherlandsKNMI, The NetherlandsKNMI, The Netherlands
WUR / Meteorology Group, The NetherlandsWUR / Meteorology Group, The NetherlandsRIVM, The NetherlandsRIVM, The Netherlands
WH Stichtse Rijnlanden, The NetherlandsWH Stichtse Rijnlanden, The NetherlandsMIRAMAP, The NetherlandsMIRAMAP, The Netherlands
University of Washington, USAUniversity of Washington, USAUniversity of South Carolina, USAUniversity of South Carolina, USA
ISAFoMISAFoM, Italy, ItalyUtrecht University, The NetherlandsUtrecht University, The NetherlandsStaatsbosbeheerStaatsbosbeheer, The Netherlands, The Netherlands
FugroFugro, The Netherlands, The Netherlands
GAME/Tibet (1997-2001)CAMP-Tibet (2001-2005)
CEOP (2001-2010)
HEIHE
Yucheng
LOPEXXiaotangshan
Yellow River HW
19
?Ô¶¯ÆøÏóÕ?
GEWEX Asian Monsoon Experiment (GAME) inGEWEX Asian Monsoon Experiment (GAME) inthe Tibet Plateau (GAME-Tibet,1996-2000)the Tibet Plateau (GAME-Tibet,1996-2000)
20
IOP of GAME/Tibet.(1998.5-1998.9)
Data free (CD-Rom,website)
21
CEOP (Coordinated Enhanced Observing Period) Asia-CEOP (Coordinated Enhanced Observing Period) Asia-Australia Monsoon Project in the Tibetan PlateauAustralia Monsoon Project in the Tibetan Plateau(CAMP/Tibet, 2001-2010)(CAMP/Tibet, 2001-2010)
22
23
SMEX02 and SMEX03were conducted in thesummer of 2002 and 2003 inIowa and Oklahoma states,United States of America(Organised by Dr. T.Jackson).
LOPEX05 - LOess plateau land-atmosphereinteraction Pilot EXperiment, 2005, Pingliang,Gansu, China (To be organised by Prof. JunWen)
24
Map of monitoring stations for soil moisture
25
Scheme to estimate ideal soil water deficit and drought severityon the basis of meteorological data only
PotentialEvaporation
at each weatherstations
Potential Soil Water Deficit forIdeal Soils
(Ideal soil: Large scale regionalrepresentative natural bare soil,
under non-irrigation, non-vegetationconditions)
(Runoff generation: Actualprecipitation less potentialevaporation and soil water
are the contribution of bare soil and the soil beneath the canopy layer, respectively,
0
vegetation!
is the
contribution of vegetation volume,
0
soilveg "!
is the contribution
from land surface -vegetation interaction, FC is the fractional vegetation coverage, T is the transmissivity.
48
Temporal Fresnel reflectivity and roughness at two GAME/Tibet sites(Wen, Su, 2003a, Phy. Che. Earth)
0
0.02
0.04
0.06
0.08
0.1
0.12
January-9
2
July-9
2
January-9
3
July-9
3
January-9
4
July-9
4
January-9
5
July-9
5
January-9
6
July-9
6
January-9
7
July-9
7
January-9
8
July-9
8
January-9
9
July-9
9
January-0
0
Fres
nel R
efle
ctiv
ity
0
20
40
60
80
100
120
140
160
Pre
cipi
tatio
n (m
m)
Precipitation Ando_R2 Naqu_R2
0.00
0.15
0.30
0.45
0.60
January-91
July-91
January-92
July-92
January-93
July-93
January-94
July-94
January-95
July-95
January-96
July-96
January-97
July-97
January-98
July-98
January-99
July-99
January-00
Sur
face
slo
pe
Ando_s Naqu_s
49
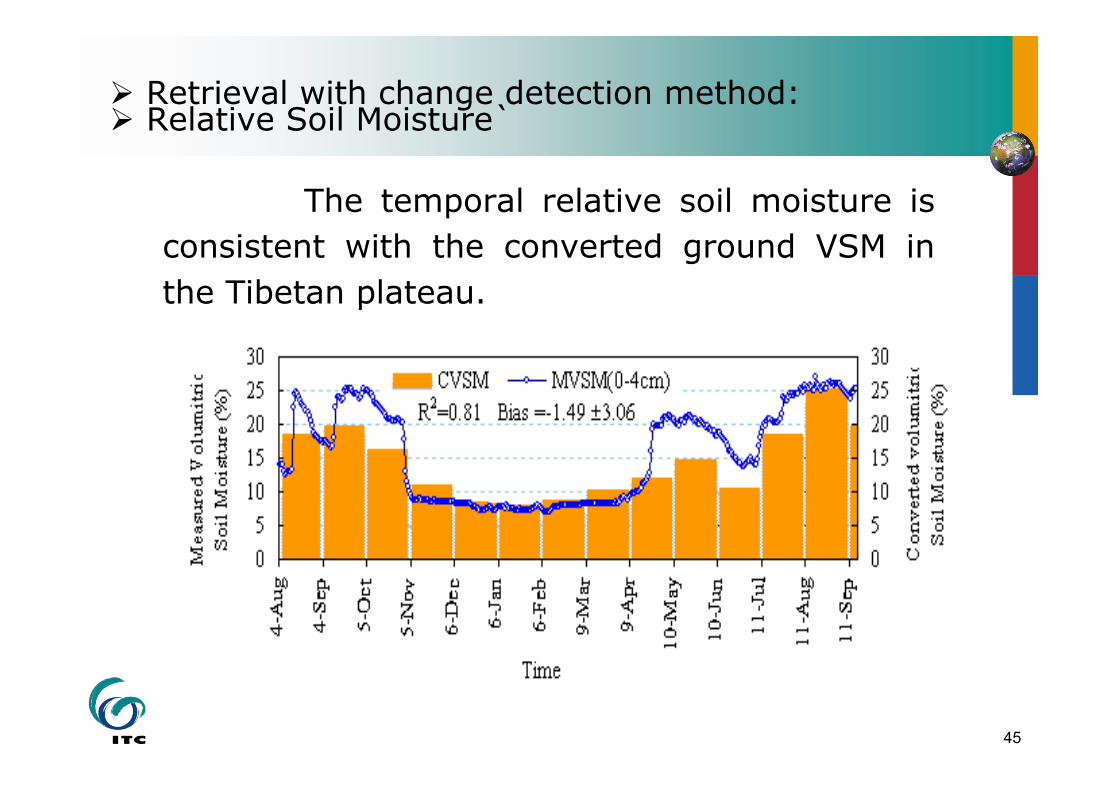
Estimated Fresnel reflectivity and groundmeasured volume soil water content
0
10
20
30
40
50
Aug
ust-97
Sep
tem
ber-
97O
ctob
er-9
7N
ovem
ber-
97D
ecem
ber-
97Ja
nuar
y-98
Janu
ary-
98M
arch
-98
Apr
il-98
May
-98
May
-98
June
-98
July
-98
Aug
ust-98
Vo
lum
e w
ate
r c
on
ten
t(%
)
0
0.01
0.02
0.03
0.04
0.05
0.06
0.07
0.08
0.09
Fre
sn
el
refl
ec
tiv
ityFresnel reflectivity SM(0-2cm) SM(0-4cm)
50
Vsm and VcfEstimates(instantaneous)
Regional distribution of Vcf, Vsm and validation
51
Regional Fresnel reflectivity and roughness over Tibet
52
Regional Soil Moisture Distribution over China
53
From local scale process understandingto regional applications
54
55
Tibetan Soil Moisture Experiment 2006 at location of CAMP/Tibet sites(in collaboration with Prof. Yaoming Ma, ITP/CAS)
GEWEX Asian Monsoon Experiment (GAME) in the Tibet Plateau (GAME/Tibet,1996-2000)GEWEX Asian Monsoon Experiment (GAME) in the Tibet Plateau (GAME/Tibet,1996-2000)
CEOP (Coordinated Enhanced Observing Period) Asia-Australia Monsoon Project in the Tibetan Plateau (CAMP/Tibet, 2001-2005)CEOP (Coordinated Enhanced Observing Period) Asia-Australia Monsoon Project in the Tibetan Plateau (CAMP/Tibet, 2001-2005)
Coordinators: Y.M.Ma & T.D.Yao, K.Ueno & T.Koike
56
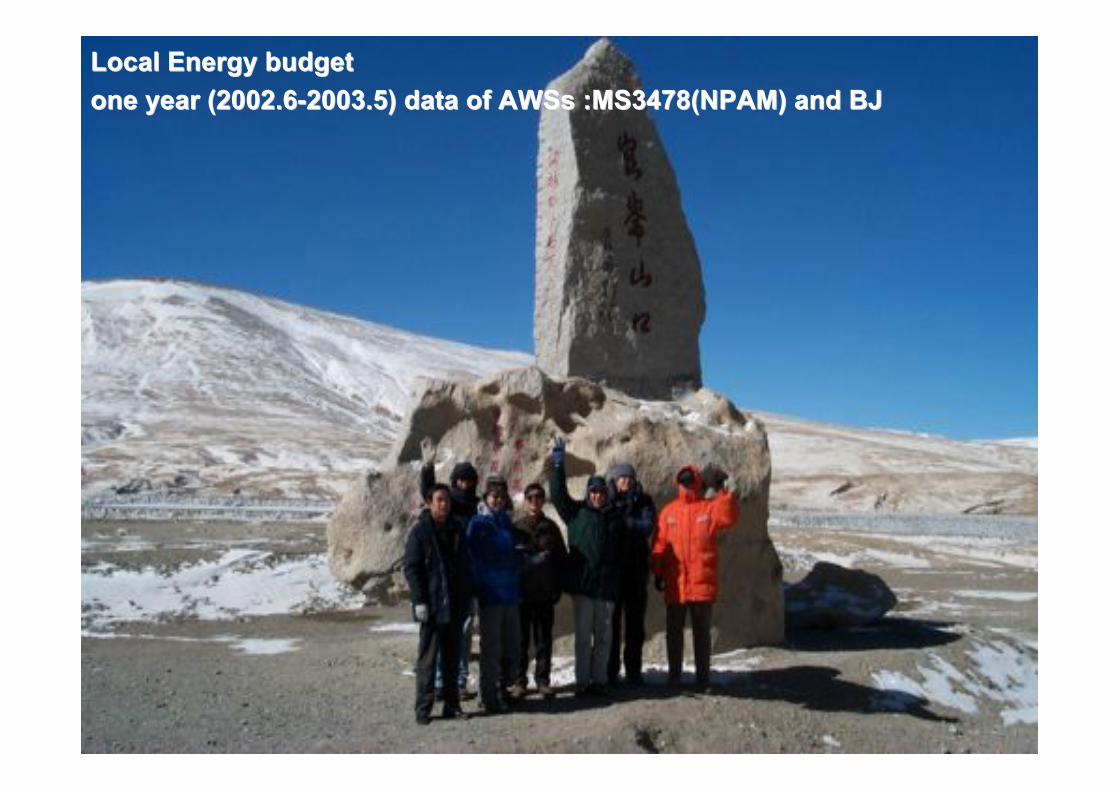
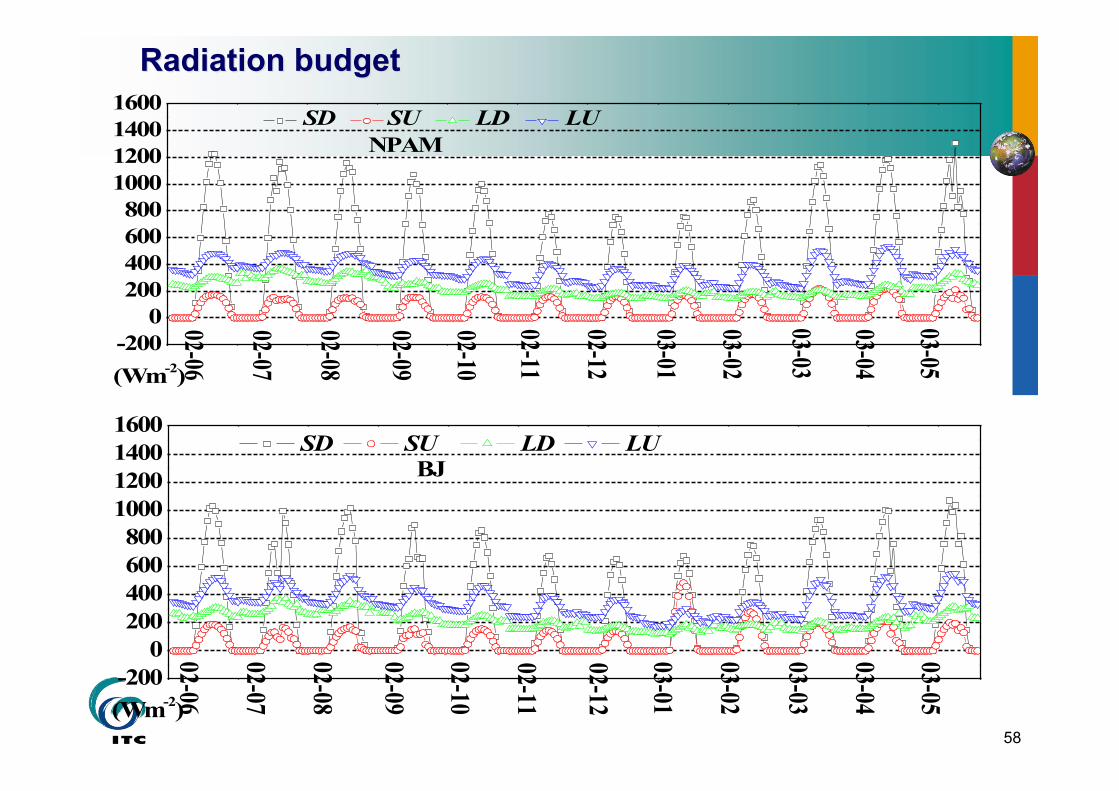
Local Energy budgetLocal Energy budgetone year (2002.6-2003.5) data of one year (2002.6-2003.5) data of AWSsAWSs :MS3478(NPAM) and BJ :MS3478(NPAM) and BJ
57
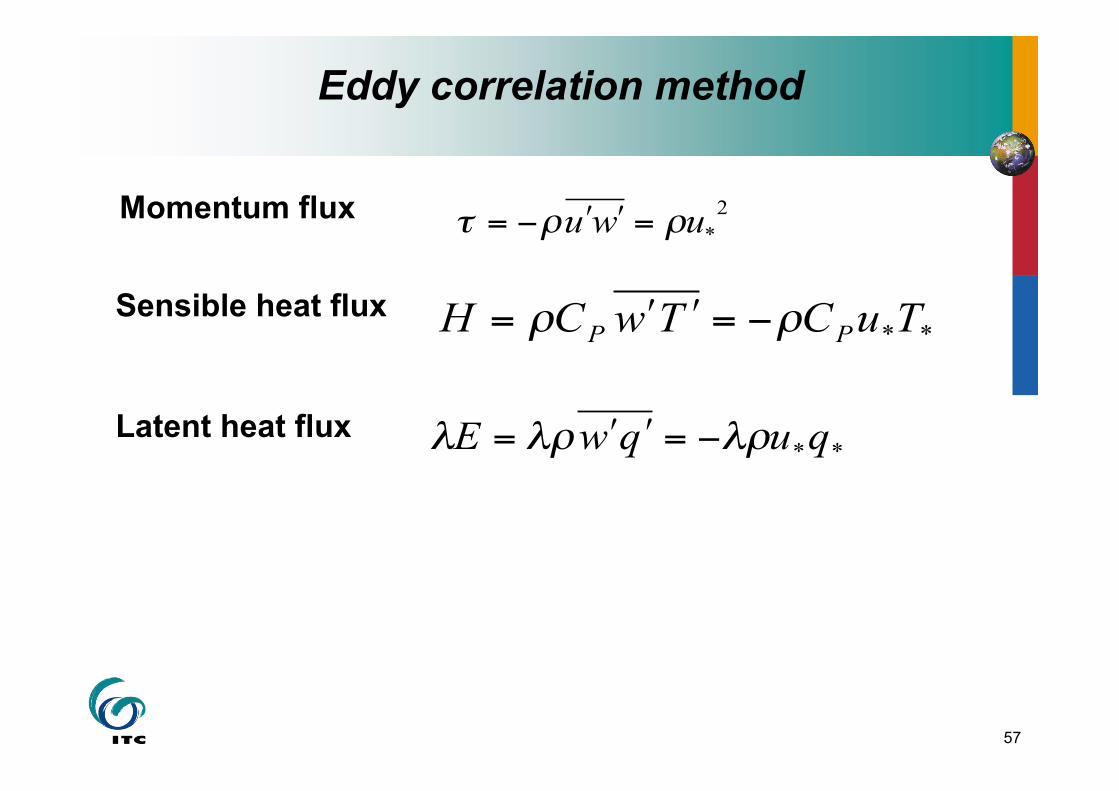
Eddy correlation method
Momentum flux 2
*uwu !!" =##$=
Latent heat flux
**TuCTwCH
PP!! "=##=
**quqwE !"!"! #=$$=
Sensible heat flux
58
-200
0
200
400
600
800
1000
1200
1400
1600
03-05
03-04
03-03
03-02
03-01
02-12
02-11
02-10
02-09
02-08
02-07
SD SU LD LU
BJ
(Wm-2)
02-06
Radiation budgetRadiation budget
-200
0
200
400
600
800
1000
1200
1400
1600
03-05
03-04
03-03
03-02
03-01
02-12
02-11
02-10
02-09
02-08
02-07
SD SU LD LU
NPAM
(Wm-2)
02-06
59
Land surface heat fluxesLand surface heat fluxes
-400
-200
0
200
400
600
800
1000
1200 E! R
n H G
0
03-05
03-04
03-03
03-02
03-01
02-12
02-11
02-10
02-09
02-08
02-07
(Wm-2)
NPAM
02-06
-400
-200
0
200
400
600
800
1000
1200 E! R
n H G
0
03-05
03-04
03-03
03-02
03-01
02-12
02-11
02-10
02-09
02-08
02-07
BJ
(Wm-2)
02-06
60
NDVINDVI
June 12 June 12(Pre-Monsoon)(Pre-Monsoon)
MSAVIMSAVI
July 16 July 16 (Monsoon) (Monsoon)
August 21 August 21 (Post-Monsoon) (Post-Monsoon)
VegetationVegetationcoveragecoverage
61
JuneJune JulyJuly AugustAugust
LAILAI
SurfaceSurfacereflectancereflectance
SurfaceSurfacetemperaturetemperature
62
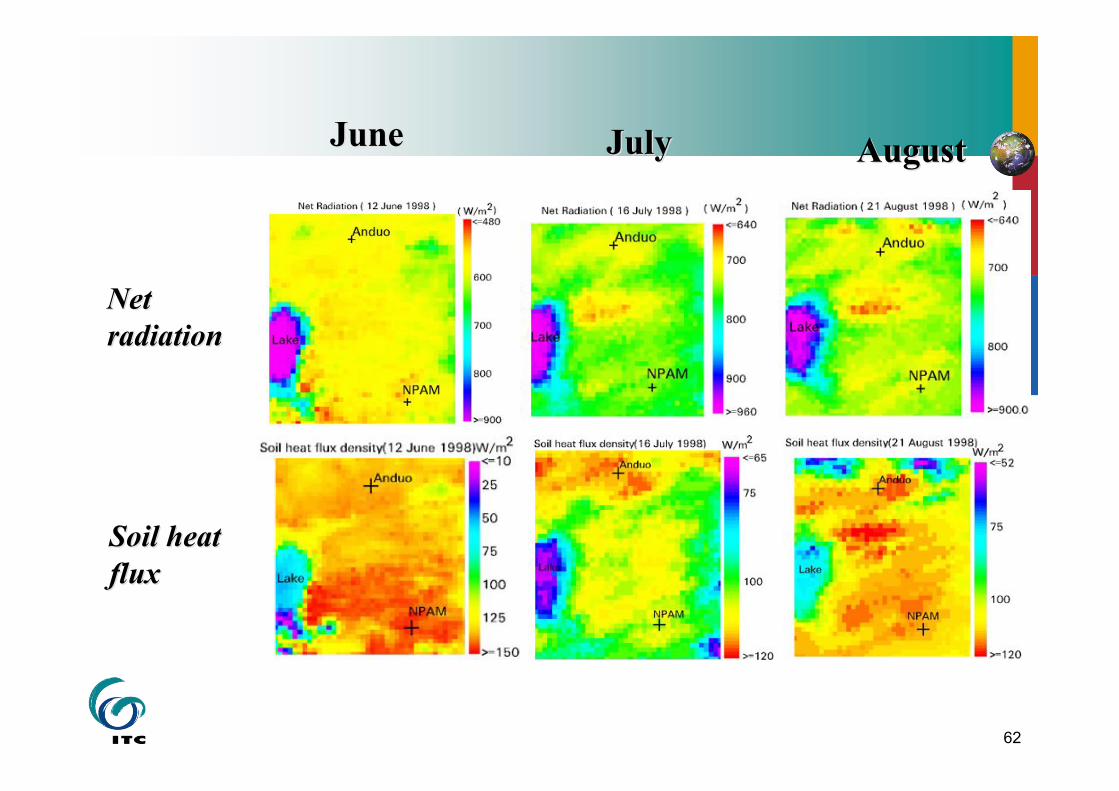
NetNetradiationradiation
Soil heatSoil heatfluxflux
JuneJune JulyJuly AugustAugust
63
JuneJune JulyJuly AugustAugust
SensibleSensibleheat fluxheat flux
LatentLatentheat fluxheat flux
64
0.14 0.16 0.18 0.20 0.22 0.240.14
0.16
0.18
0.20
0.22
0.24
0.14 0.16 0.18 0.20 0.22 0.240.14
0.16
0.18
0.20
0.22
0.24
0.14 0.16 0.18 0.20 0.22 0.240.14
0.16
0.18
0.20
0.22
0.24
0.14 0.16 0.18 0.20 0.22 0.240.14
0.16
0.18
0.20
0.22
0.24
Anduo
August
July
June
r0-d
eri
ve
d
r0-measured
Naqu
August
July
June
NPAMr0-
de
rive
d
r0-measured
24 28 32 36 40 44 4824
28
32
36
40
44
48
June
Anduo
Tsfc
-de
rive
d (
0
C)
Tsfc-measured
( 0C)
June
August
July
NPAM
AWS110
AWS3608
Naqu
500 550 600 650 700 750 800500
550
600
650
700
750
800
Anduo
Rn-measured
( W/m2 )
Rn-d
eri
ve
d (
W/m2
)
August
July
June
NPAM
100 110 120 130 140 150 160100
110
120
130
140
150
160
August
July
June
Anduo
G0-measured
( W/m2 )
G0-d
eri
ve
d (
W/m2
) NPAM
100 150 200 250 300100
150
200
250
300
August
July
June
Anduo
Hmeasured
( W/m2 )
Hde
rive
d (
W/m2
) NPAM
0 100 200 300 400 500 6000
100
200
300
400
500
600
August
July
June
NPAM
!Ed
eri
ve
d (
W/m2
)
Anduo
!Emeasured
( W/m2)
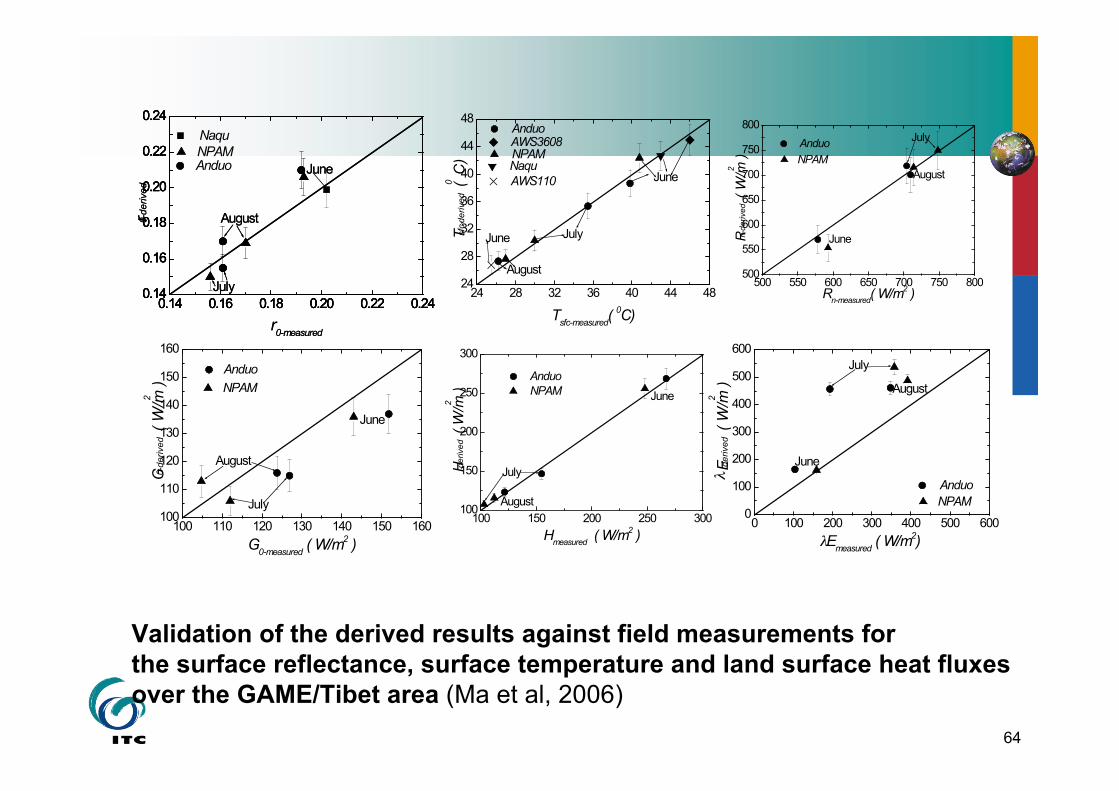
Validation of the derived results against field measurements forthe surface reflectance, surface temperature and land surface heat fluxesover the GAME/Tibet area (Ma et al, 2006)
65
The Tibetan Plateau observed by the MERIS (left), AATSR (middle),and ASAR Wide Swath (right)
66
Preliminary validation results using MERIS/AATSR/ASAR(Next step: Data Assimilation - EKF)
67
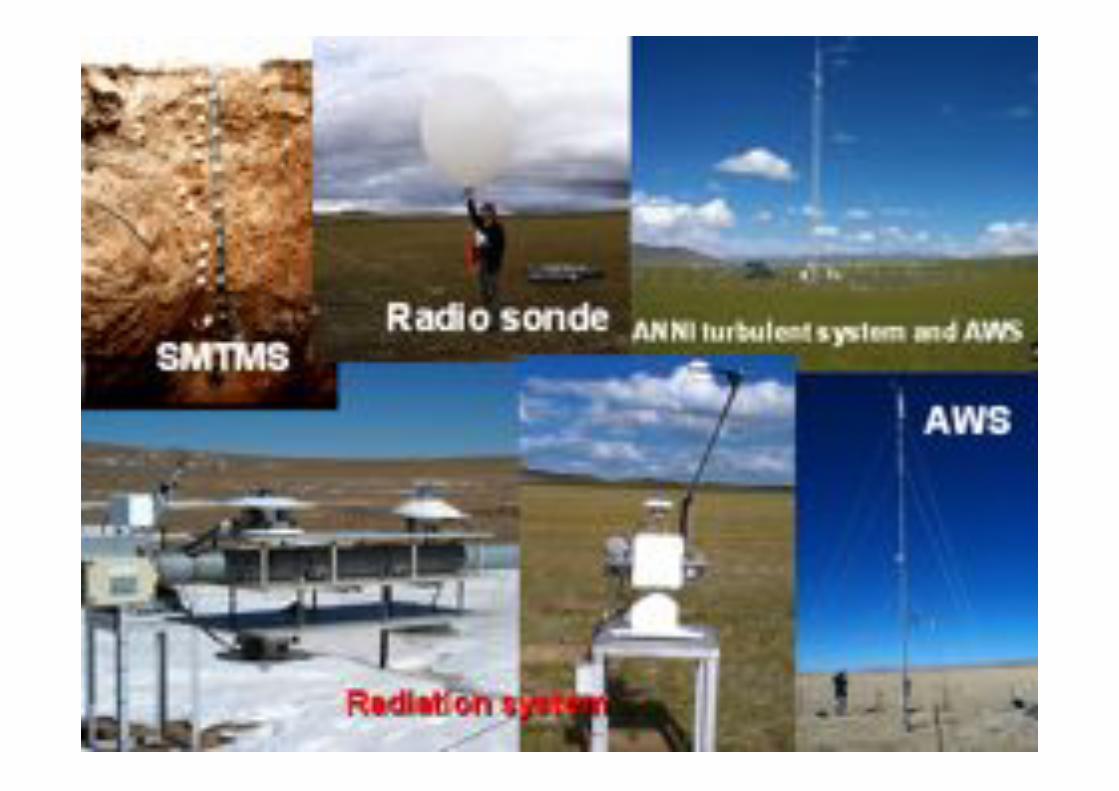
40m PBL tower ( radiation system and SMTMS)
Wind Profiler and RASSWind Profiler and RASS
August 2005
68
6500m6500m5200m5200m
4475m4475m
6500m6500m
Radiosonde system
5200m5200m
69
Fig. 2
Fig. 3
70
,CO2
52m PBL tower ( Radiation system and SMTMS)
Turbulent system, CO2/H2O flux and radiation system
Nam Cuo Station
71
Heat fluxes from new sites
0 2 4 6 8 10 12 14 16 18 20 22 24-200
0
200
400
600
800
LE
G0
H
Rn8 October 2005
Heat
flux
( W
m
-2 )
Beijing Standand Time
0 2 4 6 8 10 12 14 16 18 20 22 24
-200
0
200
400
600
800
6 October 2005
LE
H
G0
Rn
Heat
flux (
W m
-2 )
Beijing Standard Time
Mt. Everest
Nam Cuo
72
••LinzhiLinzhi Station Station ( Cooperation with JICA) ( Cooperation with JICA)
temperature) and temperature) and oneone SMTMS SMTMS.
2.2. OneOne Sonic turbulence measurement Sonic turbulence measurement systems and systems and one one CO2/H2O fluxes CO2/H2O fluxes measurement systemsmeasurement systems
73
74
Conclusions – Part 1
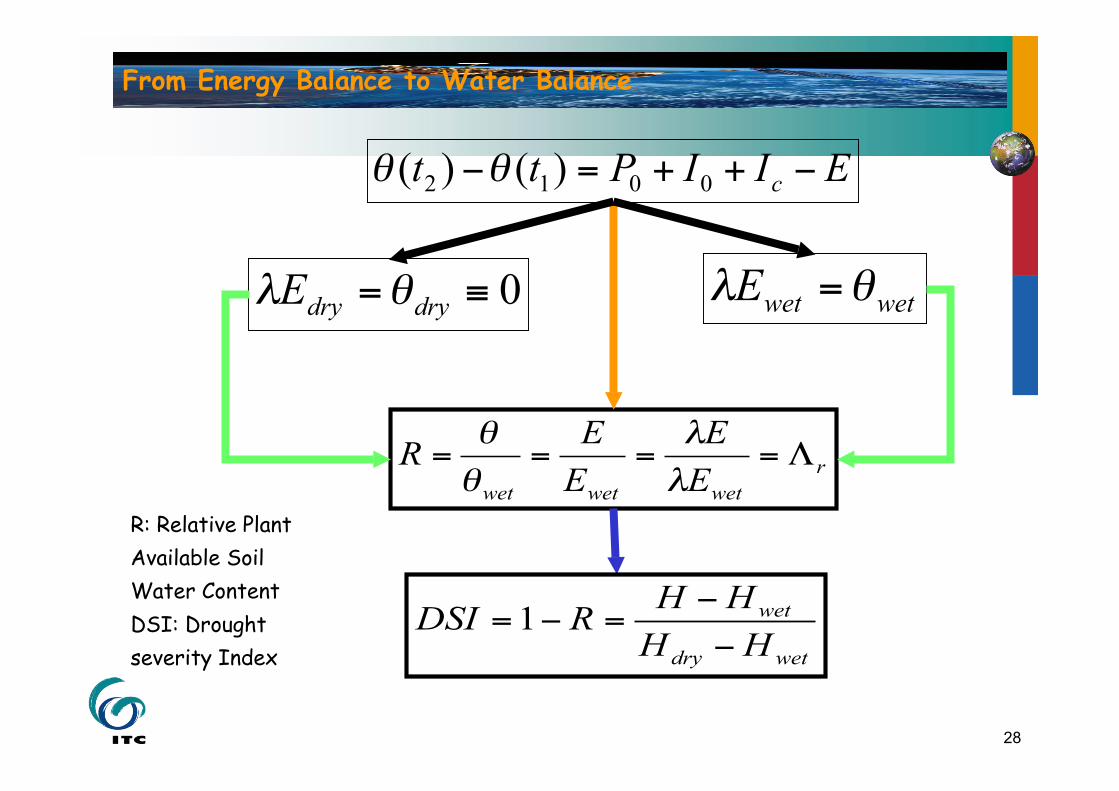
Based on physical consideration of land surface energy balance, atheory for quantitative drought monitoring with remote sensing datais proposed.
The relationship derived between the relative soil moisture andrelative evaporation is confirmed with experimental data collected inintensive field experiments.
Further it is shown that the proposed theory can be used to define aquantitative drought severity index (DSI) for drought monitoring,when the relative evaporation can be determined with remote sensingdata.
Comparisons between the proposed Drought Severity Index (DSI),the operational products based on water balance calculations and theactual measurements of soil moisture confirm the validity androbustness of the proposed theory.
Future work is needed to extend the proposed methodology toroutine monitoring and prediction of droughts.
75
Conclusions – Part 2
A physically based model for the determination of soil moisture androot mean square slope of surface is developed. With theapplication of windscaterometer database, the spatial/temporaldistribution of surface soil moisture can be derived.
The root zone soil moisture can be derived by assimilation of thesurface soil moisture into a hydro-meteorological model (Ongoingwork).
Many important applications are possible (floods and droughts,water – climate feedbacks)!
ASAR preliminary results are encouraging but need furtherdevelopment.
Future sensors (e.g. SMOS) provide exciting opportunities for earthobservation of water cycle components and applications (e.g.drought monitoring and prediction).
76
Referances
Z. Su, 2002, The Surface Energy Balance System (SEBS) for estimation of turbulent heat fluxes,Hydrology and Earth System Sciences, 6(1), 85-99.
J. Wen, Z. Su, 2003, Estimation of soil moisture from ESA Wind-scatterometer data, Physics andChemistry of the Earth, 28(1-3), 53-61.
Z. Su, Y. Yang, J. Zhang, G. Lu, G.J. Roerink, J. Qi, J. Liu, L. Wang, J. Wen, L. Jia, W. Zen, Z.Yue, X. Chen, 2003, A technique for large scale drought monitoring. Alterra-report 683, ISSN1566-7197, 87pp.
J. Wen, Z. Su, 2004, An analytical algorithm for the determination of vegetation Leaf Area Indexfrom TRMM/TMI data, International Journal of Remote Sensing, 25(6), 1223–1234.
J. Wen, Z. Su, 2003, A Method for Estimating Relative Soil Moisture with ESA Wind ScatterometerData, Geophysical Research Letters, 30 (7), 1397, doi:10.1029/ 2002GL016557.
J. Wen, Z. Su, Y. Ma, 2003, Determination of Land Surface Temperature and Soil Moisture fromTRMM/TMI Remote Sensing Data, Journal of Geophysical Research, 108(D2),10.1029/2002JD002176.
Z. Su, A. Yacob, Y. He, H. Boogaard, J. Wen, B. Gao, G. Roerink, and K. van Diepen, 2003,Assessing Relative soil moisture with remote sensing data: theory and experimental validation,Physics and Chemistry of the Earth, 28(1-3), 89-101.
L. Jia, Z. Su, B. van den Hurk, M. Menenti, A. Moene, H.A.R. De Bruin, J.J.B.Yrisarry, M. Ibanez,A. Cuesta, 2003, Estimation of sensible heat flux using the Surface Energy Balance System (SEBS)and ATSR measurements, Physics and Chemistry of the Earth, 28(1-3), 75-88.
Su, Z., 2005, Estimation of the surface energy balance. In: Encyclopedia of hydrological sciences: 5 Volumes. / ed. by M.G. Anderson and J.J. McDonnell. Chichester etc., Wiley & Sons, 2005.3145 p. ISBN: 0-471-49103-9. Vol. 2 pp. 731-752.
Y. Ma, L. Zhong, Z. Su, H. Ishikawa, M. Menenti, T. Koike, 2006, Determination of regionaldistributions and seasonal variations of land surface heat fluxes from Landsat-7 EnhancedThematic Mapper data over the central Tibetan Plateau area J. Geophys. Res., Vol. 111, No.D10, D10305