Page 1
EARTH SCIENCE
Weather, Atmosphere, & Climate Regents Questions Name: _______________________________________________________________ Period:_______
January 2015
11 Which map best represents the surface wind pattern around Northern Hemisphere high-pressure
and low-pressure centers?
12 What is the dewpoint when the dry-bulb temperature is 12°C and the wet-bulb temperature is 7°C?
(1) 1°C (2) -5°C (3) 28°C (4) 48°C
13 The station model below shows some weather conditions at a location on Earth’s surface.
Which present weather symbol represents the most likely type of precipitation occurring at this location?
14 In which atmospheric temperature zone does most precipitation occur?
(1) thermosphere (2) mesosphere (3) stratosphere (4) troposphere
Page 2
17 The map of North America below shows the source region of an air mass forming mostly over Mexico.
21 Which group of substances is arranged in order of decreasing specific heat values?
(1) iron, granite, basalt (2) copper, lead, iron (3) dry air, water vapor, ice (4) liquid water, ice, water vapor
23 The photograph below shows Mt. Kilimanjaro, a volcano in Africa, located near the equator.
Which climate factor is responsible for the snow seen on Mt. Kilimanjaro?
(1) high latitude (3) nearness to a cold ocean current
(2) high elevation (4) nearness to a high-pressure weather center
This air mass originating over Mexico is
classified as
(1) continental polar
(2) continental tropical
(3) maritime polar
(4) maritime tropical
Page 3
30 Which weather instrument is used to determine wind direction?
33 Which cross section best represents how surface winds form by midafternoon near a shoreline on a hot
summer day? [Diagrams are not drawn to scale.]
34 The cross section below represents a prevailing wind flow that causes different climates on the
windward and leeward sides of a mountain range.
Page 4
Compared to the temperature and moisture of the air rising on the windward side, the temperature and
moisture of the air descending at the same altitude on the leeward side will be
(1) warmer and drier (3) cooler and drier
(2) warmer and more moist (4) cooler and more moist
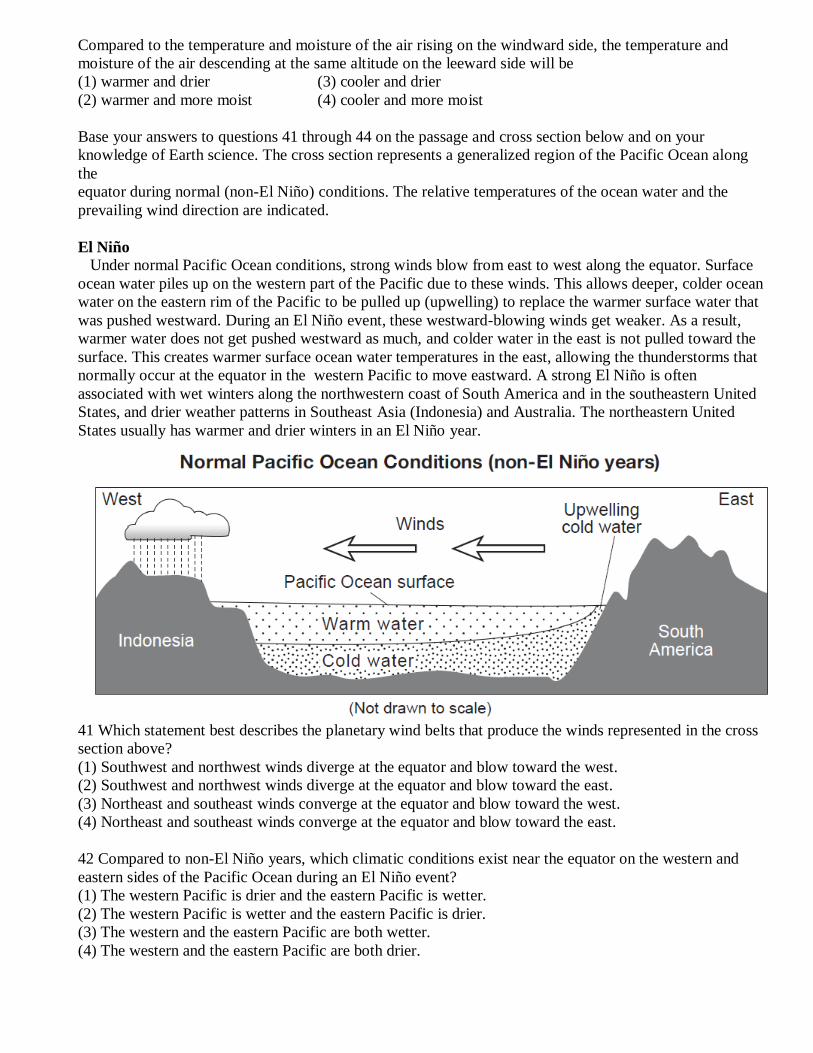
Base your answers to questions 41 through 44 on the passage and cross section below and on your
knowledge of Earth science. The cross section represents a generalized region of the Pacific Ocean along
the
equator during normal (non-El Niño) conditions. The relative temperatures of the ocean water and the
prevailing wind direction are indicated.
El Niño
Under normal Pacific Ocean conditions, strong winds blow from east to west along the equator. Surface
ocean water piles up on the western part of the Pacific due to these winds. This allows deeper, colder ocean
water on the eastern rim of the Pacific to be pulled up (upwelling) to replace the warmer surface water that
was pushed westward. During an El Niño event, these westward-blowing winds get weaker. As a result,
warmer water does not get pushed westward as much, and colder water in the east is not pulled toward the
surface. This creates warmer surface ocean water temperatures in the east, allowing the thunderstorms that
normally occur at the equator in the western Pacific to move eastward. A strong El Niño is often
associated with wet winters along the northwestern coast of South America and in the southeastern United
States, and drier weather patterns in Southeast Asia (Indonesia) and Australia. The northeastern United
States usually has warmer and drier winters in an El Niño year.
41 Which statement best describes the planetary wind belts that produce the winds represented in the cross
section above?
(1) Southwest and northwest winds diverge at the equator and blow toward the west.
(2) Southwest and northwest winds diverge at the equator and blow toward the east.
(3) Northeast and southeast winds converge at the equator and blow toward the west.
(4) Northeast and southeast winds converge at the equator and blow toward the east.
42 Compared to non-El Niño years, which climatic conditions exist near the equator on the western and
eastern sides of the Pacific Ocean during an El Niño event?
(1) The western Pacific is drier and the eastern Pacific is wetter.
(2) The western Pacific is wetter and the eastern Pacific is drier.
(3) The western and the eastern Pacific are both wetter.
(4) The western and the eastern Pacific are both drier.
Page 5
43 Which cross section best represents the changed wind conditions and Pacific Ocean temperatures during
an El Niño event? [Diagrams are not drawn to scale.]
44 During an El Niño year, winter climatic conditions in New York State will most likely be
(1) colder and wetter (2) colder and drier (3) warmer and wetter (4) warmer and drier
Base your answers to questions 59 through 61 on the block diagram below, which represents a house in
New York State with a well that supplies water for people. A truck is spreading salt near a gasoline station
to melt the snow on the road. Two soil zones are labeled on the diagram.
59 Place an X on the block diagram above to indicate the location of the water table. [1]
Page 6
60 Identify one process that occurred in rising, moist air that caused the clouds to form at this location. [1]
61 Explain why, in winter, most of the meltwater produced by salting the road will not infiltrate the soil.
[1]
Base your answers to questions 83 through 85 on the table below, on the map in your answer booklet, and
on your knowledge of Earth science. The table lists the latitude, longitude, and barometric pressure, in
millibars (mb), of the center of a low-pressure system (L) as it moved across North America from March
14 to March 17. The map in your answer booklet shows the center of this low-pressure system (L) and
associated fronts on March 14. The location of the low-pressure system 24 hours later on March 15 is also
indicated.
83 On the map below, use the latitudes and longitudes listed in the data table to plot the
March 16 and March 17 locations of the center of the low-pressure system (L) by placing an X at each
location. [1]
Page 7
84 Calculate the average speed, in kilometers per hour, at which this low-pressure center (L) traveled
during
the 24 hours between March 14 and March 15. [1]
85 On the station model below, using the proper format, record the barometric pressure of
the low-pressure center (L) on March 16. [1]
August 2014
8 During which phase change does water release the most heat energy?
(1) freezing (2) melting (3) condensation(4) vaporization
9 What is the average air pressure exerted by Earth’s atmosphere at sea level, expressed in millibars and
inches of mercury?
(1) 1013.25 mb and 29.92 in of Hg(3) 1012.65 mb and 29.91 in of Hg
(2) 29.92 mb and 1013.25 in of Hg (4) 29.91 mb and 1012.65 in of Hg
Page 8
10 Which two processes lead to cloud formation in rising air?
(1) compressing and cooling(3) expanding and cooling
(2) compressing and warming (4) expanding and warming
11 The weather station model below shows some of the weather data for a certain location.
What is the wind speed shown on the station model and which instrument is used to measure the wind
speed?
(1) 15 knots, measured by a wind vane (3) 25 knots, measured by a wind vane
(2) 15 knots, measured by an anemometer (4) 25 knots, measured by an anemometer
12 If air has a dry-bulb temperature of 2°C and a wet-bulb temperature of –2°C, what is the relative
humidity?
(1) 11% (2) 20% (3) 36% (4) 67%
13 Which current has a cooling effect on the climate of the west coast of South America?
(1) Falkland Current (2) Peru Current (3) Benguela Current (4) Brazil Current
14 Near which two latitudes are most of Earth’s dry climate regions found?
(1) 0° and 60° N (2) 0° and 30° S (3) 30° N and 60° N (4) 30° N and 30° S
31 Which station model shows an air temperature of 75°F and a barometric pressure of 996.3 mb?
32 The map below shows air pressures recorded in millibars (mb).
Page 9
Which map shows the correct location of the 996-mb, 1000-mb, and 1004-mb isobars?
33 The map below shows the amount of snowfall, in inches, produced by a lake-effect snowstorm in
central New York State.
The wind that produced this snowfall pattern most likely came from the
(1) northeast (2) northwest (3) southeast (4) southwest
Base your answers to questions 38 through 40 on the weather map below and on your knowledge of Earth
science. The map of a portion of eastern North America shows a high-pressure center (H) and a low-pressure
center (L), frontal boundaries, and present weather conditions.
Page 10
38 Which weather condition is shown along the cold front?
(1) fog (2) snow (3) haze (4) thunderstorms
39 What was the most likely source region for the air mass over Pennsylvania?
(1) New York State (2) Pacific Ocean (3) Gulf of Mexico (4) Canada
40 The general surface wind circulation associated with the high-pressure center (H) is most likely
(1) clockwise and outward (3) counterclockwise and outward
(2) clockwise and inward (4) counterclockwise and inward
Base your answers to questions 69 through 71 on the data table below and on your knowledge of Earth
science. The table shows air temperatures recorded under identical conditions at 2-hour intervals on a sunny
day. Data were recorded 1 meter above ground level both inside and outside of a glass greenhouse.
Page 11
69 Describe the color and texture of the surfaces inside the greenhouse that would most likely absorb
thegreatest amount of visible light. [1]
70 Calculate the rate of change in the outside air temperature from 8 a.m. to 2 p.m. in Celsius degrees per
hour. [1]
71 Most atmospheric scientists infer that global warming is occurring due to an increase in greenhouse gases.
State the names of two greenhouse gases. [1]
June 2014
12 A psychrometer is used to determine which weather variables?
(1) wind speed and wind direction (3) air pressure and air temperature
(2) percentage of cloud cover and cloud height (4) relative humidity and dewpoint
14 Equal areas of which surface will absorb the most insolation?
(1) partially melted snowfield (2) blacktop parking lot (3) white sand beach (4) lake surface
15 A city located on the coast of North America has warmer winters and cooler summers than a city
at the same elevation and latitude located near the center of North America. Which statement best explains
the difference between the cities’ climates?
(1) Ocean surfaces change temperature more slowly than land surfaces.
(2) Warm, moist air rises when it meets cool, dry air.
(3) Wind speeds are usually greater over land surfaces than over ocean surfaces.
(4) Ocean surfaces have a lower specific heat than land surfaces.
16 Dry areas caused by sinking air and diverging surface winds are located at which two latitudes?
(1) 0° and 30° N (2) 0° and 60° S (3) 30° N and 30° S (4) 60° N and 60° S
17 Which event is inferred by most scientists to be responsible for a climate change that has recently
led to a decrease in the size of most glaciers?
(1) a decrease in the rate of divergence of lithospheric plates along a mid-ocean ridge
(2) a decrease in the amount of insolation reaching Earth’s surface
(3) an increase in the amount of greenhouse gases in Earth’s atmosphere
(4) an increase in the amount of vegetative cover in the tropics
Base your answers to questions 41 through 44 on the reading passage about lake-effect snow and the radar
image map below, and on your knowledge of Earth science. The radar map shows areas where snowfall
was occurring. The whitest area indicates where snowfall was heaviest.
Lake-Effect Snow
In late fall, cold air originating in Canada and then moving over the Great Lakes
often produces lake-effect snow in New York State.
When the cold air mass moves across large areas of warmer lake water, water vapor
enters the cold air. When this moist air moves over the cooler land, the moisture comes
out of the atmosphere as snow. The effect is enhanced when the air that flows off the
lake is forced over higher land elevations. The areas affected by lake-effect snow can
receive many inches of snow per hour. As the lakes gradually freeze, the ability to
produce lake-effect snow decreases.
Page 12
41 What is the most likely two-letter air mass symbol for an air mass from Canada that produces lake-
effect snow in New York State?
(1) mT (2) mP (3) cT (4) cP
42 Which map shows the most likely direction that winds were moving across Lake Ontario to produce this
lake-effect snow?
43 Which list indicates the correct sequence in the formation of a lake-effect snow cloud?
(1) air contracts as it sinks → air warms to the dewpoint → water evaporates
(2) air expands as it rises → air warms to the dewpoint → water vapor condenses
(3) air contracts as it sinks → air cools to the dewpoint → water evaporates
(4) air expands as it rises → air cools to the dewpoint → water vapor condenses
Page 13
44 Which statement best explains why lake-effect snow decreases when lakes freeze gradually?
(1) The ice prevents liquid water from evaporating into the atmosphere.
(2) The lower temperature of ice makes liquid water condense at a slower rate.
(3) More water is available to evaporate.
(4) Ice speeds up the air moving above it, so less water can evaporate.
Base your responses to questions 57 through 60 on the station models below and on your knowledge of
Earth science. The changing weather conditions at a location in New York State during a winter storm are
recorded on the station models.
57 Complete the table below by recording the weather data shown on the station model for
12 noon Thursday. [1]
58 State the relative humidity at this location at 8 p.m. Thursday. [1]
59 From 12 noon Thursday until 8 p.m. Thursday, the total amount of snowfall was 12 inches. Calculate the
snowfall rate, in inches per hour. [1]
60 As this storm approached, the National Weather Service issued a winter storm warning. Identify two items
that should be included in emergency preparedness supplies for a winter storm. [1]
Base your responses to questions 61 through 64 on the diagram below and on your knowledge of Earth science.
The diagram represents portions of the water cycle. Letters A, B, and C represent processes in the water cycle.
Arrows show the movement of water.
Page 14
61 Identify one process represented by A. [1]
62 Identify the process represented by B. [1]
63 Describe the general relationship between the amount of rainfall and the amount of runoff represented
by C. [1]
64 What is the main source of energy for the water cycle? [1]
January 2014
4 Which motion causes the Coriolis effect on Earth?
(1) revolution of Earth around the Sun (3) rotation of Earth on its axis
(2) revolution of the Moon around Earth (4) rotation of the Moon on its axis
5 When water vapor condenses, how much heat energy will be released into the atmosphere?
(1) 2260 joules/gram (2) 334 joules/gram (3) 4.18 joules/gram (4) 2.11 joules/gram
6 Liquid water sometimes turns into ice when it comes in contact with Earth’s surface. Which
present weather symbol on a station model represents this type of precipitation?
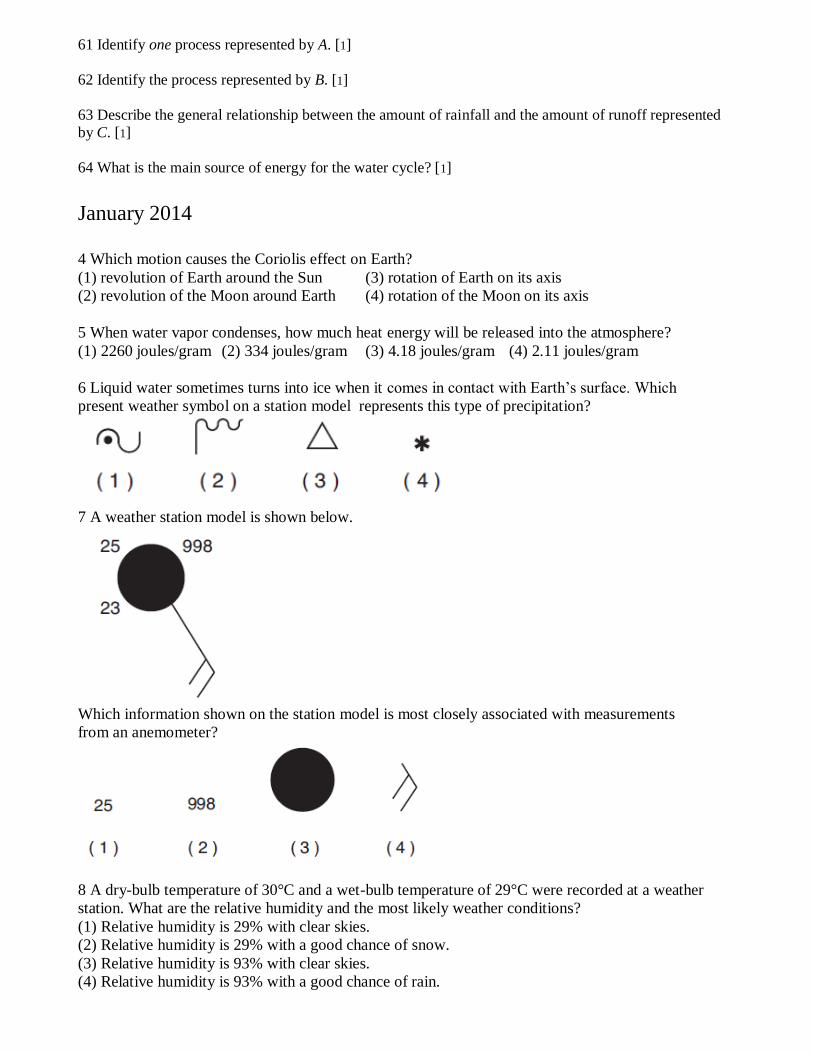
7 A weather station model is shown below.
Which information shown on the station model is most closely associated with measurements
from an anemometer?
8 A dry-bulb temperature of 30°C and a wet-bulb temperature of 29°C were recorded at a weather
station. What are the relative humidity and the most likely weather conditions?
(1) Relative humidity is 29% with clear skies.
(2) Relative humidity is 29% with a good chance of snow.
(3) Relative humidity is 93% with clear skies.
(4) Relative humidity is 93% with a good chance of rain.