19
EAST AND SOUTH EAST OPERATING AREA HOUSING MARKET REPORT August 2014

EAST AND SOUTH EAST OPERATING AREA HOUSING MARKET REPORT August 2014

HCA East & South East operating area housing market report, August 2014
Page 2
Contents
Introduction ................................................................................................................ 3
Summary .................................................................................................................... 3
The Housing Market .................................................................................................. 4
House prices 4
Affordability 6
Housing transactions 7
Private rental market 9
Mortgages 11
New homes ............................................................................................................... 12
Residential land values 12
House building 13
House building programmes managed by the HCA 15
Society ...................................................................................................................... 17
Homelessness 17
Additional information ............................................................................................ 18
East and South East HCA operating area 18
HCA case studies 18

HCA East & South East operating area housing market report, August 2014
Page 3
Introduction
This housing market report has been produced by the Homes and Communities Agency’s Strategic and Market Intelligence Team, to provide the reader with contextual information on house building and the housing market.
It is compiled predominantly from publically available data, and sources and links have been provided where appropriate. Any calculation and analysis is offered for clarity, but should not be taken as a statement of HCA policy.
The HCA’s East and South East (ESE) operating area (OA) consists of:
The following counties: Buckinghamshire, Cambridgeshire, East Sussex, Essex, Hertfordshire, Kent, Norfolk, Suffolk, Surrey and West Sussex, and,
The unitary authorities of Brighton and Hove, Medway Towns, Peterborough, Southend on Sea and Thurrock.
Greater London is not part of the ESE OA.
Housing market data are often only available at Standard Statistical Region (SSR) level, so the information contained within this report does not always exactly match the HCA’s OA boundaries. Our commentary will be clear about which geographical area is being referred to.
Where data are available at local authority level they are shown as maps, in the relevant sections. Our maps have been produced using ‘SIGnet’, the HCA’s bespoke online mapping tool, which we make available for the use of all public sector organisations, free of charge. Please contact us for details on how to obtain this service.
Summary
In April 2014, ONS simple average regional house prices were £217,686 in East
Anglia and £310,889 in the South East. These represent a 4.0% and a 7.6%
increase, respectively, compared to the previous year.
In the twelve months to March 2014, 101,443 homes were sold in the East
region and 153,859 in the South East. These are 28.4% and 28.1% more than in
the previous year.
Average median private rents in March 2014 were £625 per month in the East
SSR and £750 in the South East SSR. These figures are a 4.2% and 0.0%
increase, respectively, from the previous year.
The number of households facing mortgage possession action in court has
decreased over the last year by 14.3% in the East SSR and by 11.6% in the
South East.
House building starts totalled 25,820 in the year ending Q1 2014 in the East
South East OA, which is a 26.0% increase compared to the previous twelve
months.
House building programmes managed by the HCA for 1 April 2013 – 31 March
2014 show 9,439 housing starts (8,571 of which were affordable) and 7,096
(6,100) completions across the ESE OA. There were also 3,814 Help to Buy
completions in the OA.
Households accepted as homeless totalled 1,893 in Q1 2014 in the ESE OA.
This is a 5.6% increase compared to this quarter in the previous year.
HCA East & South East operating area housing market report, August 2014
Page 4
The Housing Market
House prices
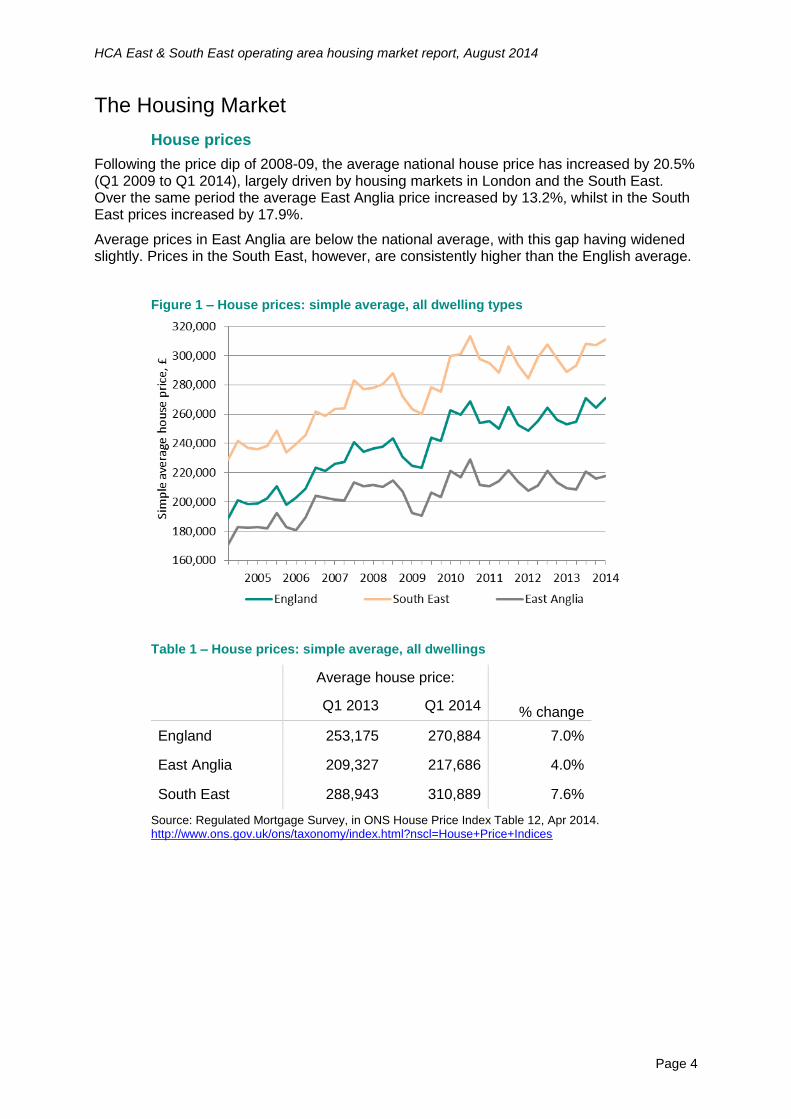
Following the price dip of 2008-09, the average national house price has increased by 20.5% (Q1 2009 to Q1 2014), largely driven by housing markets in London and the South East. Over the same period the average East Anglia price increased by 13.2%, whilst in the South East prices increased by 17.9%.
Average prices in East Anglia are below the national average, with this gap having widened slightly. Prices in the South East, however, are consistently higher than the English average.
Figure 1 – House prices: simple average, all dwelling types
Table 1 – House prices: simple average, all dwellings
Average house price:
% change Q1 2013 Q1 2014
England 253,175 270,884 7.0%
East Anglia 209,327 217,686 4.0%
South East 288,943 310,889 7.6%
Source: Regulated Mortgage Survey, in ONS House Price Index Table 12, Apr 2014. http://www.ons.gov.uk/ons/taxonomy/index.html?nscl=House+Price+Indices

HCA East & South East operating area housing market report, August 2014
Page 5
House prices are typically highest in areas closer to London. The local authority area with the lowest median house valuation in the OA is Peterborough at £126,000, and the highest is Elmbridge at £465,000 (Landmark/Calnea).
Figure 2 – Average (median) house price valuation, by local authority
Source: Landmark/Calnea, median valuation, May 2014.
HCA East & South East operating area housing market report, August 2014
Page 6
Affordability
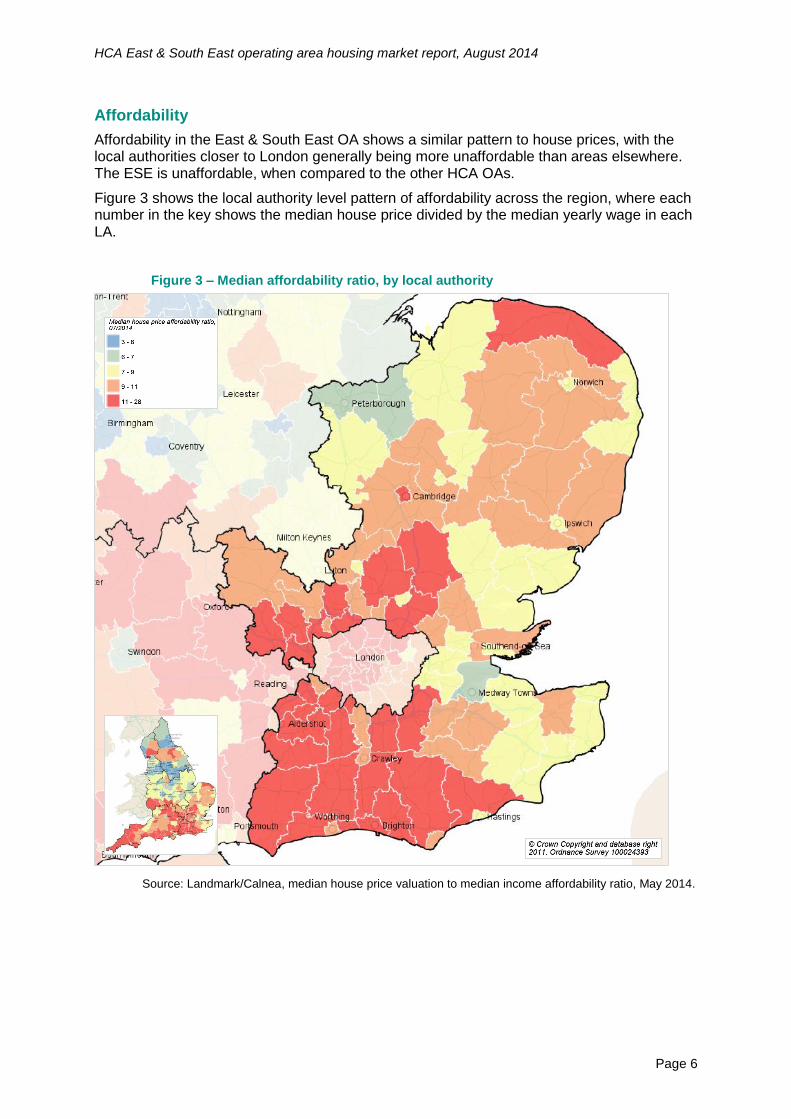
Affordability in the East & South East OA shows a similar pattern to house prices, with the local authorities closer to London generally being more unaffordable than areas elsewhere. The ESE is unaffordable, when compared to the other HCA OAs.
Figure 3 shows the local authority level pattern of affordability across the region, where each number in the key shows the median house price divided by the median yearly wage in each LA.
Figure 3 – Median affordability ratio, by local authority
Source: Landmark/Calnea, median house price valuation to median income affordability ratio, May 2014.
HCA East & South East operating area housing market report, August 2014
Page 7
Housing transactions
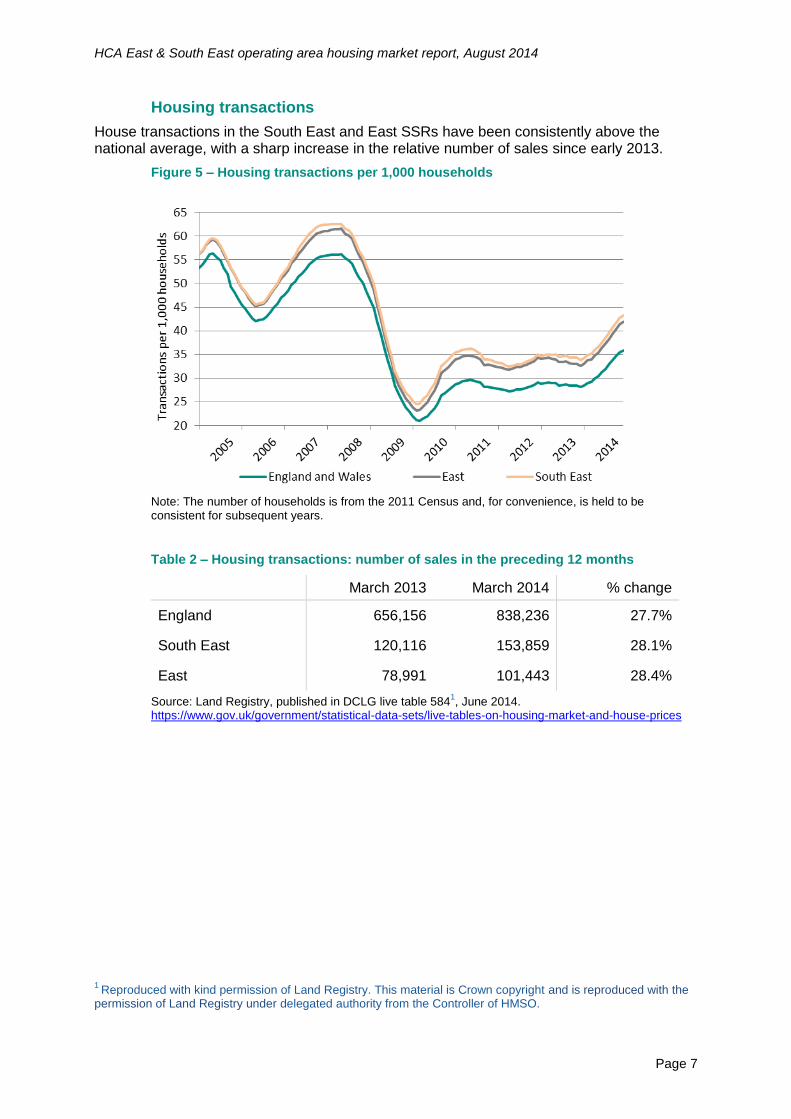
House transactions in the South East and East SSRs have been consistently above the national average, with a sharp increase in the relative number of sales since early 2013.
Figure 5 – Housing transactions per 1,000 households
Note: The number of households is from the 2011 Census and, for convenience, is held to be consistent for subsequent years.
Table 2 – Housing transactions: number of sales in the preceding 12 months
March 2013 March 2014 % change
England 656,156 838,236 27.7%
South East 120,116 153,859 28.1%
East 78,991 101,443 28.4%
Source: Land Registry, published in DCLG live table 5841, June 2014.
https://www.gov.uk/government/statistical-data-sets/live-tables-on-housing-market-and-house-prices
1
Reproduced with kind permission of Land Registry. This material is Crown copyright and is reproduced with the permission of Land Registry under delegated authority from the Controller of HMSO.

HCA East & South East operating area housing market report, August 2014
Page 8
Figure 6 – Total sales in the last 12 months, as a percentage of all residential properties
Source: Landmark/Calnea, May 2014.
HCA East & South East operating area housing market report, August 2014
Page 9
Private rental market
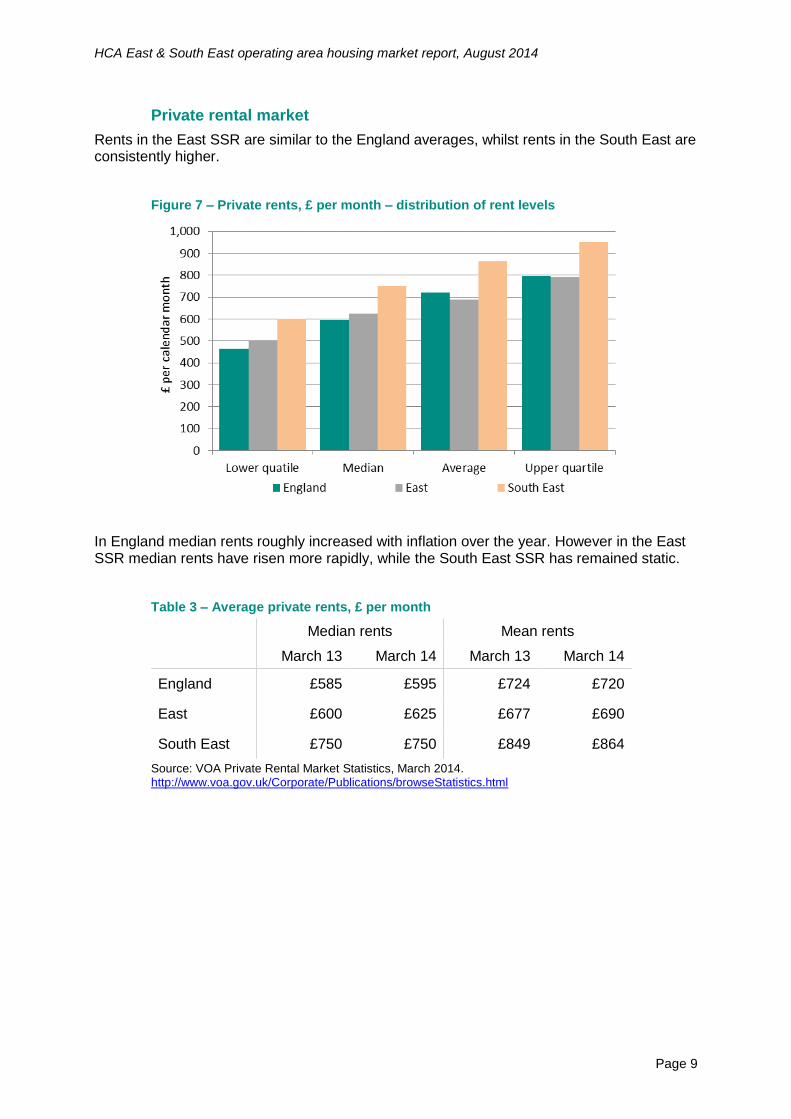
Rents in the East SSR are similar to the England averages, whilst rents in the South East are consistently higher.
Figure 7 – Private rents, £ per month – distribution of rent levels
In England median rents roughly increased with inflation over the year. However in the East SSR median rents have risen more rapidly, while the South East SSR has remained static.
Table 3 – Average private rents, £ per month
Median rents Mean rents
March 13 March 14 March 13 March 14
England £585 £595 £724 £720
East £600 £625 £677 £690
South East £750 £750 £849 £864
Source: VOA Private Rental Market Statistics, March 2014. http://www.voa.gov.uk/Corporate/Publications/browseStatistics.html
HCA East & South East operating area housing market report, August 2014
Page 10
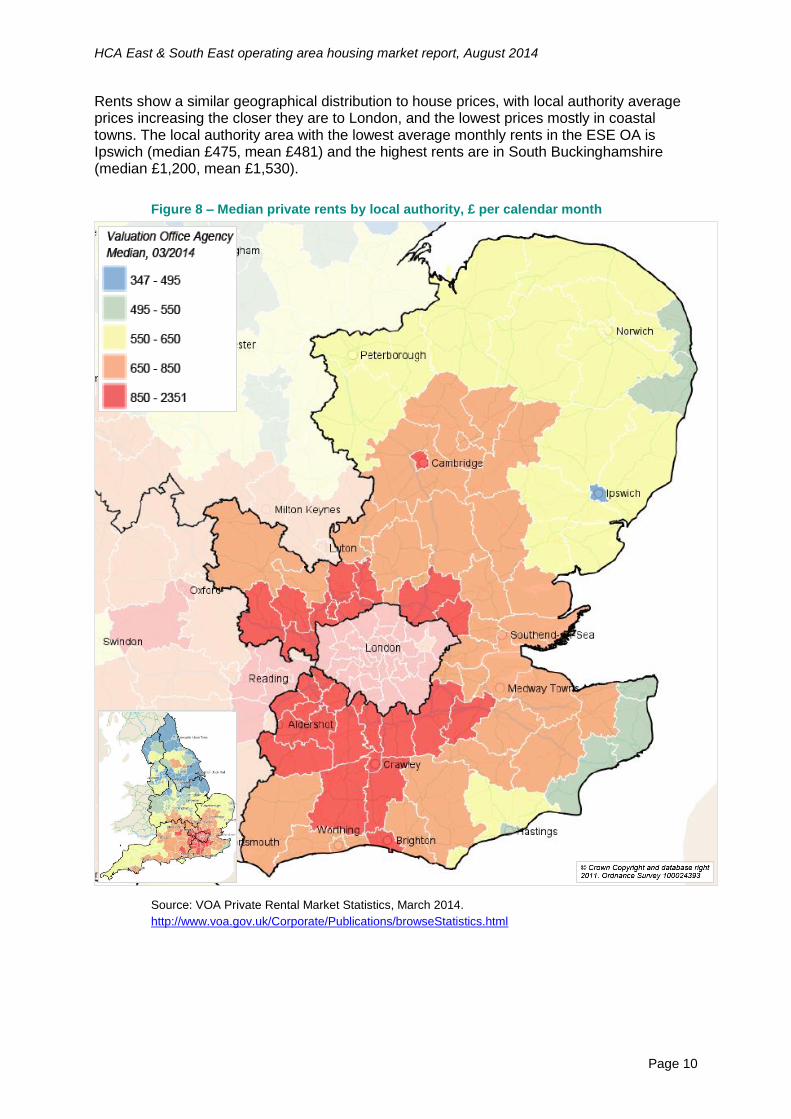
Rents show a similar geographical distribution to house prices, with local authority average prices increasing the closer they are to London, and the lowest prices mostly in coastal towns. The local authority area with the lowest average monthly rents in the ESE OA is Ipswich (median £475, mean £481) and the highest rents are in South Buckinghamshire (median £1,200, mean £1,530).
Figure 8 – Median private rents by local authority, £ per calendar month
Source: VOA Private Rental Market Statistics, March 2014.
http://www.voa.gov.uk/Corporate/Publications/browseStatistics.html

HCA East & South East operating area housing market report, August 2014
Page 11
Mortgages
The total number and value of mortgages sold for house purchase in the UK has been following an upward trajectory since late 2012, but are still below pre-2008 levels.
Figure 9 – Approvals for lending secured on dwellings, UK
Source: © Bank of England: Bankstats, Part A, table 5.4, seasonally adjusted, Q1 2014. http://www.bankofengland.co.uk/statistics/Pages/default.aspx
The number of households facing mortgage possession action in court has decreased by 12.5% in England over the last year. This national trend is mirrored in the OA with a 14.3% decrease in possession claims issued in county courts in the East SSR between Q1 2013 to Q1 2014, and 11.6% in the South East.
Figure 10 – Number of claims for mortgage possession2 issued in county courts, per
1,000 households, quarterly
Source: Ministry of Justice, Mortgage and Landlord Possession Statistics, May 2014. https://www.gov.uk/government/collections/mortgage-and-landlord-possession-statistics
2 These figures represent court actions for possession and not numbers of homes actually taken.
HCA East & South East operating area housing market report, August 2014
Page 12
New homes
Residential land values
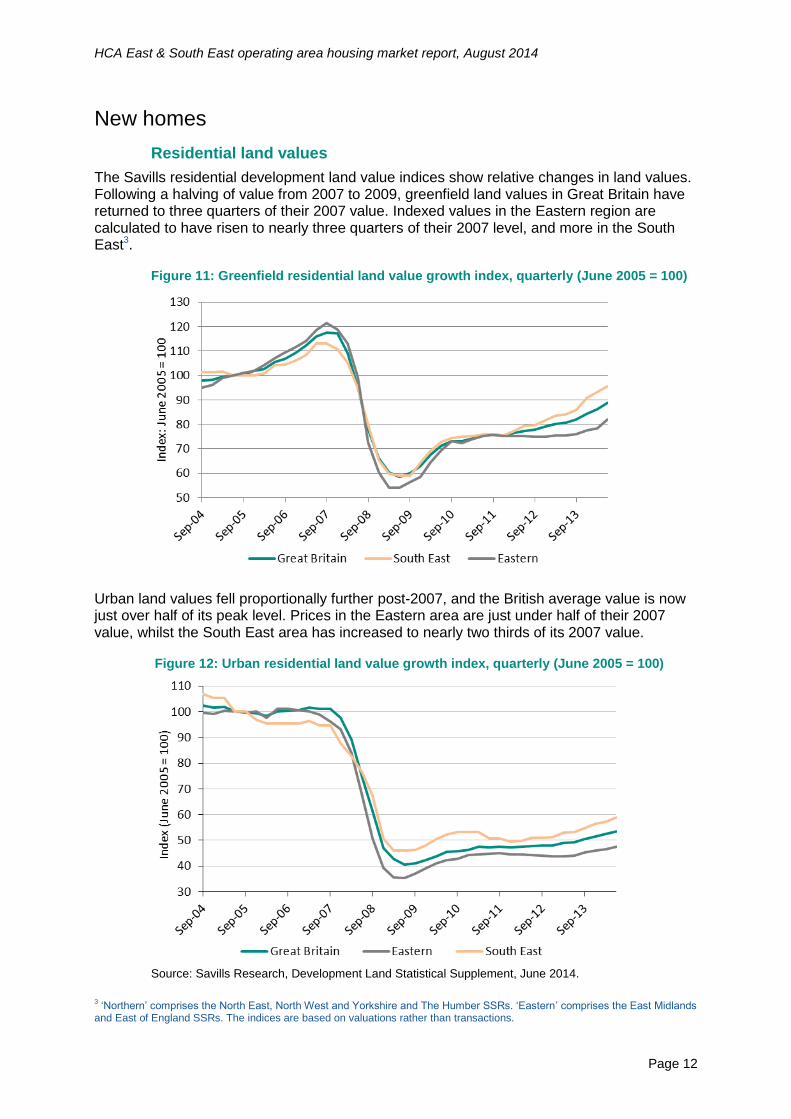
The Savills residential development land value indices show relative changes in land values. Following a halving of value from 2007 to 2009, greenfield land values in Great Britain have returned to three quarters of their 2007 value. Indexed values in the Eastern region are calculated to have risen to nearly three quarters of their 2007 level, and more in the South East3.
Figure 11: Greenfield residential land value growth index, quarterly (June 2005 = 100)
Urban land values fell proportionally further post-2007, and the British average value is now just over half of its peak level. Prices in the Eastern area are just under half of their 2007 value, whilst the South East area has increased to nearly two thirds of its 2007 value.
Figure 12: Urban residential land value growth index, quarterly (June 2005 = 100)
Source: Savills Research, Development Land Statistical Supplement, June 2014.
3 ‘Northern’ comprises the North East, North West and Yorkshire and The Humber SSRs. ‘Eastern’ comprises the East Midlands
and East of England SSRs. The indices are based on valuations rather than transactions.

HCA East & South East operating area housing market report, August 2014
Page 13
House building
In the twelve months to March 2014, 16,170 new homes were started on site in the East of England SSR and 21,980 in the South East SSR. This is a 26.4% increase on the previous year in the East and 17.5% increase in the South East.
Across England, starts in the past twelve months were 31.4% higher than the previous year.
Figure 13 – House building activity, SSRs, quarterly
Table 4 – House building activity, starts and completions, twelve-month periods
East of England SSR South East SSR
Starts on site
in twelve months to Q1
Completions on site in
twelve months to Q1
Starts on site in twelve
months to Q1
Completions on site in
twelve months to Q1
2009 13,230 15,950 19,970 24,450
2010 14,480 15,280 19,500 20,020
2011 14,850 15,690 20,070 21,710
2012 12,790 14,060 18,700 19,630
2013 16,170 14,650 21,980 19,320
Source: DCLG house building, Live Tables 213 (England) and 253a (LAs), Q1 2014. https://www.gov.uk/government/statistical-data-sets/live-tables-on-house-building
HCA East & South East operating area housing market report, August 2014
Page 14
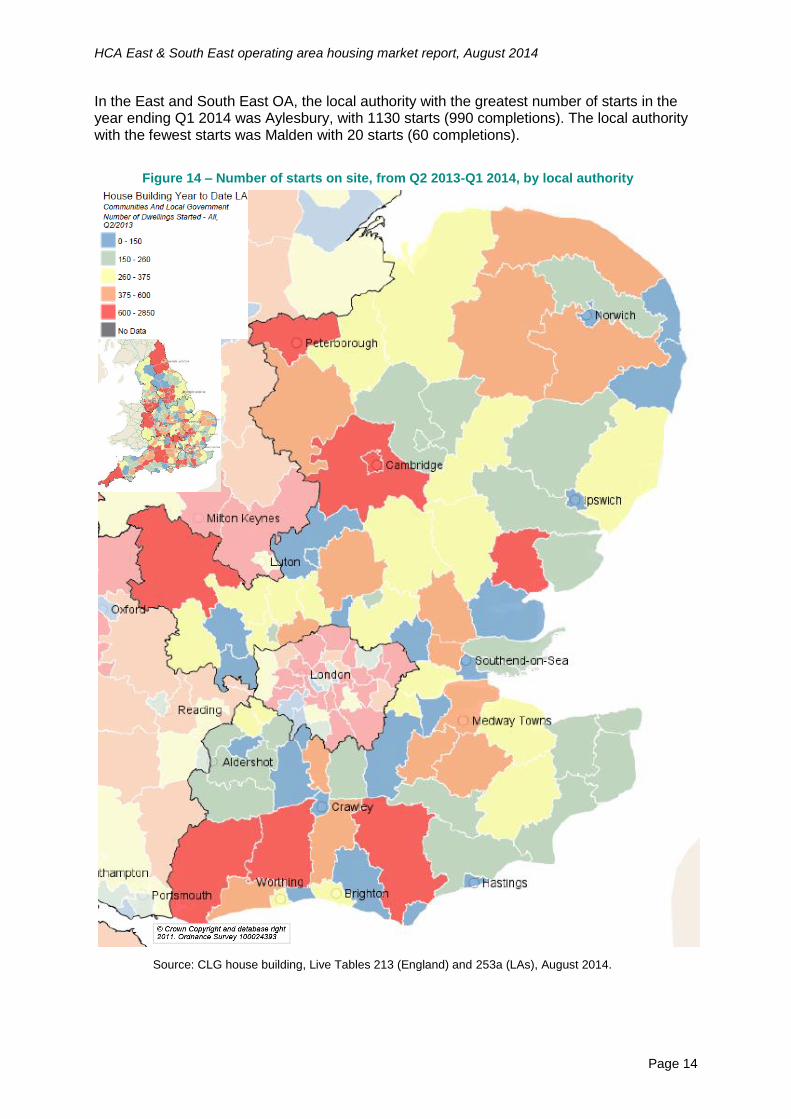
In the East and South East OA, the local authority with the greatest number of starts in the year ending Q1 2014 was Aylesbury, with 1130 starts (990 completions). The local authority with the fewest starts was Malden with 20 starts (60 completions).
Figure 14 – Number of starts on site, from Q2 2013-Q1 2014, by local authority
Source: CLG house building, Live Tables 213 (England) and 253a (LAs), August 2014.

HCA East & South East operating area housing market report, August 2014
Page 15
House building programmes managed by the HCA
The HCA official statistics show that 38,845 housing starts (34,461 housing completions) were delivered through programmes managed by the HCA in England in 2013-14. In the ESA OA they represented 37% of all house building starts (31% of all completions), which compares to a national average (excluding London) of 35% for all starts, (36% of all completions).
Nationally, 19,401 new homes were sold with the assistance of a Help to Buy equity loan in 2013-14 under the Help to Buy programme. Within the ESE 3,814 units were delivered, which represents 17% of all house building completions in the OA.
Table 5 – HCA housing starts on site and completions, 1 Apr 2013 – 31 March 20144
England ESE OA
Starts on site
Affordable Rent 25,486 6,237
Social Rent 2,638 489
Intermediate Rent 0 0
Affordable Home Ownership 4,738 1,845
Total Affordable 32,862 8,571
Market 5,983 868
Total 38,845 9,439
Completions
Affordable Rent 17,094 3,377
Social Rent 4,487 1,099
Intermediate Rent 117 55
Affordable Home Ownership 5,945 1,569
Total Affordable 27,643 6,100
Market 6,818 996
Total 34,461 7,096
Help to Buy completions
Total 19,401 3,814
Source: © Homes and Communities Agency, National Housing Statistics, June 2014. http://www.homesandcommunities.co.uk/housing-statistics
4 A ‘start’ and ‘completion’ may be defined differently to the DCLG housebuilding statistics above; units may be
counted at different points in time in the construction process.

HCA East & South East operating area housing market report, August 2014
Page 16
Figure 15 – HCA housing starts on site, 1 Apr 2013 – 31 March 2014
Source: © Homes and Communities Agency, National Housing Statistics, June 2014.

HCA East & South East operating area housing market report, August 2014
Page 17
Society
Homelessness
Following falls in the homelessness rate per capita between 2003 and 2009, homelessness in England has stabilised in the last four years.
Over the last ten years, homelessness rates in the South East and the East of England SSRs have both followed a similar pattern, with the South East at a lower level than the national average.
Figure 16 - Rate of homeless acceptances per 1,000 households, per quarter
Note: The number of households is from the 2011 Census and, for convenience, is held to be consistent for all years.
Table 6 – Homelessness acceptances
Q1 2014 Q1 2013
Number of
households
accepted as
homeless
No of house-
holds accepted,
per 1,000
households
Number of
households
accepted as
homeless
No of house-
holds accepted,
per 1,000
households
England 12,520 0.56 13,230 0.58
ESE OA 1,893 0.45 1,792 0.42
Source: Local Authority action under statutory homelessness provisions, DCLG Live Table 784a. https://www.gov.uk/government/statistical-data-sets/live-tables-on-homelessness
The ESE OA local authorities that accepted the greatest numbers of households as statutory homeless in the latest quarter were Brighton and Hove (160, 1.30 per 1,000 households) and Basildon (90, 1.22 per 1,000 households). At a household per capita level, Brighton accepted the most homeless households in the OA.
HCA East & South East operating area housing market report, August 2014
Page 18
Additional information
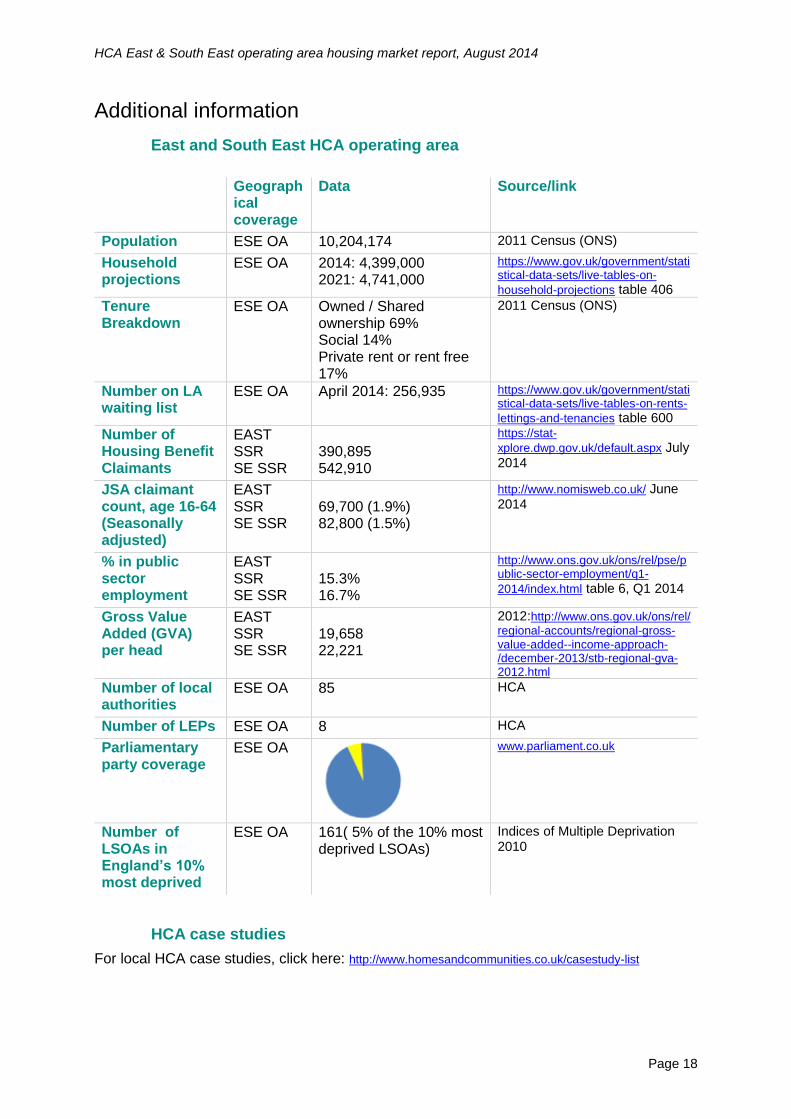
East and South East HCA operating area
Geograph
ical coverage
Data Source/link
Population ESE OA 10,204,174 2011 Census (ONS)
Household projections
ESE OA 2014: 4,399,000 2021: 4,741,000
https://www.gov.uk/government/statistical-data-sets/live-tables-on-
household-projections table 406
Tenure Breakdown
ESE OA Owned / Shared ownership 69% Social 14% Private rent or rent free 17%
2011 Census (ONS)
Number on LA waiting list
ESE OA April 2014: 256,935 https://www.gov.uk/government/statistical-data-sets/live-tables-on-rents-
lettings-and-tenancies table 600
Number of Housing Benefit Claimants
EAST SSR SE SSR
390,895 542,910
https://stat-
xplore.dwp.gov.uk/default.aspx July 2014
JSA claimant count, age 16-64 (Seasonally adjusted)
EAST SSR SE SSR
69,700 (1.9%) 82,800 (1.5%)
http://www.nomisweb.co.uk/ June 2014
% in public sector employment
EAST SSR SE SSR
15.3% 16.7%
http://www.ons.gov.uk/ons/rel/pse/public-sector-employment/q1-
2014/index.html table 6, Q1 2014
Gross Value Added (GVA) per head
EAST SSR SE SSR
19,658 22,221
2012:http://www.ons.gov.uk/ons/rel/
regional-accounts/regional-gross-value-added--income-approach-/december-2013/stb-regional-gva-2012.html
Number of local authorities
ESE OA 85 HCA
Number of LEPs ESE OA 8 HCA
Parliamentary party coverage
ESE OA
www.parliament.co.uk
Number of LSOAs in England’s 10% most deprived
ESE OA 161( 5% of the 10% most deprived LSOAs)
Indices of Multiple Deprivation 2010
HCA case studies
For local HCA case studies, click here: http://www.homesandcommunities.co.uk/casestudy-list
Homes and Communities Agency Strategic and Market Intelligence Team Fry Building 2 Marsham Street London SW1P 4DF [email protected]
Publication date: August 2014


