East Asian Regional Trade Agreements: Do They Promote Global Free Trade? * Innwon Park ** June 2006 Abstract This paper quantitatively evaluates the effects different paths have on East Asian Regional Trade Agreements (RTAs). By applying a CGE model analysis, it is found that the static effect of the proposed East Asian RTAs on world and members’ welfare is sufficiently positive, and will lead to nondiscriminatory global free trade, by triggering the domino effect of regionalism over time if the RTAs take an expansionary path by cooperating with each other, in contrast to competing to achieve the first mover advantage, or hub self-interest. We also find that (i) higher positive welfare and output gains are associated with original members of existing RTAs, (ii) additional positive trade creation effects arise for original members as associated RTAs expand, and (iii) welfare and output gains are in uneven distribution for a hub relative to smaller or even negative gains for spokes. Keywords: regional trade agreements, global free trade, optimal path, CGE model, East Asia JEL Classification: F02, F15, O53 * Paper to be presented at the Joint Conference of AKES, KDI, KU, KIF, and RCIE on Korea and the World Economy, V: Korea and the FTA, July 7-8, 2006, Korea University, Seoul, Korea. Earlier version of this paper was written while I was visiting the Graduate School of International Cooperation Studies (GSICS) at Kobe University, Japan. I wish to thank GSICS Dean Hiroshi Ohta and Professor Seiichi Katayama at RIEB (Research Institute for Economics & Business Administration) for providing excellent support during my visit. ** Professor, Division of International Studies at Korea University, Anam-Dong 5-1, Sungbuk- Gu, Seoul 136-701, Korea; Telephone: 82-2-3290-2406; Fax: 82-2-929-0402; Email: [email protected].
Transcript
East Asian Regional Trade Agreements: Do They Promote Global Free Trade?*
Innwon Park**
June 2006
Abstract This paper quantitatively evaluates the effects different paths have on East Asian Regional Trade Agreements (RTAs). By applying a CGE model analysis, it is found that the static effect of the proposed East Asian RTAs on world and members’ welfare is sufficiently positive, and will lead to nondiscriminatory global free trade, by triggering the domino effect of regionalism over time if the RTAs take an expansionary path by cooperating with each other, in contrast to competing to achieve the first mover advantage, or hub self-interest. We also find that (i) higher positive welfare and output gains are associated with original members of existing RTAs, (ii) additional positive trade creation effects arise for original members as associated RTAs expand, and (iii) welfare and output gains are in uneven distribution for a hub relative to smaller or even negative gains for spokes.
Keywords: regional trade agreements, global free trade, optimal path, CGE model, East Asia JEL Classification: F02, F15, O53 * Paper to be presented at the Joint Conference of AKES, KDI, KU, KIF, and RCIE on Korea and the World Economy, V: Korea and the FTA, July 7-8, 2006, Korea University, Seoul, Korea. Earlier version of this paper was written while I was visiting the Graduate School of International Cooperation Studies (GSICS) at Kobe University, Japan. I wish to thank GSICS Dean Hiroshi Ohta and Professor Seiichi Katayama at RIEB (Research Institute for Economics & Business Administration) for providing excellent support during my visit. ** Professor, Division of International Studies at Korea University, Anam-Dong 5-1, Sungbuk-Gu, Seoul 136-701, Korea; Telephone: 82-2-3290-2406; Fax: 82-2-929-0402; Email: [email protected].
2
I. Introduction
Regional Trade Agreements (RTAs) are proliferating around the world, particularly in
East Asia, where regionalism was not visible until the late 1990s. These RTAs can be
interpreted as a second best policy, relative to the optimum policy of global free trade. The most
important concerns to the second best policy alternative are whether these RTAs can lead the
world economy toward the optimum policy objective of global free trade. Grimwade (1996)
argues that “first regionalism” in the 1960s had collapsed, because it failed to produce sufficient
positive gains from forming RTAs. However, Bhagwati (1993) recognizes that “second
regionalism” has been proliferating since the 1980s and has the chance to be long-lasting,
compared to the failed first regionalism, if the following two key issues can be positively
answered. First, it is important to find out whether the immediate static effect of RTAs on world
welfare would be positive. Second, over time, the welfare effect of RTAs leading to
nondiscriminatory global free trade by triggering the “domino effect of regionalism”1 needs to
be found. The static and dynamic consequences of regional trade blocs on intra- and extra-bloc
trade and welfare are key factors to answer these key issues.
The first issue has been numerously analyzed2 since introduced the concepts of trade
creation and diversion effects for the customs union by Viner (1950) and further clarified by
Kemp and Wan (1976). The second issue concerns how the proliferating RTAs, by interacting
with each other, will evolve over time. Countries excluded from particular RTA may join
existing RTAs, to share benefits arising from free trade, and to avoid disadvantages of isolation
(“expansionary RTAs”). The membership of existing RTAs will increase by attracting new
1 See Baldwin (1993) for the domino theory of regionalism and Summers (1991), Ethier (1998), Laird (1999), Freund (2000), Bergsten (2001), and Lamy (2002) for the theoretical support for the theory. 2 See Baldwin and Venables (1995), Winters (1996) and Bhagwati, Greenaway and Panagariya (1998).
3
members and the gains from free trade will rise. Alternatively, those excluded nonmember
countries create separate RTAs by negotiating new RTAs between them and by competing
against existing RTAs (“duplicate RTAs”), therefore causing the proliferation of RTAs. Both
the expansionary and duplicate RTAs may trigger the domino effect of regionalism and could
lead the world economy towards global free trade. However, some member countries of
existing RTAs are currently attempting to form multiple RTAs, in order to be a hub of RTAs
(“overlapping RTAs”).3 This “hub-and-spoke”4 type of evolution in many overlapping RTAs
could result in the “spaghetti bowl phenomenon”5 of discriminatory trade blocs that have the
potential to stall multilateral liberalization efforts.
In contrast to numerous empirical studies analyzing the issue first presented, there is the
lack of empirical evidence to evaluate the evolutionary paths of RTAs, in order to find out
whether regionalism harms the world trading system and hinders multilateral trade liberalization.
Lee, Park, and Shin (2004) attempt to answer the question by applying extended gravity
regression analysis. The ex-post estimation technology of gravity regression analysis adopted,
produces very useful and practical results, but precludes the actual welfare and output effects.6
Moreover, the gravity analysis of RTAs cannot clarify the detailed effects of different
combinations of RTAs concerned, and has limitations when experimenting with ex-ante
scenario analysis, for possible RTAs in the future. In order to overcome these weaknesses in
gravity regression analysis, a Computable General Equilibrium (CGE) model analysis is
3 Concepts of expansionary, duplicate, and overlapping RTAs are introduced in Lee, Park, and Shin (2004). 4 For recent theoretical and empirical discussion about the hub-and-spoke type of RTAs, see Lloyd (2002), Umemoto (2003), Baldwin (2004), Lloyd and Maclaren (2004), Zhai (2005), De Benedictis, De Santis, and Vicarelli (2005), and Deltas, Desmet, and Facchini (2005). 5 See Bhagwati, Greenaway, and Panagariya (1998) and Panagariya (1999) for the spaghetti bowl phenomenon caused by RTAs, especially in the case of currently proliferating and overlapping RTAs. 6 For a methodological discussion about gravity regression analysis, see Anderson and Wincott (2001), Baier and Bergstrand (2001), and Greenaway and Milner (2002). For methodological comparison between gravity and CGE analysis, see Burfisher, Robinson and Thierfelder (2004) and De Rosa and Gilbert (2005).
4
adapted in this paper, to answer questions raised relating to the first and second issues. CGE
model analysis is theoretically sound, and is able to quantitatively analyze the welfare and
output effect, combined with trade effects for each and every RTA concerned, even though the
complicated ex-ante simulation methodology sometimes mis-specifies the model economy, as
Panagariya and Gupta (2001) have criticized.
There are many studies analyzing the effects of RTAs, using CGE model analysis7,
however, there is lack of empirical tests to evaluate the evolutionary paths of different
approaches of proliferating RTAs over time, with CGE models. This paper fills this gap by
explicitly focusing on the evolutionary path of welfare, output, and trade creation and diversion
effects of RTAs. For empirical experiment, East Asia is chosen as the most suitable case
because currently, this region is the most active region for RTA negotiations.8 At the same time,
all the three paths of RTAs from existing, proposed, and negotiating RTAs in the region, can be
found, such as an ASEAN+3 RTA as an expansionary RTA, an ASEAN-China versus a Japan-
Korea RTA as a duplicate RTA, and an ASEAN-China and an ASEAN-Korea RTA, as a hub-
and-spoke type of overlapping RTA.
To summarize, the effects of existing and proposed RTAs, are quantitatively estimated
in East Asia, with regard to welfare, output production, and trade flows impacting the world
economy, members, and nonmembers, using a global CGE model. From simulation analysis, an
attempt is made to the problem of how the proliferating RTAs in East Asia, by interacting with
each other, evolve over time. In addition, each of the above-mentioned three different types of
RTAs, expansionary, duplicate, and overlapping, can be evaluated, in order to find an optimal
7 See Lloyd and Maclaren (2004) for a theoretical and empirical survey of RTAs with CGE modeling. Especially for the East Asian RTAs with CGE models, see McKibbin (1998), Scollay and Gilbert (2001), Urata and Kiyota (2003), McKibbin, Lee, and Cheong (2004), Zhai (2005), and Sulamaa and Widgrén (2005). 8 By 2005, East Asia had implemented 14 RTAs (4 in 2005 only), had signed 10 RTAs (9 in 2005 only), and are negotiating about 30 RTAs. See Table 2.
5
path of RTAs in East Asia, with the goal of leading the world economy toward global free trade,
by triggering the domino effect of regionalism and avoiding the spaghetti bowl phenomenon.
The paper is organized as follows. Section II provides a brief discussion of the recent
trends and main characteristics of RTAs in East Asia. Section III introduces the CGE model and
data used. Section IV evaluates welfare, output, and trade effects of possible RTAs in East Asia
on the world economy and related economies, that is, members and nonmembers. Section V
presents concluding remarks.
II. Proliferating RTAs in East Asia
1. Recent Trends of RTAs in East Asia
RTAs are proliferating in East Asia9 where ‘regionalism’ or ‘free trade area’ was
classified as a meaningless foreign language until the late 1990s, with the exception of AFTA
(ASEAN Free Trade Area), which went into effect, in 1993. In particular, around this time,
countries in Northeast Asia preferred a multilateral trade liberalization approach under the
GATT and WTO regulations. In recent years, however, the region's policy stance has shifted
from favoring multilateralism to regionalism, after recognizing the necessity for regional
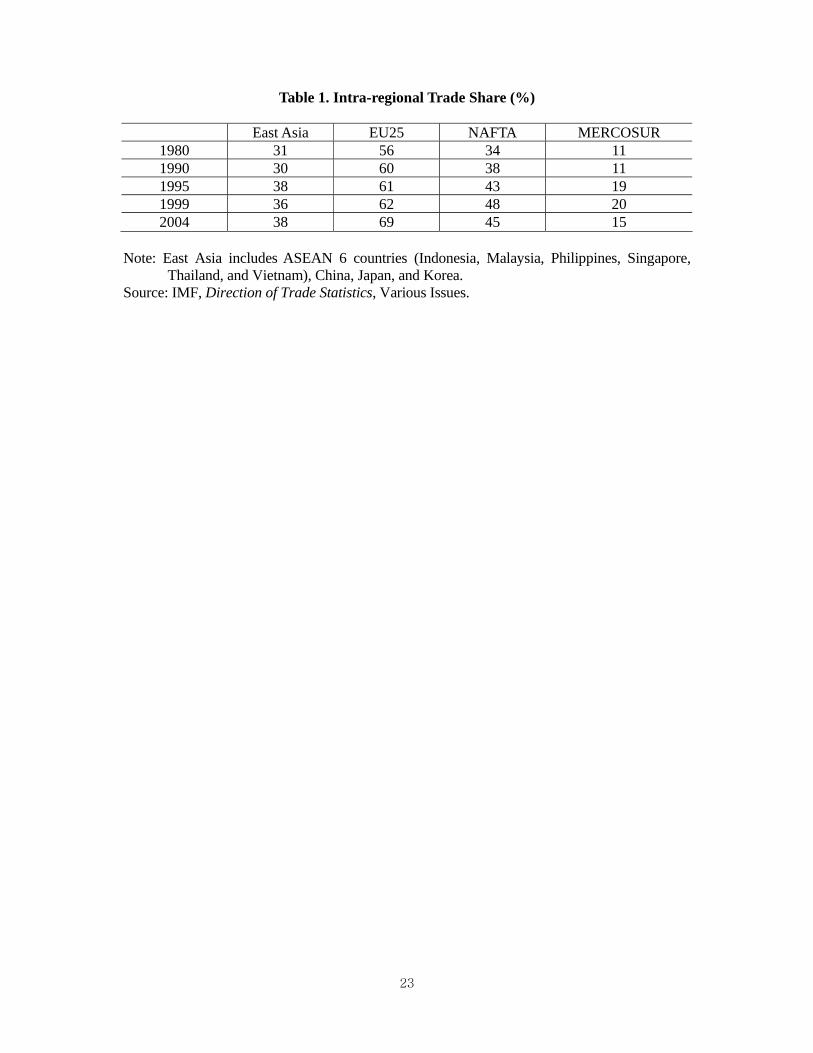
economic cooperation since the East Asian financial crisis that occurred in 1997. As presented
in Table 1, the deepening but stagnating interdependence among the East Asian economies
through intra-regional trade could be another reason for policy change. The East Asian
countries require the creation of intra-regional demands to vitalize their economies. In addition,
the slow progress of multilateral negotiations, such as the sluggish process of the Doha
9 For more detailed information about proliferating RTAs in East Asia, see JETRO (2003), Lu (2003), Kawai (2004), Feridhanusetyawan (2005), and Lee and Park (2005).
6
Development Agenda (DDA) under the WTO, and insignificant progress of Bogor Goals in the
APEC trade and investment liberalization accelerated this shift to regionalism.
Recent developments in individual economies can also be counted as factors behind the
strategic change in East Asian commercial policy toward regionalism. In particular, China's
entry into the WTO and aggressive approach to form bilateral RTAs can be highlighted. China
is using bilateral RTAs strategically, in order to achieve market economy status with trading
partners. China has established nine free trade areas with various partners over the last 5 years,
and is planning to negotiate RTAs with 27 countries in 2006.10 Japan's desire to retake its
market share, which has significantly reduced, because of being left alone from the worldwide
movement toward regionalism, and to regain its leadership role in the region, is also a key factor
in explaining the environmental change in the region. Korea's movement toward a more
globalized economic system, with the intention of revitalizing its outward-oriented economic
growth strategy through trade and investment liberalization, and ambition to be a Northeast
Asian business hub by fully utilizing its geographical advantage, should be counted as another
key factor. The ASEAN's active intention to become a hub of regionalism in East Asia cannot
be ignored. In particular, Singapore is proving to be very aggressive to be a center of the RTA
web in the region, as indicated in Table 2.
2. Main Characteristics of RTAs in East Asia
There has been some progress in forming intra-regional RTAs in East Asia such as
Singapore-Japan, ASEAN-China, Singapore-Korea, and ASEAN-Korea, as summarized in
Table 2. However, most meaningful intra-regional RTAs in East Asia such as ASEAN-Japan,
Japan-Korea, China-Korea, and ASEAN+3 are still under negotiation or consideration. This
10 See http://www.bilaterals.org.
7
means that East Asia still has long way before realizing the gains from free trade through the
formation of various RTAs. In particular, there has been no significant outcome achieved in
forming the intra-Northeast Asian RTA, with the exception of China-Macao and China-Hong
Kong RTAs.
Figure 1 illustrates that ASEAN has strong incentives to open trade liberalization efforts
towards bigger blocs, especially within the region. ASEAN continues to support the extension
of membership to their Northeast Asian neighbors (named, the plus three countries, including
China, Japan, and Korea) and to their long-time trade partners in Australia, New Zealand, India,
and the United States of America. As observed from the East Asia Summit (EAS) meeting held
in Malaysia on December 14 in 2005, the ASEAN+3 (ASEAN 10 countries, China, Japan, and
Korea) or ASEAN+6 (ASEAN+3, Australia, New Zealand, and India) RTAs, may be feasible
in the near future.11 At the same time, it is found that the three Northeast Asian countries are
still extremely interested in forming bilateral RTAs between each other, especially Japan-Korea
and China-Korea RTAs, and possibly an RTA between China, Japan and Korea. Conversely,
ASEAN members such as Singapore and Thailand, seek to forge as many bilateral trade
arrangements as possible, in an effort to maximize gains arising from free trade, by becoming a
hub country, regardless of criticism from other ASEAN member nations for violating the
unanimous and collective approach of nonmembers. Other ASEAN members and the Northeast
Asian neighbors do not appear to be satisfied with the limited gains from free trade, as a spoke
country. They do not appear to desire opening of their markets unilaterally to nonmembers,
entering indirectly through a hub country.
Overall, the existing AFTA can be expected to explode to ASEAN+3 or ASEAN+6, and
even reach APEC levels of trade bloc. Secondly, China’s aggressive approach to ASEAN may
11 For the political economic analysis and empirical evaluation of the ASEAN+3 and the ASEAN+6 RTA, see Drake-Brockman and Drysdale (2002), Kwan and Qiu (2003), Hoa (2003), Soesastro (2003), and Drysdale (2005).
8
push its Northeast Asian neighbors to create a separate trade bloc, between Japan and Korea.
Thus the ASEAN-China and Japan-Korea RTAs will compete with each other in the region.
Thirdly, the Northeast Asian three countries’ individual approach to ASEAN may result in three
separate ASEAN+1 RTAs. In addition, ASEAN, China, Japan, and even Korea may desire
taking leading roles in the construction of the East Asian RTA web. This desire may result in a
hub-and-spoke type of overlapping RTAs in East Asia, resulting in an extremely complicated
web to manage. It is known that some of these three different types of East Asian RTAs have
already been effective, are being actively negotiated, or are proposed. Considering these main
characteristics, it can be observed that an optimal path of East Asian RTAs needs to be taken in
order to maximize both regional and global interests. The optimal path may be to allow East
Asian regionalism to be a stepping stone for globalism.
III. CGE Model and Scenarios for the Analysis on East Asian RTAs
1. Model and Data
In this empirical experiment, we explore the level at which the proposed East Asian
RTAs will (i) create trade among the trade bloc members and raise their welfare and output, (ii)
divert members’ trade with nonmembers and lower nonmembers’ welfare and output, and (iii)
enhance the economic welfare and output of the world economy as a whole. The answers to
these questions are formed, by assessing the macroeconomic aggregate effects of the proposed
RTAs, by applying a traditional static CGE model simulation technique. For this purpose, a
trade-linked multi-sector and multi-country CGE model is adopted, in order to measure the
9
impact of East Asian regional economic integration efforts on intra- and extra-bloc trade,
welfare, and output production.
The CGE model used in this section is the “GTAP6inGAMS” model developed by
Rutherford (2005). The model has three economic agents: producer, representative consumer
(private and public), and trading partners. The GTAP6inGAMS model is a traditional static
Arrow-Debreu type of general equilibrium model in which the zero profit condition and market
clearance define the equilibrium. The GTAP6inGAMS is a modified version of the GTAP
model version 6 developed for GAMS users.12 Most of the model specification is the same as
the GTAP model, but there are a few differences between the GTAP model and GAMS version
of the model as follows. First, the GTAP model is based on a Constant Difference Elasticity
(CDE) demand system, but the GAMS model employs Cobb-Douglas preferences. Second, the
GTAP model assumes that global capital is endogenously allocated by regional rates of return.
However, the GTAP6inGAMS model exogenously fixes the global capital flows for simplicity.
The GTAP6inGAMS model is adopted, because the model is a world widely recognized CGE
model with simplicity (that is, GAMS version of GTAP CGE model).
As presented in Tables 3 and 4, the current model in this paper uses a classification
consisting of 7 sectors and 25 regions. The model solution is calibrated, with 2001 as the base
year, using Global Trade, Assistance and Production: The GTAP 6 Database13. The model is
implemented using the GAMS MPSGE.14
12 The GTAP (Global Trade Analysis Project) is providing both a multi-region and multi-sector CGE model and a global economic dataset for use in the quantitative analyses of international economic issues within an economy-wide framework. The GTAP modeling usually works with GEMPACK (General Equilibrium Modelling PACKage) which is a principal programming language. For the GEMPACK, see http://www.monash.edu.au/policy/gempack.htm. Alternatively, some researchers are using a different programming language, Generalized Algebraic Modeling System (GAMS). For the GAMS, visit http://www.gams.com. 13 See Dimaranan and McDougall (2006). 14 MPSGE (Mathematical Programming System for General Equilibrium analysis) is a subsystem within GAMS. See http://www.gams.com/solvers/mpsge/index.htm.
10
2. Scenarios
From the main characteristics of RTAs in Section II, it is found that the proliferating
RTAs in East Asia will mainly take the following three different paths: expansionary RTAs,
where the membership of existing RTAs are increasing by attracting new members, duplicate
RTAs where separate RTAs are created between nonmembers of existing RTAs and competing
with existing RTAs, and overlapping RTAs, where some members are focusing on being a hub
of RTAs, by forming multiple membership with countries in the region. In Figure 1, the
proliferating RTAs in East Asia are making a very complicated regional web of RTAs. The
existing AFTA can be expanded to a bigger trade bloc such as an ASEAN+3 RTA, some RTAs,
such as that between Japan-Korea, will be formed in the near future, by competing with existing
RTAs such as the AFTA or ASEAN-China RTA, and some RTAs, similar to both the ASEAN-
China and ASEAN-Korea RTAs, which will have overlapped membership, making the ASEAN
a hub of East Asian RTAs.
In order to quantitatively measure the impacts of the proposed East Asian RTAs on
welfare, output production, and trade flows for members, nonmembers, and the world economy,
sixteen scenarios are empirically designed. For each of the scenarios, both import tariffs and
export taxes between members are eliminated, but the trade barriers between members and
nonmembers are retained.15 For expansionary RTAs, simulation analysis is conducted for cases
15 RTAs would remove trade barriers between members over a period of several years rather than removing them at any given year. We acknowledge the limitations of using a static model to evaluate the effects of RTAs which are dynamic in nature. These limitations are mainly caused by not having a set of proper and realistic time-varying and country-specific parameters for a dynamic CGE model. Therefore, we are not evaluating the effects of each different path of RTAs over a period of time but comparing the effects with those of benchmark equilibrium values and with those of alternative paths. One more problem in this study is that the additional trade costs caused by the complicated rules of origin are not included as emphasized by Zhai (2005). This will overestimate the effects of RTAs considered,
11
both with and without including Hong Kong and Taiwan. For overlapping RTAs, alternative
scenarios are also designed, with and without considering AFTA. For scenario analysis with
considering AFTA, ASEAN countries are treated as a secondary hub. In addition, two bigger
trade blocs are designed to test the effect of global free trade in an APEC region and a possible
tripolar system consisting of three large groups of countries in the world. The effects of AFTA
are included as a reference, because, currently the AFTA is only an effective RTA in East Asia.
Followings are scenarios we will examine.
Currently Effective RTA
AFTA: An RTA among the ASEAN countries as a reference
Expansionary RTAs
ASEAN+3 (or Global East Asia): An RTA among the ASEAN, China, Japan, and
Korea (or including Hong Kong and Taiwan, respectively)
ASEAN+6 (or Global Asia): An RTA among the ASEAN, China, Japan, Korea,
Australia, New Zealand, and India (or including Hong Kong and Taiwan)
APEC: A globally expanding RTA among the ASEAN, China, Japan, Korea, Hong
Kong, Taiwan, Australia, New Zealand, India, USA, Canada, Mexico, Chile, Peru, and
Russia
Duplicate RTAs
AFTA vs CJKRTA: Two separate RTAs by geographical location: an AFTA in
Southeast Asia and a China-Japan-Korea RTA in Northeast Asia
ACRTA vs JKRTA: Two separate RTAs by level of economic development: an
ASEAN-China (South-South) and a Japan-Korea (North-North) RTA
Tripolar: Three globally competing RTAs: an Asian RTA including the ASEAN, China,
Japan, Korea, Hong Kong, Taiwan, Australia, New Zealand, India; an American RTA
particularly in the case of overlapping RTAs.
12
including USA, Canada, Mexico, Chile, Peru, and Brazil; an European RTA including
Russia, Western Europe, and EFTA member countries
Overlapping RTAs
ASEAN Hub: Three separate RTAs: ASEAN-China , ASEAN-Japan , and ASEAN-
Korea RTAs, assuming that AFTA is effective
China Hub I (or China Hub II): Three separate RTAs: China-ASEAN , China-Japan ,
and China-Korea RTAs, assuming that AFTA is not effective (or AFTA is effective)
Japan Hub I (or Japan Hub II): Three separate RTAs: Japan-ASEAN, Japan-China,
and Japan-Korea RTAs, assuming that AFTA is not effective (or AFTA is effective)
Korea Hub I (or Korea Hub II): Three separate RTAs: Korea-ASEAN, Korea-China,
and Korea-Japan RTAs, assuming that AFTA is not effective (or AFTA is effective,
respectively)
IV. Empirical Evidence from the Simulation Results
Table 5 provides a comparative summary of the economic effects of the proposed East
Asian RTAs by type. Figures 2 – 5 illustrate the effects of all the proposed East Asian RTAs on
trade, welfare, and output for members and nonmembers as well as the world economy as a
whole.
1. Trade Creation and Trade Diversion Effects
Figure 2 illustrates the percentage deviation of the intra- and extra-bloc trade flows from
the base value, by types of RTAs. All RTAs create a more intra-bloc trade, but divert trade with
13
nonmembers.16 Overall, the net trade creation effect is significantly positive. There is only one
exception of a Tripolar RTA, which incurs a negative net trade creation effect of 0.59 percent.
The net trade creation effect can be maximized by expansionary RTAs, such as ASEAN+6 and
Global Asia RTAs. The duplicate RTAs like an ACRTA vs JKRTA and a Tripolar RTA
represent the worst strategy for achieving the effect of net trade creation.17 The hub-and-spoke
type of overlapping RTA may create a positive volume of trade effect, but far worse than that of
expansionary RTAs. However, if the negative effect of trade diversion is considered, both
duplicate and overlapping RTAs are superior to expansionary RTAs. However, if China
becomes a hub of East Asian RTAs, a net trade creation effect of 23.2 percent will be induced,
which is the second highest gain following the ASEAN+6 RTA (25.6 percent). This is mainly
because of the large Chinese market size and their interdependence between members in the
RTA. Even though the APEC RTA has the largest membership, the trade creation effect is not
as strong because of weaker interdependence between members, than that of East Asian
countries.
Considering the smallest positive net trade creation effect of the regionally duplicate
ACRTA vs JKRTA, the negative net trade creation effect of the globally competing Tripolar
RTAs, and relatively smaller net trade creation effects of overlapping RTAs, the East Asian
RTA should initiate an expansionary path, by cooperating with participants, rather than
competing to achieve the first mover advantage18 or inherent hub self-interest.
16 This positive trade creation effect is similar to the findings in Lee, Park, and Shin (2004) which apply gravity regression analysis to estimate trade effects of RTAs in general. However, unlike the negative trade diversion effect in this paper, they find that RTAs are not harmful, even to nonmembers, because of the strong growth effect. 17 This is another different result between the CGE model analysis in this paper and the gravity analysis in Lee, Park, and Shin (2004). The CGE model analysis estimates much greater net trade creation effect of expansionary RTAs to that of duplicate RTAs but the gravity analysis figures out to be opposite. 18 See Freund (2000).
14
2. Global Effects for the World Economy
As presented in Figure 3 and Table 5, all proposed East Asian RTAs raise world welfare
between a minimum of 0.004 percent in the case of a Japan Hub I RTA and a maximum of 1.13
percent in the case of a Global Asia RTA. The output gains range from 0.01 percent for a China
Hub I RTA to 1.38 percent for a Global Asia RTA. The welfare gains mainly arise from the
positive volume of trade effect ranging between a minimum of 0.24 percent in the case of the
ASEAN Hub RTA, and a maximum of 2.53 percent in the case of the APEC RTA. As indicated
in Figure 3, expansionary RTAs represent the optimum policy for maximizing world welfare
and output. The duplicate RTAs which may well explain the proliferating RTAs in East Asia
can be the second best policy strategy for the world economy19 and the hub-and-spoke type of
overlapping RTAs will be the worst type of RTA for the world economy even worse than the
existing AFTA. The ASEAN Hub is an exception because it covers almost same number of
countries as the ASEAN+3 RTA and there is no single country acting as a hub even though the
three spokes (China, Japan and Korea) are not cooperating with each other compared to the
ASEAN+3 RTA.
The East Asian RTAs satisfy Bhagwati (1993)’s conditions for regionalism to be long-
lasted. First, the static immediate effect of all the proposed East Asian RTAs on world welfare
is positive. Second, the welfare effect of all the proposed East Asian RTAs will lead to
nondiscriminatory global free trade by triggering the domino effect of regionalism over time if
the RTAs take an expansionary path.
3. Regional Effects for Members and Nonmembers
19 Krugman (1993) argues that the world welfare will be minimized if the world is split into three competing trade blocs. However, our findings do not confirm his argument although the tripolar system is not an efficient strategy in comparison with expansionary RTAs in terms of creating trade and members’ welfare as illustrated in Figures 2 and 4.
15
For members’ welfare and output, as presented in Figure 4, expansionary RTAs are the
optimum strategies for East Asian participants. The impact of broader membership, such as the
APEC RTA, and competition between neighboring countries or worldwide competition in the
case of a Tripolar RTA, will limit the benefits. The overlapping RTAs will be the worst for
members’ in terms of derived benefits, because spokes’ benefits are limited and even negative
for some RTAs, as presented in Table 5. In particular, the China Hub I RTA results in China
incurring negative welfare gains, and spoke countries achieving positive welfare gains. This
may be caused by the large Chinese market size relative to that of the spokes. Figure 5
summarizes the welfare and output effects of the East Asian RTAs on nonmembers. The larger
membership induces greater loss to nonmembers, as they are excluded.
A. Original and New Membership: why do countries compete for being the First Mover?
As presented in Table 5, the welfare and output gains to original members (ASEAN) are
much stronger than those of new members (China, Japan, and Korea in the case of ASEAN+3
and China, Japan, Korea, Australia, New Zealand, and India in the case of ASEAN+6) even
though the trade creation effects between original members are much smaller than those of new
members. The smaller volume of trade effect is mainly a result of larger market size of new
members, compared to the limited market in Southeast Asia. However, expansionary RTAs
create additional bilateral trade between original members and new members, which results in
an additional trade creation effect, motivating original members to select additional members.
The higher positive welfare and output gains to original members and the additional trade
creation effect caused, supports the fact that most nonmember countries prefer to create their
trade bloc, rather than joining existing blocs. This may explain the proliferating RTAs around
the world, especially proliferating bilateral RTAs, in contrast to expansionary RTAs. However,
16
competing for the first mover advantage may amplify new member’s negative gains, as
indicated for the duplicate RTAs, such as the ACRTA vs JKRTA case in Table 5. These
negative welfare and output effects are mainly a result of trade diversion (-4.28 percent)
between members in the two competing trade blocs.
B. Hub and Spokes: why do countries compete for being a Hub?
As indicated in the overlapping RTAs presented in Table 5, if ASEAN is not counted as
the secondary hub, the hub-and-spoke type of RTAs distribute the welfare and output gains
unevenly for a hub and act against spokes. In particular, the trade creation effect between hub
and members are significantly high, ranging from 15.55 percent for an ASEAN Hub RTA to
43.49 percent for a China Hub I RTA, but the trade creation effect between spokes and
members is much smaller, ranging from 6.56 percent for an ASEAN Hub RTA, to 16.16
percent for a China Hub I RTA. Furthermore, all RTAs reduce trade between spokes. These
findings also explain why most countries are attempting to be a hub of RTAs and provide
empirical evidence of proliferating-and-overlapping RTAs. However, the effects on the world
economy and participating economies are not comparable to expansionary RTAs. This means
that the competition to be a hub may not lead the world economy towards global free trade. This
may lead to a stagnant path of regionalism as Bhagwati (1993) emphasizes, by amplifying the
spaghetti bowl phenomenon.
V. Concluding Remarks
The estimated effects of different paths of East Asian RTAs—expansionary, duplicate,
and overlapping RTAs, are shown quantitatively on welfare, output, and trade volume of
17
members, nonmembers, and the world economy, by applying CGE model analysis. From the
experiment, the effect of proliferating RTAs in East Asia, by interacting with each other over
time, can be demonstrated. In addition, an optimal path of RTAs in East Asia is found, which
may maximize members’ benefits and lead the world economy toward global free trade, by
triggering the domino effect of regionalism.
Table 6 summarizes the most and the least effective RTAs in East Asia for the world
economy, members, and nonmembers in terms of welfare, output, and bilateral trade. From
scenario analysis, it is found that expansionary RTAs such as an ASEAN+3 (or +6) or a Global
Asia RTA, are the optimum strategy for East Asian members and the world economy in terms
of net trade creation, welfare improvement, and output growth. Duplicating a separate RTA
such as an ASEAN-China versus Japan-Korea RTA, may not be desirable for both members
and the world economy. Duplicating a separate RTA, such as a Tripolar RTA, is the second
optimum strategy for the world economy, but much less attractive than the case of an
expansionary RTA. The hub-and-spoke type of overlapping RTAs, such as currently effective
ASEAN+1 RTAs (ASEAN-China, ASEAN-Korea, and probable ASEAN-Japan RTA), China
Hub RTAs, or Japan Hub RTAs are the worst strategy for both members and the world
economy.
Moreover, it is found that the (i) higher positive welfare and output gains to original
members of existing RTAs, (ii) additional positive trade creation effect to original members as
the existing RTAs explode, and (iii) unevenly distributed welfare and output gains for a hub
relative to smaller or even negative gains for spokes, explain why RTAs, driven by the hub-and-
spoke type of overlapping RTA or duplicating bilateral RTAs, are proliferating in East Asia.
However, the currently proliferating RTAs in East Asia are found to be stumbling blocs,
working against global free trade.
18
It is also confirmed that the static effect of the proposed East Asian RTAs on world and
members’ welfare is sufficiently positive, and will lead to nondiscriminatory global free trade,
by triggering the domino effect of regionalism over time if the RTAs take an expansionary path
by cooperating with each other, in contrast to competing to achieve the first mover advantage,
or hub self-interest. This finding satisfies Bhagwati (1993)’s conditions for RTAs to be long-
lasted.
Based on our findings, it is strongly suggested that East Asian policy makers take an
expansionary path of RTAs, such as the proposed ASEAN+3 or the East Asian RTAs, including
Hong Kong and Taiwan as members. Alternatively, East Asian countries may invite Australia,
New Zealand, and India for a global Asian RTA, as initiated in the first East Asia Summit
meeting in 2005.
19
References
Anderson, James and Eric van Wincoop. 2003. “Gravity with Gravitas: A Solution to the
Border Puzzle,” American Economic Review, 93(1), pp. 170-192.
Baier, S.L. and J.H. Bergstrand. 2001. “The Growth of World Trade: Tariffs, Transport Costs,
and Income Similarity.” Journal of International Economics, 53, pp. 1-27.
Baldwin, Richard. 1993. “A Domino Theory of Regionalism,” NBER Working Paper Series
4465.
Baldwin, Richard. 2004. “The Spoke Trap: hub and spoke bilateralism in East Asia,” KIEP
CNAEC Research Series 04-02, Korea Institute for International Economic Policy
(KIEP).
Baldwin, R. and A. Venables. 1995. “Regional Economic Integration.” Handbook of
International Economics edited by G. Grossman and K. Rogoff, Amsterdam: Elsevier
Science Publishers.
Bergsten, C. Fred. 2001. “Fifty Years of Trade Policy: The Policy Lessons.” The World
Economy, 24, pp. 1-13.
Bhagwati, Jagdish. 1993. “Regionalism and Multilateralism: an overview,” Chapter 2 in New
Dimensions in Regional Integration edited by Jaime De Melo and Arvind Panagariya,
Centre for Economic Policy Research (CEPR), Cambridge University Press, pp. 22-51.
Bhagwati, Jagdish, David Greenaway and Arvind Panagariya. 1998. “Trading Preferentially:
Theory and Policy.” The Economic Journal, 108, pp. 1128-1148.
Burfisher, Mary E., Sherman Robinson, and Karen Thierfelder. 2004. “Regionalism: Old and
New, Theory and Practice.” MTID Discussion Paper 65, Markets, Trade and Institutions
Division, International Food Policy Research Institute.
De Benedictis, Luca, Roberta De Santis, and Claudio Vicarelli. 2005. “Hub-and-Spoke or Else?
Free Trade Agreements in the Enlarged EU: A Gravity Model Estimate,” Working
Paper 37, European Network of Economic Policy Research Institute.
Deltas, George, Klaus Desmet, and Giovanni Facchini. 2005. “Hub-and-Spoke Free Trade
Areas,” Mimeo.
DeRosa, Dean A. and John P. Gilbert. 2005. “Predicting Trade Expansion under FTAs and
Multilateral Agreements,” Working Paper Series, 05-13, Institute for International
Economics.
20
Dimaranan, Betina V. and Robert A. McDougall, Editors (2006, forthcoming). Global Trade,
Assistance, and Production: The GTAP 6 Data Base, Center for Global Trade Analysis,
Purdue University.
Drake-Brockman, Jane and Peter Drysdale. 2002. “Regional Economic Integration in East
Asia,” Pacific Economic Papers, 333.
Drysdale, Peter. 2005. “Regional Cooperation in East Asia and FTA Strategies,” Pacific
Economic Papers, 334.
Ethier, Wilfred J. 1998. “The New Regionalism.” The Economic Journal, 108, pp. 1149-1161.
Feridhanusetyawan, Tubagus. 2005. “Preferential Trade Agreements in the Asia-Pacific
Region.” IMF Working Paper WP/05/149.
Fruend, Carolyn. 2000. “Different Paths to Free Trade: The Gains from Regionalism,”
Quarterly Journal of Economics, 115, pp.1317-41.
Greenaway, David and Chris Milner. 2002. “Regionalism and Gravity.” Scottish Journal of
Political Economy, 49, 5, pp. 574-583.
Grimwade, Nigel. 1996. “Regionalism,” Chapter 7 in International Trade Policy: A
Contemporary Analysis, Routledge, pp. 232-282.
Hoa, Tran Van. 2003. “New Asian Regionalism: Evidence on ASEAN+3 Free Trade
Agreement From Extended Gravity Theory and New Modelling Approach,” Working
Paper Series 03-03, University of Wollongong.
JETRO. 2003. “Prospects for Free Trade Agreements in East Asia,” Overseas Research
Department, Japan External Trade Organization.
Kwan, Yum K. and Larry D. Qiu. 2003. “The ASEAN+3 Trading Bloc,” Mimeo.
Kawai, Masahiro. 2004. “Regional Economic Integration and Cooperation in East Asia,”
paper prepared for the Experts’ Seminar on the Impact and Coherence of OECD
Country Policies on Asian Developing Economies.
Kemp, Murray C. and Henry Y. Wan, Jr. 1976. “An Elementary Proposition Concerning the
Formation of Customs Unions,” Journal of International Economics, 6, pp. 95-97.
Krugman, Paul. 1993. “Regionalism vs Multilateralism: Analytical Notes,” in New Dimensions
in Regional Integration edited by J. De Melo and A. Panagariya, Cambridge University
Press, pp. 58-89.
Laird, Sam. 1999. “Regional Trade Agreements: Dangerous Liaisons?” The World Economy,
22, pp. 1179-1200.
21
Lamy, Pascal. 2002. “Stepping Stones or Stumbling Blocks? The EU’s Approach towards the
Problem of Multilateralism vs. Regionalism in Trade Policy.” The World Economy, 25,
pp. 1399-1413.
Lee, Jong-Wha and Innwon Park. 2005. “Free Trade Areas in East Asia: Discriminatory or
Nondiscriminatory?” The World Economy, 28:1, pp. 21-48.
Lee, Jong-Wha, Innwon Park and Kwanho Shin. 2004. “Proliferating Regional Trade
Arrangements: Why and Whither?” mimeo.
Lloyd, Peter. 2002. “New Bilateralism in the Asia-Pacific,” The World Economy, 25, pp.1279-
1296.
Lloyd, Peter and Donald Maclaren. 2004. “Gains and Losses from Regional Trading
Agreements: A Survey,” The Economic Record, 80, pp. 445-467.
Lu, Feng. 2003. “Free Trade Area: Awakening regionalism in East Asia,” Working Paper
Series E2003010, China Center for Economic Research.
McKibbin, Warwick J. 1998. “Regional and Multilateral Trade Liberalization: The Effects on
Trade, Investment and Welfare,” in Europe, East Asia and APEC: A Shared Global
Agenda? edited by Peter Drysdale and D. Vines. Cambridge University Press,
pp.195-220.
McKibbin, Warwick J., Jong-Wha Lee, and Inkyo Cheong. 2004. “A Dynamic Analysis of a
Korea-Japan Free Trade Area: Simulations with the G-Cubed Asia-Pacific Model,”
International Economic Journal, 18, pp. 3-32.
Panagariya, Arvind. 1999. “The Regionalism Debate: An Overview,” The World Economy, 22,
pp. 477-511
Panagariya, Arvind and Rupa Dutta-Gupta. 2001. “The ‘Gains’ from Preferential Trade
Liberalization in the CGE Models: Where do they come from?” Chapter 3 in
Regionalism and Globalization: Theory and Practice. Sajal Lahiri, ed. Routledge.
Rutherford, Thomas F. 2005. “GTAP6inGAMS: The Dataset and Static Model,” paper prepared
for the Workshop on Applied General Equilibrium Modelling for Trade Policy Analysis
in Russia and the CIS.
Scollay, Robert, and John Gilbert. 2001. New Subregional Trading Arrangements in the Asia-
Pacific, Washington, DC: Institute for International Economics.
Soesastro, Hadi. 2003. “An ASEAN Economic Community and ASEAN+3: How Do They Fit
Together?” Pacific Economic Papers, 338.
22
Sulamaa, Pekka and Mika Widgrén. 2005. “Asian Regionalism versus Global Free Trade: A
Simulation Study on Economic Effects,” Discussion Papers, The Research Institute of
the Finnish Economy.
Summers, Lawrence. 1991. “Regionalism and the World Trading System,” Federal Reserve
Bank of Kansas City.
Umemoto, Masaru. 2003. “Hub and Spoke Integration and Income Convergence,” Working
Paper Series 2003-01. The International Center for the Study of East Asian
Development (ICSEAD).
Urata, Shujiro and Kozo Kiyota. 2003. “The Impact of an East Asia FTA on Foreign Trade in
East Asia,” NBER Working Paper Series 10173, National Bureau of Economic
Research.
Viner, Jacob. 1950. The Customs Union Issues, Carnegie Endowment for International Peace.
Winters, L. Alan. 1996. “Regionalism versus Multilateralism,” Policy Research Working Paper
1687, The World Bank.
Zhai Fan. 2005. “Preferential Trade Agreements in Asia: Alternative Scenarios of ‘Hub and
ASEAN - Association of South East Asian Nations ASEAN+3 - ASEAN plus China, Japan, Korea CER - Closer Economic Relations between Australia and New Zealand EFTA - European Free Trade Association EU – European Union GCC – Gulf Cooperation Council MERCUSOR - Southern Common Market
Sources: Compiled mainly based on WTO website and Bilateral.org website.
25
Table 3. Regional Aggregation of the CGE Model (25 Regions)