East of England Reviving Regions: Empowering places to revive and thrive • East of England growth priorities • Regional scorecard identifying strengths • 16 sub-regional scorecards Sponsored by
Transcript
East of EnglandReviving Regions: Empowering places to revive and thrive
• East of England growth priorities• Regional scorecard identifying strengths• 16 sub-regional scorecards
Sponsored by
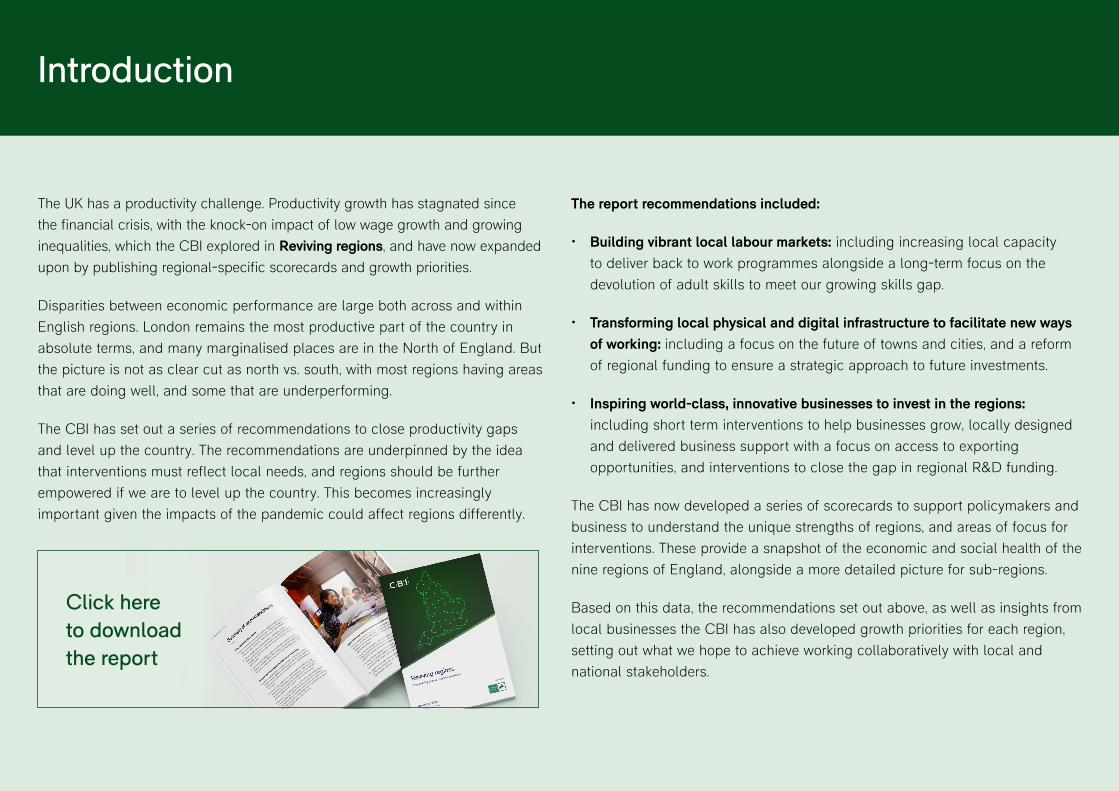
The UK has a productivity challenge. Productivity growth has stagnated since the financial crisis, with the knock-on impact of low wage growth and growing inequalities, which the CBI explored in Reviving regions, and have now expanded upon by publishing regional-specific scorecards and growth priorities.
Disparities between economic performance are large both across and within English regions. London remains the most productive part of the country in absolute terms, and many marginalised places are in the North of England. But the picture is not as clear cut as north vs. south, with most regions having areas that are doing well, and some that are underperforming.
The CBI has set out a series of recommendations to close productivity gaps and level up the country. The recommendations are underpinned by the idea that interventions must reflect local needs, and regions should be further empowered if we are to level up the country. This becomes increasingly important given the impacts of the pandemic could affect regions differently.
The report recommendations included:
• Building vibrant local labour markets: including increasing local capacity to deliver back to work programmes alongside a long-term focus on the devolution of adult skills to meet our growing skills gap.
• Transforming local physical and digital infrastructure to facilitate new ways of working: including a focus on the future of towns and cities, and a reform of regional funding to ensure a strategic approach to future investments.
• Inspiring world-class, innovative businesses to invest in the regions: including short term interventions to help businesses grow, locally designed and delivered business support with a focus on access to exporting opportunities, and interventions to close the gap in regional R&D funding.
The CBI has now developed a series of scorecards to support policymakers and business to understand the unique strengths of regions, and areas of focus for interventions. These provide a snapshot of the economic and social health of the nine regions of England, alongside a more detailed picture for sub-regions.
Based on this data, the recommendations set out above, as well as insights from local businesses the CBI has also developed growth priorities for each region, setting out what we hope to achieve working collaboratively with local and national stakeholders.
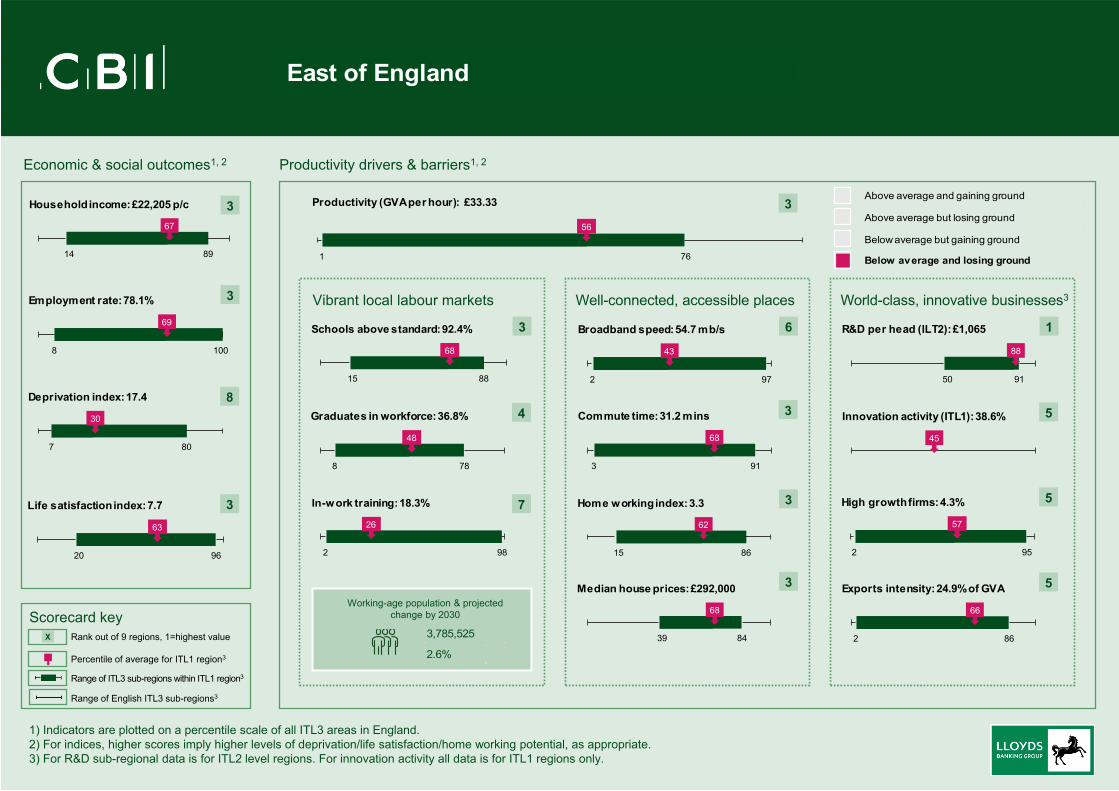
The East of England is ranked third out of nine English regions for productivity (GVA £ per hour), and benefits from proximity to London. It is ranked number one for R&D per head and has strong diversity of higher education. The region plans to expand upon existing offshore wind assets, hydrogen production and storage technologies. Recently two Freeports for Felixstowe and Harwich (Freeport East) and for the Thames have been announced strengthening the region’s role as an international gateway.
Competitive strengths
Renewable energy
Life sciences
Agri-tech/agriculture
Advanced manufacturing
Travel and tourism
Professional and financial services
Regional assets
• Stansted and Luton international airports
• Offshore Renewable Energy Catapult
• Cell & Gene Therapy Catapult
• Adastral Park
• Cambridge Biomedical Campus and a rich R&D ecosystem
The CBI has developed the following growth priorities
• Build vibrant local labour markets by addressing the skills gap, youth unemployment and futureproofing. With a focus on both transferable skills such as digital and management and those needed for clean growth and the green recovery, including for retrofitting and renewable energy generation. With the East increasingly looking to the opportunities presented by the race to net zero, for example hydrogen production, there is a need to ensure the provision of skills at all levels.
• Transform local infrastructure to facilitate new ways of working by developing and improving east to west connectivity. This should include road and rail schemes such as Ely Area Capacity Enhancement, A47 dualling and East West Rail combined with preventing digital exclusion in rural and coastal areas.
• Inspire world-class innovative businesses to invest in the East by encouraging research and development and promoting existing competitive strengths. Local Enterprise Partnerships and the Combined Authority should provide targeted support to facilitate growth and decarbonisation. The Oxford Cambridge Arc is vital, providing a significant opportunity for investment and growth. To be successful the development of the spatial framework must be collaborative and should provide a platform for linking the Arc with the rest of the East for example through the Cambridge Norwich Tech Corridor.
Next steps
The CBI, working alongside local and national leaders, is focused on the implementation of these priorities. To become involved, please contact Helena Coe.
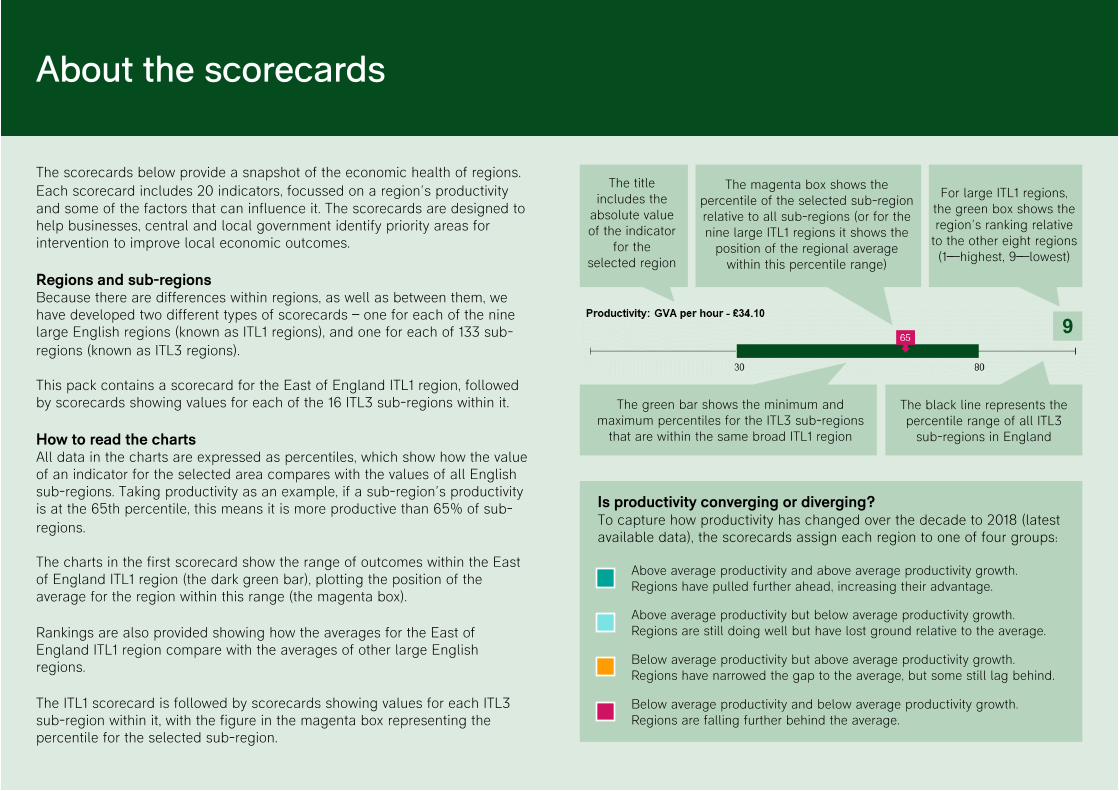
The scorecards below provide a snapshot of the economic health of regions. Each scorecard includes 20 indicators, focussed on a region’s productivity and some of the factors that can influence it. The scorecards are designed to help businesses, central and local government identify priority areas for intervention to improve local economic outcomes.
Regions and sub-regionsBecause there are differences within regions, as well as between them, we have developed two different types of scorecards – one for each of the nine large English regions (known as ITL1 regions), and one for each of 133 sub-regions (known as ITL3 regions).
This pack contains a scorecard for the East of England ITL1 region, followed by scorecards showing values for each of the 16 ITL3 sub-regions within it.
How to read the chartsAll data in the charts are expressed as percentiles, which show how the value of an indicator for the selected area compares with the values of all English sub-regions. Taking productivity as an example, if a sub-region’s productivity is at the 65th percentile, this means it is more productive than 65% of sub-regions.
The charts in the first scorecard show the range of outcomes within the East of England ITL1 region (the dark green bar), plotting the position of the average for the region within this range (the magenta box).
Rankings are also provided showing how the averages for the East of England ITL1 region compare with the averages of other large English regions.
The ITL1 scorecard is followed by scorecards showing values for each ITL3 sub-region within it, with the figure in the magenta box representing the percentile for the selected sub-region.
About the scorecards
The title includes the
absolute value of the indicator
for the selected region
The green bar shows the minimum and maximum percentiles for the ITL3 sub-regions
that are within the same broad ITL1 region
The black line represents the percentile range of all ITL3
sub-regions in England
Above average productivity and above average productivity growth. Regions have pulled further ahead, increasing their advantage.
Above average productivity but below average productivity growth. Regions are still doing well but have lost ground relative to the average.
Below average productivity but above average productivity growth. Regions have narrowed the gap to the average, but some still lag behind.
Below average productivity and below average productivity growth. Regions are falling further behind the average.
For large ITL1 regions, the green box shows the region’s ranking relative
to the other eight regions (1—highest, 9—lowest)
9
Is productivity converging or diverging?To capture how productivity has changed over the decade to 2018 (latest available data), the scorecards assign each region to one of four groups:
The magenta box shows the percentile of the selected sub-region relative to all sub-regions (or for the nine large ITL1 regions it shows the
position of the regional average within this percentile range)
Scorecard key
Economic & social outcomes1, 2 Productivity drivers & barriers1, 2
Percentile of average for ITL1 region3
Range of ITL3 sub-regions within ITL1 region3
Range of English ITL3 sub-regions3
Vibrant local labour markets Well-connected, accessible places World-class, innovative businesses3
Working-age population & projectedchange by 2030
1) Indicators are plotted on a percentile scale of all ITL3 areas in England.2) For indices, higher scores imply higher levels of deprivation/life satisfaction/home working potential, as appropriate. 3) For R&D sub-regional data is for ITL2 level regions. For innovation activity all data is for ITL1 regions only.
X Rank out of 9 regions, 1=highest value 3,785,525
2.6%
76
56
1
Productivity (GVA per hour): £33.33
89
67
14
Household income: £22,205 p/c
100
69
8
Employment rate: 78.1%
80
30
7
Deprivation index: 17.4
96
63
20
Life satisfaction index: 7.7
88
68
15
Schools above standard: 92.4%
78
48
8
Graduates in workforce: 36.8%
98
26
2
In-work training: 18.3%
97
43
2
Broadband speed: 54.7 mb/s
91
68
3
Commute time: 31.2 mins
86
62
15
Home working index: 3.3
84
68
39
Median house prices: £292,000
91
88
50
R&D per head (ILT2): £1,065
45
Innovation activity (ITL1): 38.6%
95
57
2
High growth firms: 4.3%
86
66
2
Exports intensity: 24.9% of GVA
Above average and gaining ground
Above average but losing ground
Below average but gaining ground
Below average and losing ground
East of England
33
3
8
3
3
4
7
6
3
3
3
1
5
5
5
Scorecard key
Economic & social outcomes1, 2 Productivity drivers & barriers1, 2
Percentile of ITL3 sub-region3
Range of ITL3 sub-regions within ITL1 region3
Range of English ITL3 sub-regions3
Vibrant local labour markets Well-connected, accessible places World-class, innovative businesses3
Working-age population & projectedchange by 2030
1) Indicators are plotted on a percentile scale of all ITL3 areas in England.2) For indices, higher scores imply higher levels of deprivation/life satisfaction/home working potential, as appropriate. 3) For R&D sub-regional data and percentiles are for ITL2 level regions. For innovation activity data and percentiles are for ITL1 regions only.
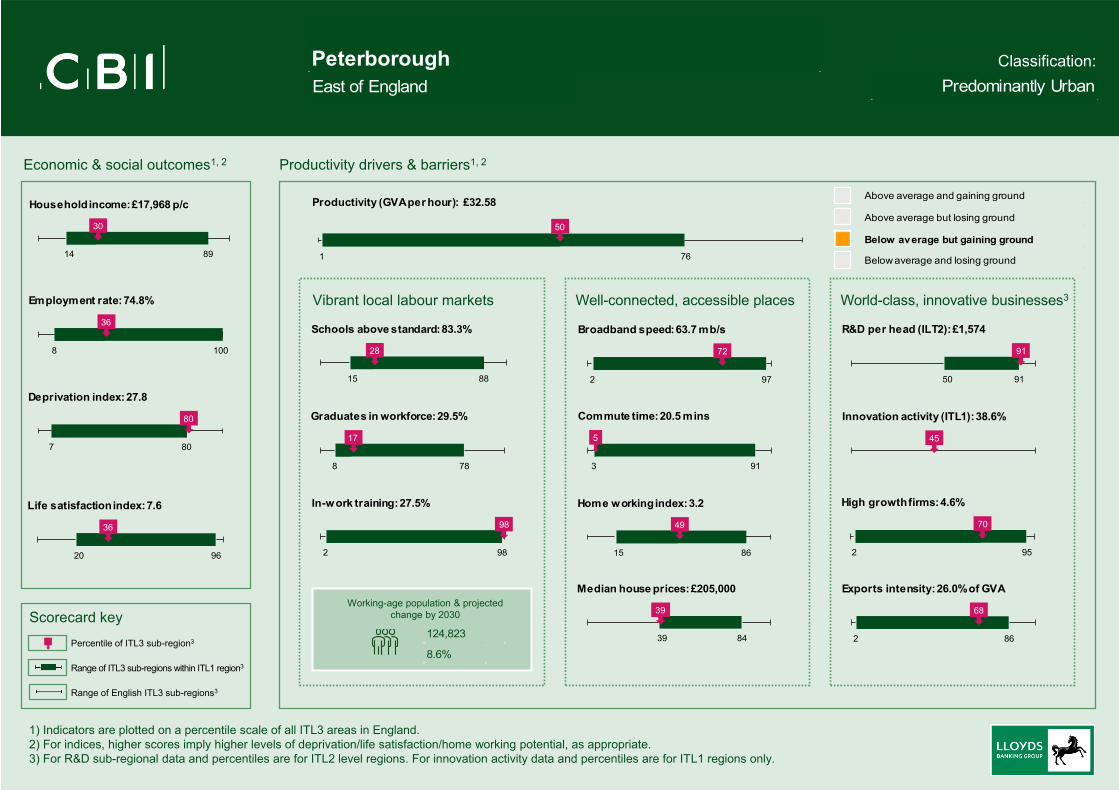
Classification:PeterboroughEast of England Predominantly Urban
124,823
8.6%
76
50
1
Productivity (GVA per hour): £32.58
89
30
14
Household income: £17,968 p/c
100
36
8
Employment rate: 74.8%
80
80
7
Deprivation index: 27.8
96
36
20
Life satisfaction index: 7.6
88
28
15
Schools above standard: 83.3%
78
17
8
Graduates in workforce: 29.5%
98
98
2
In-work training: 27.5%
97
72
2
Broadband speed: 63.7 mb/s
91
5
3
Commute time: 20.5 mins
86
49
15
Home working index: 3.2
84
39
39
Median house prices: £205,000
91
91
50
R&D per head (ILT2): £1,574
45
Innovation activity (ITL1): 38.6%
95
70
2
High growth firms: 4.6%
86
68
2
Exports intensity: 26.0% of GVA
Above average and gaining ground
Above average but losing ground
Below average but gaining ground
Below average and losing ground
Scorecard key
Economic & social outcomes1, 2 Productivity drivers & barriers1, 2
Percentile of ITL3 sub-region3
Range of ITL3 sub-regions within ITL1 region3
Range of English ITL3 sub-regions3
Vibrant local labour markets Well-connected, accessible places World-class, innovative businesses3
Working-age population & projectedchange by 2030
1) Indicators are plotted on a percentile scale of all ITL3 areas in England.2) For indices, higher scores imply higher levels of deprivation/life satisfaction/home working potential, as appropriate. 3) For R&D sub-regional data and percentiles are for ITL2 level regions. For innovation activity data and percentiles are for ITL1 regions only.
Classification:Cambridgeshire CCEast of England Predominantly Rural
405,777
1.4%
76
59
1
Productivity (GVA per hour): £33.61
89
76
14
Household income: £23,413 p/c
100
60
8
Employment rate: 77.2%
80
14
7
Deprivation index: 13.9
96
45
20
Life satisfaction index: 7.6
88
88
15
Schools above standard: 100.0%
78
78
8
Graduates in workforce: 45.7%
98
58
2
In-work training: 20.8%
97
48
2
Broadband speed: 55.3 mb/s
91
65
3
Commute time: 30.9 mins
86
83
15
Home working index: 3.5
84
70
39
Median house prices: £300,000
91
91
50
R&D per head (ILT2): £1,574
45
Innovation activity (ITL1): 38.6%
95
93
2
High growth firms: 5.7%
86
86
2
Exports intensity: 39.4% of GVA
Above average and gaining ground
Above average but losing ground
Below average but gaining ground
Below average and losing ground
Scorecard key
Economic & social outcomes1, 2 Productivity drivers & barriers1, 2
Percentile of ITL3 sub-region3
Range of ITL3 sub-regions within ITL1 region3
Range of English ITL3 sub-regions3
Vibrant local labour markets Well-connected, accessible places World-class, innovative businesses3
Working-age population & projectedchange by 2030
1) Indicators are plotted on a percentile scale of all ITL3 areas in England.2) For indices, higher scores imply higher levels of deprivation/life satisfaction/home working potential, as appropriate. 3) For R&D sub-regional data and percentiles are for ITL2 level regions. For innovation activity data and percentiles are for ITL1 regions only.
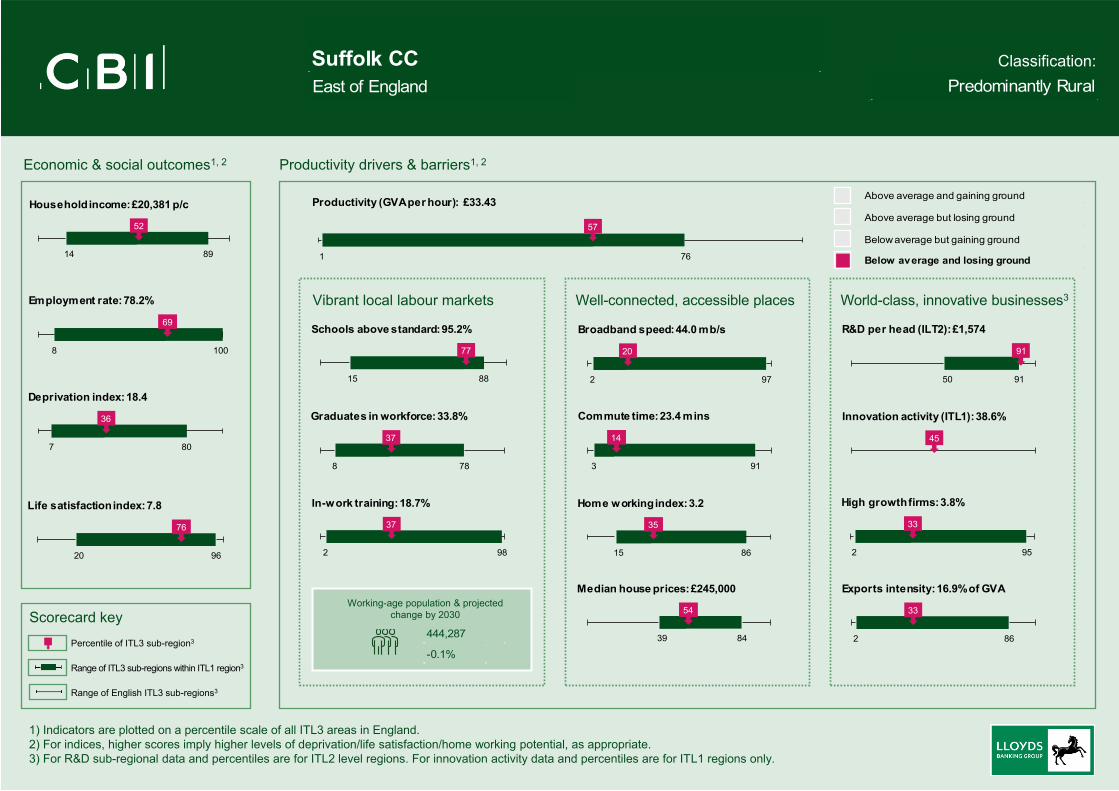
Classification:Suffolk CCEast of England Predominantly Rural
444,287
-0.1%
76
57
1
Productivity (GVA per hour): £33.43
89
52
14
Household income: £20,381 p/c
100
69
8
Employment rate: 78.2%
80
36
7
Deprivation index: 18.4
96
76
20
Life satisfaction index: 7.8
88
77
15
Schools above standard: 95.2%
78
37
8
Graduates in workforce: 33.8%
98
37
2
In-work training: 18.7%
97
20
2
Broadband speed: 44.0 mb/s
91
14
3
Commute time: 23.4 mins
86
35
15
Home working index: 3.2
84
54
39
Median house prices: £245,000
91
91
50
R&D per head (ILT2): £1,574
45
Innovation activity (ITL1): 38.6%
95
33
2
High growth firms: 3.8%
86
33
2
Exports intensity: 16.9% of GVA
Above average and gaining ground
Above average but losing ground
Below average but gaining ground
Below average and losing ground
Scorecard key
Economic & social outcomes1, 2 Productivity drivers & barriers1, 2
Percentile of ITL3 sub-region3
Range of ITL3 sub-regions within ITL1 region3
Range of English ITL3 sub-regions3
Vibrant local labour markets Well-connected, accessible places World-class, innovative businesses3
Working-age population & projectedchange by 2030
1) Indicators are plotted on a percentile scale of all ITL3 areas in England.2) For indices, higher scores imply higher levels of deprivation/life satisfaction/home working potential, as appropriate. 3) For R&D sub-regional data and percentiles are for ITL2 level regions. For innovation activity data and percentiles are for ITL1 regions only.
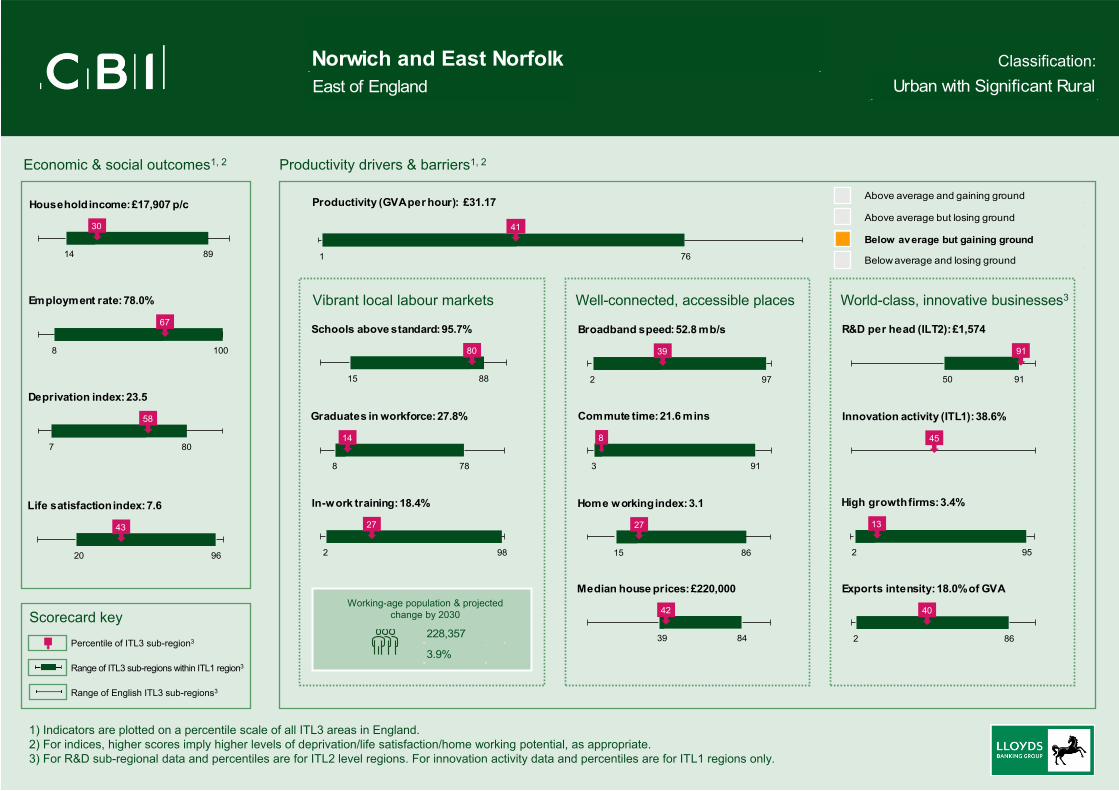
Classification:Norwich and East NorfolkEast of England Urban with Significant Rural
228,357
3.9%
76
41
1
Productivity (GVA per hour): £31.17
89
30
14
Household income: £17,907 p/c
100
67
8
Employment rate: 78.0%
80
58
7
Deprivation index: 23.5
96
43
20
Life satisfaction index: 7.6
88
80
15
Schools above standard: 95.7%
78
14
8
Graduates in workforce: 27.8%
98
27
2
In-work training: 18.4%
97
39
2
Broadband speed: 52.8 mb/s
91
8
3
Commute time: 21.6 mins
86
27
15
Home working index: 3.1
84
42
39
Median house prices: £220,000
91
91
50
R&D per head (ILT2): £1,574
45
Innovation activity (ITL1): 38.6%
95
13
2
High growth firms: 3.4%
86
40
2
Exports intensity: 18.0% of GVA
Above average and gaining ground
Above average but losing ground
Below average but gaining ground
Below average and losing ground
Scorecard key
Economic & social outcomes1, 2 Productivity drivers & barriers1, 2
Percentile of ITL3 sub-region3
Range of ITL3 sub-regions within ITL1 region3
Range of English ITL3 sub-regions3
Vibrant local labour markets Well-connected, accessible places World-class, innovative businesses3
Working-age population & projectedchange by 2030
1) Indicators are plotted on a percentile scale of all ITL3 areas in England.2) For indices, higher scores imply higher levels of deprivation/life satisfaction/home working potential, as appropriate. 3) For R&D sub-regional data and percentiles are for ITL2 level regions. For innovation activity data and percentiles are for ITL1 regions only.
Classification:North and West NorfolkEast of England Predominantly Rural
140,648
-0.1%
76
23
1
Productivity (GVA per hour): £29.40
89
36
14
Household income: £18,961 p/c
100
70
8
Employment rate: 78.3%
80
53
7
Deprivation index: 22.6
96
96
20
Life satisfaction index: 7.9
88
80
15
Schools above standard: 95.7%
78
25
8
Graduates in workforce: 31.6%
98
27
2
In-work training: 18.4%
97
3
2
Broadband speed: 39.5 mb/s
91
3
3
Commute time: 19.6 mins
86
30
15
Home working index: 3.1
84
51
39
Median house prices: £238,000
91
91
50
R&D per head (ILT2): £1,574
45
Innovation activity (ITL1): 38.6%
95
5
2
High growth firms: 2.9%
86
27
2
Exports intensity: 15.6% of GVA
Above average and gaining ground
Above average but losing ground
Below average but gaining ground
Below average and losing ground
Scorecard key
Economic & social outcomes1, 2 Productivity drivers & barriers1, 2
Percentile of ITL3 sub-region3
Range of ITL3 sub-regions within ITL1 region3
Range of English ITL3 sub-regions3
Vibrant local labour markets Well-connected, accessible places World-class, innovative businesses3
Working-age population & projectedchange by 2030
1) Indicators are plotted on a percentile scale of all ITL3 areas in England.2) For indices, higher scores imply higher levels of deprivation/life satisfaction/home working potential, as appropriate. 3) For R&D sub-regional data and percentiles are for ITL2 level regions. For innovation activity data and percentiles are for ITL1 regions only.
Classification:Breckland and South NorfolkEast of England Predominantly Rural
161,981
8.3%
76
25
1
Productivity (GVA per hour): £29.54
89
39
14
Household income: £19,216 p/c
100
67
8
Employment rate: 78.0%
80
23
7
Deprivation index: 16.5
96
84
20
Life satisfaction index: 7.8
88
82
15
Schools above standard: 95.7%
78
20
8
Graduates in workforce: 30.7%
98
27
2
In-work training: 18.4%
97
2
2
Broadband speed: 39.5 mb/s
91
48
3
Commute time: 27.7 mins
86
27
15
Home working index: 3.1
84
52
39
Median house prices: £242,500
91
91
50
R&D per head (ILT2): £1,574
45
Innovation activity (ITL1): 38.6%
95
89
2
High growth firms: 5.5%
86
8
2
Exports intensity: 11.1% of GVA
Above average and gaining ground
Above average but losing ground
Below average but gaining ground
Below average and losing ground
Scorecard key
Economic & social outcomes1, 2 Productivity drivers & barriers1, 2
Percentile of ITL3 sub-region3
Range of ITL3 sub-regions within ITL1 region3
Range of English ITL3 sub-regions3
Vibrant local labour markets Well-connected, accessible places World-class, innovative businesses3
Working-age population & projectedchange by 2030
1) Indicators are plotted on a percentile scale of all ITL3 areas in England.2) For indices, higher scores imply higher levels of deprivation/life satisfaction/home working potential, as appropriate. 3) For R&D sub-regional data and percentiles are for ITL2 level regions. For innovation activity data and percentiles are for ITL1 regions only.
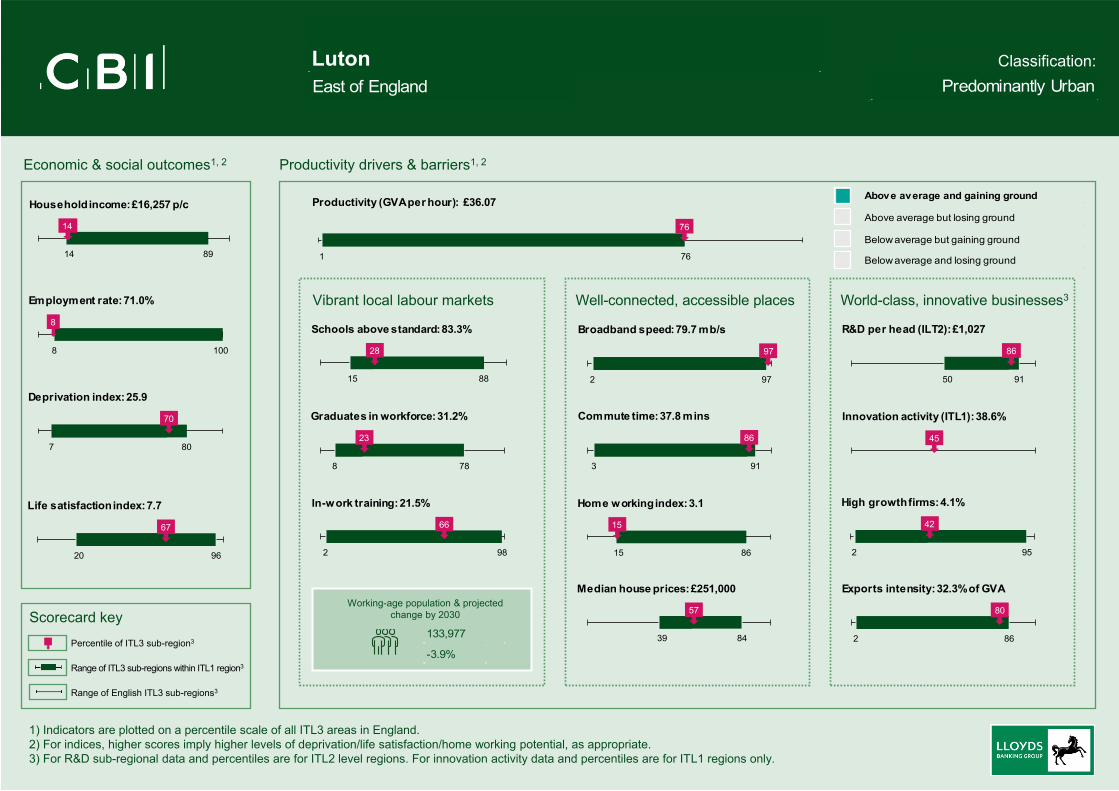
Classification:LutonEast of England Predominantly Urban
133,977
-3.9%
76
76
1
Productivity (GVA per hour): £36.07
89
14
14
Household income: £16,257 p/c
100
8
8
Employment rate: 71.0%
80
70
7
Deprivation index: 25.9
96
67
20
Life satisfaction index: 7.7
88
28
15
Schools above standard: 83.3%
78
23
8
Graduates in workforce: 31.2%
98
66
2
In-work training: 21.5%
97
97
2
Broadband speed: 79.7 mb/s
91
86
3
Commute time: 37.8 mins
86
15
15
Home working index: 3.1
84
57
39
Median house prices: £251,000
91
86
50
R&D per head (ILT2): £1,027
45
Innovation activity (ITL1): 38.6%
95
42
2
High growth firms: 4.1%
86
80
2
Exports intensity: 32.3% of GVA
Above average and gaining ground
Above average but losing ground
Below average but gaining ground
Below average and losing ground
Scorecard key
Economic & social outcomes1, 2 Productivity drivers & barriers1, 2
Percentile of ITL3 sub-region3
Range of ITL3 sub-regions within ITL1 region3
Range of English ITL3 sub-regions3
Vibrant local labour markets Well-connected, accessible places World-class, innovative businesses3
Working-age population & projectedchange by 2030
1) Indicators are plotted on a percentile scale of all ITL3 areas in England.2) For indices, higher scores imply higher levels of deprivation/life satisfaction/home working potential, as appropriate. 3) For R&D sub-regional data and percentiles are for ITL2 level regions. For innovation activity data and percentiles are for ITL1 regions only.
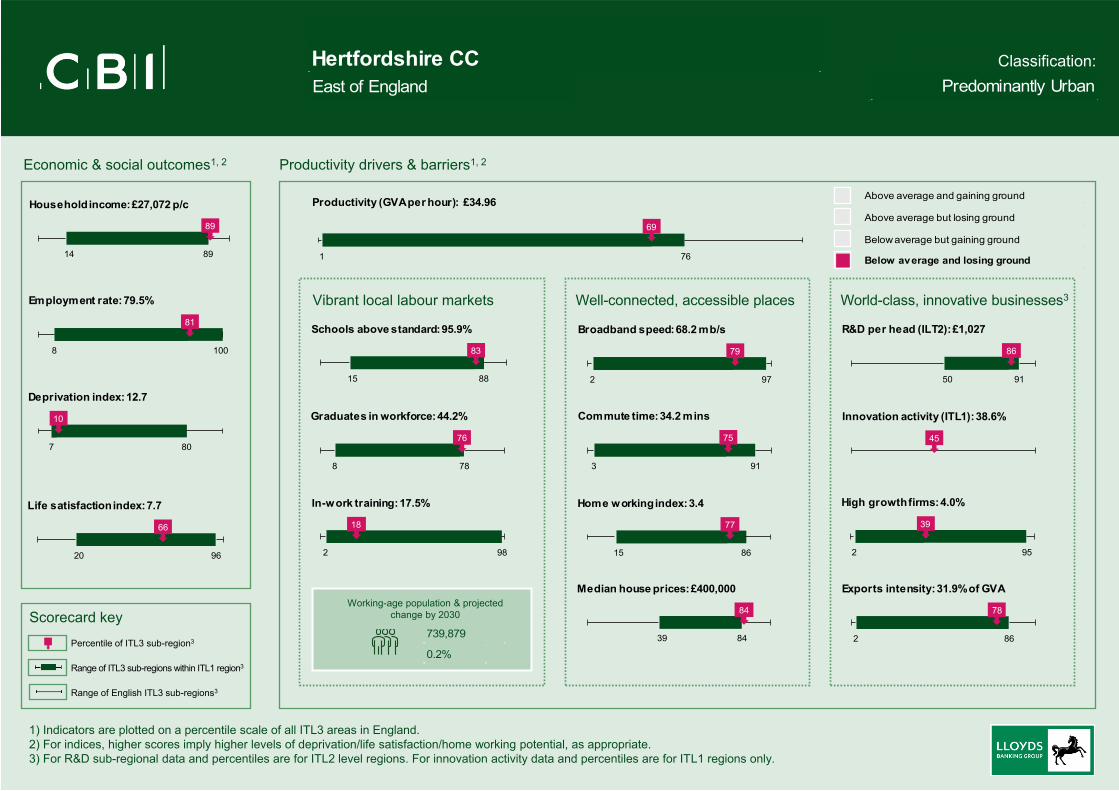
Classification:Hertfordshire CCEast of England Predominantly Urban
739,879
0.2%
76
69
1
Productivity (GVA per hour): £34.96
89
89
14
Household income: £27,072 p/c
100
81
8
Employment rate: 79.5%
80
10
7
Deprivation index: 12.7
96
66
20
Life satisfaction index: 7.7
88
83
15
Schools above standard: 95.9%
78
76
8
Graduates in workforce: 44.2%
98
18
2
In-work training: 17.5%
97
79
2
Broadband speed: 68.2 mb/s
91
75
3
Commute time: 34.2 mins
86
77
15
Home working index: 3.4
84
84
39
Median house prices: £400,000
91
86
50
R&D per head (ILT2): £1,027
45
Innovation activity (ITL1): 38.6%
95
39
2
High growth firms: 4.0%
86
78
2
Exports intensity: 31.9% of GVA
Above average and gaining ground
Above average but losing ground
Below average but gaining ground
Below average and losing ground
Scorecard key
Economic & social outcomes1, 2 Productivity drivers & barriers1, 2
Percentile of ITL3 sub-region3
Range of ITL3 sub-regions within ITL1 region3
Range of English ITL3 sub-regions3
Vibrant local labour markets Well-connected, accessible places World-class, innovative businesses3
Working-age population & projectedchange by 2030
1) Indicators are plotted on a percentile scale of all ITL3 areas in England.2) For indices, higher scores imply higher levels of deprivation/life satisfaction/home working potential, as appropriate. 3) For R&D sub-regional data and percentiles are for ITL2 level regions. For innovation activity data and percentiles are for ITL1 regions only.
Classification:BedfordEast of England Urban with Significant Rural
105,832
4.4%
76
40
1
Productivity (GVA per hour): £30.94
89
66
14
Household income: £21,986 p/c
100
100
8
Employment rate: 85.2%
80
39
7
Deprivation index: 18.9
96
82
20
Life satisfaction index: 7.8
88
88
15
Schools above standard: 100.0%
78
78
8
Graduates in workforce: 45.7%
98
9
2
In-work training: 16.5%
97
80
2
Broadband speed: 70.2 mb/s
91
64
3
Commute time: 30.7 mins
86
86
15
Home working index: 3.5
84
64
39
Median house prices: £281,625
91
86
50
R&D per head (ILT2): £1,027
45
Innovation activity (ITL1): 38.6%
95
87
2
High growth firms: 5.3%
86
2
2
Exports intensity: 8.5% of GVA
Above average and gaining ground
Above average but losing ground
Below average but gaining ground
Below average and losing ground
Scorecard key
Economic & social outcomes1, 2 Productivity drivers & barriers1, 2
Percentile of ITL3 sub-region3
Range of ITL3 sub-regions within ITL1 region3
Range of English ITL3 sub-regions3
Vibrant local labour markets Well-connected, accessible places World-class, innovative businesses3
Working-age population & projectedchange by 2030
1) Indicators are plotted on a percentile scale of all ITL3 areas in England.2) For indices, higher scores imply higher levels of deprivation/life satisfaction/home working potential, as appropriate. 3) For R&D sub-regional data and percentiles are for ITL2 level regions. For innovation activity data and percentiles are for ITL1 regions only.
Classification:Central BedfordshireEast of England Predominantly Rural
179,400
4.5%
76
68
1
Productivity (GVA per hour): £34.93
89
67
14
Household income: £22,037 p/c
100
96
8
Employment rate: 82.2%
80
8
7
Deprivation index: 12.2
96
87
20
Life satisfaction index: 7.8
88
28
15
Schools above standard: 83.3%
78
67
8
Graduates in workforce: 42.2%
98
2
2
In-work training: 15.4%
97
46
2
Broadband speed: 55.0 mb/s
91
71
3
Commute time: 32.5 mins
86
61
15
Home working index: 3.3
84
73
39
Median house prices: £312,000
91
86
50
R&D per head (ILT2): £1,027
45
Innovation activity (ITL1): 38.6%
95
37
2
High growth firms: 3.9%
86
61
2
Exports intensity: 23.5% of GVA
Above average and gaining ground
Above average but losing ground
Below average but gaining ground
Below average and losing ground
Scorecard key
Economic & social outcomes1, 2 Productivity drivers & barriers1, 2
Percentile of ITL3 sub-region3
Range of ITL3 sub-regions within ITL1 region3
Range of English ITL3 sub-regions3
Vibrant local labour markets Well-connected, accessible places World-class, innovative businesses3
Working-age population & projectedchange by 2030
1) Indicators are plotted on a percentile scale of all ITL3 areas in England.2) For indices, higher scores imply higher levels of deprivation/life satisfaction/home working potential, as appropriate. 3) For R&D sub-regional data and percentiles are for ITL2 level regions. For innovation activity data and percentiles are for ITL1 regions only.
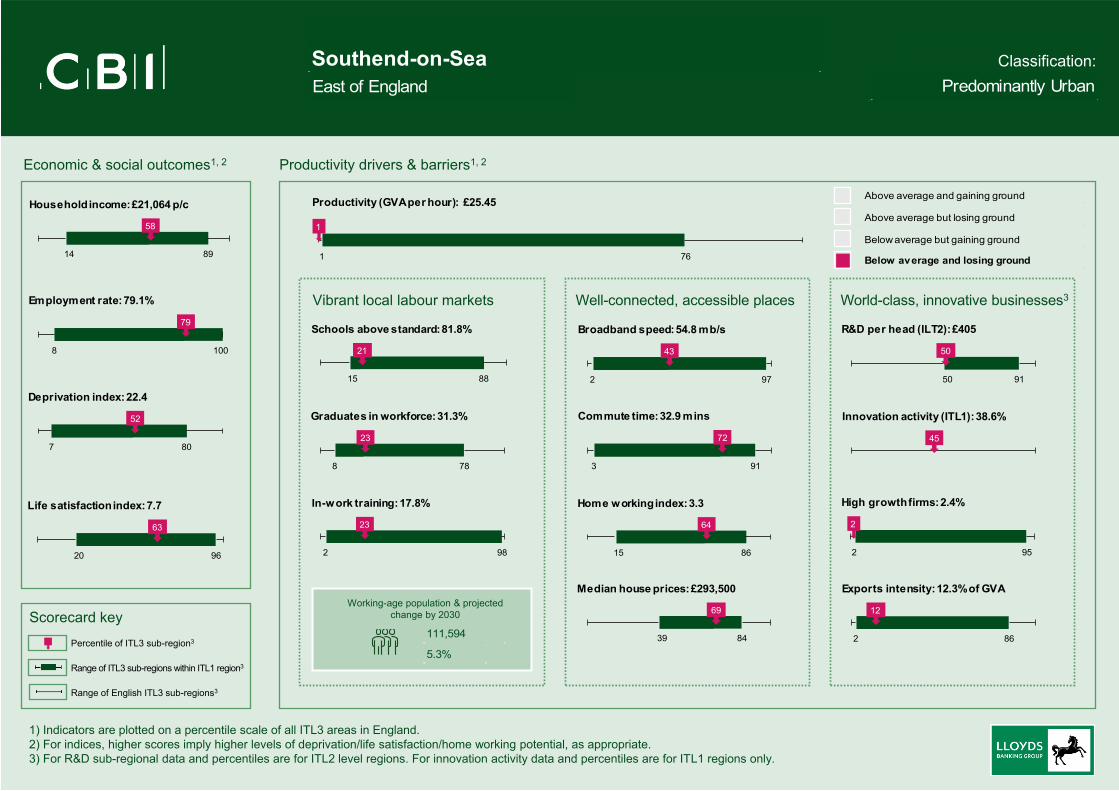
Classification:Southend-on-SeaEast of England Predominantly Urban
111,594
5.3%
76
1
1
Productivity (GVA per hour): £25.45
89
58
14
Household income: £21,064 p/c
100
79
8
Employment rate: 79.1%
80
52
7
Deprivation index: 22.4
96
63
20
Life satisfaction index: 7.7
88
21
15
Schools above standard: 81.8%
78
23
8
Graduates in workforce: 31.3%
98
23
2
In-work training: 17.8%
97
43
2
Broadband speed: 54.8 mb/s
91
72
3
Commute time: 32.9 mins
86
64
15
Home working index: 3.3
84
69
39
Median house prices: £293,500
91
50
50
R&D per head (ILT2): £405
45
Innovation activity (ITL1): 38.6%
95
2
2
High growth firms: 2.4%
86
12
2
Exports intensity: 12.3% of GVA
Above average and gaining ground
Above average but losing ground
Below average but gaining ground
Below average and losing ground
Scorecard key
Economic & social outcomes1, 2 Productivity drivers & barriers1, 2
Percentile of ITL3 sub-region3
Range of ITL3 sub-regions within ITL1 region3
Range of English ITL3 sub-regions3
Vibrant local labour markets Well-connected, accessible places World-class, innovative businesses3
Working-age population & projectedchange by 2030
1) Indicators are plotted on a percentile scale of all ITL3 areas in England.2) For indices, higher scores imply higher levels of deprivation/life satisfaction/home working potential, as appropriate. 3) For R&D sub-regional data and percentiles are for ITL2 level regions. For innovation activity data and percentiles are for ITL1 regions only.
Classification:ThurrockEast of England Predominantly Urban
109,614
10.6%
76
64
1
Productivity (GVA per hour): £34.18
89
37
14
Household income: £18,976 p/c
100
42
8
Employment rate: 75.4%
80
48
7
Deprivation index: 20.9
96
25
20
Life satisfaction index: 7.6
88
15
15
Schools above standard: 80.0%
78
15
8
Graduates in workforce: 28.6%
98
65
2
In-work training: 21.3%
97
55
2
Broadband speed: 57.9 mb/s
91
82
3
Commute time: 36.0 mins
86
28
15
Home working index: 3.1
84
67
39
Median house prices: £290,000
91
50
50
R&D per head (ILT2): £405
45
Innovation activity (ITL1): 38.6%
95
30
2
High growth firms: 3.8%
86
20
2
Exports intensity: 14.8% of GVA
Above average and gaining ground
Above average but losing ground
Below average but gaining ground
Below average and losing ground
Scorecard key
Economic & social outcomes1, 2 Productivity drivers & barriers1, 2
Percentile of ITL3 sub-region3
Range of ITL3 sub-regions within ITL1 region3
Range of English ITL3 sub-regions3
Vibrant local labour markets Well-connected, accessible places World-class, innovative businesses3
Working-age population & projectedchange by 2030
1) Indicators are plotted on a percentile scale of all ITL3 areas in England.2) For indices, higher scores imply higher levels of deprivation/life satisfaction/home working potential, as appropriate. 3) For R&D sub-regional data and percentiles are for ITL2 level regions. For innovation activity data and percentiles are for ITL1 regions only.
Classification:Essex Haven GatewayEast of England Predominantly Rural
295,457
5.1%
76
38
1
Productivity (GVA per hour): £30.52
89
48
14
Household income: £20,196 p/c
100
42
8
Employment rate: 75.4%
80
44
7
Deprivation index: 20.2
96
20
20
Life satisfaction index: 7.5
88
51
15
Schools above standard: 89.0%
78
33
8
Graduates in workforce: 33.1%
98
33
2
In-work training: 18.7%
97
22
2
Broadband speed: 44.6 mb/s
91
70
3
Commute time: 32.2 mins
86
32
15
Home working index: 3.2
84
60
39
Median house prices: £265,000
91
50
50
R&D per head (ILT2): £405
45
Innovation activity (ITL1): 38.6%
95
31
2
High growth firms: 3.8%
86
8
2
Exports intensity: 11.6% of GVA
Above average and gaining ground
Above average but losing ground
Below average but gaining ground
Below average and losing ground
Scorecard key
Economic & social outcomes1, 2 Productivity drivers & barriers1, 2
Percentile of ITL3 sub-region3
Range of ITL3 sub-regions within ITL1 region3
Range of English ITL3 sub-regions3
Vibrant local labour markets Well-connected, accessible places World-class, innovative businesses3
Working-age population & projectedchange by 2030
1) Indicators are plotted on a percentile scale of all ITL3 areas in England.2) For indices, higher scores imply higher levels of deprivation/life satisfaction/home working potential, as appropriate. 3) For R&D sub-regional data and percentiles are for ITL2 level regions. For innovation activity data and percentiles are for ITL1 regions only.
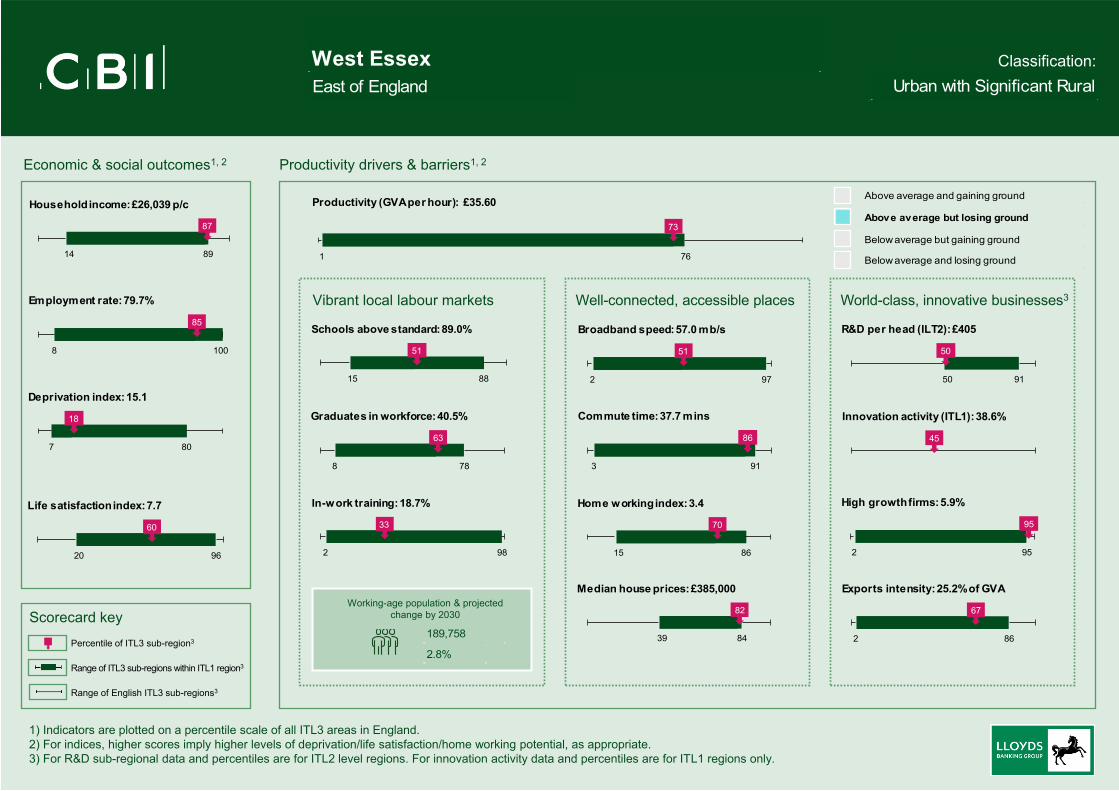
Classification:West EssexEast of England Urban with Significant Rural
189,758
2.8%
76
73
1
Productivity (GVA per hour): £35.60
89
87
14
Household income: £26,039 p/c
100
85
8
Employment rate: 79.7%
80
18
7
Deprivation index: 15.1
96
60
20
Life satisfaction index: 7.7
88
51
15
Schools above standard: 89.0%
78
63
8
Graduates in workforce: 40.5%
98
33
2
In-work training: 18.7%
97
51
2
Broadband speed: 57.0 mb/s
91
86
3
Commute time: 37.7 mins
86
70
15
Home working index: 3.4
84
82
39
Median house prices: £385,000
91
50
50
R&D per head (ILT2): £405
45
Innovation activity (ITL1): 38.6%
95
95
2
High growth firms: 5.9%
86
67
2
Exports intensity: 25.2% of GVA
Above average and gaining ground
Above average but losing ground
Below average but gaining ground
Below average and losing ground
Scorecard key
Economic & social outcomes1, 2 Productivity drivers & barriers1, 2
Percentile of ITL3 sub-region3
Range of ITL3 sub-regions within ITL1 region3
Range of English ITL3 sub-regions3
Vibrant local labour markets Well-connected, accessible places World-class, innovative businesses3
Working-age population & projectedchange by 2030
1) Indicators are plotted on a percentile scale of all ITL3 areas in England.2) For indices, higher scores imply higher levels of deprivation/life satisfaction/home working potential, as appropriate. 3) For R&D sub-regional data and percentiles are for ITL2 level regions. For innovation activity data and percentiles are for ITL1 regions only.
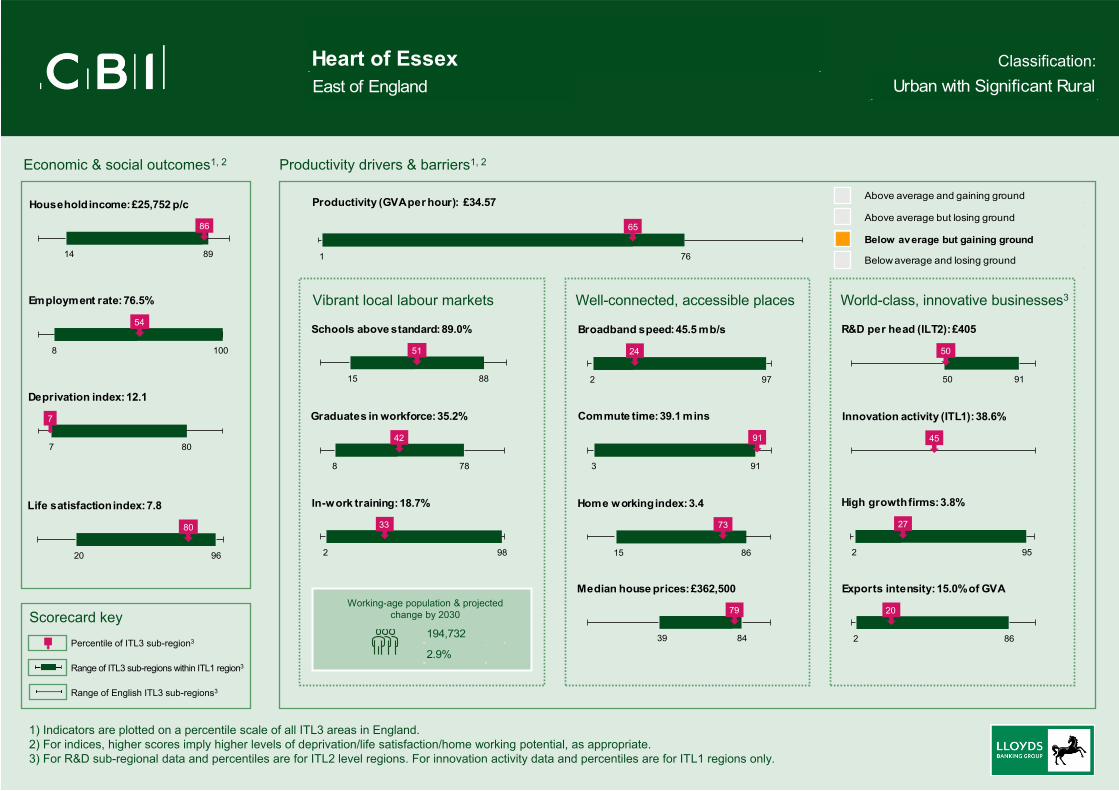
Classification:Heart of EssexEast of England Urban with Significant Rural
194,732
2.9%
76
65
1
Productivity (GVA per hour): £34.57
89
86
14
Household income: £25,752 p/c
100
54
8
Employment rate: 76.5%
80
7
7
Deprivation index: 12.1
96
80
20
Life satisfaction index: 7.8
88
51
15
Schools above standard: 89.0%
78
42
8
Graduates in workforce: 35.2%
98
33
2
In-work training: 18.7%
97
24
2
Broadband speed: 45.5 mb/s
91
91
3
Commute time: 39.1 mins
86
73
15
Home working index: 3.4
84
79
39
Median house prices: £362,500
91
50
50
R&D per head (ILT2): £405
45
Innovation activity (ITL1): 38.6%
95
27
2
High growth firms: 3.8%
86
20
2
Exports intensity: 15.0% of GVA
Above average and gaining ground
Above average but losing ground
Below average but gaining ground
Below average and losing ground
Scorecard key
Economic & social outcomes1, 2 Productivity drivers & barriers1, 2
Percentile of ITL3 sub-region3
Range of ITL3 sub-regions within ITL1 region3
Range of English ITL3 sub-regions3
Vibrant local labour markets Well-connected, accessible places World-class, innovative businesses3
Working-age population & projectedchange by 2030
1) Indicators are plotted on a percentile scale of all ITL3 areas in England.2) For indices, higher scores imply higher levels of deprivation/life satisfaction/home working potential, as appropriate. 3) For R&D sub-regional data and percentiles are for ITL2 level regions. For innovation activity data and percentiles are for ITL1 regions only.
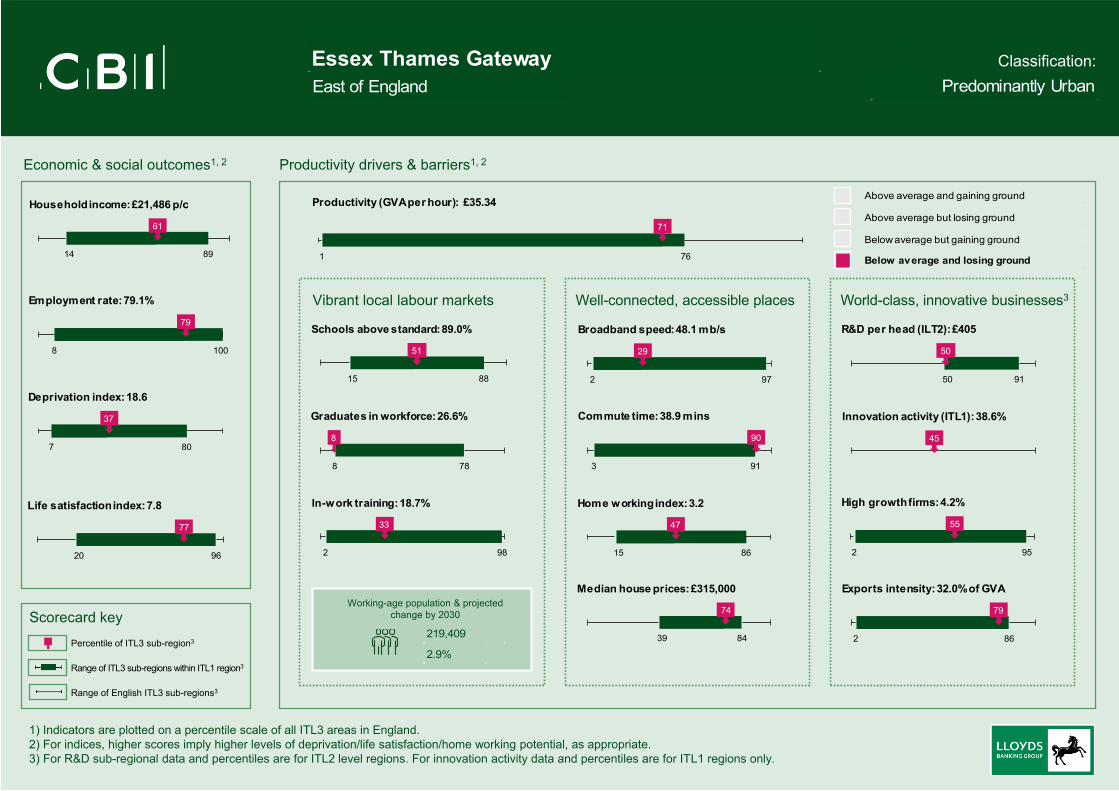
Classification:Essex Thames GatewayEast of England Predominantly Urban
219,409
2.9%
76
71
1
Productivity (GVA per hour): £35.34
89
61
14
Household income: £21,486 p/c
100
79
8
Employment rate: 79.1%
80
37
7
Deprivation index: 18.6
96
77
20
Life satisfaction index: 7.8
88
51
15
Schools above standard: 89.0%
78
8
8
Graduates in workforce: 26.6%
98
33
2
In-work training: 18.7%
97
29
2
Broadband speed: 48.1 mb/s
91
90
3
Commute time: 38.9 mins
86
47
15
Home working index: 3.2
84
74
39
Median house prices: £315,000
91
50
50
R&D per head (ILT2): £405
45
Innovation activity (ITL1): 38.6%
95
55
2
High growth firms: 4.2%
86
79
2
Exports intensity: 32.0% of GVA
Above average and gaining ground
Above average but losing ground
Below average but gaining ground
Below average and losing ground
Notes and sources
Regions & classifications
Units of analysisThe geographic areas for much of our analysis are defined by the International Territorial Levels (ITLs), which were introduced in 2021 as a successor to the EU’s Nomenclature of Units for Territorial Statistics (NUTS) classifications. There are two different types of scorecards:
• ITL1 regions: Nine major English regions, with an average population of 6.3m, ranging from a minimum of 2.7m (North East) to 9.2m (South East).
• ITL3 regions: 133 smaller regions with an average population of 423k, ranging from a minimum of 106k (Darlington) to a maximum of 1.2m (Hertfordshire).
In all but two cases the ITL3 and the old NUTS3 boundaries are aligned. The exceptions are “Bournemouth and Poole” and “Dorset CC”, which under ITLs are classified as “Bournemouth, Christchurch and Poole”, and “Dorset”. Where possible we have created ITL data for these two sub-regions using Local Authority District (LAD) data.
Rural-urban classificationRegion is defined as: Predominantly Rural if the rural population share is greater than or equal to 50%; Urban With Significant Rural if the rural population share is 26%-49%; Predominantly Urban if the rural population share is less than or equal to 25%. ONS 2011 Census data. Percentiles are based on ITL regions, mapped from NUTS3 and LAD data.
Economic & social outcomes
Household income – £ per personGross disposable household income per capita. Current basic prices. ONS 2018 data. Percentiles are based on ITL regions, mapped from NUTS3 and LAD data.
Employment rate – %Employment rate for 16-64 year-old residents. ONS data for October 2019 to September 2020. Percentiles are based on ITL regions, mapped from NUTS3 and LAD data.
Deprivation indexIndex of Multiple Deprivation Average Score, where the larger the score, the more deprived the area. Ministry of Housing, Communities & Local Government data for 2019. Scores derived from LAD values, weighted by population. Percentiles are based on ITL regions, mapped from NUTS3 and LAD data.
Life satisfaction indexAverage rating, ranging from 0 to 10, where 10 implies complete satisfaction. ONS data for 2019/20. Data derived from LAD values, weighted by population. Percentiles based on NUTS regions, mapped from LAD data.
Productivity
Productivity – GVA per hour worked, £Gross value added per hour worked in £, nominal (smoothed). ONS 2018 data. Percentiles are based on ITL regions, mapped from NUTS3 and LAD data.
Productivity – convergence/divergence taxonomyThe level of productivity is defined by gross value added per hour in £, nominal (smoothed). ONS 2018 data. Productivity growth is annual average % change in real value added per hour over 2009-18. NUTS regions. The methodology is based on an approach used in “UK Regional Productivity Differences: An Evidence Review”, Industry Strategy Council.
Notes and sources
Vibrant Local Labour Markets
Schools above standard – % Percentage of schools categorised as above floor standard. Department for Education 2017/18 data. Values derived from Local Education Authority (LEA) data. Where the LEA encompasses more than one ITL3 region, the value for the LEA is used for all relevant sub-regions.
Graduates in workforce – %Percentage of 16-64 year-old population with NVQ4+. ONS data for 2019. Percentiles are based on ITL regions, mapped from NUTS3 and LAD data.
In-work training – %Percentage of firms offering management training. Data from Department for Education, Employers Skills Survey 2019. Values derived from LEA data. Where the LEA corresponds to more than one ITL3 region, the value for the LEA is used for all relevant sub-regions.
Working-age populationNumber of people aged 16-64. ONS data for 2019. Projected % change, 2019-2030. Percentiles are based on ITL regions, mapped from NUTS3 and LAD data.
Well-Connected Places
Broadband Speed – mb/sMedian download speed in megabits per second. Ofcom data for 2020. Values are derived from LAD data, weighted by population. Percentiles are based on ITL regions, mapped from LAD data.
Commute times – minutesUsual home to work travel time in minutes. Figures provided by ONS. 2019 data. Percentiles based on NUTS regions.
Home working indexCBI index of ability to home work, with scores ranging from 0 to 5, where 5 implies the ability for all tasks to be carried out remotely. Calculated from ONS “Which jobs can be done from home?” (derived from US LaborDepartment) and ONS Annual Population Survey on occupational employment by NUTS3, 2018 data. Percentiles based on NUTS regions.
Median house prices – £Median price paid (all house types). ONS data for year ending September 2020. Percentiles based on NUTS regions.
World-class, innovative businesses
R&D per head – £Gross domestic R&D expenditure (GERD), £ per inhabitant. Eurostat data for 2018. Data are only available at NUTS1 and NUTS2 levels, therefore each NUTS3 sub-region takes the value of the larger NUTS2 region of which it is a part. Percentiles are based on NUTS2 regions.
Innovation activity – %Percentage of businesses that are classified as innovation active. Data from BEIS, UK Innovation Survey for 2016-18. Data are only available at NUTS1 level, therefore each NUTS3 sub-region takes the value of the larger NUTS1 region of which it is a part. Percentiles also based on NUTS1 regions.
High Growth Firms – %Percentage of businesses that are classified as “high growth”. ONS data for 2019. Percentiles are based on ITL regions, mapped from LAD data.
Exporting intensity – % of GVAExports of goods and services as a % of gross value added. Data derived from HMRC and ONS. Percentiles based on NUTS regions.